broadcast & enterprise connectivity solutions
TRANSCRIPT
Broadcast & Enterprise Connectivity SolutionsDenis Suggs
© 2012 Belden Inc. | www.Belden.com | @BeldenInc | Page 3© 2012 Belden Inc. | www.Belden.com | @BeldenInc | Page 3
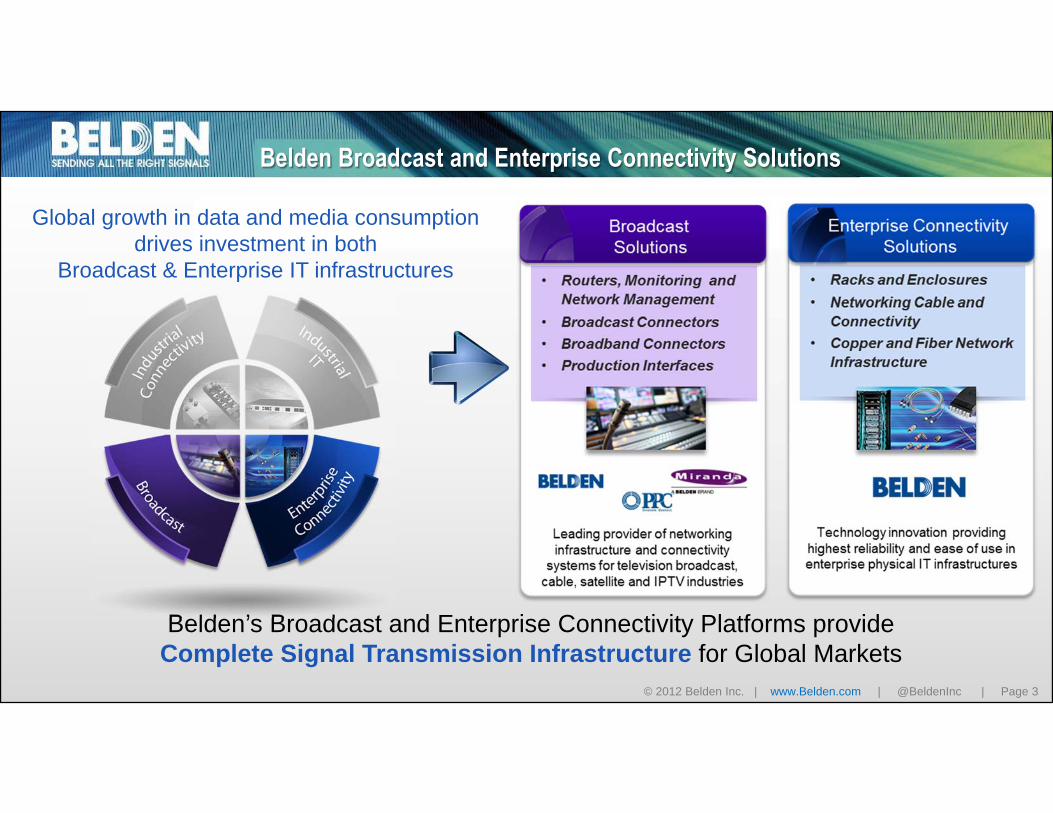
Belden Broadcast and Enterprise Connectivity Solutions
Global growth in data and media consumption drives investment in both
Broadcast & Enterprise IT infrastructures
Belden’s Broadcast and Enterprise Connectivity Platforms provide Complete Signal Transmission Infrastructure for Global Markets

© 2012 Belden Inc. | www.Belden.com | @BeldenInc | Page 4© 2012 Belden Inc. | www.Belden.com | @BeldenInc | Page 4
Broadcast Solutions
1. Estimated 2012 results. Thermax and Raydex not shown.
IndustrialConnectivity Solutions
Industrial ITSolutions
Enterprise Connectivity Solutions
Revenue ≈ $640M1 | Gross Margins ≈ 24-26% | Operating Profit Margins ≈ 8-10%
Enterprise Connectivity Solutions
© 2012 Belden Inc. | www.Belden.com | @BeldenInc | Page 5© 2012 Belden Inc. | www.Belden.com | @BeldenInc | Page 5
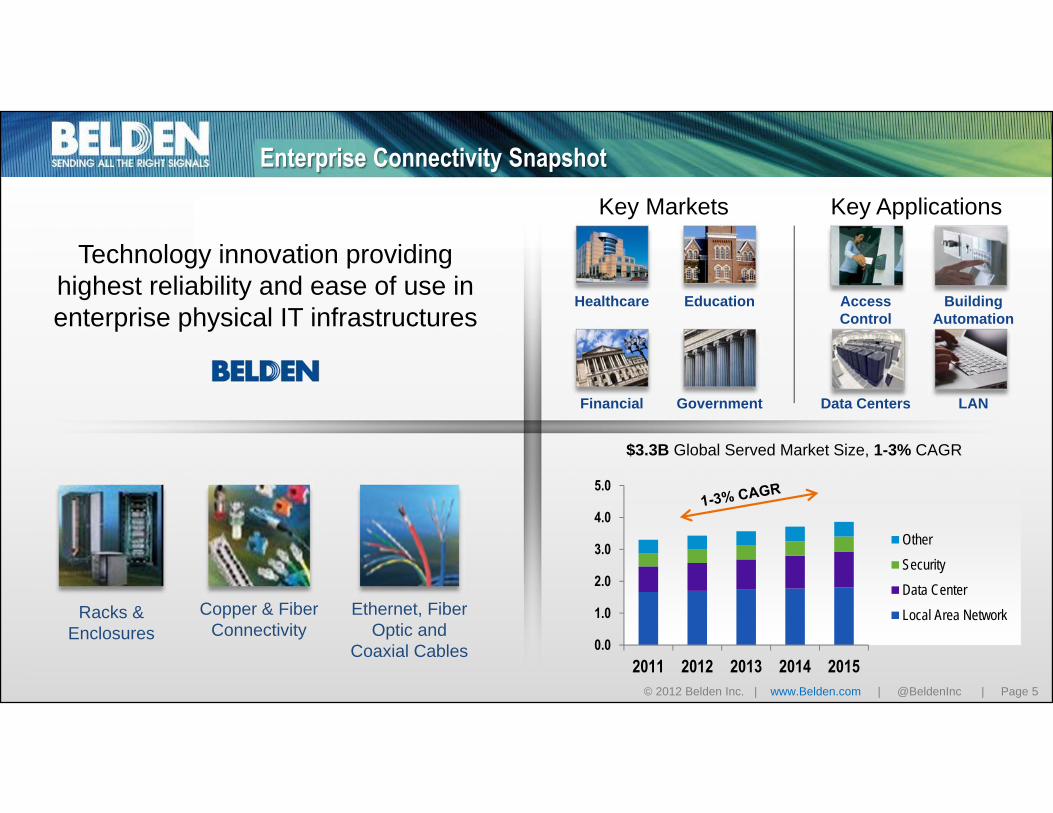
Enterprise Connectivity Snapshot
Technology innovation providing highest reliability and ease of use in enterprise physical IT infrastructures
$3.3B Global Served Market Size, 1-3% CAGR
Ethernet, Fiber Optic and
Coaxial Cables
Copper & Fiber Connectivity
Racks & Enclosures
Key Markets Key Applications
Healthcare
Government
Education
Financial
Access Control
LAN
Building Automation
Data Centers
0.0
1.0
2.0
3.0
4.0
5.0
2011 2012 2013 2014 2015
OtherSecurityData CenterLocal Area Network

© 2012 Belden Inc. | www.Belden.com | @BeldenInc | Page 6© 2012 Belden Inc. | www.Belden.com | @BeldenInc | Page 6
Enterprise Connectivity Market Drivers
Customers demand reliable transmission of data intensive streaming video, which requires high bandwidth and high performance IT infrastructure
2007 2012
DVD only service
20 million visitors per month
23 million streaming video
subscribers
800 million visitors watching 4 billion hours each month

© 2012 Belden Inc. | www.Belden.com | @BeldenInc | Page 7© 2012 Belden Inc. | www.Belden.com | @BeldenInc | Page 7
Enterprise Connectivity Market DriversGrowth in data consumption is occurring across all access types
Growth in both wired and wireless data access requires an underlying IT infrastructure to service the demand
Mobile Access92% CAGR
Fixed / WiFi Access39% CAGR
Fixed / Wired Access24% CAGR
in data consumption through 2015

© 2012 Belden Inc. | www.Belden.com | @BeldenInc | Page 8© 2012 Belden Inc. | www.Belden.com | @BeldenInc | Page 8
Enterprise Connectivity Market DriversConsumption of data accelerating fastest in emerging markets
Belden’s global reach and relationships are positioned to convert this Enterprise Connectivity market growth into revenue
Latin America IP traffic will grow at 49% CAGR
Asia Pacific data consumption will reach
41.1 exabytes per month
By 2016,Middle East and Africa IP
traffic will grow at 57% CAGR
© 2012 Belden Inc. | www.Belden.com | @BeldenInc | Page 9© 2012 Belden Inc. | www.Belden.com | @BeldenInc | Page 9
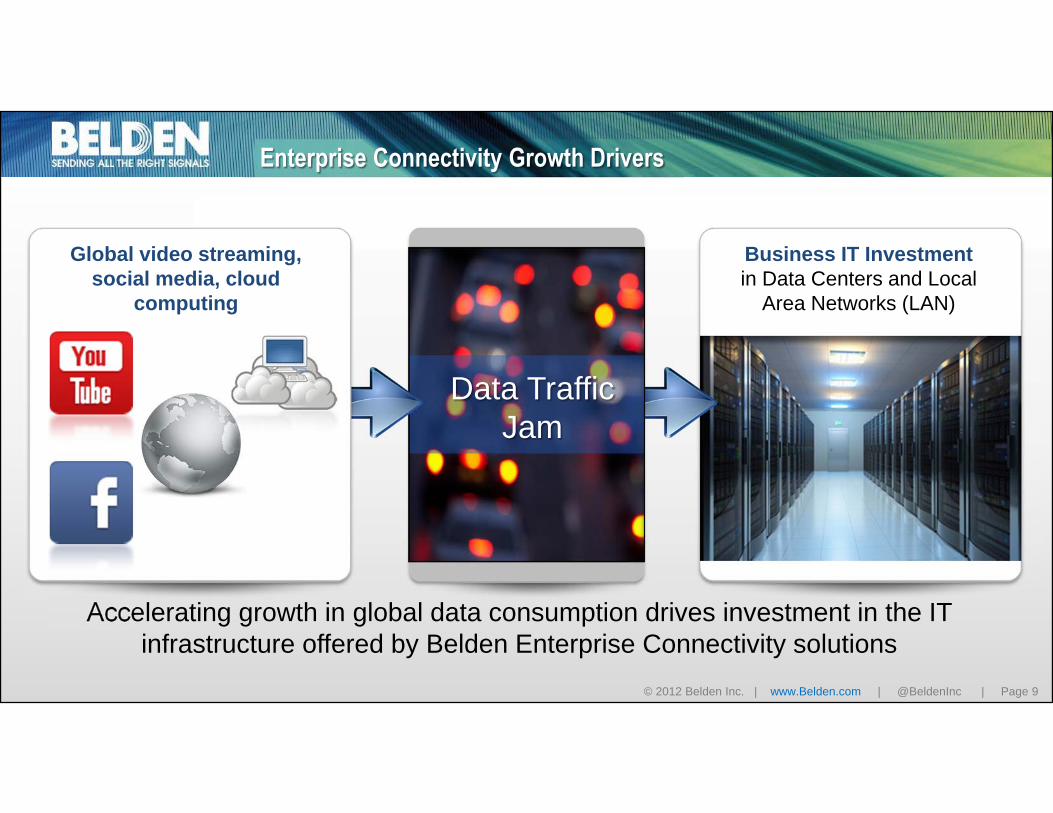
Enterprise Connectivity Growth Drivers
Accelerating growth in global data consumption drives investment in the IT infrastructure offered by Belden Enterprise Connectivity solutions
Business IT Investment in Data Centers and Local
Area Networks (LAN)
Data Traffic Jam
Global video streaming, social media, cloud
computing
© 2012 Belden Inc. | www.Belden.com | @BeldenInc | Page 10© 2012 Belden Inc. | www.Belden.com | @BeldenInc | Page 10
Enterprise Connectivity Growth Drivers
0.00.20.40.60.81.01.21.4
2008 2009 2010 2011 2012
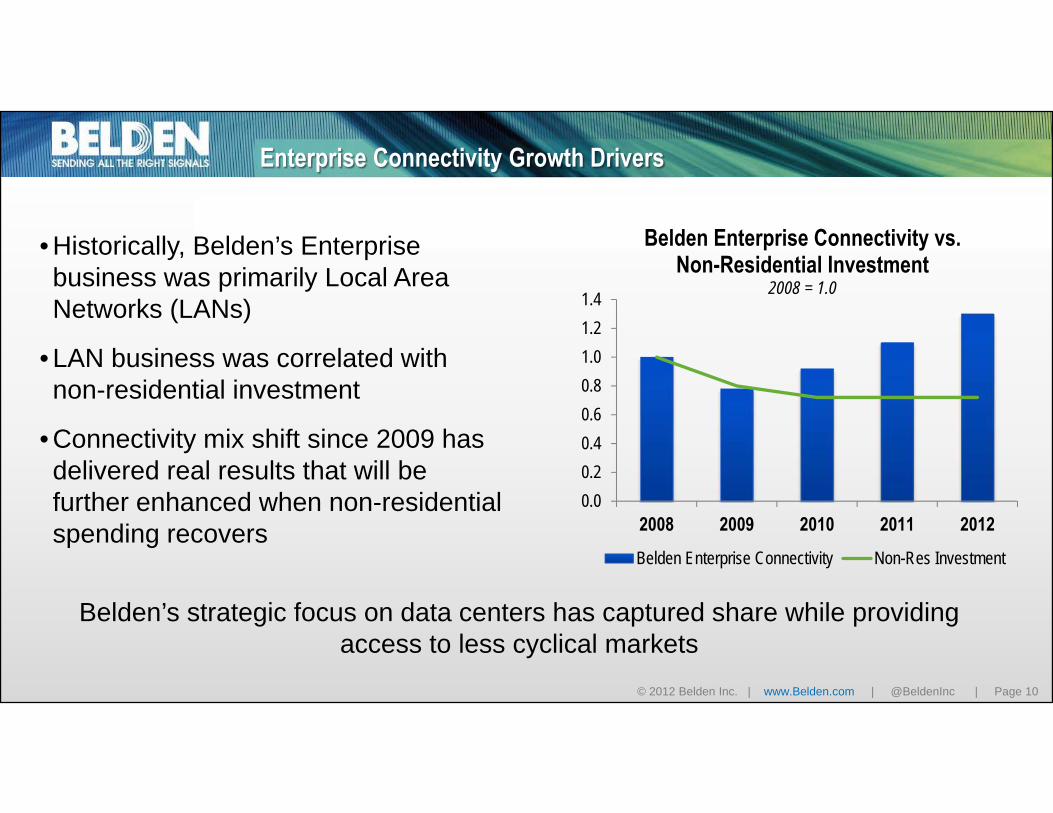
Belden Enterprise Connectivity vs. Non-Residential Investment
2008 = 1.0
Belden Enterprise Connectivity Non-Res Investment
Belden’s strategic focus on data centers has captured share while providing access to less cyclical markets
• Historically, Belden’s Enterprise business was primarily Local Area Networks (LANs)
• LAN business was correlated with non-residential investment
• Connectivity mix shift since 2009 has delivered real results that will be further enhanced when non-residential spending recovers
© 2012 Belden Inc. | www.Belden.com | @BeldenInc | Page 11© 2012 Belden Inc. | www.Belden.com | @BeldenInc | Page 11
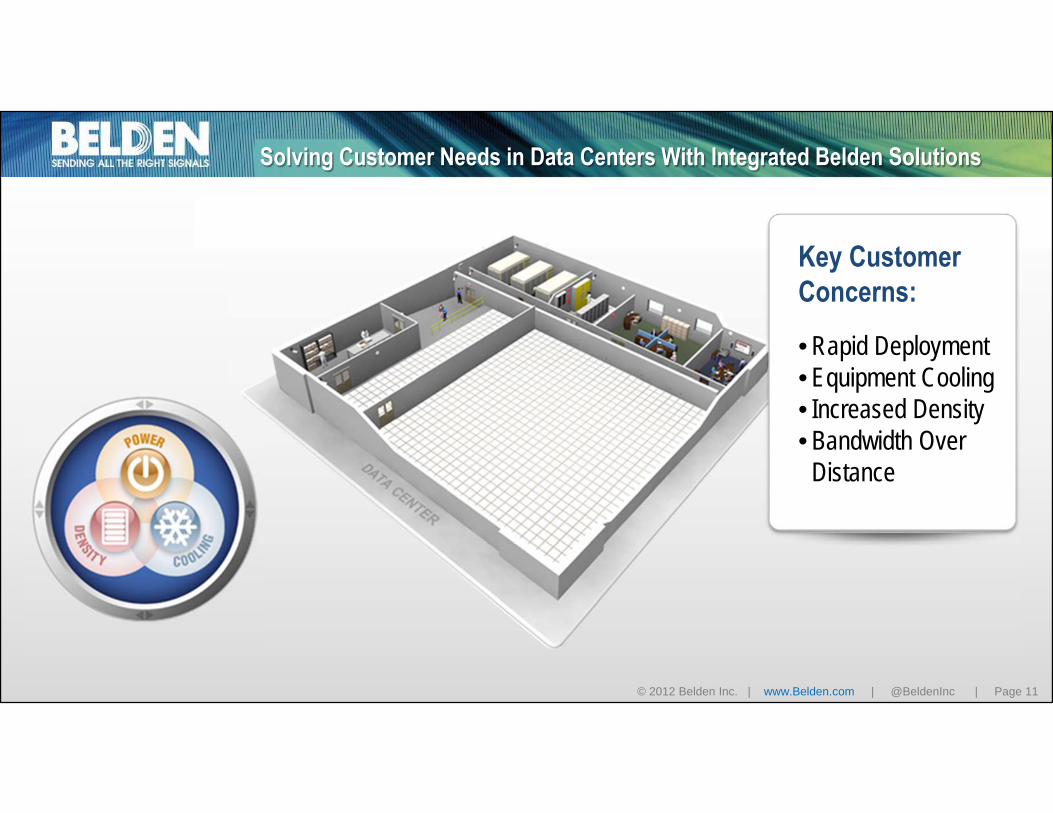
Solving Customer Needs in Data Centers With Integrated Belden Solutions
Key Customer Concerns:
• Rapid Deployment• Equipment Cooling• Increased Density• Bandwidth Over
Distance

© 2012 Belden Inc. | www.Belden.com | @BeldenInc | Page 12© 2012 Belden Inc. | www.Belden.com | @BeldenInc | Page 12
Solving Customer Needs in Data Centers With Integrated Belden Solutions
Rapid Deployment/ Cable ManagementBelden Racks & Enclosures

© 2012 Belden Inc. | www.Belden.com | @BeldenInc | Page 13© 2012 Belden Inc. | www.Belden.com | @BeldenInc | Page 13
Solving Customer Needs in Data Centers With Integrated Belden Solutions
Rapid Deployment/ Cable ManagementBelden Racks & Enclosures
Equipment Cooling/Lower Energy Costs
Belden AEHC System

© 2012 Belden Inc. | www.Belden.com | @BeldenInc | Page 14© 2012 Belden Inc. | www.Belden.com | @BeldenInc | Page 14
Solving Customer Needs in Data Centers With Integrated Belden Solutions
Rapid Deployment/ Cable ManagementBelden Racks & Enclosures
Equipment Cooling/Lower Energy Costs
Belden AEHC System
Density / Reduced Alien Cross TalkBelden connectivity,pre-terminated cables
© 2012 Belden Inc. | www.Belden.com | @BeldenInc | Page 15© 2012 Belden Inc. | www.Belden.com | @BeldenInc | Page 15
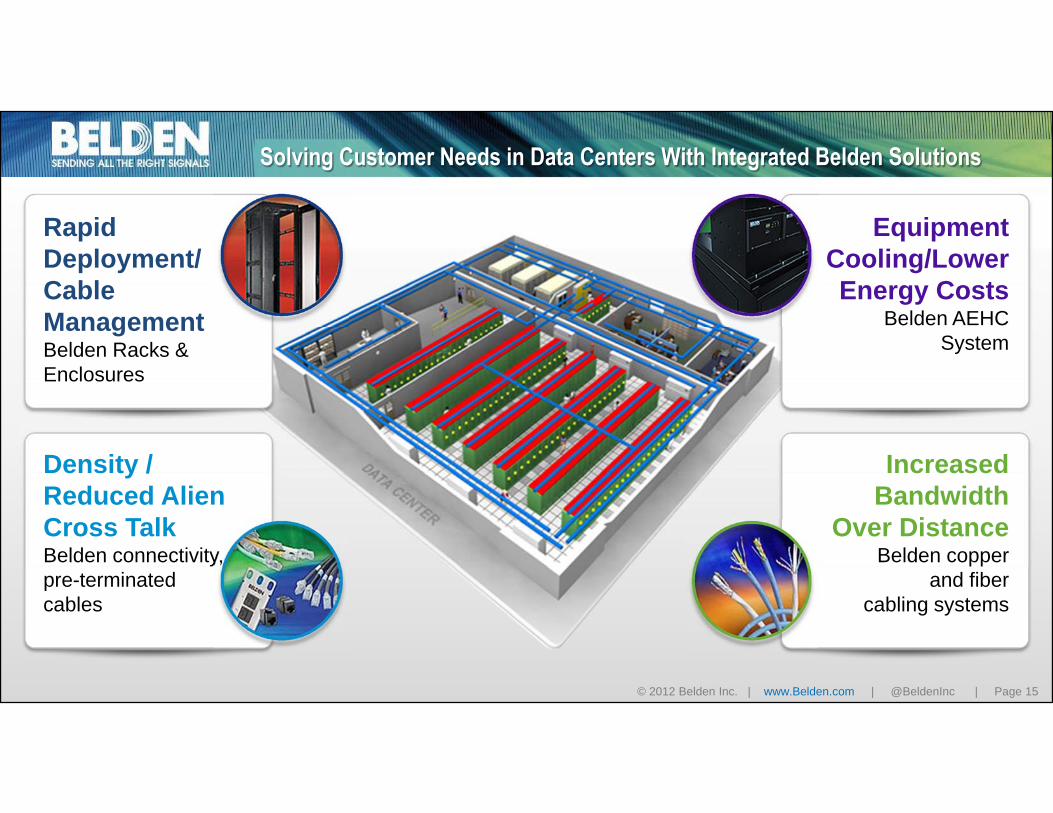
Solving Customer Needs in Data Centers With Integrated Belden Solutions
Rapid Deployment/ Cable ManagementBelden Racks & Enclosures
Equipment Cooling/Lower Energy Costs
Belden AEHC System
Density / Reduced Alien Cross TalkBelden connectivity,pre-terminated cables
Increased Bandwidth
Over DistanceBelden copper
and fiber cabling systems

© 2012 Belden Inc. | www.Belden.com | @BeldenInc | Page 16© 2012 Belden Inc. | www.Belden.com | @BeldenInc | Page 16
Expanding Margins with Integrated Enterprise Connectivity Solutions
Fully-Optimized, Integrated Solutions
Air Flow Solutions
Copper & Fiber Cable Systems
Connectivity
Racks and Enclosures
Pre-configured Racks
Pre-terminated Solutions
LOW HIGHValue Add, Margin

© 2012 Belden Inc. | www.Belden.com | @BeldenInc | Page 17© 2012 Belden Inc. | www.Belden.com | @BeldenInc | Page 17
Driving Growth Through Integrated Solutions and Belden MDS
Fully-Optimized, Integrated Solutions
Belden Market Delivery System Organic
Growth
Margin Expansion
Our customers look to us as a trusted advisor to deliver the solutions they need

© 2012 Belden Inc. | www.Belden.com | @BeldenInc | Page 18© 2012 Belden Inc. | www.Belden.com | @BeldenInc | Page 18
Broadcast

© 2012 Belden Inc. | www.Belden.com | @BeldenInc | Page 19© 2012 Belden Inc. | www.Belden.com | @BeldenInc | Page 19
Broadcast Solutions
Enterprise Connectivity Solutions
1. Estimated 2012 results.
IndustrialConnectivity Solutions
Industrial ITSolutions
Broadcast Solutions
Revenue ≈ $590M1 | Gross Margins ≈ 38-40% | Operating Profit Margins ≈ 13-15%

© 2012 Belden Inc. | www.Belden.com | @BeldenInc | Page 20© 2012 Belden Inc. | www.Belden.com | @BeldenInc | Page 20
Broadcast Overview
Leading provider of networking infrastructure and connectivity systems for television broadcast, cable, satellite and IPTV industries
$3.5B Global Served Market, 3-5% CAGRBrands & Product Portfolio
Interfaces, Routers, &
Playout
Camera Mounted Fiber
Solutions
Precision A/V Cable &
Connectivity
0.0
1.0
2.0
3.0
4.0
5.0
2011 2012 2013 2014 2015
ConnectivityIT Playout & MonitoringHardwareCable


Miranda TechnologiesStrath Goodship

© 2012 Belden Inc. | www.Belden.com | @BeldenInc | Page 23© 2012 Belden Inc. | www.Belden.com | @BeldenInc | Page 23
Miranda
world leader in hardwareand software solutionsthat enable television
broadcasters, cable, satellite and IPTV operators to
competitively deliver more content with higher quality

© 2012 Belden Inc. | www.Belden.com | @BeldenInc | Page 24© 2012 Belden Inc. | www.Belden.com | @BeldenInc | Page 24
Television Value Chain is Evolving
Creation Aggregation Delivery Consumers
Over the Top (OTT)
Television Service
ProvidersBroadcastersStudios

© 2012 Belden Inc. | www.Belden.com | @BeldenInc | Page 25© 2012 Belden Inc. | www.Belden.com | @BeldenInc | Page 25
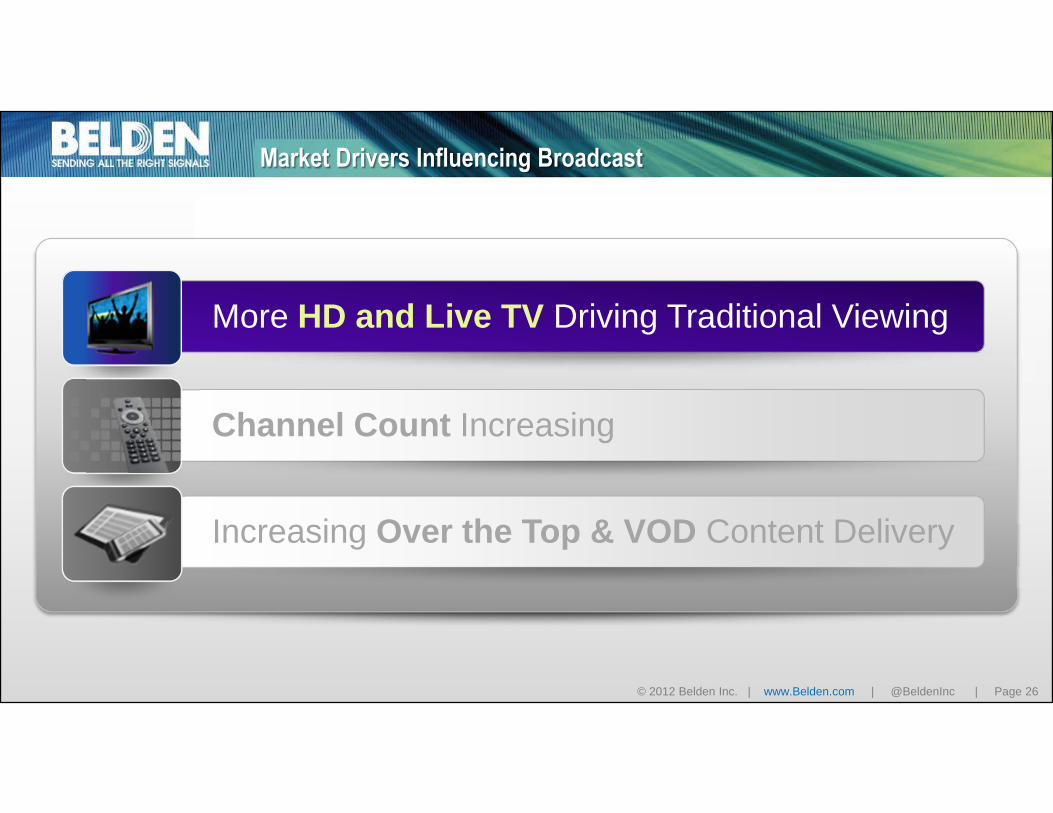
Market Drivers Influencing Broadcast
More HD and Live TV Driving Traditional Viewing
Channel Count Increasing
Increasing Over the Top & VOD Content Delivery
© 2012 Belden Inc. | www.Belden.com | @BeldenInc | Page 26© 2012 Belden Inc. | www.Belden.com | @BeldenInc | Page 26
Market Drivers Influencing Broadcast
Channel Count Increasing
Increasing Over the Top & VOD Content Delivery
More HD and Live TV Driving Traditional Viewing

© 2012 Belden Inc. | www.Belden.com | @BeldenInc | Page 27© 2012 Belden Inc. | www.Belden.com | @BeldenInc | Page 27
HD Still Has a Long Way to Go
Technology Used by TV BroadcastersCURRENT TV Operations TV Operations IN 2-3 YEARS
Source: Devoncroft – Big Broadcast Survey
Standard & Definitions
HD Analog Standard & Definitions
HD Analog

© 2012 Belden Inc. | www.Belden.com | @BeldenInc | Page 28© 2012 Belden Inc. | www.Belden.com | @BeldenInc | Page 28
Live Events Drive More Broadcast TV Viewing
18%of primetime TV is
Live programs on major US networks
20%of ratings delivered by the
Top 100 US TV shows were for Live programs

© 2012 Belden Inc. | www.Belden.com | @BeldenInc | Page 29© 2012 Belden Inc. | www.Belden.com | @BeldenInc | Page 29
Broadcasters Need More Complex Infrastructure to Support Live HD
More complex studio productions with more
cameras and more remote feeds
More demand for Miranda infrastructure
and monitoring solutionsCentral Switching Center
ABC Network Operation Center, New York
© 2012 Belden Inc. | www.Belden.com | @BeldenInc | Page 30© 2012 Belden Inc. | www.Belden.com | @BeldenInc | Page 30
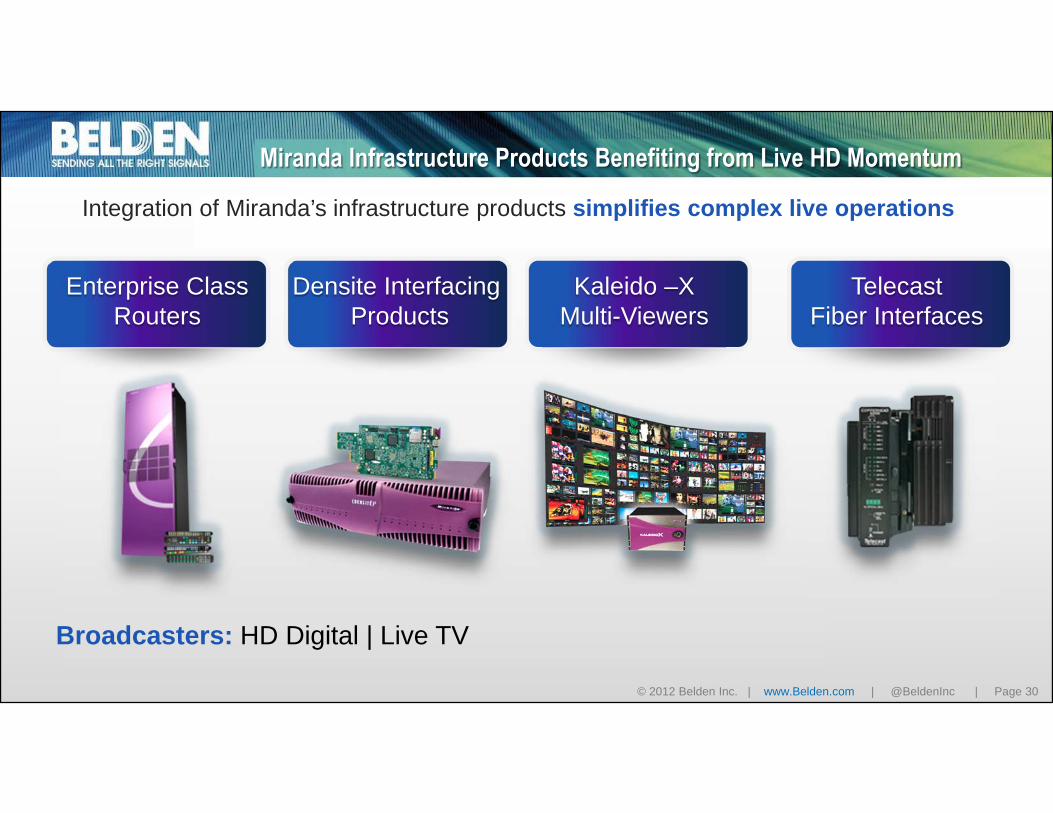
Miranda Infrastructure Products Benefiting from Live HD Momentum
Integration of Miranda’s infrastructure products simplifies complex live operations
Densite Interfacing Products
Enterprise Class Routers
Kaleido –XMulti-Viewers
TelecastFiber Interfaces
Broadcasters: HD Digital | Live TV

© 2012 Belden Inc. | www.Belden.com | @BeldenInc | Page 31© 2012 Belden Inc. | www.Belden.com | @BeldenInc | Page 31
Market Drivers Influencing Broadcast
Channel Count Increasing
Increasing Over the Top & VOD Content Delivery
More HD and Live TV Driving Traditional Viewing
© 2012 Belden Inc. | www.Belden.com | @BeldenInc | Page 32© 2012 Belden Inc. | www.Belden.com | @BeldenInc | Page 32
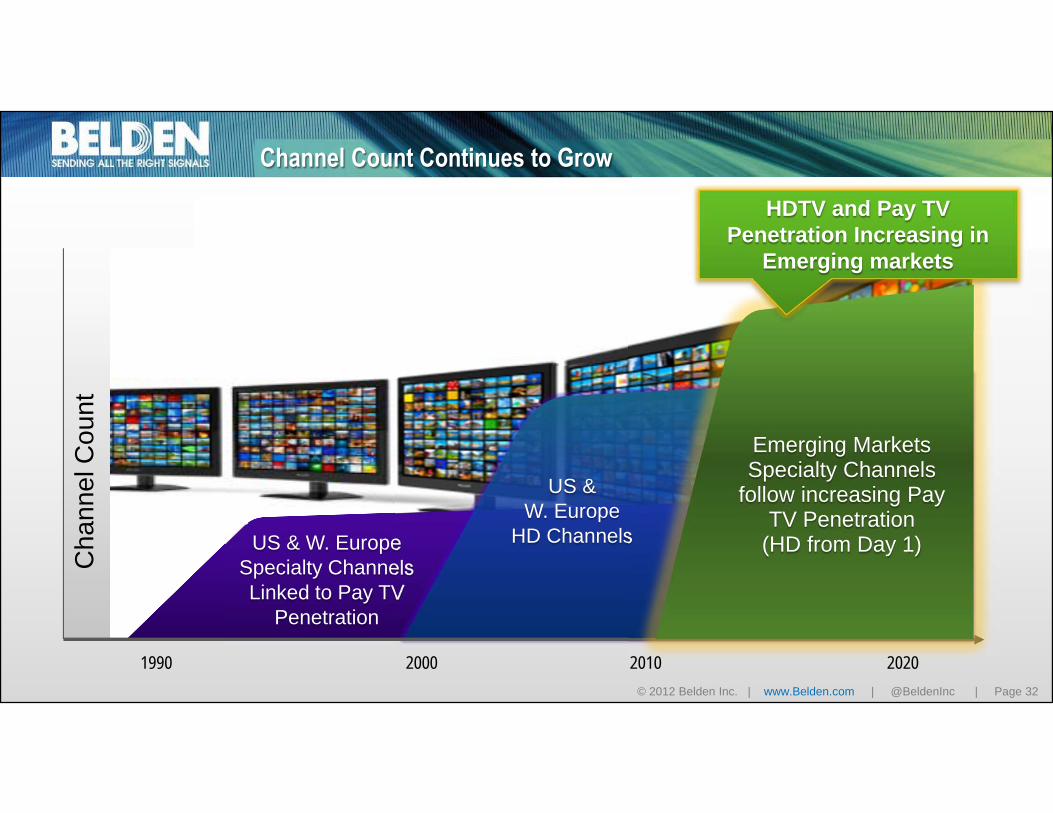
Channel Count Continues to Grow
US & W. Europe Specialty ChannelsLinked to Pay TV
Penetration
US & W. Europe
HD Channels
Emerging MarketsSpecialty Channels
follow increasing Pay TV Penetration
(HD from Day 1)
Cha
nnel
Cou
nt
HDTV and Pay TV Penetration Increasing in
Emerging markets
1990 2000 2010 2020

© 2012 Belden Inc. | www.Belden.com | @BeldenInc | Page 33© 2012 Belden Inc. | www.Belden.com | @BeldenInc | Page 33
Growth Opportunity for Miranda Infrastructure and Playout Products
Miranda Infrastructure Products Playout
Densite Interfacing Products
Enterprise Class Routers
Kaleido –XMulti-Viewers
TelecastFiber
Interfaces
iTX IT Based Playout
Master Ctl/Branding
Broadcasters: Increasing Channel Count

© 2012 Belden Inc. | www.Belden.com | @BeldenInc | Page 34© 2012 Belden Inc. | www.Belden.com | @BeldenInc | Page 34
A Changing Business Presence
Wins accelerating sales in Emerging Markets
Miranda Revenue

© 2012 Belden Inc. | www.Belden.com | @BeldenInc | Page 35© 2012 Belden Inc. | www.Belden.com | @BeldenInc | Page 35
Market Drivers Influencing Broadcast
Channel Count Increasing
Increasing Over the Top & VOD Content Delivery
More HD and Live TV Driving Traditional Viewing

© 2012 Belden Inc. | www.Belden.com | @BeldenInc | Page 36© 2012 Belden Inc. | www.Belden.com | @BeldenInc | Page 36
Any Content to Any Device Creates Opportunity for Us
Watch Anytime…and Anywhere
Over 33% of Americans have watched TV on an “alternative platform”
Internet video to TV doubled in 2011
HD VoD surpassed standard defby end of 2011
VoD traffic to triple by 2016

© 2012 Belden Inc. | www.Belden.com | @BeldenInc | Page 37© 2012 Belden Inc. | www.Belden.com | @BeldenInc | Page 37
Consumers
Video Distribution
Broadcasters distributing content through Traditional and Over the Top methods
Creation Aggregation Delivery
Television Service
ProvidersBroadcastersStudios
Over the Top (OTT)
LINEAR (TV By Appointment)
Over the Top
NON LINEAR (Catch Up TV) Video on Demand

© 2012 Belden Inc. | www.Belden.com | @BeldenInc | Page 38© 2012 Belden Inc. | www.Belden.com | @BeldenInc | Page 38
iTX Based Playout and Publishing Supports Linear and Non-Linear Delivery
iTX Based Playoutand
Content Publishing
enterprisesuiteVOD Publishing
Broadcasters
LINEAR (TV By Appointment)
Over the Top
NON LINEAR (Catch Up TV) Video on Demand

© 2012 Belden Inc. | www.Belden.com | @BeldenInc | Page 39© 2012 Belden Inc. | www.Belden.com | @BeldenInc | Page 39
Miranda’s Go To Market
Best-in-class by creating customer value

© 2012 Belden Inc. | www.Belden.com | @BeldenInc | Page 40© 2012 Belden Inc. | www.Belden.com | @BeldenInc | Page 40
What Makes the Combination of Belden and Miranda So Compelling?
• Access to the venue/outside broadcast market through Telecast products
• Ability to offer unique combinations with Belden’s connectivity products
• Deeper access to emerging markets, such as Brazil
• Belden’s business systems to enhance Miranda’s efficiencies, quality and growth
• Premium brands of the broadcast industry
• Strong relationships with Broadcasters for key functionality
• A unique skillset and track record in product development
Together, strongly positioned with scale, breadth and uniqueness of solutions

Customer Panel

© 2012 Belden Inc. | www.Belden.com | @BeldenInc | Page 42© 2012 Belden Inc. | www.Belden.com | @BeldenInc | Page 42
Customer Bios
Joe MardiniVice President - Data Centre Solutions & Mid MarketBell Business Markets
Ed MueskesVice President Connectivity SolutionsSchneider Electric


Financial OverviewHenk Derksen

© 2012 Belden Inc. | www.Belden.com | @BeldenInc | Page 45© 2012 Belden Inc. | www.Belden.com | @BeldenInc | Page 45
Consistent Financial Performance
Organic Revenue Growth: 4 – 6%
Operating Profit Margin: 14 – 16%
Free Cash Flow: Exceed Net Income
Return on Invested Capital: 13 – 15%
3-Year Financial Goals

© 2012 Belden Inc. | www.Belden.com | @BeldenInc | Page 46© 2012 Belden Inc. | www.Belden.com | @BeldenInc | Page 46
Organic Revenue Growth
Revenues ($Million) and Organic Growth (%)
Market provided a challenging environment for growth in 2012
Organic Growth Goal:4% - 6%

© 2012 Belden Inc. | www.Belden.com | @BeldenInc | Page 47© 2012 Belden Inc. | www.Belden.com | @BeldenInc | Page 47
Operating Profit Margin
Operating Profit ($Million)
Accelerated transformation drives higher margin goal
Operating Profit Margin Goal:
14% - 16%

© 2012 Belden Inc. | www.Belden.com | @BeldenInc | Page 48© 2012 Belden Inc. | www.Belden.com | @BeldenInc | Page 48
Operating Profit Margin Bridge
Operating Profit Margin, 2011-2012E
Improving business model
10.5%
11.7%80 bps
50 bps (40) bps 30 bps
8%
9%
10%
11%
12%
13%
14%
FY 2011 Mix Productivity Leverage on Growth
Acquisitions FY 2012E1
1. Based on management’s best estimates.

© 2012 Belden Inc. | www.Belden.com | @BeldenInc | Page 49© 2012 Belden Inc. | www.Belden.com | @BeldenInc | Page 49
Quality of Earnings: Free Cash Flow Generation
Since 2005, Belden has delivered free cash flow in excess of net income
110%
173%
126%114%
208%
124% 126%101%
$0.50
$0.75
$1.00
$1.25
$1.50
$1.75
$2.00
$2.25
$2.50
$2.75
$3.00
$3.25
$3.50
$3.75
0%
50%
100%
150%
200%
250%
2005 2006 2007 2008 2009 2010 2011 2012EFCF Per Share FCF, % of NI
1
1. Based on management’s best estimates.

© 2012 Belden Inc. | www.Belden.com | @BeldenInc | Page 50© 2012 Belden Inc. | www.Belden.com | @BeldenInc | Page 50
Dry Powder
Estimated Available Funds (Year-end 12/31/2012)
Belden is well-capitalized and strategically advantaged
Excess Cash$200 million
Committed Deal Capacity
$200 million
Result into$400 million in dry powder
© 2012 Belden Inc. | www.Belden.com | @BeldenInc | Page 51© 2012 Belden Inc. | www.Belden.com | @BeldenInc | Page 51
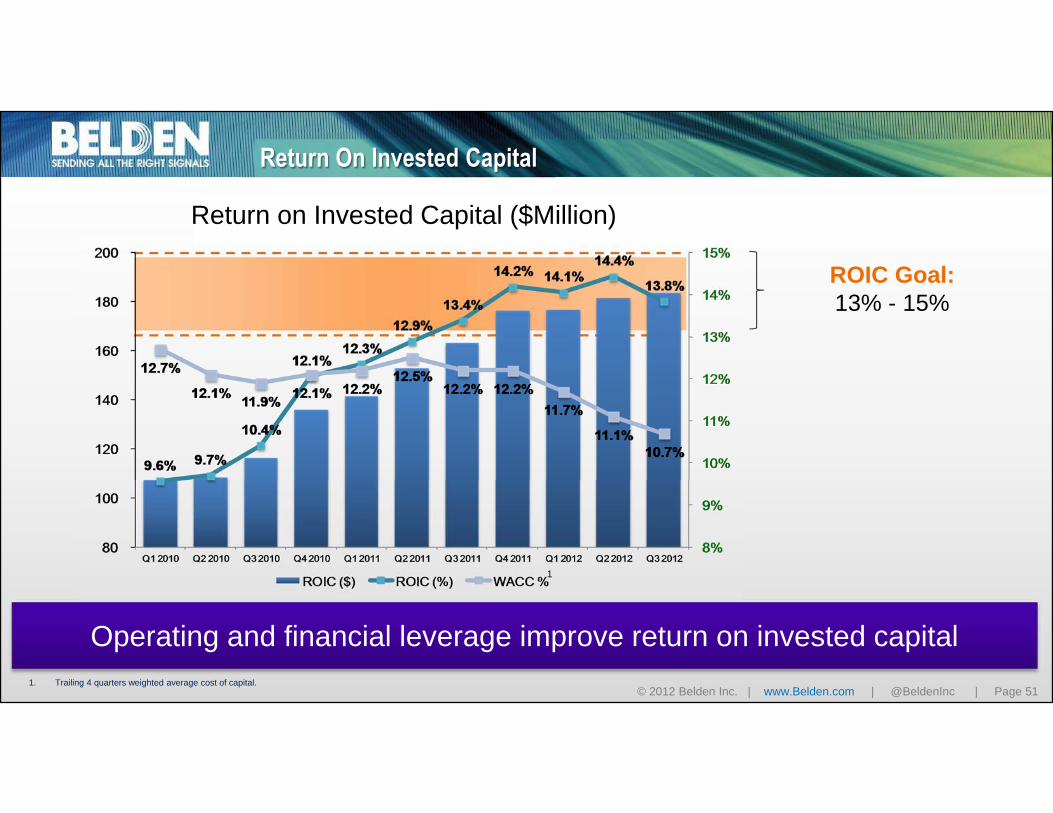
Return On Invested Capital
Operating and financial leverage improve return on invested capital
Return on Invested Capital ($Million)
ROIC Goal:13% - 15%
1. Trailing 4 quarters weighted average cost of capital.
1

© 2012 Belden Inc. | www.Belden.com | @BeldenInc | Page 52© 2012 Belden Inc. | www.Belden.com | @BeldenInc | Page 52
Return On Invested Capital
Operating and financial leverage improve return on invested capital
Return on Invested Capital ($Million)
ROIC Goal:13% - 15%
1. Trailing 4 quarters weighted average cost of capital.
1
ValueCreation

Q&A
2012 Investor and Analyst Meeting

2012 Investor and Analyst Meeting
Thank You.

2012 Investor and Analyst Meeting
Appendix

© 2012 Belden Inc. | www.Belden.com | @BeldenInc | Page 56
GAAP-to-Non-GAAP ReconciliationQ1 Q2 Q3 Q4
GAAP revenues 384,424$ 410,563$ 396,927$ 425,176$ Revenues from acquisitions - - - (6,544) Purchase accounting effects related to acquisitions - - - - Discontinued operations GAAP revenues 15,924 15,578 14,545 - Deferred revenue adjustments (5,885) (5,377) (3,509) - Non-GAAP revenues 394,463$ 420,764$ 407,963$ 418,632$
GAAP operating income 31,295$ 39,610$ 41,586$ 16,698$ Amortization of intangibles 2,713 2,587 2,600 3,289 Asset impairment - - - 16,574 Accelerated depreciation 1,108 1,108 - - Purchase accounting effects related to acquisitions 988 635 635 7,149 Deferred gross profit adjustments (3,346) (3,019) (1,927) - Discontinued operations GAAP operating loss (3,169) (2,666) (3,176) - Severance and other restructuring costs 4,084 3,785 1,663 509 Total operating income adjustments 2,378 2,430 (205) 27,521 Non-GAAP operating income 33,673$ 42,040$ 41,381$ 44,219$ Non-GAAP operating income as a percent of revenues 8.5% 10.0% 10.1% 10.6%
Q1 Q2 Q3 Q4
GAAP revenues 461,628$ 536,251$ 519,713$ 464,361$ Revenues from acquisitions - - - - Purchase accounting effects related to acquisitions - - - - Discontinued operations GAAP revenues - - - - Deferred revenue adjustments - - - - Non-GAAP revenues 461,628$ 536,251$ 519,713$ 464,361$
GAAP operating income 42,073$ 58,212$ 51,863$ 34,858$ Amortization of intangibles 3,679 3,347 3,371 3,375 Asset impairment - - - 2,549 Purchase accounting effects related to acquisitions - - - - Deferred gross profit adjustments - - - - Severance and other restructuring costs - - - 4,938 Total operating income adjustments 3,679 3,347 3,371 10,862 Non-GAAP operating income 45,752$ 61,559$ 55,234$ 45,720$ Non-GAAP operating income as a percent of revenues 9.9% 11.5% 10.6% 9.8%
Q1 Q2 Q3
GAAP revenues 464,291$ 484,042$ 490,367$ Revenues from acquisitions - - - Purchase accounting effects related to acquisitions - - 1,710 Discontinued operations GAAP revenues - - - Deferred revenue adjustments - - 1,080 Non-GAAP revenues 464,291$ 484,042$ 493,157$
GAAP operating income (loss) 43,965$ 58,351$ (7,609)$ Amortization of intangibles 3,235 2,570 7,798 Asset impairment - - 29,998 Purchase accounting effects related to acquisitions - - 11,219 Deferred gross profit adjustments - - 864 Severance and other restructuring costs - - 17,427 Total operating income adjustments 3,235 2,570 67,306 Non-GAAP operating income 47,200$ 60,921$ 59,697$ Non-GAAP operating income as a percent of revenues 10.2% 12.6% 12.1%
(In tho us ands , except pe rcentages )
2010
(In tho us ands , except pe rcentages )
(In tho us ands , except pe rcentages )
2011
2012

© 2012 Belden Inc. | www.Belden.com | @BeldenInc | Page 57
GAAP-to-Non-GAAP Reconciliation
Free Cash Flow
We define free cash flow, which is a non-GAAP financial measure, as net cash provided by operating activities less capital expenditures, net of proceeds from the disposal of tangibleassets. We believe free cash flow provides useful information to investors regarding our ability to generate cash from business operations that is available for acquisitions and otherinvestments, service of debt principal, dividends and share repurchases. We use free cash flow, as defined, as one financial measure to monitor and evaluate performance andliquidity. Non-GAAP financial measures should be considered only in conjunction with financial measures reported according to accounting principles generally accepted in theUnited States. Our definition of free cash flow may differ from definitions used by other companies.
2011 2010 2009 2008 2007 2006 2005
GAAP net cash provided by operating activities 184,563$ 111,549$ 151,810$ 173,874$ 205,556$ 141,156$ 49,149$
Capital expenditures, net of proceeds from
the disposal of tangible assets (38,840) (25,769) (38,725) (28,434) (34,452) (17,105) (12,157)
Non-GAAP free cash flow 145,723$ 85,780$ 113,085$ 145,440$ 171,104$ 124,051$ 36,992$
GAAP diluted weighted average shares 47,415 47,783 46,594 44,692 50,615 50,276 52,122
Adjustment for anti-dilutive shares that are dilutive under non-GAAP measures - - 405 2,740 - - -
Non-GAAP diluted weighted average shares 47,415 47,783 46,999 47,432 50,615 50,276 52,122
Non-GAAP free cash flow per share 3.07$ 1.80$ 2.41$ 3.07$ 3.38$ 2.47$ 0.71$
(In tho us ands , except per s hare amo unts )