broader foraging range of ancient short-tailed albatross
TRANSCRIPT

1
Location Latitude Longitude Year Bulk CSIA
Modern albatrossesBlack-footed N.W. Hawaiian Islands, N.W. Aleutian Islands − − 2000 − 2015 39 12
Laysan N.W. Hawaiian Islands, N.W. Aleutian Islands − − 2000 − 2015 54 9Short-tailed Gulf of Alaska, California − − 1950 − 2015 7 13
Ancient short-tailed albatrossChannel Islands S. California 34°07'N 119°55'W 1500 − 500 BP 49 17
Kuril Islands Sea of Okhotsk- E. Russia 46°32'N 151°30'E 2500 − 800 BP 35 11Rebun Island East China Sea- S. Japan 45°39'N 141°02'E 1500 − 1000 BP 46 9Oregon Coast N. Oregon 46°00'N 123°55'W 1500 − 1000 BP 16 -
The following supplements accompany the article
Broader foraging range of ancient short-tailed albatross populations into California coastal waters based on bulk tissue
and amino acid isotope analysis
Natasha L. Vokhshoori*, Matthew D. McCarthy, Paul W. Collins, Michael A. Etnier, Torben Rick, Masaki Eda, Jessie Beck, Seth D. Newsome
*Corresponding author: [email protected]
Marine Ecology Progress Series 610: 1–13 (2019)
Supplement 1. Summary information of specimens used in this study Table S1-1. List of sampling information for all seabirds analyzed in this study: species, location at which the specimens were retrieved, coordinates, year, and sample size for bulk and CSIA (compound-specific isotope analysis; includes C and/or N). A dash (−) for a given sample type indicates that the information was not available.

2
Supplement 2. Inter-laboratory comparison Table S2-1. Inter-laboratory comparison of each lab’s amino acid stock standard analyzed on a TRACE 1310 gas chromatograph with IsoLink 2 combustion unit coupled to a Thermo Scientific Delta V Plus IRMS at UNM–CSI and a Varian gas chromatograph coupled to a Finnegan Delta-Plus IRMS at the University of California Santa Cruz Stable Isotope Laboratory (UCSC-SIL; Santa Cruz, CA).
Supplement 3. Extended discussion on the Trophic Status of North Pacific Albatrosses Equations.
TLClassic = 1 + [ (δ15NGlu – δ15NPhe – 3.4) / 7.6 ] where δ15NGlu and δ15NPhe represent the stable nitrogen isotope values of organism Glu and Phe, respectively. 3.4‰ represents the δ15N difference between Glu and Phe of primary producers, and 7.6‰ is the literature TDF between Glu and Phe.
TLMulti-TDF = 2 + [ (δ15NGlu – δ15NPhe – 7.6) – 3.4 / 3.5] where δ15NGlu and δ15NPhe represent the stable nitrogen isotope values of organism Glu and Phe, respectively. 3.4‰ represents the δ15N difference between Glu and Phe of primary producers, 7.6‰ is the literature TDFGlu-Phe, and 3.5‰ is the average avian specific TDFGlu-Phe.
TLProline = 1 + [(δ15NPro – δ15NPhe) − 3.1] / 5.2 where δ15NGlu and δ15NPhe represent the stable nitrogen isotope values of organism Glu and Phe, respectively. 3.1‰ represent sthe adjusted typical δ15N difference between Glu and Phe of primary producers, and 5.2‰ is the literature TDF between Pro and Phe.

3
Results. We evaluated multiple CSIA-derived calculations for estimating Trophic Level; the three equations included: TLClassic (Chikaraishi et al. 2009), TLMulti-TDF (McMahon et al. 2013) and TLProline (McMahon et al. 2016). Briefly, the first two equations are based on the same offset of δ15NGlu-Phe but with different TDF constants, and the last equation is derived from the δ15NPro-
Phe offset (TDFPro-Phe). TLCSIA values for all albatross groups ranged from 2.4 to 2.7, Black-footed had the highest TL and Laysan and Rebun Islands groups had the lowest. While TLMulti-TDF pattern is similar to TLClassic, the trophic levels were higher: 3.1 to 3.4. The variability within groups for TLClassic and TLMulti-TDF ranged between 0.4 and 0.6. Lastly, preliminary work from McMahon et al. (2016) suggests that Proline might be a more robust AA for TL estimations over Glutamic Acid. TLProline estimations ranged from 3.5 to 4.1, where Black-footed was still measured as the highest trophic level and Laysan as the lowest trophic level, but Rebun Islands was higher than Laysan using this equation. For most seabird groups, there were no significant differences between TL (Tukey’s HSD t-test), except that Laysan, Rebun Islands and Kuril Islands were significantly different from Black-footed (P<0.01) using the TLClassic and TLMulti-TDF equations. Similarly, TLProline showed significant differences between Black-footed and Channel Islands, Kuril Islands and Laysan (P<0.03). Between short-tailed albatross groups in particular, there were no significant differences between archaeological site locations or between ancient and modern groups.
Discussion. The first equation, TLClassic (Chikaraishi et al. 2009), underestimates albatross trophic level with values between 2.0 and 3.0 (Fig. S3-1). This would suggest that the primary diet of albatrosses would be phytoplankton and zooplankton. The incongruity could be attributed to the canonical TDF for AA-based TL equations. TLCSIA assumes a ~7.6‰ enrichment per trophic step, however, diet quality appears to influence the TDF value, where higher protein diets have shown to have a smaller TDF (McMahon et al. 2016). TLMulti-TDF equation accounts for multiple TDFs for different trophic levels and applies specifically to uric-acid excreting avian species (McMahon et al. 2015). With this equation we calculated trophic levels of 2.7 to 3.8 for all groups (Fig. S3-1). Again, it is extremely unlikely that albatrosses main food source would be a primary consumer such as krill, and neither it corroborates with the main volume of gut content findings for any study performed on albatrosses, which is typically squid and/or fish (Harrison et al. 1983). The last equation we tested, TLProline, uses Proline as the trophic-AA instead of Glutamic acid. Albatross trophic levels ranged between 3.0 and 4.5. A few studies have attempted to quantify seabird trophic level, or for that matter seabirds from the Diomedeidae family, but estimates range from 3.5 to 5.3 (Sydeman et al. 1997, Cherel et al. 2010). We believe that our estimates closely reflect actual albatross trophic status since their diets are highly mixatrophic and opportunistic to what can be scavenged from surface waters.
Constraining trophic status of historical or elusive animal subjects is best done with intrinsic chemical tracers such as fatty acids (e.g. Conners et al. 2015) or stable isotopes (e.g. Ostrom et al. 2017). Trophic level equations using AA-δ15N isotopes are rapidly being developed and modified as the body of this field expands with more test organism AA-δ15N data being published. Here we contribute AA-δ15N results for three modern North Pacific albatross species, and three historical archaeological sites of short-tailed albatross. We calculated their trophic level using three different equations, including a novel equation that uses Proline instead of Glutamic acid as the trophic-AA. There are strong biases inherent in studies that rely on stomach content analyses, especially from bycaught birds that scavenge fisheries discards (Gould et al. 1997). More importantly, these dietary data cannot be directly compared to ancient and historical

4
species to assess if and how albatross ecology has changed, necessitating the use of biochemical approaches such as stable isotope analysis (Suryan & Fischer 2010).
Gut content analysis reveals that North Pacific albatrosses consume a highly mixatrophic diet, encompassing prey from multiple trophic levels (Fig. S3-2). Albatrosses are surface feeders and depend principally upon small and large squid, fish, fish roe, crustaceans, and partly cnidarians and marine mammal carrion (Harrison et al. 1983, Gould et al. 1997). Predominantly, the diets overlap between species, however, proportion of food source varies based on behavioral and morphological differences. Many gut-content analysis studies have been performed for Laysan and Black-footed (Harrison et al. 1983, Gould et al. 1997, Connors et al. 2015), and yet there is no clear consensus of what degree of specialization is common for each species (Suryan & Fischer 2010). The challenge is apparent for several reasons: Procellariiformes, such as albatrosses, rapidly digest their prey into a homogenous stomach oil (Tickell 2000), which reduces the ability to visually identify easily digestible prey for stomach content analysis. For example, Harrison et al. (1983) performed gut-content analysis on more than 150 specimens for each Laysan and black-footed albatrosses, where on average about 10% of the volume of food in an albatross was stomach oil and generally stomach contents were at an advanced state of digestion. Albatrosses have discrete partitioning of foraging behaviors and strategies driven by differences in nocturnal and diurnal foraging. Laysan are a more nocturnal forager than Black-footed albatross, since Laysan have high levels of rhodopsin, a light-sensitive pigment typically found in high levels among nocturnal birds (Sillman 1981, Harrison et al. 1983), and by satellite tracking studies showing a higher degree nocturnal foraging activity than Black-footed albatrosses (Conners et al. 2015). Black-footed albatrosses on the other hand have a greater dietary flexibility at a population level, and a greater dietary specialization at the individual level (Conners et al. 2018). Short-tailed albatross foraging behavior and strategy has not been extensively studied in similar vein as its other two congeners, however daylight foraging is important for all three species. Seasonal cycles and life stage can shift the diets of albatrosses. Resource partitioning in response to the breeding and nonbreeding seasons has shown to change albatross diet, which may be attributed to nestling energy demands, prey availability or the ecosystems where the prey are caught (Gould et al. 1997). Age is shown to be a factor too, where older birds tend to consume more squid than younger birds (Gould et al. 1997, Conners et al. 2018).
Lastly, fisheries have influenced albatross diet. From the 1950s to the 1990s pelagic longline fisheries for tuna and large-mesh driftnet fisheries for squid added a serious new mortality source to North Pacific albatrosses, but it also affected the diet of these seabirds (Gould et al. 1997). Albatrosses would follow these fisheries since it concentrated a high quality food source. All North Pacific albatross species frequently interacted with fisheries, but a study by Gould et al. (1997) showed that Laysan and Black-footed scavenged for different prey items. Black-footed were found to scavenge directly on longline target fish (e.g. swordfish), whereas Laysan more frequently preyed on the baitfish. This observation exhibits that albatrosses have flexible foraging strategies with inter- and intra-specific competition (Conners et al. 2015). Today, only a small percentage of albatross prey is scavenged from fisheries (<10%), however, some individuals have been found to specialize on fisheries-based prey (Conners et al. 2018).

5
Given the lengthy list of variables influencing North Pacific albatross diet, a chemically integrated tracer is beneficial for time-averaging the changing seasonal and behavioral conditions of albatross foraging. Bulk stable isotope analysis for assessing trophic status has been performed on albatross muscle (Gould et al. 1997), whole blood (Suryan & Fischer 2010), feather and collagen (Eda et al. 2012), but to our knowledge CSIA has never before been done on albatrosses. Quantifying the trophic level of albatrosses has proven difficult for the above reasons, either from gut content or stable isotope analysis. Few studies have attempted to quantify seabird trophic level, or for that matter seabirds from the Diomedeidae family. Trophic level of planktivorous (crustacean-based diet) and piscivorous (fish-based diet) California seabirds estimated to range between 3.5 and 4.5 (Sydeman et al. 1997) and Black-browed albatross whose range traverses the circumpolar current in the southern oceans was estimated to have a TL of 5.3 (Cherel et al. 2010). Within our dataset, none of our TL estimations reached >5.0, however, Southern Ocean albatross scavenge a unique food source that is not available to North Pacific albatrosses: penguin. Penguins are a top predator that primarily feed on fish, inherently increasing the trophic status of any animal that preys on them. Additionally, molecular ecology is providing evidence for major food types that would be impossible to observe in gut content analysis because Procellariiformes order rapidly digest their prey into a homogenous stomach oil (Tickell 2000). At-sea observations have sited albatrosses scavenging jellyfish from the surface of the ocean, but traditional techniques of looking at stomach contents could not corroborate this nor quantify the prevalence of this food source at the population level. McInnes et al. (2017) showed for Black-browed and Campbell albatrosses that the DNA scyphozoan jellyfish was present in the scat of 42% of samples overall over a two breeding season period across multiple nesting islands. At some islands, jellyfish were present in >80% of the individuals. Metabarcoding techniques cannot quantify the percent of a particular prey source to a seabird’s diet, which would be important for stable isotope mixing models, but it does indicate that its presence is more common than at-sea observations can account for.
Trophic-AAs (Glutamic acid vs. Proline) applied in the TL equation produce different variances within a group. For example, TLProline values for Black-footed albatrosses range a whole trophic level (3.5 to 4.6), whereas TLMulti-TDF and TLClassic values range only 0.5 trophic levels. Investigating the biosynthetic pathways of trophic-AAs can elucidate the higher variability in δ15NPro than in δ15NGlu. Trophic-AAs undergo extensive transamination/deamination reactions associated with Glutamic acid and the central nitrogen pool (Fogel et al. 1997, Gannes et al. 1998; see McMahon et al. 2016 for extensive review). Proline is formed in a three-step pathway from the cyclization of glutamate, which is why these two AAs typically exhibit the same fractionation patterns. Glutamic acid is typically one of the most abundant AAs in consumer tissues, but in bone collagen Proline (and Hydroxyproline) is the most abundant measurable trophic-AA. The higher variability in δ15NPro might be attributed to direct routing of Proline from the diet (Howland et al. 2003) on top of de novo synthesis from glutamate. In addition to resolving a more robust equation for estimating trophic level of albatrosses, understanding the variability in diet within a species is very important. The fact that different trophic-AAs produce different variances in TL estimations poses another challenge for CSIA-based trophic ecological studies.

6
Figure S3-1. Amino Acid δ15N trophic level calculations and albatross food web. A) Box and whisker plots of three CSIA-based equations for calculating Trophic Level in modern and ancient albatrosses from bottom to top: TLClassic, TLMulti-TDF, TLProline. Black dots are the data points, shaded gray box represents the upper and lower quartile, line within shaded box is the median, and whiskers are the maximum and minimum spread of the data.
3
4
5
Trop
hic
Posi
tion
Prol
ine
2
3
4
Trop
hic
Posi
tion
Mul
ti-TD
F
2
3
Trop
hic
Posi
tion
Cla
ssic
Laysan Short-tailed Channel Is. Kuril Is. Hamanaka Is.Black-footed
Ancient Short-tailed AlbatrossModern North Pacific Albatross
Rebun Is.

7
Phytoplankton
Crustaceans
Cnidarian
Epipelagic Squid
Flying Fish
Flying Fish Roe
Vertically Migrating Squid
Albatross
Figure S3-2. Schematics depicting the food web and its primary food sources of a North Pacific albatross

8
Supplement 4. Explanation for reconstructing CSIA-derived baseline δ13C values from Phenylalanine CSIA-derived baseline δ13C values estimation
We assume that our estimation of δ13CBaseline is the bulk δ13C value of phytoplankton. To calculate δ13CBaseline we regress a library of measured phytoplankton bulk δ13C to amino acid δ13C values. Our derived linear equation therefore can be used to calculate δ13CBaseline from our measured albatross δ13CAA data. We test two approaches:
Approach 1 – δ13CBaseline-EAA = 0.92 x (δ13CEAA) + 0.13, where: δ13CEAA = mean δ13C of essential amino acids Ile, Leu, Lys, Thr, Phe, and Val
Approach 2 – δ13CBaseline-Phe = 1.11 x (δ13CPhe) + 7.42, where: 0.92 (1.11) is the slope of the regression line between measured δ13C bulk and δ13CEAA (δ13CPhe) values from phytoplankton and 0.13 (7.42) is the associated y-intercept (Vokhshoori et al. 2014). The range of δ13CBaseline values from Phe most closely match our Marine Province δ13C values (Table S5-1), therefore for this study with albatrosses, we believe δ13CBaseline is better represented using phenylalanine rather than average EAAs.
Figure S4-1. Linear regression of measured phytoplankton bulk δ13C and amino acid δ13C (average essential amino acids - grey circles, and phenylalanine - black diamonds)
EAA y = 0.93x - 0.50
R² = 0.8335 Phe
y = 1.11x + 7.42 R² = 0.8467
-50
-40
-30
-20
-10
0
10
-40 -35 -30 -25 -20 -15 -10
Bulkδ13C
AAδ13C
9
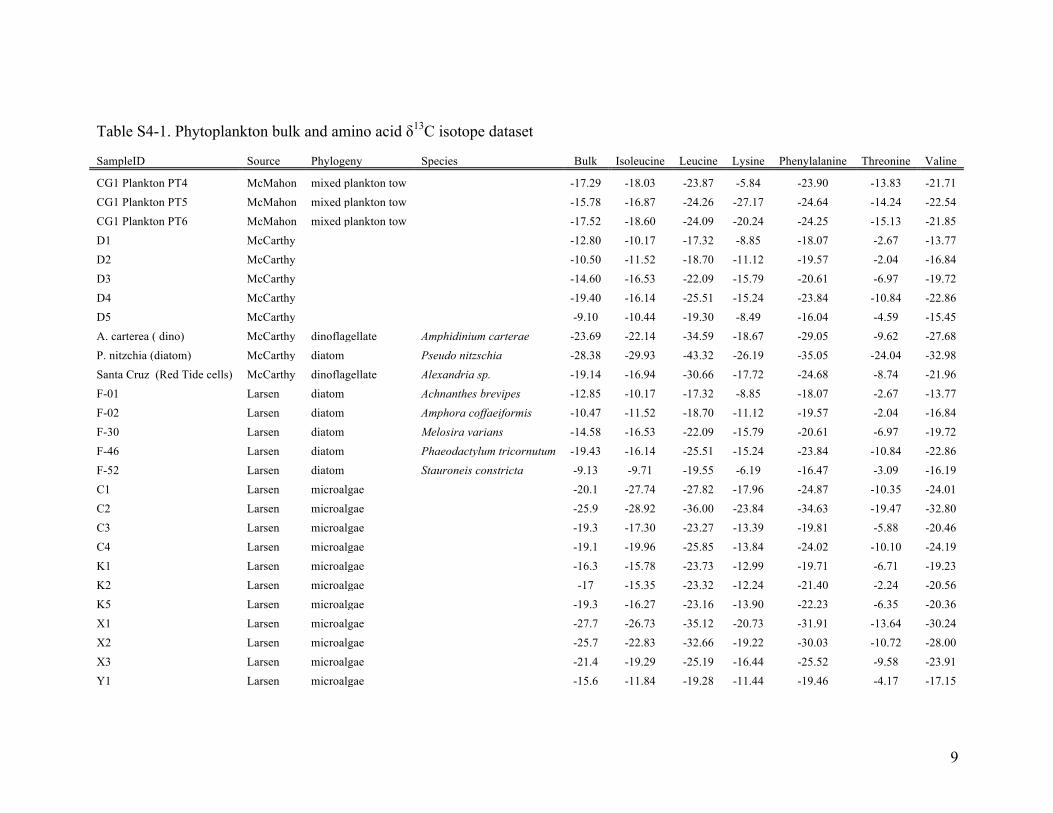
Table S4-1. Phytoplankton bulk and amino acid δ13C isotope dataset
SampleID Source Phylogeny Species Bulk Isoleucine Leucine Lysine Phenylalanine Threonine Valine
CG1 Plankton PT4 McMahon mixed plankton tow
-17.29 -18.03 -23.87 -5.84 -23.90 -13.83 -21.71 CG1 Plankton PT5 McMahon mixed plankton tow
-15.78 -16.87 -24.26 -27.17 -24.64 -14.24 -22.54
CG1 Plankton PT6 McMahon mixed plankton tow
-17.52 -18.60 -24.09 -20.24 -24.25 -15.13 -21.85 D1 McCarthy
-12.80 -10.17 -17.32 -8.85 -18.07 -2.67 -13.77
D2 McCarthy
-10.50 -11.52 -18.70 -11.12 -19.57 -2.04 -16.84 D3 McCarthy
-14.60 -16.53 -22.09 -15.79 -20.61 -6.97 -19.72
D4 McCarthy
-19.40 -16.14 -25.51 -15.24 -23.84 -10.84 -22.86 D5 McCarthy
-9.10 -10.44 -19.30 -8.49 -16.04 -4.59 -15.45
A. carterea ( dino) McCarthy dinoflagellate Amphidinium carterae -23.69 -22.14 -34.59 -18.67 -29.05 -9.62 -27.68 P. nitzchia (diatom) McCarthy diatom Pseudo nitzschia -28.38 -29.93 -43.32 -26.19 -35.05 -24.04 -32.98 Santa Cruz (Red Tide cells) McCarthy dinoflagellate Alexandria sp. -19.14 -16.94 -30.66 -17.72 -24.68 -8.74 -21.96 F-01 Larsen diatom Achnanthes brevipes -12.85 -10.17 -17.32 -8.85 -18.07 -2.67 -13.77 F-02 Larsen diatom Amphora coffaeiformis -10.47 -11.52 -18.70 -11.12 -19.57 -2.04 -16.84 F-30 Larsen diatom Melosira varians -14.58 -16.53 -22.09 -15.79 -20.61 -6.97 -19.72 F-46 Larsen diatom Phaeodactylum tricornutum -19.43 -16.14 -25.51 -15.24 -23.84 -10.84 -22.86 F-52 Larsen diatom Stauroneis constricta -9.13 -9.71 -19.55 -6.19 -16.47 -3.09 -16.19 C1 Larsen microalgae
-20.1 -27.74 -27.82 -17.96 -24.87 -10.35 -24.01
C2 Larsen microalgae
-25.9 -28.92 -36.00 -23.84 -34.63 -19.47 -32.80 C3 Larsen microalgae
-19.3 -17.30 -23.27 -13.39 -19.81 -5.88 -20.46
C4 Larsen microalgae
-19.1 -19.96 -25.85 -13.84 -24.02 -10.10 -24.19 K1 Larsen microalgae
-16.3 -15.78 -23.73 -12.99 -19.71 -6.71 -19.23
K2 Larsen microalgae
-17 -15.35 -23.32 -12.24 -21.40 -2.24 -20.56 K5 Larsen microalgae
-19.3 -16.27 -23.16 -13.90 -22.23 -6.35 -20.36
X1 Larsen microalgae
-27.7 -26.73 -35.12 -20.73 -31.91 -13.64 -30.24 X2 Larsen microalgae
-25.7 -22.83 -32.66 -19.22 -30.03 -10.72 -28.00
X3 Larsen microalgae
-21.4 -19.29 -25.19 -16.44 -25.52 -9.58 -23.91 Y1 Larsen microalgae
-15.6 -11.84 -19.28 -11.44 -19.46 -4.17 -17.15

10
δ13C δ15N
Marine Province Source(s) Mean ± SD Max Min Mean ± SD Max Min
Noth Pacific Epicontinent Schell et al. 1998; Guo et al. 2004
-24.3 ± 1.0a -22.8 -27.2 6.0 ± 1.9a 10.0 2.8
Gulf of Alaska Pomerleau et al. 2014; Hertz et al. 2016
-20.7 ± 1.8bd -18.1 -25.0 5.8 ± 1.5a 7.3 1.6
California Current System Kurle & Whorter 2017; Rau (unpubl.); Vokhshoori et al.
2014, Vokhshoori & McCarthy 2014
-21.6 ± .4bc -12.3 -28.1 6.6 ± 2.1a 11.9 1.2
Oyashio Current System Toyokawa et al. 2003; Usui et al. 2006; Aita et al. 2011
-22.1 ± 1.4c -18.8 -26.0 4.3 ± 1.5b 7.2 1.6
Kuroshio Current Kao et al. 2003 -20.9 ± 0.8cd -19.8 -22.4 4.4 ± 0.4b 5.2 3.5
North Pacific Subtropical Gyre Roland et al. 2008; Hannides et al. 2013
-20.3 ± 1.2cd -18.5 -22.0 -1.1 ± 1.9c 2.3 -3.0
Supplement 5. Marine Province isotope data and statistical outputs. Table S5-1. Summary of marine province δ13C and δ15N values in the North Pacific used in this study gathered from the literature. Mean, standard deviation (SD) and range for isotopic values for marine biogeographic provinces are based on particulate organic matter, organic matter in surface sediment, herbivorous zooplankton and/or littoral mussels sampled from the upper 100m of the water column. Consumer data were corrected for a trophic discrimination of 1.0 ‰ and 3.0‰ for δ13C and δ15N, respectively. Different superscript letters denote significance.

11
Figure S5-1. Box and whisker plot and ANOVA results of marine provinces A) δ13C and B) δ15N mean values. Black dots are individual data points, box represents the upper and lower quartile, line within box is the median, and whiskers are the maximum and minimum spread of the data. Any data point not connected to a whisker is an outlier. Different superscript letters denote significance.
a a a b b ANOVA, F(5,542)=57.48
A) ANOVA, F(5,538)=12.98 a bd bc c cd cd
B) ANOVA, F(5,542)=57.48 a a a b b c

12
Supplement 6. Standard ellipse areas from SIBER model output Figure S6-1. Density plots for modern (top panel) and ancient short-tailed (bottom panel) albatrosses depict the mean ellipse areas (black dots) and their credibility intervals (50, 75, 95%). The degree of overlap in credibility intervals is indicative of similarity in isotopic niche width between groups.
0
2
4
6
8
10
Sta
ndar
d E
llips
e A
rea
(‰ )
Short-tailed Black-footed Laysan
x
x
x
0
2
4
6
8
10
x
x
x
11
Kuril Is. Channel Is. Hamanaka Is.
2S
tand
ard
Elli
pse
Are
a (‰
)2
C) Modern Albatross
D) Ancient Short-tailed Albatross
Rebun Is.
13
Supplement 7. Detailed isotope data for bulk tissue and individual amino acids from albatrosses. See Excel file at http://www.int-res.com/articles/suppl/m610p001_supp7.xlsx LITERATURE CITED IN THE SUPPLEMENTS Aita, N.A., K. Tadokoro, N.O. Ogawa, F. Hyodo, R. Ishi, S.L. Smith, T. Saino, M.J. Kishi, S.
Saitoh and E. Wada. 2011. Linear relationships between carbon and nitrogen isotope ratios along simple food chains in marine environments. Journal of Plankton Research 33,11:1629-1642. doi:10.1093/plankt/fbr070
Cherel, Y., C. Fontaine, P. Richard and J.P. Labat. 2010. Isotopic niches and trophic levels of myctophid fishes and their predators in the Southern Ocean. Limnology and Oceanography 55:315–323. https://doi.org/10.4319/lo.2010.55.1.0324
Chikaraishi, Y., N.O. Ogawa, Y. Kashiyama, Y. Takano, H. Suga, A. Tomitani, H. Miyashita, H. Kitazato and N. Ohkouchi. 2009. Determination of aquatic food-web structure based on compound-specific nitrogen isotopic composition of amino acids. Methods in Limnology and Oceanography 7:740–750. https://doi.org/10.4319/lom.2009.7.740
Conners, M.G., E.L. Hazen, D.P. Costa and S.A. Shaffer. 2015. Shadowed by scale: subtle behavioral niche partitioning in two sympatric, tropical breeding albatross species. Movement Ecology 3:1–20. https://doi.org/10.1186/s40462-015-0060-7
Conners, M.G., C. Goetsch, S.M. Budge, W.A. Walker, Y. Mitani, D.P. Costa and S.A. Shaffer. 2018. Fisheries exploitation by albatross quantified with lipid analysis. Frontiers in Marine Science 5:113. doi:10.3389/fmars.2018.00113. https://doi.org/10.3389/fmars.2018.00113
Eda, M., H. Koike, M. Kuro-o, S. Mihara, H. Hasegawa and H. Higuchi. 2012. Inferring the ancient population structure of the vulnerable albatross Phoebastria albatrus, combining ancient DNA, stable isotope, and morphometric analyses of archaeological samples. Conservation Genetics 13:143−151 https://doi.org/10.1007/s10592-011-0270-5
Fogel, M.L., N. Tuross, B.J. Johnson and G.H. Miller. 1997. Biogeochemical record of ancient humans. Organic Geochemistry 27: 275–287. https://doi.org/10.1016/S0146-6380(97)00060-0
Gannes, L.Z., C. Martinez del Rio and P. Koch. 1998. Natural abundance variations in stable isotopes and their potential uses in animal physiological ecology. Comparative Biochemistry and Physiology 119A:725–737. https://doi.org/10.1016/S1095-6433(98)01016-2
Gould, P., P. Ostrom and W. Walker. 1997. Trophic relationships of albatrosses associated with squid and large-mesh drift-net fisheries in the North Pacific Ocean. Canadian Journal of Zoology 75:549–562. https://doi.org/10.1139/z97-068
Guo, L., T. Tanakaa, D. Wanga, N. Tanakaa and A. Muratab. 2004. Distributions, speciation and stable isotope composition of organic matter in the southeastern Bering Sea. Marine Chemistry 91:211–226. https://doi.org/10.1016/j.marchem.2004.07.002
Hannides, C.C.S., B.N. Popp, C.A. Choy and J.C. Drazen. 2013. Midwater zooplankton and suspended particle dynamics in the North Pacific Subtropical Gyre: a stable isotope

14
perspective. Limnology and Oceanography 58:1931–1946. https://doi.org/10.4319/lo.2013.58.6.1931
Harrison, C.S., T.S. Hida and M. Seki. 1983. Hawaiian seabird feeding ecology. Wildlife Society Monographs 85:1–71.
Hertz, E., M. Trudel, S. Tucker, T.D. Beacham, C. Parken, D. Mackas and A. Mazumder. 2016. Influences of ocean conditions and feeding ecology on the survival of juvenile Chinook Salmon (Oncorhynchus tshawytscha). Fisheries Oceanography 25:407–419. https://doi.org/10.1111/fog.12161
Howland, M.R., L.T. Corr, S.M.M. Young, V. Jones, S. Jim, N.J. Van der Merwe, A.D. Mitchell, and R.P. Evershed. 2003. Expression of the dietary isotope signal in the compound-specific δ13C values of pig bone lipids and amino acids. International Journal of Osteoarchaeology 13: 54–65. https://doi.org/10.1002/oa.658
Kao, S.J., F.J. Lin and K.K. Liu. 2003. Organic carbon and nitrogen contents and their isotopic compositions in surficial sediments from the East China Sea shelf and the southern Okinawa Trough. Deep-Sea Research II 50(6–7):1203–1217. https://doi.org/10.1016/S0967-0645(03)00018-3
Kurle, C.M. and J. K. Whorter. 2017. Spatial and temporal variability within marine isoscapes: implications for interpreting stable isotope data from marine systems. Marine Ecology Progress Series 568:31–45. https://doi.org/10.3354/meps12045
McInnes, J. C., R. Alderman, B. Raymond, M.A. Lea, B. Deagle and R.A. Phillips. 2017. High occurrence of jellyfish predation by black-browed and Campbell albatross identified by DNA metabarcoding. Molecular Ecology 26:4831–4845. https://doi.org/10.1111/mec.14245
McMahon, K.W., L. Ling Hamady and S.R. Thorrold. 2013. A review of ecogeochemistry approaches to estimating movements of marine animals. Limnology and Oceanography 58:697–714. https://doi.org/10.4319/lo.2013.58.2.0697
McMahon, K.W., M. Polito, S. Abel, M. D. McCarthy, and S. r. Thorrold. 2015b. Carbon and nitrogen isotope fractionation of amino acids in an avian marine predator, the gentoo penguin (Pygoscelis papua). Ecology and Evolution 5:1278–1290. https://doi.org/10.1002/ece3.1437
McMahon, K.W., S.R. Thorrold, L.A. Houghton and M.L. Berumen. 2016. Tracing carbon flow through coral reef food webs using a compound-specific stable isotope approach. Oecologia 180:809–821. https://doi.org/10.1007/s00442-015-3475-3
Ostrom, P.H., A.E. Wiley, H.F. James, S. Rossman, W.A. Walker, E.F. Zipkin and Y. Chikaraishi. 2017. Broad-scale trophic shift in the pelagic North Pacific revealed by an oceanic seabird. Proceedings of the Royal Society B 284:1–6. https://doi.org/10.1098/rspb.2016.2436
Pomerleau, C., R.J. Nelson, B.P.V. Hunt, A.K. Sastri and W.J. Williams. 2014. Spatial patterns in zooplankton communities and stable isotope ratios (δ13C and δ15N) in relation to oceanographic conditions in the sub-Arctic Pacific and western Arctic regions during the summer of 2008. Journal of Plankton Research 36:757–775. https://doi.org/10.1093/plankt/fbt129
Roland, L.A., M.D. McCarthy, T.D. Peterson and B.D. Walker. 2008. A large-volume microfiltration system for isolating suspended particulate organic matter: fabrication and assessment versus GFF filters in central North Pacific. Limnology and Oceanography Methods 6:64–80. https://doi.org/10.4319/lom.2008.6.64

15
Schell, D.M., B.A. Barnett and K.A. Vinette. 1998. Carbon and nitrogen isotope ratios in zooplankton of the Bering, Chukchi and Beaufort Seas. Marine Ecology Progress Series 162:11–23. https://doi.org/10.3354/meps162011
Sillman, A.J. 1981. Univ. California, Davis. Suryan, R.M. & K.N. Fischer. 2010. Stable isotope analysis and satellite tracking reveal
interspecific resource partitioning of non-breeding albatrosses off Alaska. Canadian Journal of Zoology 88:299-305. https://doi.org/10.1139/Z10-002
Sydeman, W.J., K.A. Hobson, P. Pyle and E.B. McLaren. 1997. Trophic relationships among seabirds in central California: combined stable isotope and conventional dietary approach. Condor 99:327–336. https://doi.org/10.2307/1369938
Tickell, W.L.N. 2000. Albatrosses. New Haven, Yale University Press. Toyokawa, M., T. Toda, T. Kikuchi, H. Miyake and J. Hashimoto. 2003. Direct observations of a
dense occurrence of Bolinopsis infundibulum (Ctenophora) near the seafloor under the Oyashio and notes on their feeding behavior. Deep-Sea Research I 50:809–813. https://doi.org/10.1016/S0967-0637(03)00056-6
Usui, T., S. Nagao, M. Yamamoto, K. Suzuki, I. Kudo, S. Montani, A. Noda and M. Minagawa. 2006. Distribution and sources of organic matter in surficial sediments on the shelf and slope off Tokachi, western North Pacific, inferred from C and N stable isotopes and C/N ratios. Marine Chemistry 98:241–259. https://doi.org/10.1016/j.marchem.2005.10.002
Vokhshoori, N.L., T. Larsen and M.D. McCarthy. 2014. δ13C of amino acids in littoral mussels: a new approach to constructing isoscapes of primary production in a coastal upwelling system. Marine Ecology Progress Series 504:59–72. https://doi.org/10.3354/meps10746