brookfield asset management/media/files/b/brookfield-bam-ir/ir day... · 1) represents total...
TRANSCRIPT

Brookfield Asset Management
INVESTOR DAY
SEPTEMBER 26 , 2018

2
Agenda
Strategic ReviewBruce Flatt, Senior Managing Partner & CEO
Focusing on Our People and CultureLori Pearson, Senior Managing Partner & COO
Financial ReviewBrian Lawson, Senior Managing Partner & CFO
Q&A

3
We continue to expand our franchise as one of the largest global alternative asset managers

4
$300B+ASSETS UNDER MANAGEMENT
80,000+EMPLOYEES
30+COUNTRIES
530+INSTITUTIONAL
INVESTORS
$129B+FEE BEARING
CAPITAL

5
Over the last year1 …
Raised $20 billion of capital in our public and private funds
Realized $13 billion of proceeds from asset sales
Notes/Assumptions:1) For the period September 1, 2017 – August 31, 2018
Deployed $33 billion of capital in high-quality assets, globally

6
Returns have been strong and this should continue
We expect interest rates to stay lowish
International trade is very topical
Currencies are volatile
Rising rates generally lead to growth in our cash flows
Our assets provide shelter
We earn high returns and hedge where we can

7
Irrespective of markets and politics, we continue to focus on:
Strengthening our balance sheets
Deploying capital for value
Recycling proceeds into higher yielding opportunities
Being patient, waiting for market breaks

8
1998 1999 2000 2001 2002 2003 2004 2005 2006 2007 2008 2009 2010 2011 2012 2013 2014 2015 2016 2017 2018
BAM returns % S&P U.S. 10-year yields
Returns from value investing in real assets have been strong
7%1
Notes/Assumptions:1) Represents total return, compound with dividends reinvested2) Represents total return, compound with coupon reinvested
19%1
4%2
9
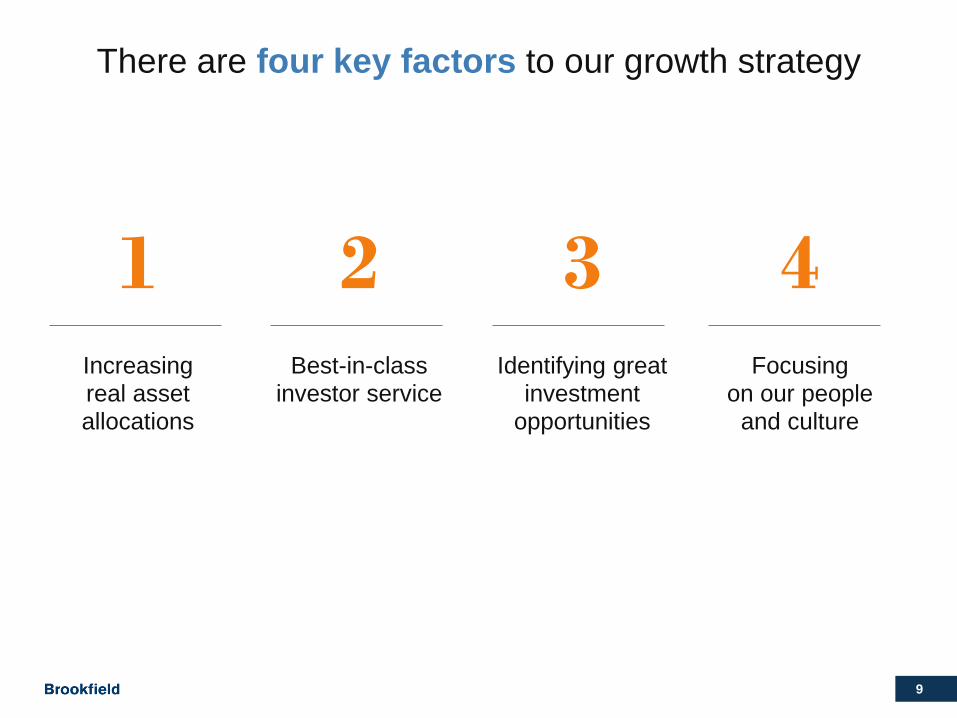
1Increasing real asset allocations
2Best-in-class
investor service
4Focusing
on our people and culture
There are four key factors to our growth strategy
3Identifying great
investment opportunities

10
Increasing Real Asset Allocations
1

11
Institutional allocations to real assets are below current targets …
Notes/Assumptions:1) Brookfield estimate
~$3 Trillion1 underweight

12
2008 2017 2030E
$52T2
$23T1
$100T3
Notes/Assumptions:1) Source: Willis Towers Watson Global Pension Assets Study, 2010; Preqin (in association with PwC) Sovereign Wealth Fund Report 2018 2) Source: Willis Towers Watson Global Pension Assets Study, 2018; Preqin (in association with PwC) Sovereign Wealth Fund Report 2018 3) Brookfield estimate
In addition, the universe of institutional capitalcontinues to grow

13
BondYields1
Target Real Asset
Yields3
Equity Yields2
1%-4%
6%-8%
7%-20%
Diversification
Less volatility
Predictable cash flows
Notes/Assumptions:1) Bloomberg as of June 30, 2018, U.S. 10-year treasury yield range over the past 10 years 2) Bloomberg as of June 30, 2018, total return of SPX, NASDAQ and DJI over the past 20 years, compounded with dividends reinvested3) Bloomberg as of June 30, 2018, real asset yield range is based on total returns earned by five publicly traded real asset managers over the past 10 years and the
S&P Real Asset Total Return Index
Why are investors choosing to invest their growing capital base in real assets?
Excess returns

14
POLLING QUESTION #1
What % of institutional investors plan on increasing allocations to alternative assets over the next 12 months?
a) >35%
b) 20-30%
c) <20%

15
A: According to a recent survey of over 100 institutional investors…
39%
Notes/Assumptions:Source: Coller Capital Global Private Equity Barometer – Summer 2018
plan to increase target allocations to alternative assetsover the next 12 months

16
Notes/Assumptions:1) Source: Coller Capital Global Private Equity Barometer – Summer 2018
Alternative Assets (Overall)
Private equity
Infrastructure
Real estate
29%
51%
27%
39%
4%
5%
5%
4%
Decrease Increase
% of respondents

17
We still believe target allocations will reach 40% in the long term and may be higher
Notes/Assumptions:1) Source: Willis Towers Watson Global Pension Assets Study, 2018 2) Brookfield estimate
20171 2030220001
Real Assets/AlternativesEquity/Fixed Income
5%95%75%
60%25%
40%+

18
Potential capture size?
$100T 40% $40T=Capture SizeMarket Size1
xAllocation1
Notes/Assumptions:1) Brookfield estimate

19
To sum up the opportunity
Institutions are increasing allocations to real assets
Plans are currently under-allocated even at current numbers
The capital to come is many trillions
Experienced managers will benefit from this

20
POLLING QUESTION #2
What % of total in-year fundraising do the top 20 firms (by size) represent?
a) >50%
b) 30-50%
c) 20-30%
d) <20%

21
A: According to market analysis…
~38%
Notes/Assumptions:Source: McKinsey & Company – The rise and rise of private markets; McKinsey Global Private Markets Review 2018
of 2017 fundraising went to the top 20 firms

22
We have four distinct advantages
We have established track records
We operate in multiple asset classes
We offer large global funds
We deliver exceptional investor experience
These advantages position us well

23
Best-in-Class Investor Service
2

24
We strive to provide best-in-class investor servicecentered around three key areas
3Investor
Reporting
2Investor
Communications
1Investor
Interactions

25
We have expanded our core investor service team
10
3 3
9
25
17
13
6
11
47
North America -Institutional
North America -Private Wealth
EMEA APAC Total
Q4 2016 Q2 2018
+2
+7+10
+3
+22

26
… and have dedicated resources to service new channels
Wirehouses
13PRIVATE WEALTH
RELATIONSHIP MANAGERS1
Family OfficesRegistered Investment Advisors
Notes/Assumptions:1) As at June 30, 2018

27
We surpassed 500 institutional investors this year
2013 2018 2023
530
200
~1,000
21
Notes/Assumptions:1) As at June 30, 20132) As at June 30, 2018
+165%
+89%
5-Year Target

28
Our existing investors are expanding their relationships with us
From 20131… … to 20181
1.6 2.0
Average # commitments per investor
Average commitment size per investor
+25%
+28%
Notes/Assumptions:1) As at June 30
$90M $115M

29
We are seeing more re-investment …
>60% of capital raised in the last 12 months is from existing investors
Notes/Assumptions:1) Includes co-investments and direct investments

30
…..and crossover
80% of our top 20 investorsinvest in multiple asset classes
Notes/Assumptions:1) Includes co-investments and direct investments

31
We are focused on innovative and broad product offerings
to meet investor demand

32
Over the years, our product offering has grown…
Notes/Assumptions: 1) Sample of select private and public strategies
Years
+115
17
14
12
9
2
2
1
2-10
29
Owner and Operator
Private Equity
Real Estate Credit
Real Estate
Infrastructure
Infrastructure Credit
Open End
Europe Credit
Listed Issuers
Other Public Securities
1900 2018
Priv
ate
Mar
kets
Publ
ic
Mar
kets

33
… and we will continue to expand in three key ways
Flagship Funds
Expanding the size of our
traditional funds
New Strategies
Launching new strategies adjacent to
existing strategies
Expanding our distribution channels for existing products
New Channels

34
Notes/Assumptions:1) Amounts raised include Brookfield’s commitment2) Actual timing and amounts raised may vary materially and are subject to market conditions and other factors and risks that are set out in our Notice to Recipients on Slides 116 to 1183) Raised to date as at September 25, 20184) Has not yet had a first close
$14.0 Launch Q4 2018Infrastructure $2.7 $7.0
$9.0 $11B3Real Estate
$4.0 $7B4+$0.8Private Equity
$1.0 $4.4
$1.0
($ billions)Current2Previous Three Flagship Vintages
Flagship Funds1
The size of our flagship funds continue to grow

35
New Strategies
Notes/Assumptions:1) Source: McKinsey & Company – The rise and rise of private markets; McKinsey Global Private Markets Review 2018
1
PERPETUAL CORE CREDIT
2
CREDIT
Investors are looking for longer-term and lower risk investments1

36
We recently launched eight fundsunder these new strategies…
Perpetual Core
$2.3B1
4 Funds
Credit
$4.0B1
4 Funds
Notes/Assumptions:1) Committed as at June 30, 2018, includes Brookfield commitment2) Brookfield estimate; includes future funds not yet raised. Actual timing and amounts raised may vary materially and are subject to market conditions and other factors and
risks that are set out in our Notice to Recipients on Slides 116 through 118
Current
Long-Term Target2 $60B2 $100B2
37
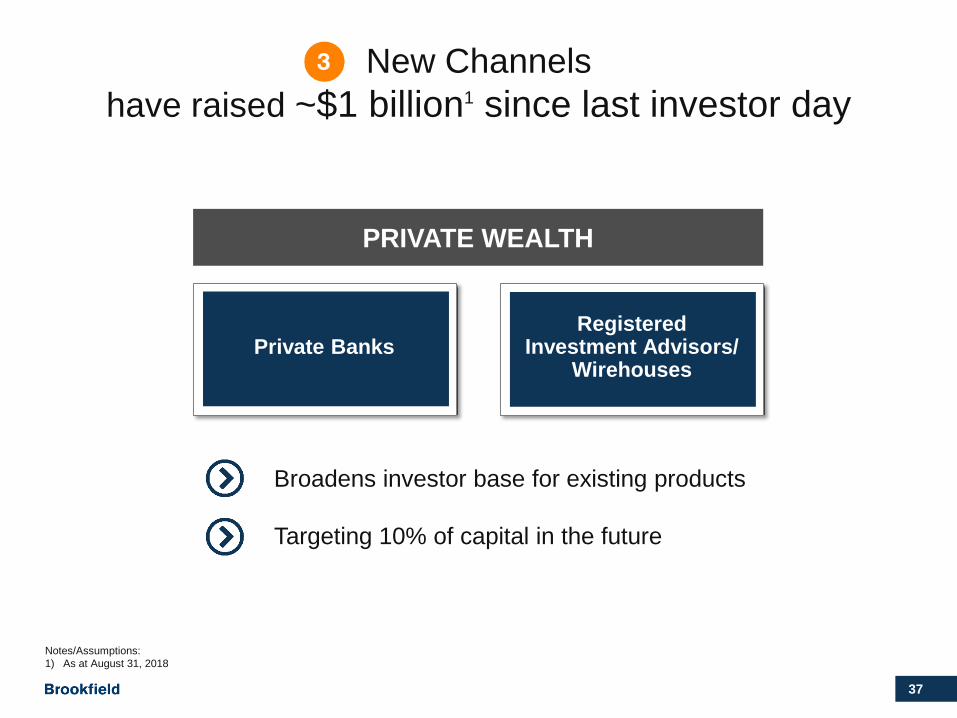
New Channels have raised ~$1 billion1 since last investor day
Broadens investor base for existing products
Targeting 10% of capital in the future
Private BanksRegistered
Investment Advisors/ Wirehouses
PRIVATE WEALTH
Notes/Assumptions:1) As at August 31, 2018

38
Notes/Assumptions:1) Source: Capgemini Financial Services Analysis, 20182) Brookfield estimate; includes future funds not yet raised. Actual timing and amounts raised may vary materially and are subject to market conditions and other factors
and risks that are set out in our Notice to Recipients on Slides 116 through 118
2008 2017 2030
$70T1
$130T2
Retail capital growth is substantial…
$32T1

39
Identifying Great Investment Opportunities
3

40
Investing in real assets globally requires casting a wide net

41
Our large scale capital provides us with a competitive advantage …
Less competition for large transactions

42
We will always find a home for attractive investments
Private Funds
Co-investment
Listed Issuer
BAM

43
The assets we acquire vary but our investment approach is always the same
Acquire high-quality
assets
On a value basis
Enhance value through
operating expertise

44
We continue to find excellent opportunities to deploy capital globally,
leveraging our operating expertise
45
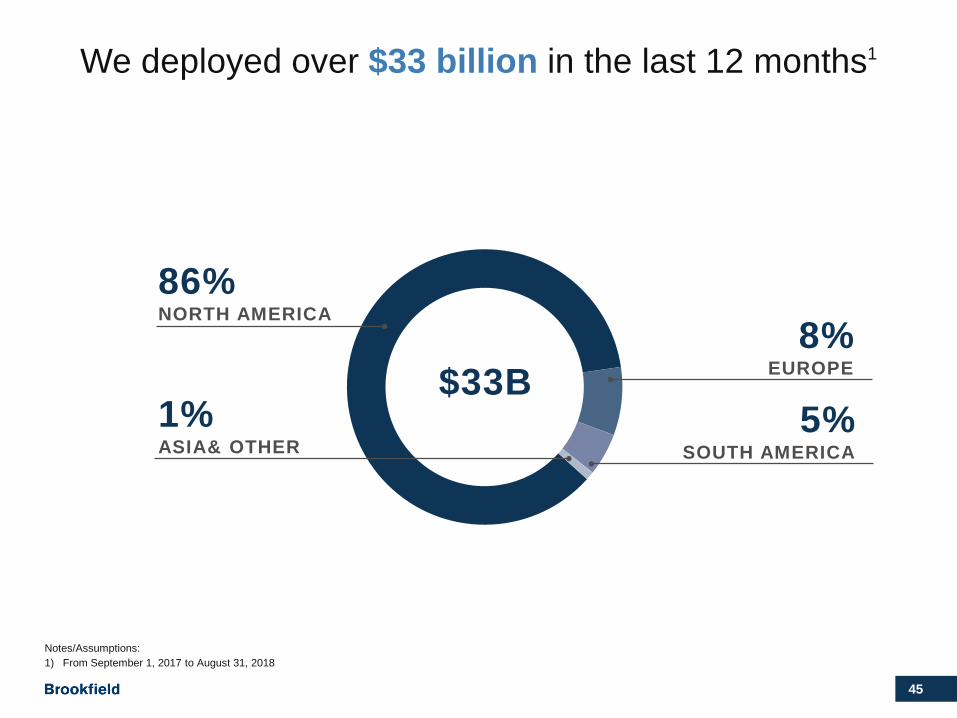
We deployed over $33 billion in the last 12 months1
5%SOUTH AMERICA
86%NORTH AMERICA
8%EUROPE
1% ASIA& OTHER
$33B
Notes/Assumptions:1) From September 1, 2017 to August 31, 2018

46
TerraForm Power and TerraForm Global
$1.5 billionLARGE SCALE CAPITAL
North & SouthAmerica and AsiaGLOBAL REACH
Renewable TeamOPERATING CAPABILITIES
2017 – Q4

47
Westinghouse Electric Corporation
$4 billionLARGE SCALE CAPITAL
U.S., Europe and AsiaGLOBAL REACH
Private Equity TeamOPERATING CAPABILITIES
2018 – Q3

48
Enercare
$3.3 billionLARGE SCALE CAPITAL
Canada and the U.S.GLOBAL REACH
Infrastructure TeamOPERATING CAPABILITIES
2018 – Q41
Notes/Assumptions:1) Transaction expected to close in Q4 2018
49
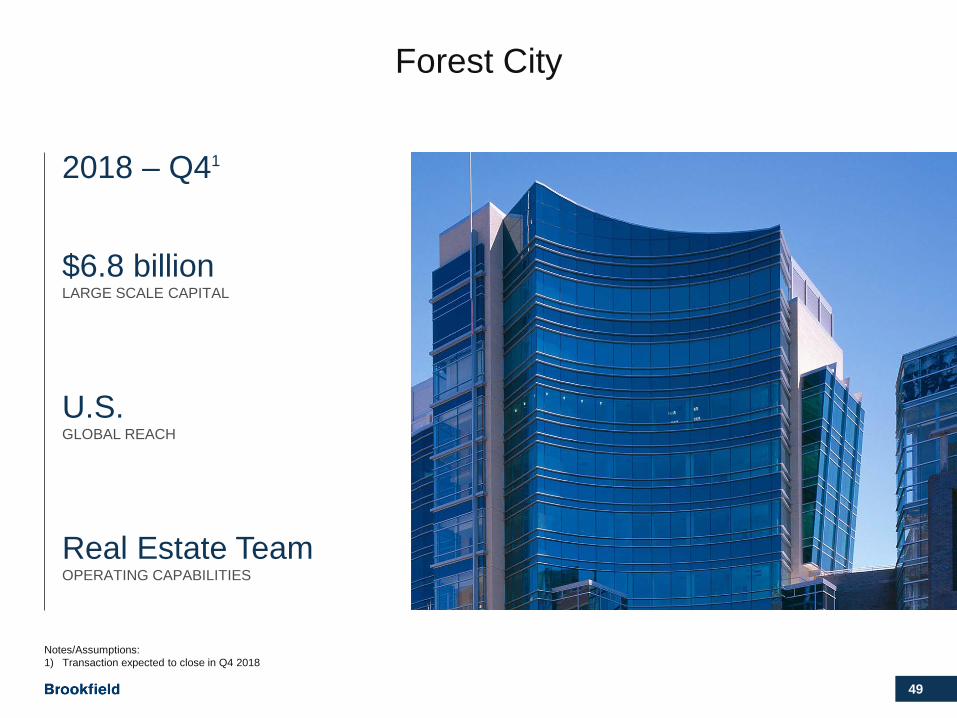
$6.8 billionLARGE SCALE CAPITAL
U.S.GLOBAL REACH
Real Estate TeamOPERATING CAPABILITIES
Forest City
2018 – Q41
Notes/Assumptions:1) Transaction expected to close in Q4 2018

50
Enbridge assets
$3.3 billionLARGE SCALE CAPITAL
CanadaGLOBAL REACH
Infrastructure TeamOPERATING CAPABILITIES
2019 – H11
Notes/Assumptions:1) Transaction expected to close in H1 2019

51
To sum up …

52
We want to leave you with five important points
Our franchise is still growing rapidly
We are well positioned to capture a larger piece of a growing market
We continue to deploy capital in high-quality real assets
Excellence in customer service is critical to success
We are structured for growth

53
Focusing on Our People and Culture | Lori Pearson
4

54
Maintaining our culture as we continue to grow supports value creation
Long-term Focus
Alignment of Interests Collaboration
PeopleVALUE
FOR SHAREHOLDERSAND INVESTORS
Operating Philosophy =+

55
Attract – Develop – Align
The Goal: achievement of potential
Compensate with a focus on alignment
Compensation
5
Provide them with stretch roles
Opportunities
4
Exposure
Operate a flat structure to provide exposure to
leadership
3
Develop
Succession planning effectively starting
on day one
2
Hire Right
Focus on people who can grow with the
organization
1

56
We hire people who have potential and the attributesof a Brookfield leader …
1
ENTREPRENEURIAL
2
COLLABORATIVE
3
DISCIPLINED

57
Recruit from within
Reinforces culture and knowledge sharing
Business Group Region Region
BusinessGroup
PortfolioCompanies
Business Group Region
Function Function

58
Our compensation strategies reinforce alignment
Emphasis on long-term compensation
All management receives some BAM equity based compensation
Management owns 20% of Brookfield

59
We have built an experienced and deep management team

60
Real Estate
Renewable Power Infrastructure Private
Equity
Public Securities
GroupCorporate
28 13 23 21 17 22
The Senior Executive Team has an average tenure of18 years working together
124 Managing Partners and Managing Directorsacross our geographies and business groups

61
INDIVIDUAL EXCELLENCEOPERATING PHILOSOPHY
Long-termfocus
To summarize…
Alignment of interests
Flat structure
Collaborative
Entrepreneurial
Disciplined
Brookfield culture

62
Financial Review| Brian Lawson

63
Agenda
Carried Interest
Balance Sheet Resilience
Value Creation
3
1
2
Financial Profile4

64
Our business is…
Straightforward Transparent Resilient Growing

65
Value Creation
1

66
Value creation at Brookfieldcomes from two primary sources
Invested Capital
BAM VALUE
Asset Manager
• Fee related earnings• Carried interest
• Value appreciation• Cash distributions

67
Our value creation process is straightforward and transparent
Raise Capital
Invest
Enhance Returns
Monetize
Business Cycle BAM Value Drivers
3
2
4
1
Base Fees
Performance Income1
Invested Capital Returns
Notes/Assumptions:1) Performance income includes incentive distributions, performance fees and carried interest

68
The sum of the parts is ~$56 billion…
Notes/Assumptions:1) Information presented is illustrative only. Actual results may vary materially and are subject to market conditions and other factors and risks that are set out in our Notice to
Recipients on Slides 116 through 118. Assumes a 60% margin on annualized fee revenues and a 70% margin on gross target carried interest. Reflects Brookfield’s estimates of appropriate multiples applied to fee related earnings and carried interest in the alternative asset management industry based on, among other things, industry reports. These multiples are used to measure performance for business planning purposes
2) Annualized as at June 30, 20183) Represents blended value, which is the quoted value of listed investments and IFRS value of unlisted investments, subject to two adjustments. First, we reflect BPY at its
IFRS value as we believe that this best reflects the fair value of the underlying properties. Second, we reflect Brookfield Residential at its privatization value
Plan Value1
AS AT JUNE 30($ millions) Multiple1 Ann.2 2018 2017
Asset manager
Annualized fee related earnings 20x $ 861 $ 17,220 $ 15,480
Net target carried interest 10x 808 8,080 6,020
25,300 21,500
Invested capital3 31,122 29,413
Total $ 56,422 $ 50,913
$6B

69
…which means BAM is trading at a 25% discount
($ millions) Total Per Share3
Asset manager plus invested capital (plan value)1,2 $ 56,422 $ 56.21
Implied equity market capitalization4 42,477 42.32
Discount to plan value $ 13,945 25%
Notes/Assumptions:1) As at June 30, 2018. Information presented is illustrative only. Actual results may vary materially and are subject to market conditions and other factors and risks that are set
out in our Notice to Recipients on Slides 116 through 1182) Illustrative stock price analysis is not intended to forecast or predict future events, but rather to provide information utilized by Brookfield in measuring performance for
business planning purposes, based on the specific assumptions and other factors described herein and in our Notice to Recipients on Slides 116 through 118. Actual results and share price performance may differ materially and are subject to market conditions
3) Per share amount calculated using total diluted shares as at June 30, 20184) Based on September 14, 2018 public pricing

70
Our activities add value in other ways….
High-quality critical assets and services
Positive contributionto communities
and employee base
Protect financial future for investors
1 2 3

71
We put a high priority on ESG principles
Consistent with owning and operating long-term sustainable assets
Important to our investors, employees and other stakeholders

72
ESG in action
Built into our investment approval process
One of world’s largest pure-play renewable energy portfolios
90% of our core office portfolio is green building certified
90% reduction in energy usage from our infrastructure district energy business

73
Balance Sheet Resilience
2

74
Maintaining a resilient balance sheet is a core part of our strategy
Strong liquidity
• $11 billion of core liquidity• $22 billion of dry powder
Notes/Assumptions:1) As at and annualized June 30, 2018
Non-recourse asset level debt
• Non-recourse, limited cross-collateralization or parental guarantees
• Duration matching with the underlying assets
Stable capital structure
• Long-term debt, perpetual shares • Investment grade model with limited
covenants• Self-sufficient listed entities
Strong cash flow generation
• $1.8 billion annual free cash flow• Contractual fee revenues• Stable distributions

75
Our net invested capital totals $31 billion
Notes/Assumptions:1) Quoted amounts based on June 29, 2018 public pricing2) Represents the quoted value of listed investments and IFRS value of unlisted investments as at June 30, 2018, subject to two adjustments. First, we reflect BPY at its IFRS value
as we believe that this best reflects the fair value of the underlying properties. Second, we reflect Brookfield Residential at its privatization value3) Calculated as multiplying units held at June 30, 2018 by distributions per unit, except for distributed cash flow on our financial assets which is estimated to be an 8% total return on
the weighted average balance of the last four quarters4) Includes other listed investments and financial assets. Financial assets cash flow estimated 8% annualized total return on the weighted average balance over the last four quarters.
As at June 30, 2018, the financial assets balance was $3.4 billion
Our invested capital is transparent, flexible and generates substantial cash flow
AS AT JUNE 30($ millions) Quoted1 IFRS Blended2
Distributed Cash Flow3
BPY $ 10,547 $ 16,907 $ 16,907 $ 691
BEP 5,661 3,801 5,661 369
BIP 4,519 1,920 4,519 221
BBU 3,362 1,921 3,362 22
Other listed4 5,536 5,483 5,536 281
Total listed investments $ 29,625 30,032 35,985 $ 1,584
Unlisted investments 4,463 5,585
Corporate capitalization and working capital (10,448) (10,448)
Net invested capital $ 24,047 $ 31,122

76
Our capital structure is resilientand long term in nature
$56B Common equity (at plan value)
$6BLong-term investment
grade debt (10-year average term)
$4BPerpetual preferred
shares
Notes/Assumptions:1) As at June 30, 2018

77
We generate over $1.8 billion of cash available fordistribution / reinvestment on an annualized basis,
with no carried interest
AS AT JUNE 30($ millions) 20181
Fee related earnings $ 861
Distributions from listed investments 1,584
2,445
Corporate activities
Corporate costs, cash taxes and other (156)
Corporate interest expense (320)
Preferred share dividends (152)
Cash available for distribution / reinvestment $ 1,817
Notes/Assumptions:1) Annualized

78
… and distribute ~ 30% to shareholders
AS AT JUNE 30($ millions) 20181
Cash available for distribution / reinvestment $ 1,817
Common share dividends (576)
Cash available for distribution / reinvestment, net $ 1,241
Percent distributed to shareholders 32%
Notes/Assumptions:1) Annualized

79
How are we using this cash to enhance shareholder return?
Participate in capital raises by our listed partnerships
Seed new investment strategies
Help facilitate large fund transactions
BAM share repurchases, which have been a lower priority in recent years

80
Carried Interest
3

81
How we measure carried interest
The carried interest we expect to earn on
third-party capital, assuming the fund achieves the target
return, annualized on a straight-line basis
EarningsPotential
Carried interest generated and based on fund
performance to date, assuming funds are
liquidated at current values
CurrentPerformance
Carried interest earned, excluding amounts subject
to clawback; basis for financial statement and
FFO recognition
Final Results
Target Carried Interest Realized Carried InterestUnrealized Carried Interest
1 2 3

82
Carried interest profile for a typical fund
Year 1 Year 2 Year 3 Year 4 Year 5 Year 6 Year 7 Year 8 Year 9 Year 10Target carry Generated carry Realized carry
Notes/Assumptions:1) Illustrative of carried interest generated and realized over the 10-year life of a fund

83
Common carry misconception
Carry is earned on total profits provided that the preferred return is met
Carry is earned only on profit above the preferred return
Misconception Fact

84
Carry is earned on total fund profits
Opportunistic
Gross target return 20.0%
Base fee (2.0)%
Total fund profit 18.0%
Carry at 20% of total fund profit1,2 3.6%
Return to investor 14.4%
Typical preferred return 8%
Notes/Assumptions:1) Carried interest is generated once a private fund exceeds its preferred return. It will typically go through a catch-up period until the manager and limited partner (LP)
are earning carry at their respective percentages2) Average carried interest rate on opportunistic funds

85
The majority of our funds are tracking tomeet or exceed their target returns1
AS AT JUNE 30, 2018($ millions) Vintage2 Total CEC
Unrealized Carried Interest
GrossIRR3,4,5
Target Gross
IRR5
Opportunistic 2006 – 2018 $ 21,692 $ 1,655 23% – 28% 20%
Value add 2008 – 2016 16,685 715 15% 13% – 15%
Credit and core plus 2005 – 2018 8,483 157 13% 12% – 15%
Total $ 46,860 $ 2,527
Notes/Assumptions:1) See Q2 2018 Supplemental Information for further disaggregation by investment strategy 2) Year of final close3) On existing carry eligible funds, excluding open-ended funds and funds categorized as “Other” in the Supplemental Information 4) Unrealized fund returns reflected. The actual realized returns on current unrealized investments may vary materially and are subject to market conditions and other factors and risks
that are set out in our Notice to Recipients on Slides 116 to 1185) Gross IRR reflects performance before fund expenses, management fees (or equivalent fees) and carried interest
Which means they are well over the preferred return and will earn carry on each dollar of profit

86
In the last twelve months, we generated $1 billion of net carried interest, exceeding our target of $808 million
($ millions) 2018 2017
Carry eligible capital1 $ 46,860 $ 40,426
Invested 25,769 22,901
Uncalled fund commitments 21,091 17,525
Target carry, net1,2 808 602
Generated carry, net3 1,007 372
Notes/Assumptions:1) As at June 302) Assumes 70% margin on gross target carried interest3) Last twelve months ended June 30

87
Our generation expectations have grown and shifted forward since last year…
$0.0
$2.0
$4.0
$6.0
$8.0
$10.0
$12.0
2017 2018 2019 2020 2021 2022 2023 2024 2025 2026 2027
Generated - 2017 IR Day Generated - 2018 IR Day
($ billions)
Existing Funds Only1
Notes/Assumptions:1) As at June 30. Information presented, including gross carried interest on existing funds, is illustrative only. Actual results may vary materially and are subject to market
conditions and other factors and risks that are set out in our Notice to Recipients on Slides 116 through 118
2017 IR Day
Generated
Generated
2018 IR Day

88
…and realizations are now expected to be $10 billion
$0.0
$2.0
$4.0
$6.0
$8.0
$10.0
$12.0
2017 2018 2019 2020 2021 2022 2023 2024 2025 2026 2027
Realized - 2018 IR Day
($ billions)
Existing Funds Only1
2018 IR Day
Realized
Notes/Assumptions:1) As at June 30. Information presented, including gross carried interest on existing funds, is illustrative only. Actual results may vary materially and are subject to market
conditions and other factors and risks that are set out in our Notice to Recipients on Slides 116 through 118

89
On an annualized basis realizations should look like this…
$0.0
$0.5
$1.0
$1.5
$2.0
$2.5
$3.0
$3.5
$4.0
2017 2018 2019 2020 2021 2022 2023 2024 2025 2026 2027
Realized - Existing Funds
($ billions)
30% 70%
Notes/Assumptions:1) As at June 30. Information presented, including gross carried interest on existing funds, is illustrative only. Actual results may vary materially and are subject to market
conditions and other factors and risks that are set out in our Notice to Recipients on Slides 116 through 118

90
… and will be supplemented by carry on future funds
$0.0
$0.5
$1.0
$1.5
$2.0
$2.5
$3.0
$3.5
$4.0
2017 2018 2019 2020 2021 2022 2023 2024 2025 2026 2027
Generated - Existing Funds Generated - Future Funds Realized - Existing Funds Realized - Future Funds
($ billions)
Notes/Assumptions:1) As at June 30. Information presented, including gross carried interest on existing funds and future funds, is illustrative only. Actual results may vary materially and are subject
to market conditions and other factors and risks that are set out in our Notice to Recipients on Slides 116 through 118

91
How do we value this carry?

92
Notes/Assumptions:1) Information presented is illustrative only. Actual results may vary materially and are subject to market conditions and other factors and risks that are set
out in our Notice to Recipients on Slides 116 through 118. Assumes a 70% margin on gross target carried interest. Reflects Brookfield’s estimates of an appropriate multiple applied to carried interest in the alternative asset management industry based on, among other things, industry reports. This multiple is used to measure performance for business planning purposes
Expect to generate net target carry of $808 millionif we meet target returns on existing funds
We value carry as a multiple of net target carry
10Multiple1
$8BValue created1
$808MNet target carry

93
This $8 billion of value is supported by our DCF model1
$4.3B $8.0B
Terminal Value
$3.7B
Existing Funds
Notes/Assumptions:1) To value carried interest we use discounted cash flow values for expected carried interest assuming gross target returns, before fund expenses, management fees
(or equivalent fees) and carried interest of 20% for opportunistic funds and 13% for value add, credit and core plus funds are achieved. We apply a terminal multiple of 5x on expected carried interest at the end of 10 years to account for future funds. The aggregate amount is then discounted at 10% and we assume a 70% margin

94
Net terminal value represents value of future funds1
Notes/Assumptions:1) Net terminal value is the estimated value of carried interest on future funds. It is calculated based on a range of gross target returns implying a range of future carried interest
to which we then apply an assumed 5x multiple to. This value is then discounted using a range of discount rates. Net terminal value is presented on a net basis assuming a 70% margin
2) Gross target return reflects performance before fund expenses, management fees (or equivalent fees) and carried interest
Our net terminal value of carried interest is $4.3 billion
Gross Target Return2
18% 19% 20% 21% 22% OpportunisticAS AT JUNE 30, 2018($ milions) 11% 12% 13% 14% 15% Value Add, Credit & Core Plus
Dis
coun
t Rat
e 8% 3,700 4,600 5,100 5,700 6,200
9% 3,400 4,200 4,700 5,200 5,700
10% 3,100 3,900 4,300 4,800 5,200
11% 2,800 3,600 3,900 4,400 4,800
12% 2,600 3,300 3,600 4,000 4,400

95
Takeaways
Carry is earned on every dollar of profits, as long as the preferred return is met
We value our carry at $8 billion, net of costs, discounted
Our carry is growing rapidly

96
Financial Profile
4

97
Five years ago we projected where we could be in 2018…

98
2013 2018P 2018
Fee related earnings1($ millions)
$ 302 $ 675 $ 861
Target carried interest, net2($ millions)
$ 263 $ 427 $ 808
We surpassed our growth projections
Notes/Assumptions:1) Annualized as at June 302) As at June 30

99
2013 2018P 2018
Fee bearing capital1($ billions)
$ 78 $ 126 $ 129
Listed partnerships 31 49 56
Private funds 29 47 57
Public securities2 18 30 16
Strong private fund inflows offset the saleof lower margin public securities businesses
Notes/Assumptions:1) As at June 30 2) Within the Public Securities Group, we sold a portion of our fixed income business in April 2014 and sold our securitized credit business in June 2016

100
Looking ahead…

101
Private fund fee bearing capital should more than double to $121 billion
$57B1
Outflows
Flagship Funds 2019 - 2021
Flagship Funds 2021 - 2023
Credit, Core & Other
$121B
Notes/Assumptions:1) Opening private fund fee bearing capital as at June 30, 20182) Information presented, including growth in fee bearing capital over the period, is illustrative only. Actual results may vary materially and are subject to market
conditions and other factors and risks that are set out in our Notice to Recipients on Slides 116 through 118
16%CAGR
Private Funds – Fee Bearing Capital($ billions)

102
and listed partnerships’ capitalizationshould increase to over $100 billion
Notes/Assumptions:1) Opening listed partnership fee bearing capital as at June 30, 20182) Information presented, including distribution growth, market valuation and issuances relating to listed partnerships, is illustrative only. Actual results may vary materially and are
subject to market conditions and other factors and risks that are set out in our Notice to Recipients on Slides 116 through 118
$56B1
$101B
Distribution growth (BEP, BIP, TERP)
Market value growth (BPY, BBU)
Issuances
Listed Partnership – Fee Bearing Capital($ billions)
13%CAGR

103
AS AT JUNE 30($ billions) 2018 ~5 Years1
Listed partnership $ 56 $ 101
Private funds 57 121
Public securities 16 23
Fee bearing capital $ 129 $ 245
In aggregate, we expect to increase our fee bearing capital to $245 billion in the next five years
+14%CAGR
Notes/Assumptions:1) Information presented, including growth in fee bearing capital over the period, is illustrative only. Actual results may vary materially and are subject to market conditions and
other factors and risks that are set out in our Notice to Recipients on Slides 116 through 118

104
AS AT JUNE 30($ millions) 20181 ~5 Years2
Base fees $ 1,153 $ 2,500
IDRs 198 550
Other fees 84 150
Fee revenues 1,435 3,200
Direct costs (574) (1,280)
Fee related earnings $ 861 $ 1,920
The increase in fee bearing capital should generate strong growth in fee related earnings
+18%CAGR
Notes/Assumptions:1) Annualized as at June 302) Information presented, including growth in fee related earnings, is illustrative only. Actual results may vary materially and are subject to market conditions and other factors
and risks that are set out in our Notice to Recipients on Slides 116 through 118

105
AS AT AND FOR THE LTM ENDED JUNE 30($ millions) 2018 ~5 Years
Carry eligible capital $ 46,860 $ 111,000
Generated carry, gross1 $ 1,429 $ 2,500
Generated carry, net1 $ 1,007 $ 1,750
And increase our potential to earn carried interest
19%
12%
12%
Notes/Assumptions:1) Information presented, including gross and net generated carried interest on existing and future funds, is illustrative only. Actual results may vary materially and are subject to
market conditions and other factors and risks that are set out in our Notice to Recipients on Slides 116 through 118

106
Growing cash flows significantly increase our invested capital
Notes/Assumptions:1) Opening “Blended” invested capital value as at June 30, 20182) Information presented, including distribution growth, market valuation and issuances relating to listed partnerships, is illustrative only. Actual results may vary materially and are
subject to market conditions and other factors and risks that are set out in our Notice to Recipients on Slides 116 through 118 3) Cash retained includes fee related earnings, invested capital cash flow and dispositions of directly held assets. Accumulated balances are reinvested at 8%4) Capitalization and dividends assumes a constant capitalization level and 7% annual growth in BAM dividends
Invested Capital($ billions)
$42B1
$66B
Capitalization and dividends4
Cash retained –distributions from invested capital3
Cash retained –fee related earnings3Value
appreciation (BPY, BBU)2Distribution
increase (BEP, BIP)2
2018 ~5 years
46
8
13 -7

107
Putting it all together

108
Plan value results in $118 per shareover the next five years…
Notes/Assumptions:1) Information presented is illustrative only. Actual results may vary materially and are subject to market conditions and other
factors and risks that are set out in our Notice to Recipients on Slides 116 through 118. Assumes a 60% margin on fee related revenues and a 70% margin on gross carried interest
2) Illustrative stock price analysis is not intended to forecast or predict future events, but rather to provide information utilized by Brookfield in measuring performance for business planning purposes, based on the specific assumptions and other factors described herein and in our Notice to Recipients on Slides 116 through 118. Actual results and share price performance may differ materially and are subject to market conditions
3) Per share amount calculated using total diluted shares as at June 30, 20184) Includes dividends; total return calculated as compared to public pricing ($42.32 per share as at September 14, 2018)
~5 Years Multiple ~5 Years ($ millions) ($ billions, except
per share amounts)
Asset managerFee related earnings1 $ 1,920 20x $ 38
Generated carried interest, net1 1,750 10x 18
Accumulated carried interest, net 7
63
Asset ownerInvested capital 66
Leverage (10)
56
Total plan value $ 119Plan value per share2,3 $ 118
24%Total
Return4

109
Notes/Assumptions:1) All figures on a per share basis. Calculated using total diluted shares as at June 30, 20182) Current discount to plan value per Slide 693) Information presented, including (i) distribution growth, (ii) market valuation, (iii) issuances relating to listed partnerships, (iv) future fundraising, (v) fee related earnings and (vi)
carried interest estimates, is illustrative only. Actual results may vary materially and are subject to market conditions and other factors and risks that are set out in our Notice to Recipients on Slides 116 through 118
4) Cash retained includes fee related earnings, invested capital cash flow and dispositions of directly held assets. Accumulated balances are reinvested at 8%5) Illustrative stock price analysis is not intended to forecast or predict future events, but rather to provide information utilized by Brookfield in measuring performance for business
planning purposes, based on the specific assumptions and other factors described herein and in our Notice to Recipients on Slides 116 through 118. Actual results and share price performance may differ materially and are subject to market conditions
$1185Cash retained4
Discount to plan value2
…driven by fundraising and investing
Value creation –invested capital3
2018 Market Price
~5 years
Value creation –asset manager3
$42 14
10
31
21
24%Total
Return

110
($ millions) ~5 Years
Fee related earnings1 $ 1,920
Distributions from listed investments2 2,750
Corporate activities3
Corporate costs, cash taxes and other (200)
Corporate interest expense (320)
Preferred share dividends (150)
Cash available for distribution / reinvestment $ 4,000
The cash available for distribution, before carried interest,should more than double in ~5 years
Notes/Assumptions:1) Information presented, including growth in fee related earnings, is illustrative only. Actual results may vary materially and are subject to market conditions and other factors
and risks that are set out in our Notice to Recipients on Slides 116 through 118 2) Distributions from listed investments assumes dividend growth at mid-point of target distribution growth rates3) Corporate activities based on current capitalization per plan and growth in corporate costs of 5%

111
And including realized carried interest, distributable cash should increase to over $5 billion in ~5 years
2018 2019 2020 2021 2022 2023
Cash available for distribution Realized carried interest, net
$4.0$3.3
$2.9$2.5
$1.9
$5.1
1.82.3
2.63.1
3.64.0
Notes/Assumptions:1) Information presented, including net realized carried interest on existing funds, is illustrative only. Actual results may vary materially and are subject to market
conditions and other factors and risks that are set out in our Notice to Recipients on Slides 116 through 118
($ billions)

112
Looking out 10 years…
($ millions)Cumulative~10 Years1
Net cash from:
Fee related earnings $ 20,000
Net invested capital 25,000
Realized carried interest, net 15,000
$ 60,000
Notes/Assumptions:1) Per Brookfield plan, consistent with 5-year plan assumptions

113
This gives us flexibility toreturn substantial capital to shareholders
($ millions)Cumulative~10 Years1
Potential cash generation $ 60,000
Cash investment into listed partnerships (10,000)
Return of capital through dividends2 (10,000)
Available for share repurchases $ 40,000
Notes/Assumptions:1) Per Brookfield plan, consistent with 5-year plan assumptions2) Based on BAM annual dividend growth of 7%

114
We want to leave you with four important points
Our balance sheet is resilient
We are generating almost $2 billion, heading to over $5 billion of annual cash flows
Carry is growing rapidly and is very meaningful
These together should generate $60 billion of cash flow over the next 10 years with few identified uses

115
Q & A

116
Notice to RecipientsBrookfield is not making any offer or invitation of any kind by communication of this document to the recipient and under no circumstances is it to be construed as aprospectus or an advertisement.
Except where otherwise indicated herein, the information provided herein is based on matters as they exist as of the date of preparation and not as of any futuredate, is subject to change, and will not be updated or otherwise revised to reflect information that subsequently becomes available or circumstances existing orchanges occurring after the date hereof.
Unless otherwise noted, all references to “$” or “Dollars” are to U.S. Dollars.
CAUTIONARY STATEMENTS REGARDING FORWARD-LOOKING STATEMENTS AND INFORMATION
This presentation contains “forward-looking information” within the meaning of Canadian and United States securities laws, including United States Private SecuritiesLitigation Reform Act of 1995. Forward-looking statements include statements that are predictive in nature, depend upon or refer to future events or conditions, andinclude statements regarding our and our subsidiaries’ operations, business, financial condition, expected financial results, performance, prospects, opportunities,priorities, targets, goals, ongoing objectives, strategies and outlook, as well as the outlook for North American and international economies for the current fiscal yearand subsequent periods, and include, but are not limited to, statements regarding our asset management. In some cases, forward-looking statements can beidentified by terms such as “expects,” “anticipates,” “plans,” “believes,” “estimates,” “seeks,” “intends,” “targets,” “projects,” “forecasts” or negative versions thereofand other similar expressions such as “Brookfield plan” or “Brookfield estimate,” or future or conditional verbs such as “may,” “will,” “should,” “would” and “could.”
Below are certain of the forward-looking statements that are contained in this presentation and a number of assumptions underlying them.
Where this presentation refers to “gross carried interest” or “carried interest,” carried interest for existing funds is based on June 30, 2018 carry eligible capital andcarried interest for future funds is based on Brookfield’s estimates of future fundraising as at June 30, 2018, as described below. In addition, this presentationassumes that existing and future funds meet their target gross return. Target gross returns are typically 20+% for opportunistic funds; 13% to 15% for value addfunds; 12% to 15% for credit and core plus funds. Fee terms vary by investment strategy (carried interest is approximately 15% to 20% subject to a preferred returnand catch-up) and may change over time. This presentation assumes that capital is deployed evenly over a four-year investment period and realized evenly overthree years of sales. The year in which such sales commence varies by investment strategy and ranges from year 6 to year 10.
Where this presentation refers to “future fundraising,” or “growth in fee bearing capital” we assume that flagship funds are raised every two to three years basedon historical fund series and non-flagship funds are raised annually within certain strategies, and in other strategies every two years. Fund series’ sizes remainconstant and consistent with target funds from period-to-period. This presentation also assumes that distributions are based on fund realizations evenly over threeyears of sales. The year in which such sales commence varies by investment strategy and ranges from year 6 to year 10.
References to “distribution, growth, market valuation, and issuances relating to listed partnerships,” include the following assumptions: (i) BIP, BEP, andTERP grow at a rate equal to the mid-point of their target distribution growth rate, assuming current yield; (ii) the market price to IFRS discount on BPY (see Slide 75)is eliminated; (iii) BBU share price grows at a 10% annual rate; and (iv) total listed partnership capitalization includes issuances related to debt and preferred equityfor BPY, BIP and BEP, based on a debt to total capitalization ratio of 20-30%.
Where this presentation refers to “fee related earnings,” fee related earnings from listed partnerships and private funds are based on fee bearing capital increasingin accordance with Slide 103. The listed partnership management fees for BPY, BEP and TERP are fixed fees on initial capitalization and an additional fee of 1.25%on the amount in excess of initial capitalization. Management fees for BIP and BBU are 1.25% of total capitalization. Fee terms for private funds vary by investmentstrategy (generally, within a range of approximately 1-2%). The incentive distribution rights of the listed partnerships are based on a mid-point of the applicable listedpartnership’s distribution growth rate as described above. Other fees include the BBU performance fee assuming a 10% BBU annual share price growth. Fee relatedearnings assumes a margin of 60%.

117
Notice to Recipients cont’d
Although we believe that our anticipated future results, performance or achievements expressed or implied by the forward-looking statements and information arebased upon reasonable assumptions and expectations, the reader should not place undue reliance on forward- looking statements and information because theyinvolve known and unknown risks, uncertainties and other factors, many of which are beyond our control, which may cause our and our subsidiaries’ actual results,performance or achievements to differ materially from anticipated future results, performance or achievements expressed or implied by such forward-lookingstatements and information.
Factors that could cause actual results (including, among other things, carried interest; future fundraising; growth in fee bearing capital; growth in distribution, marketvaluation, and issuances relating to listed partnerships; and fee revenues and earnings) to differ materially from those contemplated or implied by forward-lookingstatements include, but are not limited to: lower than target investment returns; the impact or unanticipated impact of general economic, political and market factorsin the countries in which we do business; the fact that our success depends on market demand for our products; the behavior of financial markets, includingfluctuations in interest rates and foreign exchanges rates; changes in inflation rates in North America and international markets; the performance of global equity andcapital markets and the availability of equity and debt financing and refinancing within these markets; strategic actions including dispositions; the competitive marketfor acquisitions and other growth opportunities; our ability to satisfy conditions precedent required to complete such acquisitions; our ability to effectively integrateacquisitions into existing operations and attain expected benefits; the outcome and timing of various regulatory, legal and contractual issues; changes inaccounting policies and methods used to report financial condition (including uncertainties associated with critical accounting assumptions and estimates); the effectof applying future accounting changes; business competition; operational and reputational risks; technological change; changes in government regulation andlegislation within the countries in which we operate; changes in tax laws; catastrophic events, such as earthquakes and hurricanes; the possible impact ofinternational conflicts and other developments including terrorist acts and cyberterrorism; and other risks and factors detailed from time to time in our documents filedwith the securities regulators in Canada and the United States.
We caution that the foregoing list of important factors that may affect future results is not exhaustive. When relying on our forward-looking statements, investors andothers should carefully consider the foregoing factors and other uncertainties and potential events. Except as required by law, we undertake no obligation to publiclyupdate or revise any forward-looking statements or information in this presentation, whether as a result of new information, future events or otherwise.
CAUTIONARY STATEMENT REGARDING INVESTMENT PERFORMANCE
Past performance is not necessarily indicative of future results and there can be no assurance that comparable results will be achieved, that an investment will besimilar to the historic investments presented herein (because of economic conditions, the availability of investment opportunities or otherwise), that targeted returns,diversification or asset allocations will be met or that an investment strategy or investment objectives will be achieved. Any information regarding prior investmentactivities and returns contained herein has not been calculated using generally accepted accounting principles and may not have been audited or verified by anauditor or any independent party. Unless otherwise indicated, internal rates of return (including targeted rates of return) are presented on a “gross” basis (i.e., theydo not reflect management fees (or equivalent fees), carried interest (or incentive allocation), taxes, transaction costs and other expenses to be borne by investors,which in the aggregate are expected to be substantial).
Any changes to assumptions could have a material impact on projections and actual returns. Actual returns on unrealized investments will depend on, among otherfactors, future operating results, the value of the assets and market conditions at the time of disposition, legal and contractual restrictions on transfer that may limitliquidity, any related transaction costs and the timing and manner of sale, all of which may differ from the assumptions and circumstances on which the valuationsused in the prior performance data contained herein are based. Accordingly, the actual realized returns on unrealized investments may differ materially from thereturns indicated herein.

118
Notice to Recipients cont’d
TARGET RETURNS
The target returns set forth herein are for illustrative and informational purposes only and have been presented based on various assumptions made by Brookfield inrelation to the investment strategies being pursued by the funds, any of which may prove to be incorrect. Target gross returns do not reflect fund expenses,management fees (or equivalent fees) and carried interest. Target net returns take into account these items. Due to various risks, uncertainties and changes(including changes in economic, operational, political or other circumstances) beyond Brookfield’s control, the actual performance of the funds could differ materiallyfrom the target returns set forth herein. In addition, industry experts may disagree with the assumptions used in presenting the target returns. No assurance,representation or warranty is made by any person that the target returns will be achieved, and undue reliance should not be put on them. Prior performance is notindicative of future results and there can be no guarantee that the funds will achieve the target returns or be able to avoid losses.
CAUTIONARY STATEMENT REGARDING USE OF NON-IFRS MEASURES
This presentation contains references to financial metrics that are not calculated in accordance with, and do not have any standardized meaning prescribed by,International Financial Reporting Standards (“IFRS”). We believe such non-IFRS measures including, but not limited to, funds from operations (“FFO”) and investedcapital, are useful supplemental measures that may assist investors and others in assessing our financial performance and the financial performance of oursubsidiaries. As these non-IFRS measures are not generally accepted accounting measures under IFRS, references to FFO and invested capital, as examples, aretherefore unlikely to be comparable to similar measures presented by other issuers and entities. These non-IFRS measures have limitations as analytical tools. Theyshould not be considered as the sole measure of our performance and should not be considered in isolation from, or as a substitute for, analysis of our financialstatements prepared in accordance with IFRS. For a more fulsome discussion regarding our use of non-IFRS measures and their reconciliation to the most directlycomparable IFRS measures refer to our documents filed with the securities regulators in Canada and the United States.
OTHER CAUTIONARY STATEMENTS
Certain of the information contained herein is based on or derived from information provided by independent third-party sources. While Brookfield believes that suchinformation is accurate as of the date it was produced and that the sources from which such information has been obtained are reliable, Brookfield does notguarantee the accuracy or completeness of such information and has not independently verified such information or the assumptions on which such information isbased. This document is subject to the assumptions (if any) and notes contained herein.
The information in this document does not take into account your investment objectives, financial situation or particular needs and nothing contained herein shouldbe construed as legal, business or tax advice. Each prospective investor should consult its own attorney, business adviser and tax advisor as to legal, business, taxand related matters concerning the information contained herein.

Brookfield Asset Management
INVESTOR DAY
SEPTEMBER 26 , 2018