burgan bank a presentation · financial highlights & transactional growth performance content ....
TRANSCRIPT

BURGAN BANK AŞ PRESENTATION
KUWAIT - TURKEY - IRAQ - JORDAN - ALGERIA - TUNISIA
December 2012

Macroeconomic and Banking Sector Outlook
Burgan Bank at a Glance
Financial Highlights & Transactional Growth Performance
Content

Macro Economic Environment
Macro Forecasts 2009 2010 2011 2012F 2013F
Nominal GDP (TRY mln) 952.6 1098.8 1298.1 1426.3 1595.1
Nominal GDP (USD mln) 615.8 733.2 776.1 796.0 878.8
GDP Growth -4.8% 9.2% 8.5% 2.5% 4.5%
Exchange Rate - TRY/ USD (eop) 1,4873 1,5376 1,8889 1,7776 1,8520
Exchange Rate - TRY / USD (yoy change ,
eop) -2.3% 3.4% 22.8% -5.9% 4.2%
Exchange Rate - TRY/ USD (avg) 1,5469 1,4986 1,6725 1,7918 1,8151
Exchange Rate - TRY / USD (yoy change ,
avg) 19.1% -3.1% 11.6% 7.1% 1.3%
CPI Inflation (eop) 6.5% 6.4% 10.4% 6.2% 6.5%
CPI Inflation (avg) 6.3% 8.6% 6.5% 8.9% 6.9%
PPI Inflation (eop) 5.9% 8.9% 13.3% 2.5% 6.0%
PPI Inflation (avg) 1.2% 8.5% 11.1% 6.1% 4.3%
CBT Policy Rates (O/N, eop) 6.5% 6.5% 9.04% 5.55% 6.25%
Yields on Benchmark Bond (eop) 9.06% 7.08% 11.04% 6.18% 7.25%
Source: TURKSTAT, CBT, Turkish Treasury, Burgan Yatırım Menkul Değerler AŞ

GDP Growth Rates
PMI
Growth: GDP Movements
Economic Activity
Economic growth has slowed down to 2.5% in
2012, according to our calculations, from 8.5% in
2011. The Turkish economy, which expanded only by 2.6%
yoy in 9M12, is estimated to have registered c.2% yoy
growth in 4Q12.
Net exports were the main driver of growth throughout
2012, albeit to a milder extent in 2H12. In real terms,
exports rose by 17.9% yoy, while imports increased merely
by 0.4% yoy in 2012.
Private consumption and investments, on the other hand,
kept contracting as of 9M12; and have likely remained
subdued in 4Q12 -- if not contracted further.
Despite a revival in some leading indicators and on
the consumption side, hard data fail to indicate a
visible recovery as of 1Q13. This appears to reinforce the
prevailing perception that increased consumption is currently
being met by inventories, rather than production increases.
We maintain our 2013 GDP growth forecast at 4.5%,
assuming accommodative monetary policy will continue in
1H13.

Banking Sector – General Overview
Overview
As of December 31, 2012, there were 49 banks operating in Turkey, with a combined network of 11,066
domestic and foreign branches
The sector employs 201,474 individuals (ca. 1% of total employment)
Total asset size amounted to TRY 1.371bn as of December 31, 2012, of which ca. 57.97% were invested in
loans
Depository banks hold ca. 91% of the financial system’s market share in terms of assets
Approximately 90% of depository banks are private and hold 73% of total depository bank’s loans
Overview
There are 3 main bodies and institutions which are responsible for supervising and inspecting the financial
system:
The Banking Regulation and Supervision Agency (“BRSA”), which began its operations in 2000, oversees
the environment in which banks and financial institutions operate
The Central Bank of Turkey (“CBT”), aims to ensure stability in the financial system by regulating the
money markets, protecting the value of the Turkish lira and determining the inflation target. It is responsible
for setting the rediscount ratios and determining the reserve and liquidity requirements for the banking
sector
The Capital Markets Board of Turkey (“CMB”) is the regulatory and supervisory authority in charge of the
securities markets
Although not a regulatory body The Banks Association of Turkey is a prominent professional organisation,
founded in 1958, with the aim of preserving the rights and benefits of banks as well as maintaining growth and
fair competition within the sector.

Banking Sector – Ranking
Positioned within the Top 20 Banks in Turkey
Number of Branches Total Assets (TRY bn) Total Loans(3) (TRYbn)
741
807
1510
27
44
63
88
272
510
922
928
963
1234
27
37
60
320
331
530
600
0 500 1000 1500 2000
Turkland Bank
Fiba Banka
Citibank
Tekstil Bankası
#16 Burgan Bank
Alternatif Bank
Anadolu Bank
Şekerbank
ING Bank
HSBC Bank
Türk Ekonomi Bankası
Finans Bank
Denizbank
Vakıflar Bankası
Halk Bankası
Yapı ve Kredi Bankası
Garanti Bankası
Akbank
İş Bankası
Ziraat Bankası
98.2
102.1
154.7
3.1
3.5
7.2
7.9
14.7
42.5
118.2
150.2
154.5
166.8
2.6
4.3
7.9
23.1
25.8
40.4
49.9
0 50 100 150 200
Turkland
Fiba Bank
Tekstil Bankası
#17 Burgan Bank
Anadolu Bank
Alternatif Bank
Citibank
Şeker Bank
ING Bank
HSBC Bank
Denizbank
Türk Ekonomi Bankası
Finans Bank
Vakıflar Bankası
Halk Bankası
Yapı ve Kredi Bankası
Akbank
Garanti Bankası
Ziraat Bankası
İş Bankası
State Owned Domestic Foreign Owned
63
64.3
68.4
2.5
2.7
4.1
5
9.4
28.9
72.6
85.4
89
98.5
1.9
2.9
3.2
15.4
17.7
26.2
35
0 50 100 150
Turk Land
Tekstil Bankası
Fibabank
#17 Burgan Bank
Citibank
Anadolu Bank
Alternatif Bank
Şeker Bank
HSBC Bank
ING Bank
Denizbank
Türk Ekonomi Bankası
Finans Bank
Halk Bankası
Vakıflar Bankası
Ziraat Bankası
Yapı ve Kredi Bankası
Akbank
Garanti Bankası
İş Bankası
(1) Latest available. (2) Includes Promissory Notes. (3) Total loans and receivables = loans and receivables + loans under follow up - specific provisions.
Source: The Banks Association of Turkey (September 2012 statistical report - unconsolidated);
(2)
(1)
Banking Sector – Recent Developments
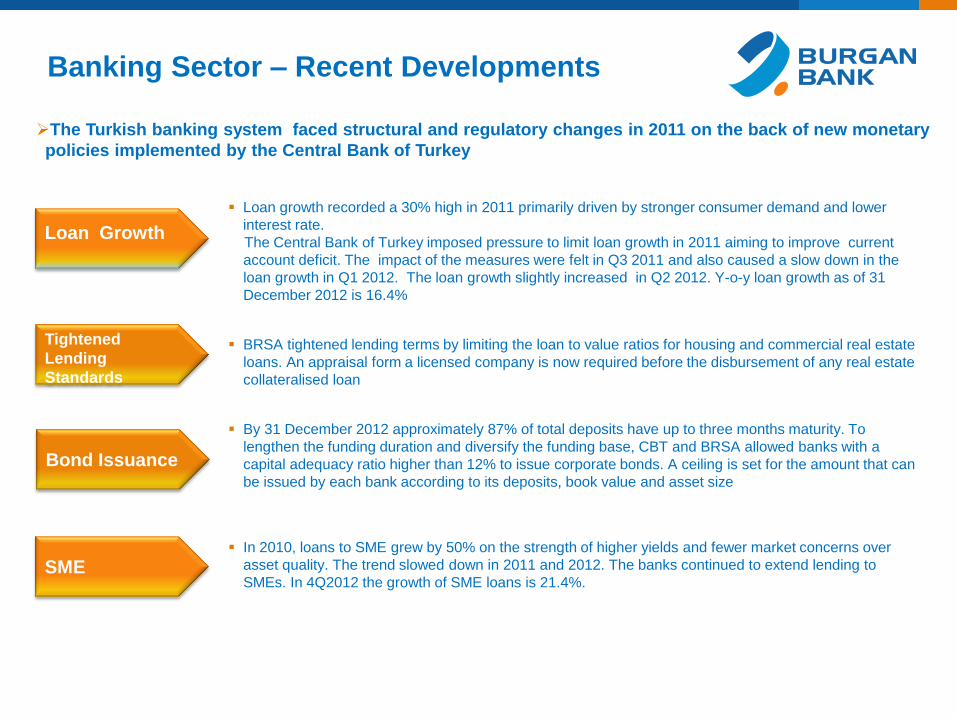
The Turkish banking system faced structural and regulatory changes in 2011 on the back of new monetary
policies implemented by the Central Bank of Turkey
Loan growth recorded a 30% high in 2011 primarily driven by stronger consumer demand and lower
interest rate.
The Central Bank of Turkey imposed pressure to limit loan growth in 2011 aiming to improve current
account deficit. The impact of the measures were felt in Q3 2011 and also caused a slow down in the
loan growth in Q1 2012. The loan growth slightly increased in Q2 2012. Y-o-y loan growth as of 31
December 2012 is 16.4%
BRSA tightened lending terms by limiting the loan to value ratios for housing and commercial real estate
loans. An appraisal form a licensed company is now required before the disbursement of any real estate
collateralised loan
By 31 December 2012 approximately 87% of total deposits have up to three months maturity. To
lengthen the funding duration and diversify the funding base, CBT and BRSA allowed banks with a
capital adequacy ratio higher than 12% to issue corporate bonds. A ceiling is set for the amount that can
be issued by each bank according to its deposits, book value and asset size
In 2010, loans to SME grew by 50% on the strength of higher yields and fewer market concerns over
asset quality. The trend slowed down in 2011 and 2012. The banks continued to extend lending to
SMEs. In 4Q2012 the growth of SME loans is 21.4%.
Loan Growth
Tightened
Lending
Standards
Bond Issuance
SME

6.2%5.2% 5.2%
5.0%5.8%
4.6%
3.5% 4.1%
'05 '06 '07 '08 '09 '10 '11 '12
NIM (%)
57.0%
40.0%30.0%
29.0%
7.0%
34.0%29.9%
16.6%
'05 '06 '07 '08 '09 '10 '11 '12
5.0%
4.0%
3.0%4.0%
5.0%
4.0%
2.7% 2.9%
'05 '06 '07 '08 '09 '10 '11 '12
Gross NPLs / Total Loans (%)
Banking Sector – Key Metrics
Source: Banking Regulation and Supervision Agency.
Loan Growth (%)
89.0% 90.0%87.0%
80.0% 84.0% 84.0%82.0%
75,2%
'05 '06 '07 '08 '09 '10 '11 '12
12.0%
21.0%
25.0%
19.0%
23.0%
20.0%
15.5% 11.0%
'05 '06 '07 '08 '09 '10 '11 '12
Deposit Growth (%)
Provisions / Gross NPLs (%)
39%36%
41%35%
46% 46%
54% 55%
23% 26%37%
33%42%
45%53%
57%
'05 '06 '07 '08 '09 '10 '11 '12
24.0% 22.0%19.0%18.0%
21.0%19.0%
16.6% 17.9%
'05 '06 '07 '08 '09 '10 '11 '12
Loans and Deposits to GDP (%)
CAR (%)
12.0%
21.0%
25.0%
19.0%
23.0%20.0%
15.5% 15,7%
'05 '06 '07 '08 '09 '10 '11 '12
ROE (%)
1.7%
2.5%2.8%
2.0%
2.6%2.4%
1.7%2,4%
'05 '06 '07 '08 '09 '10 '11 '12
ROA (%)

Macroeconomic and Banking Sector Outlook
Burgan Bank at a Glance
Financial Highlights & Transactional Growth Performance
Content

Shareholders and Group Structure
Stable shareholders base and lean group structure
Shareholders Structure Group Structure
Other Minority
Interests(1)
• Brokering business of the Group
• Burgan Yatırım Menkul Değerler AŞ
is one of Turkey’s leading
investment houses and operates in
the following areas:
i. Intermediation on the Istanbul
Stock Exchange and Turkish
Derivatives Exchange
transactions;
ii.Corporate finance;
iii.Market and macroeconomic
researches;
iv.Asset management
• Leasing Business of the Group
• Burgan Leasing collaborates
closely with Burgan Bank,
supporting SMEs as well as Large
Corporate clients
• The company has built long-
standing client relationships in
several sectors including
construction, manufacturing,
agriculture and medicine
The transfer of 99.26% of the shares of the bank to Burgan Bank
S.A.K., Kuwait has been completed on December 21, 2012.
Name changed to Burgan Bank AŞ on January 28, 2013 .
Burgan Bank AŞ and its subsidiaries (Burgan Yatırım Menkul
Değerler & Burgan Leasing) are fully owned subsidiaries of
Burgan Bank S.A.K., Kuwait as of December 21, 2012.
(1) Minority shareholders, mostly individuals stemming from the shareholders’ structures of Tekfen Investment Bank and BankEkspres.

Established in 1977 in Kuwait
Member of the KIPCO Group - one of the largest holding companies in
the Middle East and North Africa with over 60 companies operating
across 26 countries
A footprint spread over the MENA region with a network of 145 branches across 5 countries
Listed on the Kuwait Stock Exchange with a market cap of US$ 2.3 bn
Five majority owned subsidiaries operating in :
Turkey
Algeria
Iraq
Jordan
Tunis
BURGAN BANK SAK
Burgan Bank Group FY 11 FY 12
Revenue Growth (YoY) (0.9)% 16.4%
Operating Profit Growth (YoY) 2.4% 16.6%
Operating Profit Margin 62.4% 62.6%
Cost to Income Ratio 37.6% 37.4%
Jaws Ratio (YoY) 5.0% 0.5%
Loans to Cust. Deposits 80.6% 86.9%
Liquidity Ratio(2) 40.2% 31.5%
NPL to Gross Loans 11.5% 7.1%
NPL net of Collateral to Gross Loans 3.1% 1.9%
ROE 12.0% 12.4%
ROTE 21.1% 20.2%
Rating
Key Indicators(1)
Bank Sovereign
Moody’s A3 Aa2
S&P BBB+ AA
(1) Figures are reported after consolidation adjustments
(2) Liquid assets comprises of Cash&Cash eq. , Treasury bills&bonds and due from Banks&OFIS

Corporate Governance and
Organisational Structure
Board of Directors Risk Management
Group
Internal Audit & Control
Audit Committee
Credit Committee
Risk Committee
Remuneration
Committee
Chief Executive Officer
ExCo
Ethics Committee
A&L Committee
Loan & Products
Committee
Senior Deputy CEO Executive Vice
President Executive Vice
President
Executive Vice
President
Executive Vice
President
Executive Vice
President
Executive Vice
President CFO Legal Council Executive Vice
President
Burgan Leasing
GM
Burgan Yatırım
Menkul Değerler
AŞ Wholesale Banking
Retail Banking Private Banking Treasury & Capital
Markets
Financial Control &
Budget Planning Operations
Information
Technologies
Human
Resources Legal Department Credit Approval
Service& Support
Businesses

Financial Highlights (BRSA Consolidated, 31 December 2011; mln TRY)
Total Assets : 5,136
Loans (1) : 2,702
Deposits : 2,175
Securities : 1,382
Equity : 680
Net Profit : 25
# of Branches : 59
# of Employees : 1,041
Capital Adequacy : 15.54%
Tier I Capital : 14.87%
Burgan Bank At a Glance
Financial Highlights (BRSA Consolidated, 31 December 2012; mln TRY)
Total Assets : 4,643
Loans (1) : 3,293
Deposits : 3,189
Securities : 441
Equity : 659
Net Profit(2) : 29
# of Branches : 60
# of Employees : 1,070
Capital Adequacy : 15.76%
Tier I Capital : 14.72%
(1) Including Factoring and Leasing Receivables
(2) underlying profit excluding one-off goodwill write-off amounting to 64mln TRY

Distribution Network - Overview
Growing distribution network. Doubled since 2006
60 branches in the main Turkish cities(1)
• 12 branches opened in 2010 and 6 branches to today
• Further potential for increase in volumes and deposits once branches are at full capacity
─ Approx. 3Y for a branch to reach full capacity
Burgan Bank is
present in number
of key cities / areas
which together
account for ca. 90%
of the Turkish
economy
Istanbul
Konya
İzmir
Bursa
Kocaeli
Antalya
Ankara
Adana
Manisa
Denizli
Mersin
Mugla
Aydın
Balikesir
Diyarbakır
Gaziantep
Eskisehir
Hata
y
K.Mara
ş
Kayseri
Samsun Tekirda
g
Şanlıurf
a
Zonguldak
Çanakkal
e
Rize
Uşak Afyo
n Aksara
y
Trabzon Bolu Çoru
m
Ispa
rta
Karabük
Karam
an
Kırklare
li
Kütahy
a
Malatya
Ordu
Osmaniye
Sivas Yozga
t
Niğde
Kırşehi
r
Çankırı
Kastamo
nu
Coverage
Penetration of Turkish Economy
Deposits: 92%
Loans: 86%
Exports: 87%
Imports: 94%
31 36 42 42 54 59 60
2006 2007 2008 2009 2010 2011 2012
Historical Branch Evolution
+5 +6
+12 +5 +1
Alternative Distribution Channels
• Internet Banking
• Phone Banking
• ATMs
- 60 unit own network, part of national ATM
sharing agreement
(1) Including free trade zone and central large corporate branch

Subsidiaries: Burgan Leasing
Burgan Finansal Kiralama AŞ (Burgan Leasing) is
wholly owned subsidiary of Burgan Bank A.Ş.
Leasing activities started in 1989 within the
organization of Tekfen Finance and Investment
Bank
Became a seperate company in 2001 under the
name of Tekfen Finansal Kiralama A.Ş.
The name of the company changed to EFG
Finansal Kiralama A.Ş. in 2008.
The name of the company changed to Burgan
Leasing in 2013 after the acquisition of Burgan
Bank A.Ş. by Burgan Bank S.A.K., Kuwait
Burgan Leasing main highlights in the sector :
1st in the peer group (5th overall) with
“Lease Receivables / Total Assets” ratio
87%.
Sector average is 84%.
Lowest NPL ratio in the sector with 3.86%.
Sector Average is 7.24%
4th in the peer group (9th overall) with ROE
12.5%.
2nd in the peer group (9th overall) in
Net Receivables / Number of Employees
with net receivables of USD 6,906,630 per
employee.
Portfolio size is USD 138.1 mln and is well
diversified in terms of tenor and sectors
exposed.

Subsidiaries:
Burgan Yatırım Menkul Değerler AŞ
Burgan Securities is wholly owned subsidiary of Burgan
Bank A.Ş.
Burgan Yatırım Menkul Değerler is a brokerage compnay
providing :
Corporate finance advisory,
Institutional brokerage,
Research and
Asset management services.
Founded in 2001 as HC Istanbul.
Acquired by EFG Eurobank in April 2005. In
2007 became a subsidiary of Eurobank
TekfenA.Ş. and the name changed to EFG
Istanbul Securities.
The name of the company changed to Burgan
Securities in 2013 after the acquisition of
Burgan Bank A.Ş. by Burgan Bank S.A.K.,
Kuwait
Burgan Securities Shareholder’s Equity
(US$ mln)
Burgan Securities Transaction Volume
(US$ bln)
3.2 3.9 8.0
17.5
27.6
47.4 53.1
61.6 66.9
45.7
37.2
2002 2003 2004 2005 2006 2007 2008 2009 2010 2011 2012
US$ 37
million
0.9 1.6 4.4
10.6 12.6
34.7 37.0
23.1
41.7
36.2
26.1
2002 2003 2004 2005 2006 2007 2008 2009 2010 2011 2012
US$ 26
billion
Audited, IFRS ISE and TURKDEX Volume

General Overview
A mid-size bank with a focus on the corporate segment and a fast growing presence in selective retail
business leveraging mainly on corporate owners, suppliers, executives and employees of corporate
clients
Targets mainly commercials with the aim to grow corporate business and to
develop cross selling opportunities. The division contributes with TRY 2.8 bn of
total loans and TRY 2.0bn of deposits
Targets Small and Medium Enterprises and related retail customers focusing mainly
on affluent customers and leveraging on SME’s owners, suppliers and employees.
The division contributes with TRY 0.49bn of total loans and TRY 0.19bn of deposits
Encompasses three main business lines:
i) Treasury Sales to Institutional, Corporate and household clients; ii) Trading and
Investment Portfolios; iii) Asset & Liability Management
One of the major players in local Fixed Income market, very active player in FX markets
and one of the most successful Treasury Sales Teams in Turkey
Leading investment house providing equity brokerage (7.47% market share in terms of
foreign investors volumes traded on the Turkish Derivatives Exchange and 3.02% market
share in terms of foreign investors volumes traded on the Istanbul Stock Exchange as of
February 2013). Expanding Advisory and Asset Management activities
Burgan Bank operates through an integrated business model, able to respond with success to the increasing number of
customers and transaction volume
Customer Centric Segmentation and proactive Coverage
Wide and high value added banking products and services
60 modern and fully refurbished branches located in 21 leading industrial and business cities across the country
Newly implemented, highly scalable IT system
Experienced and well regarded senior management
Commercial
Banking
Private
Banking
SME
Banking
Treasury
& Capital
Markets
Equity
Brokerage

Distribution Network (1)
Business Dev.
& Marketing
• Segment
Marketing
• Lead
Generation
• Reporting &
Co-ordination
Credit & Risk
Centralized
Operations
Center
Large Corporate
Branch 1
1
Business Centres
8
Combo Branch
36
Retial Branch
14..
Alternative
Channels
Description:
Based in Istanbul
(at Head Office)
Dedicated EVP
for the branch
Segment Served:
Large Corporates
Only
Description:
SME- focused
branches with no
retail banking
operations
Generally upper-
floor locations,
particularly for
new BCs
Segment Served:
SMEs
Private Banking
Description:
Combined
branches
containing
both corporate
and retail
banking with
shared operations
Segment Served:
SMEs
SBBs
Individuals
Description:
Small Business
and Personal
Banking focused
branches
providing only
retail banking
services
Segment Served:
SBBs
Individuals
Description:
Internet Banking
New platform
launched in 2010 with
additional functionality
and superior security
Telephone Banking
Phone banking
financial trans.
enabled since July
2011
Outbound call
functionality to support
cross-sell efforts
ATMs
Current network
composed by 59 EMV
compatible units
Enhanced functionality
enabling financial
transactions such as
FX Mutual Fund,
Credit Card and other
transactions
Targeted servicing and distribution model with branches dedicated to Wholesale and Retail to respond better to the
different needs
Factoring
Leasing
Treasury &
Capital Market
Trade
Finance
Cash
Management
Brokerage /
Asset Mngmnt
Private
Banking
Servicing Model Model
Served through RMs or through Head Office upon direct request from customers
(1) Excludes free trade zone.

19
Commercial
Segment / Threshold(1)
SME (Mid and
Micro Corporates)
Segment profile
• Major industrial and service companies, including large
conglomerates and their subsidiaries, multinationals
and state-owned enterprises
• They have an institutional structure with professional
management
• This segment represents ~75% of exports and 15-20%
of GDP
• Generally low capitalized, mid-sized
manufacturing, retail and distribution companies
• Usually need external financing to finance growth
• Organizational structure semi-professional, yet
owners are typically involved in day to day
management
• Typically domestic trade, service and small
manufacturing companies operating locally
• Managed directly by the owners; company and
owner wallet are inseparable
• Relatively high level of unregistered sales
Strategy
• 4.5 – 65 mln
(1)Thresholds are indicative. Client segmentation and respective coverage would be an annual exercise based on client profile, needs and behavior
(2) Includes smaller subsidiaries of large conglomerates
USD, Annual turnover
Focus
Become “Home Bank”
~100k companies
~2 mln companies
Coverage(1)
Covered by
Small and
Medium
Enterprise
Banking Unit
Covered by
Large
Corporates
Unit
Covered by
Commercial
Banking Unit
• Very large corporates and/or conglomerates with
international operations and relations with major
global financial institutions
~ 2k(2) companies
Corporate
• > 65 mln Maintain EVA-
positive relationship
Be among top-5
banks
Be among top-3
banks
4.5 mln USD
Mainly focusing on Commercial customers within an annual turnover range of 4.5-65 mln USD and SME
customers within an annual turnover below 4.5 mln USD
Segment Focus
65 mln USD
13 mln USD

Macroeconomic and Banking Sector Outlook
Burgan Bank at a Glance
Financial Highlights & Transactional Growth Performance
Content
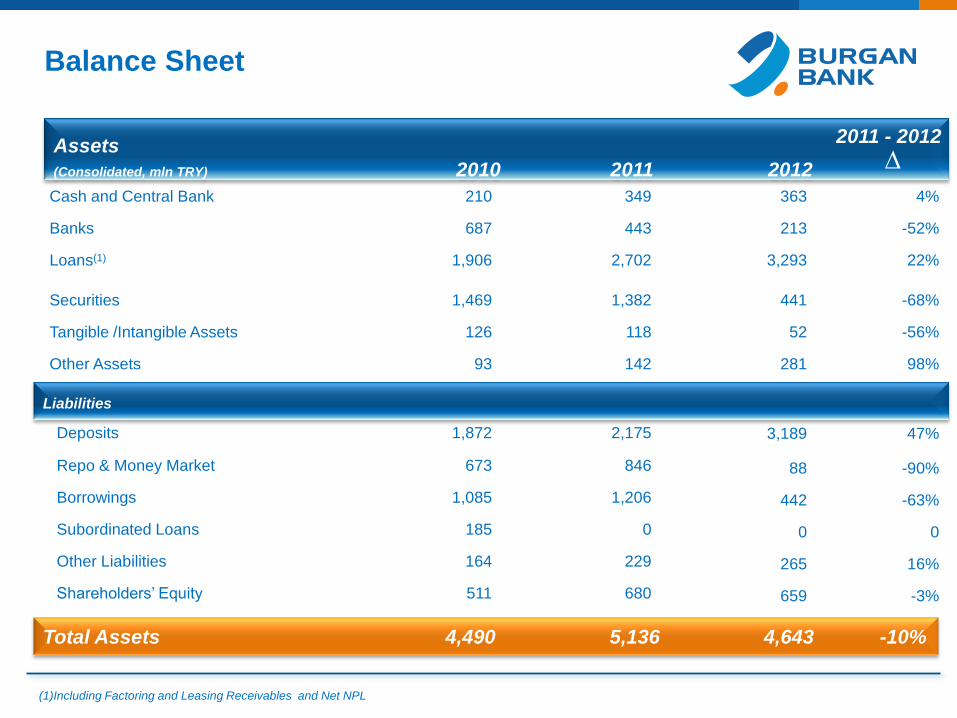
Cash and Central Bank 210 349 363 4%
Banks 687 443 213 -52%
Loans(1) 1,906 2,702 3,293 22%
Securities 1,469 1,382 441 -68%
Tangible /Intangible Assets 126 118 52 -56%
Other Assets 93 142 281 98%
Deposits 1,872 2,175 3,189 47%
Repo & Money Market 673 846 88 -90%
Borrowings 1,085 1,206 442 -63%
Subordinated Loans 185 0 0 0
Other Liabilities 164 229 265 16%
Shareholders’ Equity 511 680 659 -3%
4, 4
Balance Sheet
(1)Including Factoring and Leasing Receivables and Net NPL
Liabilities
Total Assets 4,490 5,136 4,643 -10%
Assets
(Consolidated, mln TRY) 2010 2011 2012
2011 - 2012
∆

Interest on Loans 166 215 355 65%
Interest on Securities Portfolio 193 109 67 -39%
Interest on Money Market Transactions 53 75 41 -45%
Interest on Mandatory Reserves & Other Interest Inc. 21 57 54 -7%
Interest on Deposits -112 -132 -211 60%
Interest on Funds Borrowed -142 -96 -61 -36%
Interest on Repo and Money Market Transcations -39 -58 -23 -60%
Other Interest Expense -21 -42 -24 -43%
Provision for Loans -20 -20 -42 110%
Derivative and Foreign Exchange Profit/Losses 1 4 13 225%
Profit/Losses on trading account securities 26 39 10 -74%
Net Fees and Commisions Income 59 55 34 -38%
Other Income 9 8 13 63%
Tax Provision -8 -9 -8 -11%
TOTAL INTEREST INCOME 433 456 516 13%
TOTAL INTEREST EXPENSE -315 -328 -319 3%
NET INTEREST INCOME 118 128 197 54%
NET INTEREST INCOME AFTER PROVISIONS 98 108 155 44%
TOTAL OPERATING INCOME AFTER PROVISIONS 193 214 225 5%
TOTAL OPERATING EXPENSE -155 -180 -188 4%
PROFIT / LOSS BEFORE TAX 38 34 37 9%
NET PROFIT 30 25 29(1) 16%
P&L
Consolidated, mln TRY 2010 2011 2012
Income Statement
2011 - 2012
∆
(1) underlying profit excluding one-off goodwill write-off amounting to 64mln TRY

Ratio Analysis
•Burgan Bank has a 15.76%
Capital Adequacy Ratio
• Loan to deposit ratio is 103.3%
as of 2012 year end.
• Due to expansion strategies
and infrastructural
investments, Cost/Income ratio
deteriorated after 2010. The cost
income ratio started to
improve since 1Q 2012 and
decreased to 70.4% as of 2012
year end
Strong capital and liquidity
ratios
(1) Consolidated figures (2) Including factoring and leasing receivables and net NPL
(3) Equity excluding goodwill (4) excluding goodwill write-off
Capital Adequacy Ratio 18.7% 15.5% 15.76%
Loan(2) / Deposit Ratio 101.8% 124.2% 103.3%
NPL Ratio 6.2% 4.1% 5.2%
ROAE(3) 6.96% 4.78% 4.55%
ROAA(3) 0.72% 0.54% 0.60%
Provision Coverage 57.3% 67.3% 63.1%
Cost/Income Ratio 72.6% 76.9% 70.4%(4)
Key Ratios(1) 2010 2011 2012

Capital
+ CORE CAPITAL 403,339 583,339 612,806
+ SUPPLEMENTARY CAPITAL 156,227 25,825 43,352
(-) DEDUCTIONS FROM CAPITAL -383 -362 -340
A SHAREHOLDERS EQUITY (Capital Base) 559,183
609,351 655,818
B AMOUNT SUBJECT TO CREDIT RISK 2,519,417 3,512,283 301,276
C AMOUNT SUBJECT TO MARKET RISK 183,850 87,825 5,913
D
AMOUNT SUBJECT TO OPERATIONAL RISK 293,423 320,994 25,628
CAPITAL ADEQUACY RATIO
(A/(B+C+D) )
TIER I
2010
Consolidated
2011
Consolidated
2012
Consolidated
18.67% 15.54% 15.76%
13.45% 14.87% 14.72%
Capital

Funding Structure: Burgan Bank
As of 2012YE, Burgan Bank’s main funding sources are Customer Deposits, Money
Market Deposits and Borrowings representing 80% of total liabilities and deposits
representing 68.7% of total liabilities
Deposits 1,780 1,872 2,175 3,189
Borrowings 1,049 1,085 1,206 442
Money Markets (repo) 422 673 846 88
Subordinated Loans 185 185 0 0
Other Liabilities 118 164 229 265
Shareholders' Equity 489 511 680 659
Total Liabilities 4,045 4,490 5,136 4,643
Consolidated mln TR Dec-09 Dec-10 Dec-11 Dec-12
0
0,1
0,2
0,3
0,4
0,5
0,6
0,7
0,8
0,9
1
Dec 09 Dec 10 Dec 11 Dec 12
44.0% 41.7% 42.3%
68.7%
25.9%24.2% 23.5%
9.5%10.4% 15.0% 16.5%
1.9%
4.6% 4.1%
Subordinated Loans Money Markets (repo) Borrowings Deposits

Asset Quality
10.1 10.2 10.3
7.2
6.25.7
4.8 4.2 4.1 4.3 4.2 4.7
5.2
4Q09 1Q10 2Q10 3Q10 4Q10 1Q11 2Q11 3Q11 4Q11 1Q12 2Q12 3Q12 4Q12
NPL Ratio
53.2% 54% 53.3%
48.3%
57.3%
62.6% 62.9% 63.4%67.3%
63%62.7% 60.9%63.1%
0
10
20
30
40
50
60
70
80
4Q09 1Q10 2Q10 3Q10 4Q10 1Q11 2Q11 3Q11 4Q11 1Q12 2Q12 3Q12 4Q12
Provisions
Non Performing Loans Ratio Coverage Rate of Provisions
Asset Quality
Specific provisioning is in line with BRSA regulations
NPL Ratio is 5.2 % as of 4Q2012

Growth
(1) Underlying profit excluding one-off goodwill write-off amounting to 64mln TRY
(2) Including Factoring and Leasing receivables and net NPL; all graphs in mln TRY
9351,229
1,533
1,906 2,702 3,293
Total Loans(2)
31.5%
24.7%
24.4%
1,148
1,7181,780 1,872
2,1753,189
49.6%
3.6% 5.2%
2,807
3,587
4,0454,490
4,643
27.8%
12.7% 11%
26.7 40.1 36.9 30.425.4 29(1)
50.1% -7.9% -7.8%
Net Profit
Total Deposits
14.4%
-16.3%
41.8%
16.2%
5,136
Assets -9,60%
46.6%
14.1%
21.9%
.....Continuous Growth

11.2%
52.8%
6.2%
15.9%
3.6%
6.0%
4.3%
Loan Breakdown(1)
Construction Manufacturing Tourism Wholesale and Trade Transportation and Telecom Services Other
Loans in Detail
(1) As of 31 December 2012, mln TRY.
•Total Loans continously increased and
reached to 3.3mlnTRY with an 21.9%
loan growth as of 2012 year end
•Burgan Bank’s loan portfolio comprise
companies mainly in manufacturing,
wholesale, tourism, and construction
sectors
•Tourism is a niche sector for Burgan
Bank
...Supporting Real Sector

Payments (# of items)
EUR 12,565 13,856 12,866 13,292 3.3% 1,895
USD 15,939 21,789 22,912 24,777 8.1% 3,479
Total Trade Finance (USD mio) 1,106 1,465 1,793 1,973 8.6% 289
LCs issued (import) 143 197 257 317 21.7% 46
Collections (export)
71
37
44
56 26.5% 5
Transaction Volumes
2011 – 2012
2009 2010 2011 2012 ∆ 02-2013
Transaction Volumes

Trading
TRY Spot 8,214 16,800 16,447 12,017 -28% 2,051
FX Spot 9,571 12,933 8,462 4,758 -44.5% 1,308
CCY Swap 2,214 4,533 7,155 5,629 -22.34% 1,092
Bonds Local CCY(TRY) 18,250 33,000 39,560 15,885 -83% 3,503
CIRS 0 20 30 0 0 0
Sales
FX Forward 240 525 1,074 1,285 19.6% 318
FX Options 190 472 755 572 -24.24% 201
IRS 16 57 35 84 140% 18
Treasury Transactions (volumes USD mio)
2011-2012
2009 2010 2011 2012 ∆ 02-2013

FINANCIAL INSTITUTIONS
Mrs. Şehnaz Günay, Head of FI
(90 212) 371 37 40
Mrs. İnci Yılmaz, Unit Manager, FI
(90 212) 371 37 41
Ms. Ezgi Yıldırım, Manager, FI
(90 212) 371 37 42
Contact Details
TREASURY AND CAPITAL MARKETS
Mr. Mutlu Akpara, Executive Vice President
(90 212) 371 36 70
Mr. Bilge Gönen, Head of FX Desk
(90 212) 371 36 76
Mrs. Aslı Koçer, Head of Treasury Sales
(90 212) 371 36 81
Mr. Arda Turerer, Head of ALM
(90 212) 371 36 42
Esentepe Mahallesi, Büyükdere Caddesi
Tekfen Tower, 209
34394 Şişli İstanbul – Turkey
Tel: (90) (212) 371 37 37 / Telefax: (90) (212) 371 42 65
SWIFT : TEKFTRIS REUTERS: TKFB
Internet : http://www.burgan.com.tr