bursa malaysia berhad (30632-p) (incorporated in malaysia...
TRANSCRIPT
29 January 2014
Bursa Malaysia Berhad © 2013All Rights Reserved
CONDENSED CONSOLIDATED FINANCIAL STATEMENTSFOR THE QUARTER AND YEAR ENDED 31 DECEMBER 2013
BURSA MALAYSIA BERHAD (30632-P)(Incorporated in Malaysia)
1
RM'000 Note 31.12.2013 31.12.2012 31.12.2013 31.12.2012Reviewed Reviewed Audited Audited
(Restated) (Restated)
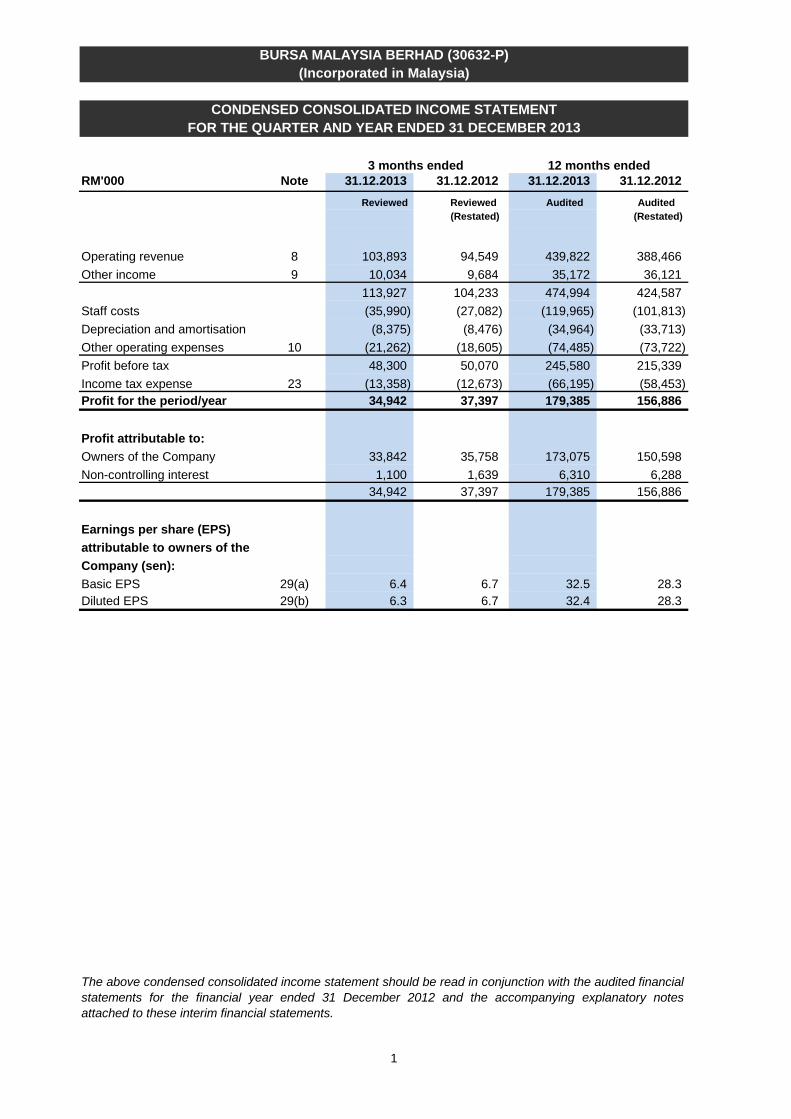
Operating revenue 8 103,893 94,549 439,822 388,466 Other income 9 10,034 9,684 35,172 36,121
113,927 104,233 474,994 424,587 Staff costs (35,990) (27,082) (119,965) (101,813) Depreciation and amortisation (8,375) (8,476) (34,964) (33,713) Other operating expenses 10 (21,262) (18,605) (74,485) (73,722) Profit before tax 48,300 50,070 245,580 215,339 Income tax expense 23 (13,358) (12,673) (66,195) (58,453) Profit for the period/year 34,942 37,397 179,385 156,886
Profit attributable to: Owners of the Company 33,842 35,758 173,075 150,598 Non-controlling interest 1,100 1,639 6,310 6,288
34,942 37,397 179,385 156,886
Earnings per share (EPS) attributable to owners of theCompany (sen):Basic EPS 29(a) 6.4 6.7 32.5 28.3 Diluted EPS 29(b) 6.3 6.7 32.4 28.3
BURSA MALAYSIA BERHAD (30632-P)(Incorporated in Malaysia)
CONDENSED CONSOLIDATED INCOME STATEMENTFOR THE QUARTER AND YEAR ENDED 31 DECEMBER 2013
3 months ended 12 months ended
The above condensed consolidated income statement should be read in conjunction with the audited financialstatements for the financial year ended 31 December 2012 and the accompanying explanatory notesattached to these interim financial statements.
2
BURSA MALAYSIA BERHAD (30632-P)(Incorporated in Malaysia)
RM'000 31.12.2013 31.12.2012 31.12.2013 31.12.2012Reviewed Reviewed Audited Audited
(Restated) (Restated)
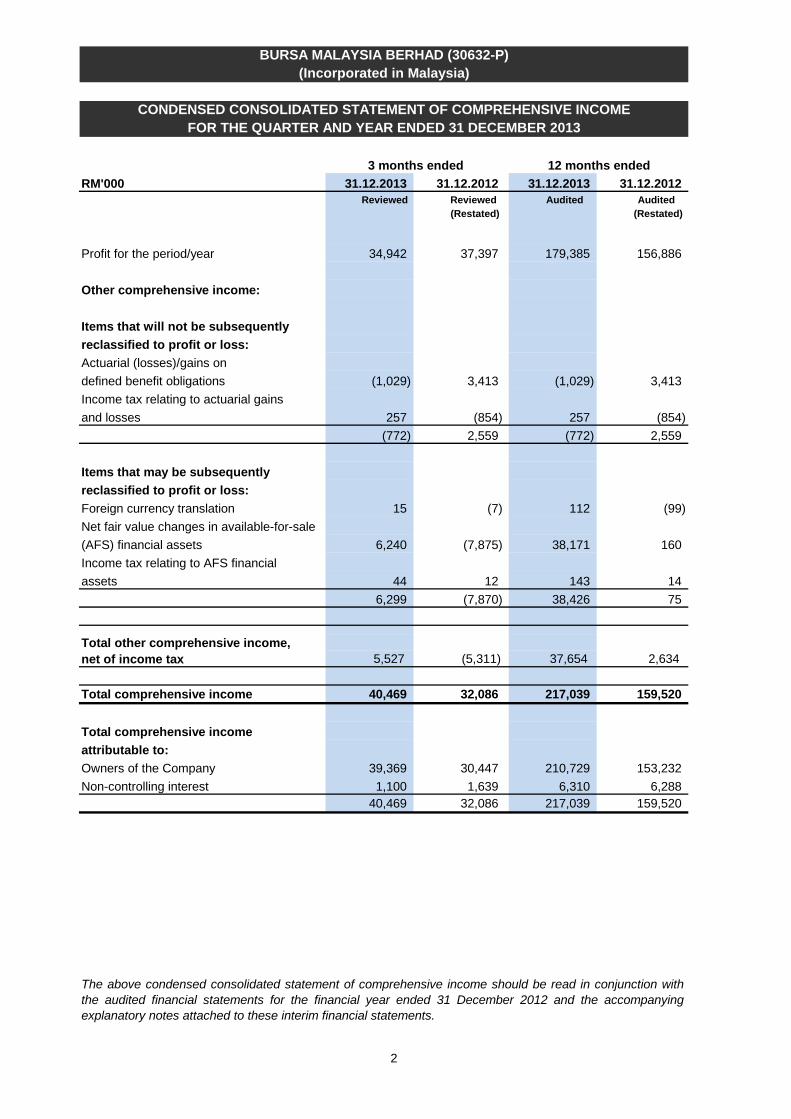
Profit for the period/year 34,942 37,397 179,385 156,886
Other comprehensive income:
Items that will not be subsequently reclassified to profit or loss:Actuarial (losses)/gains ondefined benefit obligations (1,029) 3,413 (1,029) 3,413 Income tax relating to actuarial gainsand losses 257 (854) 257 (854)
(772) 2,559 (772) 2,559
Items that may be subsequently reclassified to profit or loss:Foreign currency translation 15 (7) 112 (99) Net fair value changes in available-for-sale (AFS) financial assets 6,240 (7,875) 38,171 160 Income tax relating to AFS financial assets 44 12 143 14
6,299 (7,870) 38,426 75
Total other comprehensive income,net of income tax 5,527 (5,311) 37,654 2,634
Total comprehensive income 40,469 32,086 217,039 159,520
Total comprehensive income attributable to: Owners of the Company 39,369 30,447 210,729 153,232 Non-controlling interest 1,100 1,639 6,310 6,288
40,469 32,086 217,039 159,520
The above condensed consolidated statement of comprehensive income should be read in conjunction withthe audited financial statements for the financial year ended 31 December 2012 and the accompanyingexplanatory notes attached to these interim financial statements.
CONDENSED CONSOLIDATED STATEMENT OF COMPREHENSIVE INCOMEFOR THE QUARTER AND YEAR ENDED 31 DECEMBER 2013
3 months ended 12 months ended

3
BURSA MALAYSIA BERHAD (30632-P)(Incorporated in Malaysia)
As at As at As atRM'000 Note 31.12.2013 31.12.2012 01.01.2012
Audited Audited Audited(Restated) (Restated)
Assets
Property, plant and equipment 206,356 209,733 218,397 Computer software 61,404 61,274 59,614 Goodwill 42,957 42,957 42,957 Investment securities 163,495 123,782 93,371 Staff loans receivable 7,122 9,140 11,678 Deferred tax assets 1,648 1,278 1,034 Non-current assets 482,982 448,164 427,051
Trade receivables 32,733 28,462 27,632 Other receivables 15,794 16,081 13,170 Tax recoverable 6,612 4,296 388 Investment securities 51,183 54,936 33,441 Cash and bank balances not belonging to the Group 13 770,917 1,175,000 671,880 Cash and bank balances of the Group 14 381,442 471,503 499,943 Current assets 1,258,681 1,750,278 1,246,454
Total assets 1,741,663 2,198,442 1,673,505
Equity and liabilities
Share capital 266,306 266,012 265,800 Share premium 94,167 90,505 87,553 Other reserves 67,716 26,828 25,429 Retained earnings 24 382,962 474,256 462,062 Equity attributable to owners of the Company 811,151 857,601 840,844 Non-controlling interest 16,330 15,770 14,232 Total equity 827,481 873,371 855,076
Retirement benefit obligations 28,950 30,023 33,599 Deferred capital grants 7,768 9,934 11,850 Deferred tax liabilities 12,892 7,895 7,564 Non-current liabilities 49,610 47,852 53,013
Trade payables 13 734,318 1,137,234 636,166 Clearing Funds' contributions 13 35,374 35,938 34,485 Other payables 89,134 94,479 79,913 Tax payable 5,746 9,568 14,852 Current liabilities 864,572 1,277,219 765,416 Total liabilities 914,182 1,325,071 818,429
Total equity and liabilities 1,741,663 2,198,442 1,673,505
Net assets per share attributable to owners of the Company (RM) 1.52 1.61 1.58
The above condensed consolidated statement of financial position should be read in conjunction with theaudited financial statements for the financial year ended 31 December 2012 and the accompanyingexplanatory notes attached to these interim financial statements.
CONDENSED CONSOLIDATED STATEMENT OF FINANCIAL POSITIONAS AT 31 DECEMBER 2013
4
Distributable Foreign Non-
Capital currency Share Clearing controllingShare Share Capital redemption translation grant Fund AFS Retained interest Total
RM'000 capital premium reserve reserve reserve reserve reserves reserve earnings Total (Note a) equity
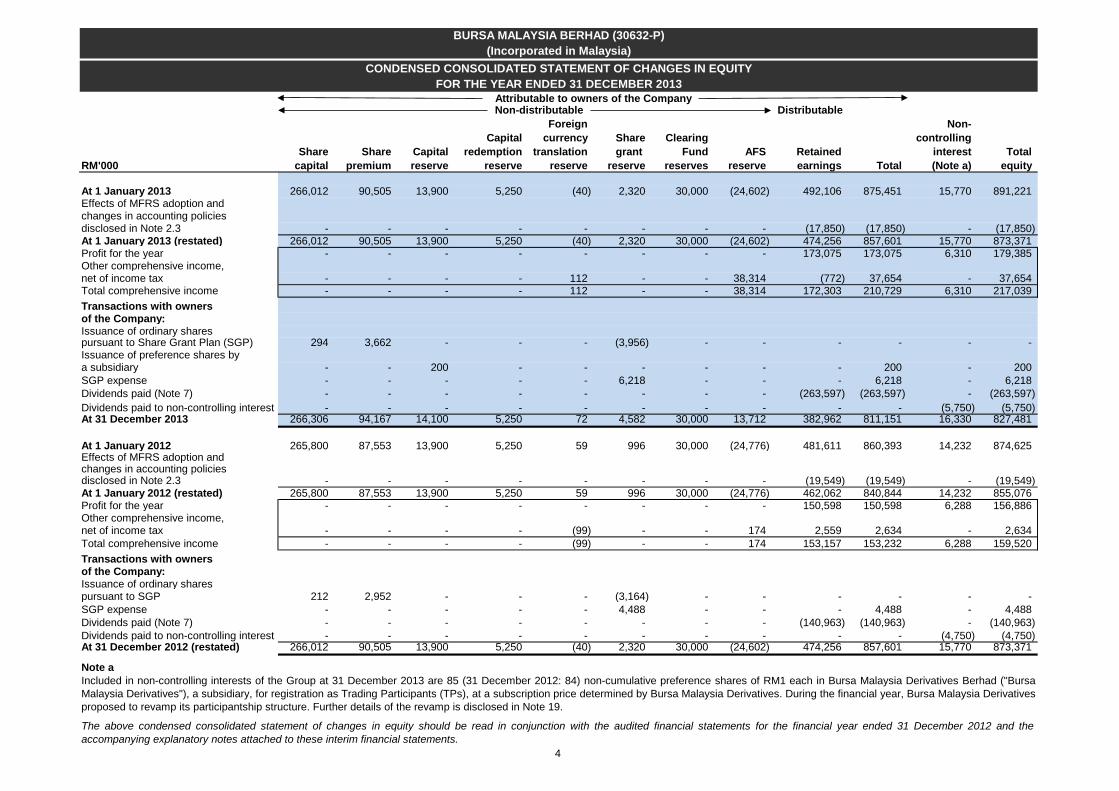
At 1 January 2013 266,012 90,505 13,900 5,250 (40) 2,320 30,000 (24,602) 492,106 875,451 15,770 891,221 Effects of MFRS adoption and changes in accounting policies disclosed in Note 2.3 - - - - - - - - (17,850) (17,850) - (17,850) At 1 January 2013 (restated) 266,012 90,505 13,900 5,250 (40) 2,320 30,000 (24,602) 474,256 857,601 15,770 873,371 Profit for the year - - - - - - - - 173,075 173,075 6,310 179,385 Other comprehensive income, net of income tax - - - - 112 - - 38,314 (772) 37,654 - 37,654 Total comprehensive income - - - - 112 - - 38,314 172,303 210,729 6,310 217,039 Transactions with ownersof the Company: Issuance of ordinary shares pursuant to Share Grant Plan (SGP) 294 3,662 - - - (3,956) - - - - - - Issuance of preference shares by a subsidiary - - 200 - - - - - - 200 - 200 SGP expense - - - - - 6,218 - - - 6,218 - 6,218 Dividends paid (Note 7) - - - - - - - - (263,597) (263,597) - (263,597) Dividends paid to non-controlling interest - - - - - - - - - - (5,750) (5,750) At 31 December 2013 266,306 94,167 14,100 5,250 72 4,582 30,000 13,712 382,962 811,151 16,330 827,481
At 1 January 2012 265,800 87,553 13,900 5,250 59 996 30,000 (24,776) 481,611 860,393 14,232 874,625 Effects of MFRS adoption and changes in accounting policies disclosed in Note 2.3 - - - - - - - - (19,549) (19,549) - (19,549) At 1 January 2012 (restated) 265,800 87,553 13,900 5,250 59 996 30,000 (24,776) 462,062 840,844 14,232 855,076 Profit for the year - - - - - - - - 150,598 150,598 6,288 156,886 Other comprehensive income, net of income tax - - - - (99) - - 174 2,559 2,634 - 2,634 Total comprehensive income - - - - (99) - - 174 153,157 153,232 6,288 159,520 Transactions with owners of the Company: Issuance of ordinary shares pursuant to SGP 212 2,952 - - - (3,164) - - - - - - SGP expense - - - - - 4,488 - - - 4,488 - 4,488 Dividends paid (Note 7) - - - - - - - - (140,963) (140,963) - (140,963) Dividends paid to non-controlling interest - - - - - - - - - - (4,750) (4,750) At 31 December 2012 (restated) 266,012 90,505 13,900 5,250 (40) 2,320 30,000 (24,602) 474,256 857,601 15,770 873,371
Note aIncluded in non-controlling interests of the Group at 31 December 2013 are 85 (31 December 2012: 84) non-cumulative preference shares of RM1 each in Bursa Malaysia Derivatives Berhad ("BursaMalaysia Derivatives"), a subsidiary, for registration as Trading Participants (TPs), at a subscription price determined by Bursa Malaysia Derivatives. During the financial year, Bursa Malaysia Derivativesproposed to revamp its participantship structure. Further details of the revamp is disclosed in Note 19.
The above condensed consolidated statement of changes in equity should be read in conjunction with the audited financial statements for the financial year ended 31 December 2012 and theaccompanying explanatory notes attached to these interim financial statements.
BURSA MALAYSIA BERHAD (30632-P)(Incorporated in Malaysia)
CONDENSED CONSOLIDATED STATEMENT OF CHANGES IN EQUITYFOR THE YEAR ENDED 31 DECEMBER 2013
Attributable to owners of the Company Non-distributable
5
RM'000 Note 31.12.2013 31.12.2012 Audited Audited
(Restated)
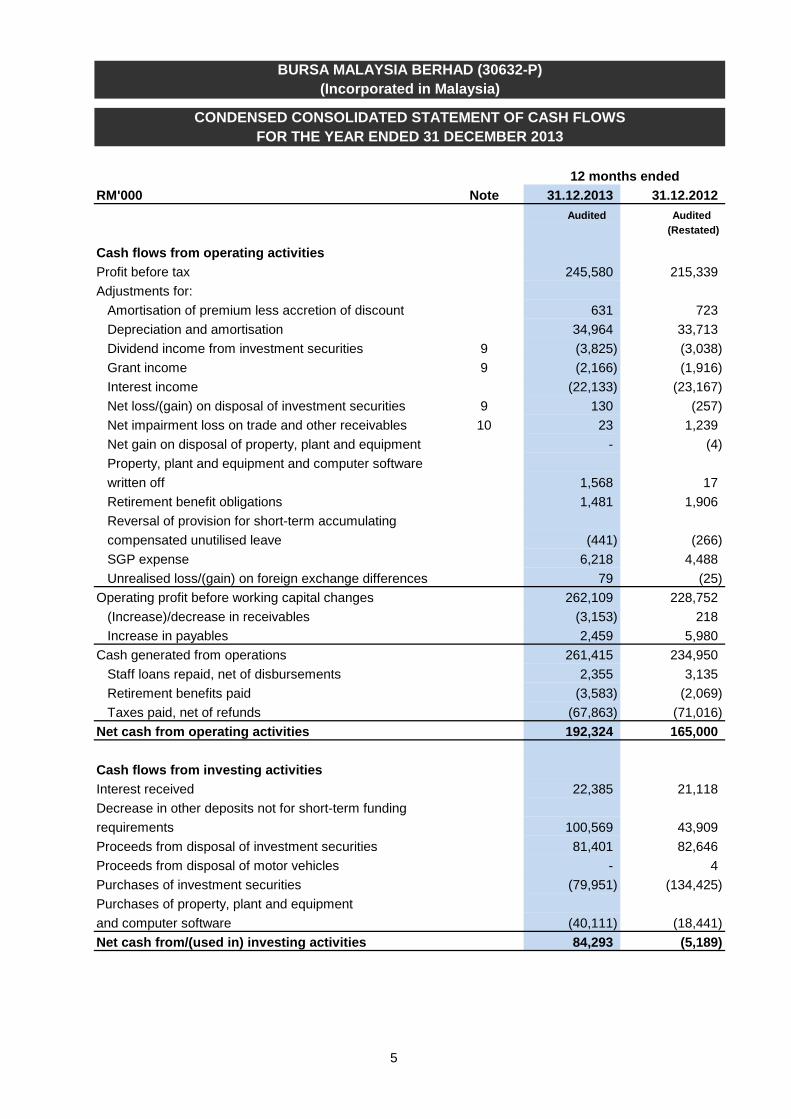
Cash flows from operating activitiesProfit before tax 245,580 215,339 Adjustments for: Amortisation of premium less accretion of discount 631 723 Depreciation and amortisation 34,964 33,713 Dividend income from investment securities 9 (3,825) (3,038) Grant income 9 (2,166) (1,916) Interest income (22,133) (23,167) Net loss/(gain) on disposal of investment securities 9 130 (257) Net impairment loss on trade and other receivables 10 23 1,239 Net gain on disposal of property, plant and equipment - (4) Property, plant and equipment and computer software written off 1,568 17 Retirement benefit obligations 1,481 1,906 Reversal of provision for short-term accumulating compensated unutilised leave (441) (266) SGP expense 6,218 4,488 Unrealised loss/(gain) on foreign exchange differences 79 (25) Operating profit before working capital changes 262,109 228,752 (Increase)/decrease in receivables (3,153) 218 Increase in payables 2,459 5,980 Cash generated from operations 261,415 234,950 Staff loans repaid, net of disbursements 2,355 3,135 Retirement benefits paid (3,583) (2,069) Taxes paid, net of refunds (67,863) (71,016) Net cash from operating activities 192,324 165,000
Cash flows from investing activities Interest received 22,385 21,118 Decrease in other deposits not for short-term funding requirements 100,569 43,909 Proceeds from disposal of investment securities 81,401 82,646 Proceeds from disposal of motor vehicles - 4 Purchases of investment securities (79,951) (134,425) Purchases of property, plant and equipment and computer software (40,111) (18,441) Net cash from/(used in) investing activities 84,293 (5,189)
BURSA MALAYSIA BERHAD (30632-P)(Incorporated in Malaysia)
CONDENSED CONSOLIDATED STATEMENT OF CASH FLOWSFOR THE YEAR ENDED 31 DECEMBER 2013
12 months ended
6
BURSA MALAYSIA BERHAD (30632-P)(Incorporated in Malaysia)
RM'000 Note 31.12.2013 31.12.2012 Audited Audited
(Restated)
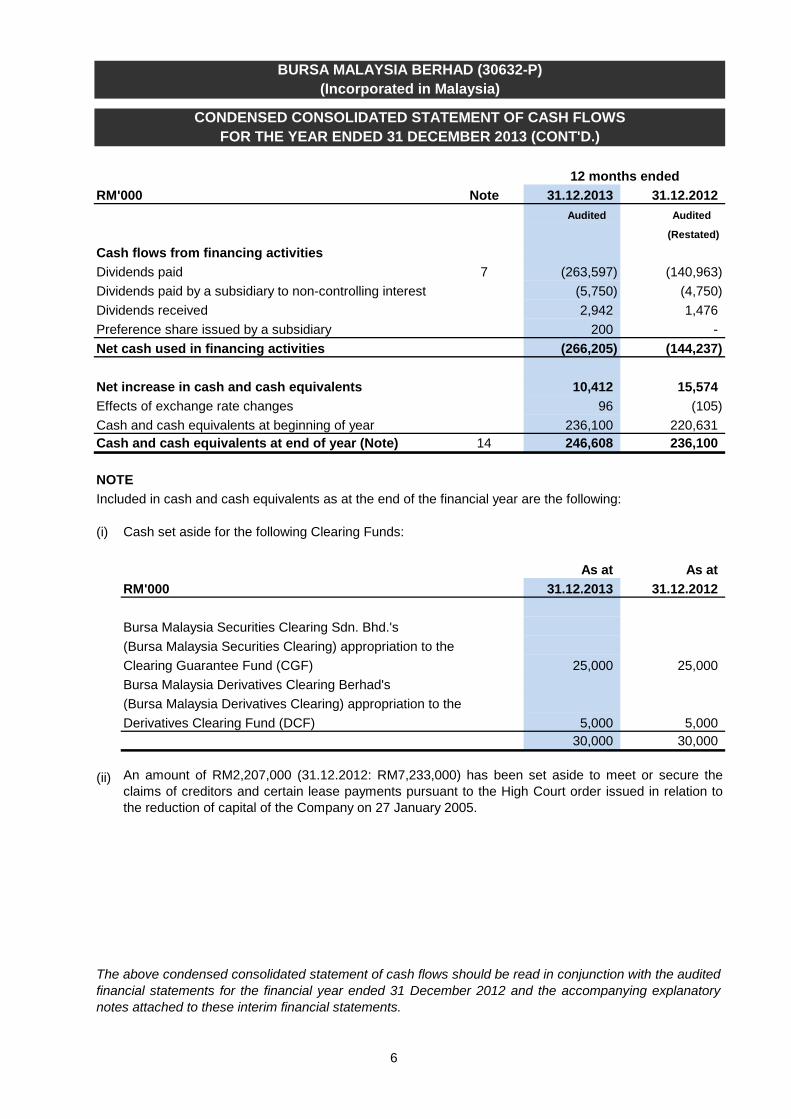
Cash flows from financing activities Dividends paid 7 (263,597) (140,963) Dividends paid by a subsidiary to non-controlling interest (5,750) (4,750) Dividends received 2,942 1,476 Preference share issued by a subsidiary 200 - Net cash used in financing activities (266,205) (144,237) Net increase in cash and cash equivalents 10,412 15,574 Effects of exchange rate changes 96 (105) Cash and cash equivalents at beginning of year 236,100 220,631 Cash and cash equivalents at end of year (Note) 14 246,608 236,100
NOTEIncluded in cash and cash equivalents as at the end of the financial year are the following:
(i)
As at As atRM'000 31.12.2013 31.12.2012
Bursa Malaysia Securities Clearing Sdn. Bhd.'s (Bursa Malaysia Securities Clearing) appropriation to theClearing Guarantee Fund (CGF) 25,000 25,000 Bursa Malaysia Derivatives Clearing Berhad's (Bursa Malaysia Derivatives Clearing) appropriation to the Derivatives Clearing Fund (DCF) 5,000 5,000
30,000 30,000
(ii)
CONDENSED CONSOLIDATED STATEMENT OF CASH FLOWS
An amount of RM2,207,000 (31.12.2012: RM7,233,000) has been set aside to meet or secure theclaims of creditors and certain lease payments pursuant to the High Court order issued in relation tothe reduction of capital of the Company on 27 January 2005.
FOR THE YEAR ENDED 31 DECEMBER 2013 (CONT'D.)
12 months ended
Cash set aside for the following Clearing Funds:
The above condensed consolidated statement of cash flows should be read in conjunction with the auditedfinancial statements for the financial year ended 31 December 2012 and the accompanying explanatorynotes attached to these interim financial statements.
7
1. BASIS OF PREPARATION
2. SIGNIFICANT ACCOUNTING POLICIES
2.1
(a)
MFRS 3 MFRS 10 MFRS 11 MFRS 12 MFRS 13 MFRS 119 MFRS 127 MFRS 128Amendments to MFRS 1 Amendments to MFRS 7
Amendments to MFRS 10 Amendments to MFRS 11Amendments to MFRS 12Amendments to MFRS 101Annual Improvements to IC Interpretations and MFRSs 2009 - 2011 Cycle
(i) Amendments to MFRS 101 Presentation of Items of Other Comprehensive Income
Disclosure of Interests in Other Entities: Transition GuidancePresentation of Items of Other Comprehensive Income
Adoption of Standards, Amendments and IC Interpretations
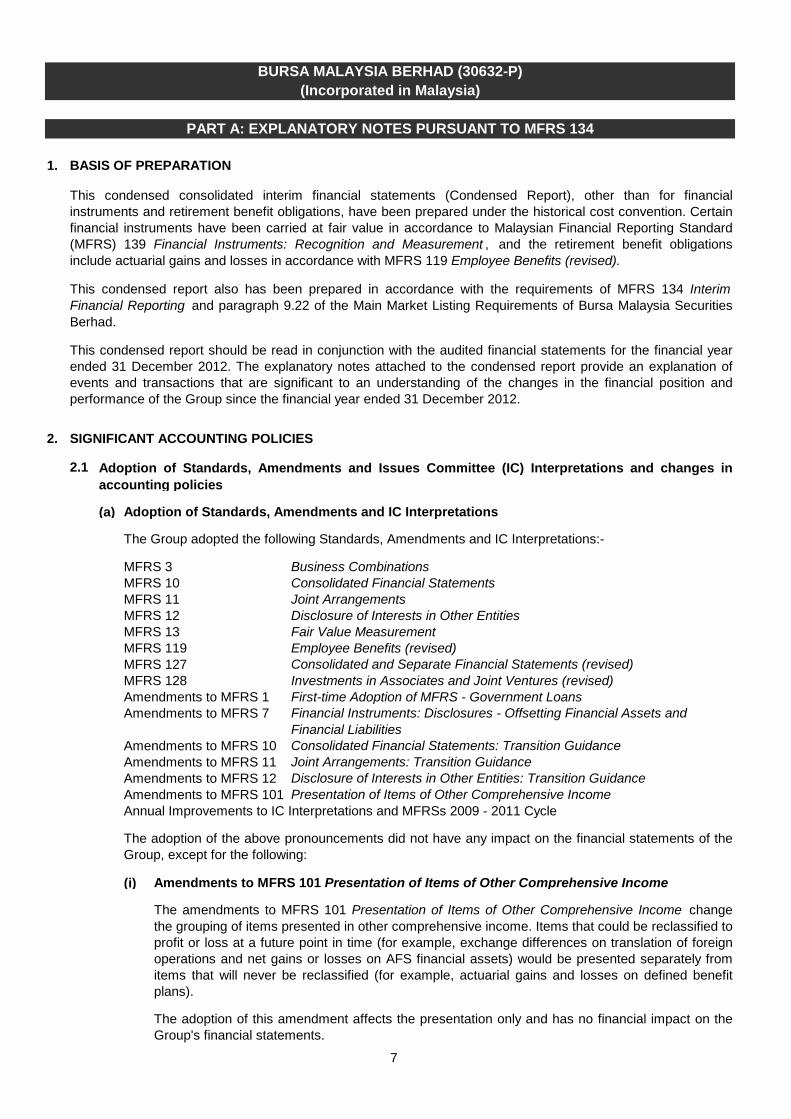
The adoption of the above pronouncements did not have any impact on the financial statements of theGroup, except for the following:
The amendments to MFRS 101 Presentation of Items of Other Comprehensive Income change the grouping of items presented in other comprehensive income. Items that could be reclassified toprofit or loss at a future point in time (for example, exchange differences on translation of foreignoperations and net gains or losses on AFS financial assets) would be presented separately fromitems that will never be reclassified (for example, actuarial gains and losses on defined benefitplans).
The adoption of this amendment affects the presentation only and has no financial impact on theGroup's financial statements.
Joint Arrangements: Transition Guidance
Employee Benefits (revised)Fair Value Measurement
Joint ArrangementsDisclosure of Interests in Other Entities
Financial Instruments: Disclosures - Offsetting Financial Assets and Financial Liabilities
Consolidated and Separate Financial Statements (revised)Investments in Associates and Joint Ventures (revised)First-time Adoption of MFRS - Government Loans
Business Combinations Consolidated Financial Statements
The Group adopted the following Standards, Amendments and IC Interpretations:-
Consolidated Financial Statements: Transition Guidance
BURSA MALAYSIA BERHAD (30632-P)(Incorporated in Malaysia)
PART A: EXPLANATORY NOTES PURSUANT TO MFRS 134
This condensed report should be read in conjunction with the audited financial statements for the financial yearended 31 December 2012. The explanatory notes attached to the condensed report provide an explanation ofevents and transactions that are significant to an understanding of the changes in the financial position andperformance of the Group since the financial year ended 31 December 2012.
This condensed report also has been prepared in accordance with the requirements of MFRS 134 Interim Financial Reporting and paragraph 9.22 of the Main Market Listing Requirements of Bursa Malaysia SecuritiesBerhad.
This condensed consolidated interim financial statements (Condensed Report), other than for financialinstruments and retirement benefit obligations, have been prepared under the historical cost convention. Certainfinancial instruments have been carried at fair value in accordance to Malaysian Financial Reporting Standard(MFRS) 139 Financial Instruments: Recognition and Measurement , and the retirement benefit obligationsinclude actuarial gains and losses in accordance with MFRS 119 Employee Benefits (revised).
Adoption of Standards, Amendments and Issues Committee (IC) Interpretations and changes inaccounting policies
8
BURSA MALAYSIA BERHAD (30632-P)(Incorporated in Malaysia)
PART A: EXPLANATORY NOTES PURSUANT TO MFRS 134
2. SIGNIFICANT ACCOUNTING POLICIES (CONT'D.)
2.1
(a)
(ii) MFRS 119 Employee Benefits (revised)
(b)
2.2
Amendments to MFRS 10Amendments to MFRS 12 Amendments to MFRS 127Amendments to MFRS 132
Amendments to MFRS 136
Amendments to MFRS 139IC Interpretation 21 Levies
Amendments to MFRS 9
Novation of Derivatives and Continuation of Hedge Accounting
Effective for financial periods beginning on or after 1 January 2015
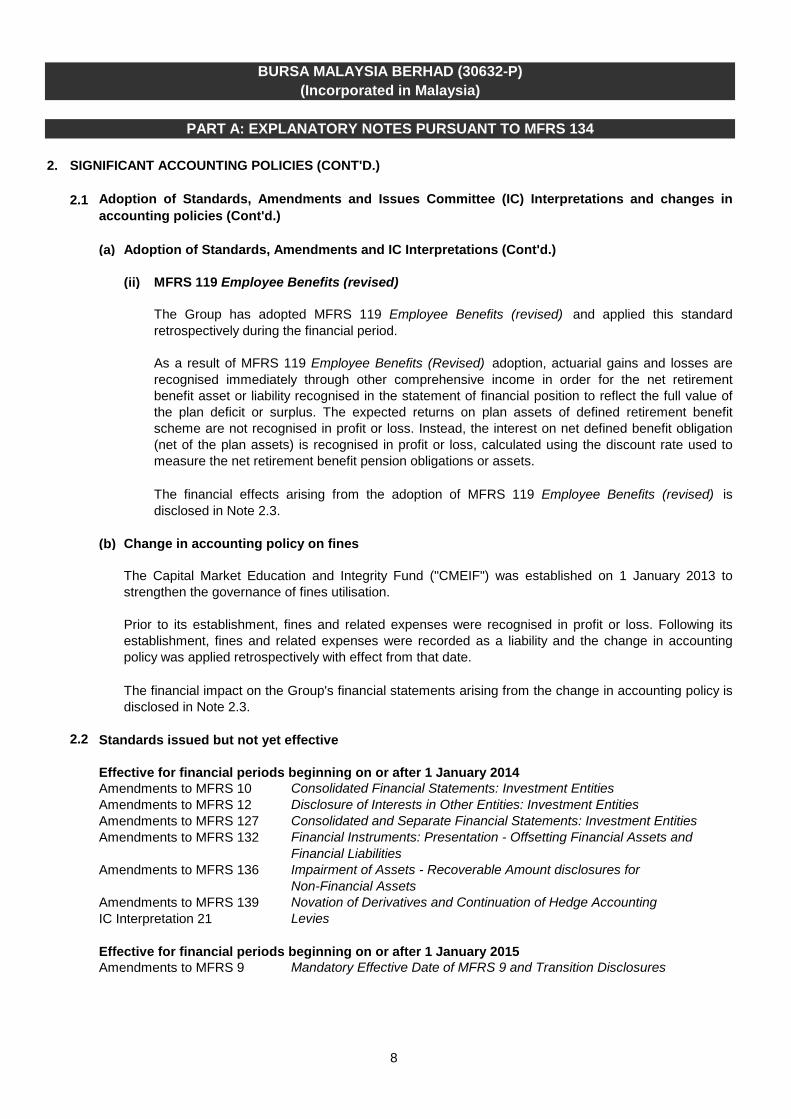
The Group has adopted MFRS 119 Employee Benefits (revised) and applied this standardretrospectively during the financial period.
Impairment of Assets - Recoverable Amount disclosures for Non-Financial Assets
The financial effects arising from the adoption of MFRS 119 Employee Benefits (revised) is disclosed in Note 2.3.
Financial Instruments: Presentation - Offsetting Financial Assets and Financial Liabilities
Mandatory Effective Date of MFRS 9 and Transition Disclosures
The Capital Market Education and Integrity Fund ("CMEIF") was established on 1 January 2013 tostrengthen the governance of fines utilisation.
Prior to its establishment, fines and related expenses were recognised in profit or loss. Following itsestablishment, fines and related expenses were recorded as a liability and the change in accountingpolicy was applied retrospectively with effect from that date.
The financial impact on the Group's financial statements arising from the change in accounting policy isdisclosed in Note 2.3.
Effective for financial periods beginning on or after 1 January 2014
Disclosure of Interests in Other Entities: Investment EntitiesConsolidated and Separate Financial Statements: Investment Entities
Standards issued but not yet effective
Consolidated Financial Statements: Investment Entities
Adoption of Standards, Amendments and IC Interpretations (Cont'd.)
Change in accounting policy on fines
As a result of MFRS 119 Employee Benefits (Revised) adoption, actuarial gains and losses arerecognised immediately through other comprehensive income in order for the net retirementbenefit asset or liability recognised in the statement of financial position to reflect the full value ofthe plan deficit or surplus. The expected returns on plan assets of defined retirement benefitscheme are not recognised in profit or loss. Instead, the interest on net defined benefit obligation(net of the plan assets) is recognised in profit or loss, calculated using the discount rate used tomeasure the net retirement benefit pension obligations or assets.
Adoption of Standards, Amendments and Issues Committee (IC) Interpretations and changes inaccounting policies (Cont'd.)

9
BURSA MALAYSIA BERHAD (30632-P)(Incorporated in Malaysia)
PART A: EXPLANATORY NOTES PURSUANT TO MFRS 134
2. SIGNIFICANT ACCOUNTING POLICIES (CONT'D.)
2.2
2.3
(a)
Standards issued but not yet effective (cont'd.)
MFRS 9 Financial Instruments
MFRS 9 Financial instruments , addresses the classification, measurement and recognition of financialassets and financial liabilities. MFRS 9 was issued in November 2009 and October 2010. It replaces theparts of MFRS 139 that relate to the classification and measurement of financial instruments. MFRS 9requires financial assets to be classified into two measurement categories: those measured as at fair valueand those measured at amortised cost. The determination is made at initial recognition. The classificationdepends on the entity’s business model for managing its financial instruments and the contractual cash flowcharacteristics of the instrument. For financial liabilities, the standard retains most of the MFRS 139requirements. The main change is that, in cases where the fair value option is taken for financial liabilities,the part of a fair value change due to an entity’s own credit risk is recorded in other comprehensive incomerather than the income statement, unless this creates an accounting mismatch.
The Group will quantify the effect of adopting this standard when the full standard is issued.
The Group will adopt the above pronouncements when they become effective in the respective financialperiods. These pronouncement are not expected to have any effect to the financial statements of the Groupupon their initial application, except as described below:
Financial effects arising from the adoption of MFRS 119 Employee Benefits (revised) and change inaccounting policy on fines
Condensed consolidated statement of financial position
Accordingly, the financial statements for the previous financial years have been restated as follows:
Note 2.1(a)(ii) Note 2.1(b)Effect of Effect of change
As previously adoption of in accountingRM'000 reported MFRS 119 policy for fines Restated
As at 1 January 2012
Equity attributable to owners of the CompanyRetained earnings 481,611 (6,966) (12,583) 462,062
Non-current liabilitiesRetirement benefit obligations 24,311 9,288 - 33,599 Deferred tax liabilities 9,886 (2,322) - 7,564
Current liabilitiesOther payables 67,330 - 12,583 79,913
As at 31 December 2012
Equity attributable to owners of the CompanyRetained earnings 492,106 (3,906) (13,944) 474,256
Non-current liabilitiesRetirement benefit obligations 24,816 5,207 - 30,023 Deferred tax liabilities 9,196 (1,301) - 7,895
Current liabilitiesOther payables 80,535 - 13,944 94,479
10
BURSA MALAYSIA BERHAD (30632-P)(Incorporated in Malaysia)
PART A: EXPLANATORY NOTES PURSUANT TO MFRS 134
2. SIGNIFICANT ACCOUNTING POLICIES (CONT'D.)
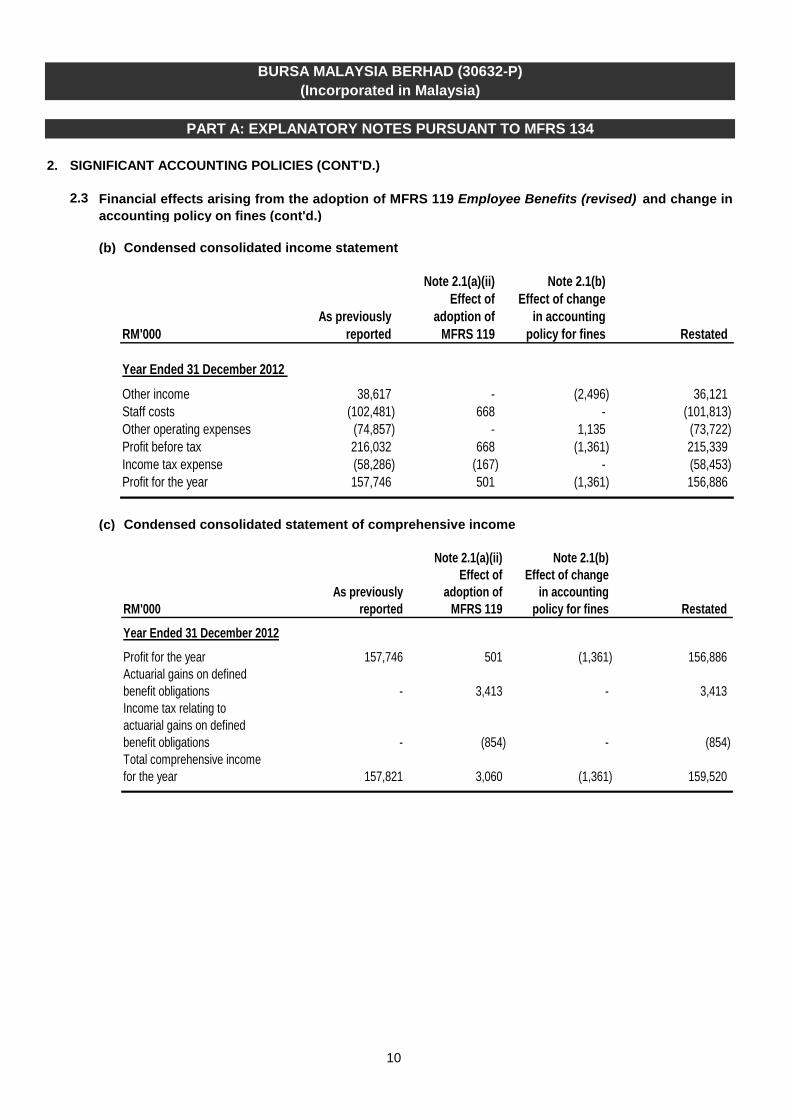
2.3
(b)
(c)
Condensed consolidated income statement
Financial effects arising from the adoption of MFRS 119 Employee Benefits (revised) and change inaccounting policy on fines (cont'd.)
Condensed consolidated statement of comprehensive income
Note 2.1(a)(ii) Note 2.1(b)Effect of Effect of change
As previously adoption of in accountingRM'000 reported MFRS 119 policy for fines Restated
Year Ended 31 December 2012
Other income 38,617 - (2,496) 36,121 Staff costs (102,481) 668 - (101,813) Other operating expenses (74,857) - 1,135 (73,722) Profit before tax 216,032 668 (1,361) 215,339 Income tax expense (58,286) (167) - (58,453) Profit for the year 157,746 501 (1,361) 156,886
Note 2.1(a)(ii) Note 2.1(b)Effect of Effect of change
As previously adoption of in accountingRM'000 reported MFRS 119 policy for fines Restated
Year Ended 31 December 2012
Profit for the year 157,746 501 (1,361) 156,886 Actuarial gains on defined benefit obligations - 3,413 - 3,413 Income tax relating toactuarial gains on defined benefit obligations - (854) - (854) Total comprehensive income for the year 157,821 3,060 (1,361) 159,520
11
BURSA MALAYSIA BERHAD (30632-P)(Incorporated in Malaysia)
PART A: EXPLANATORY NOTES PURSUANT TO MFRS 134
2. SIGNIFICANT ACCOUNTING POLICIES (CONT'D.)
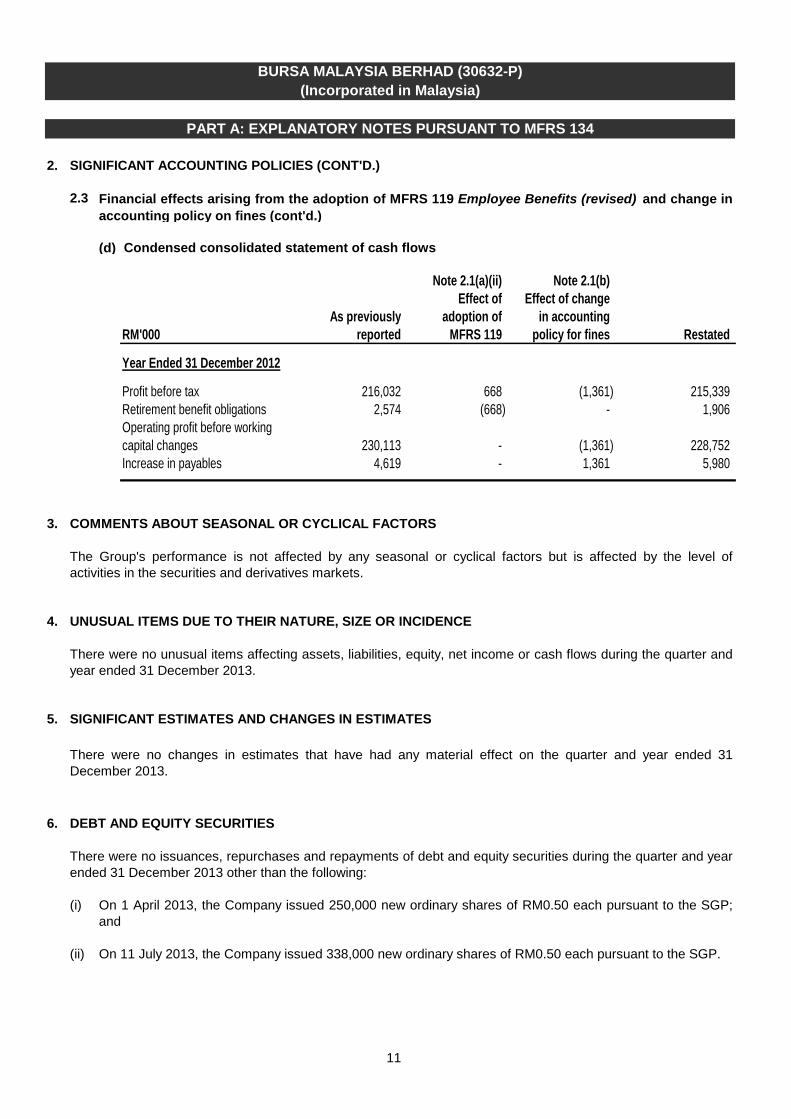
2.3
(d)
3. COMMENTS ABOUT SEASONAL OR CYCLICAL FACTORS
4. UNUSUAL ITEMS DUE TO THEIR NATURE, SIZE OR INCIDENCE
5. SIGNIFICANT ESTIMATES AND CHANGES IN ESTIMATES
6. DEBT AND EQUITY SECURITIES
(i)
(ii)
There were no unusual items affecting assets, liabilities, equity, net income or cash flows during the quarter andyear ended 31 December 2013.
The Group's performance is not affected by any seasonal or cyclical factors but is affected by the level ofactivities in the securities and derivatives markets.
Condensed consolidated statement of cash flows
Financial effects arising from the adoption of MFRS 119 Employee Benefits (revised) and change inaccounting policy on fines (cont'd.)
On 1 April 2013, the Company issued 250,000 new ordinary shares of RM0.50 each pursuant to the SGP;and
There were no changes in estimates that have had any material effect on the quarter and year ended 31December 2013.
There were no issuances, repurchases and repayments of debt and equity securities during the quarter and yearended 31 December 2013 other than the following:
On 11 July 2013, the Company issued 338,000 new ordinary shares of RM0.50 each pursuant to the SGP.
Note 2.1(a)(ii) Note 2.1(b)Effect of Effect of change
As previously adoption of in accountingRM'000 reported MFRS 119 policy for fines Restated
Year Ended 31 December 2012
Profit before tax 216,032 668 (1,361) 215,339 Retirement benefit obligations 2,574 (668) - 1,906 Operating profit before workingcapital changes 230,113 - (1,361) 228,752 Increase in payables 4,619 - 1,361 5,980
12
BURSA MALAYSIA BERHAD (30632-P)(Incorporated in Malaysia)
PART A: EXPLANATORY NOTES PURSUANT TO MFRS 134
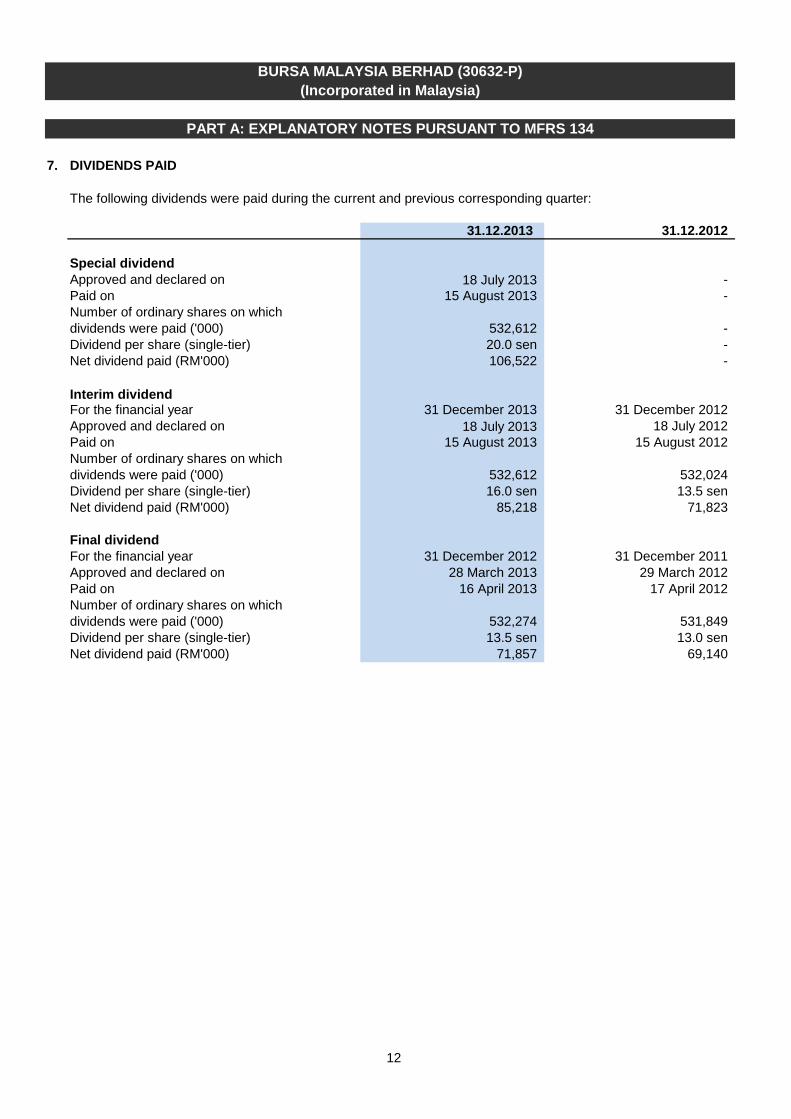
7. DIVIDENDS PAID
31.12.2013 31.12.2012
Special dividendApproved and declared on 18 July 2013 -Paid on -Number of ordinary shares on which dividends were paid ('000) -Dividend per share (single-tier) -Net dividend paid (RM'000) -
Interim dividendFor the financial year 31 December 2013 31 December 2012Approved and declared on 18 July 2013Paid onNumber of ordinary shares on which dividends were paid ('000)Dividend per share (single-tier)Net dividend paid (RM'000)
Final dividend For the financial year 31 December 2012 31 December 2011Approved and declared on 28 March 2013Paid onNumber of ordinary shares on which dividends were paid ('000)Dividend per share (single-tier)Net dividend paid (RM'000)
16 April 2013 17 April 2012
13.5 sen85,218 71,823
The following dividends were paid during the current and previous corresponding quarter:
18 July 201215 August 2013 15 August 2012
16.0 sen
531,849 13.5 sen 13.0 sen
71,857 69,140
532,274
106,522
532,612
532,612
15 August 2013
20.0 sen
532,024
29 March 2012
13
BURSA MALAYSIA BERHAD (30632-P)(Incorporated in Malaysia)
PART A: EXPLANATORY NOTES PURSUANT TO MFRS 134
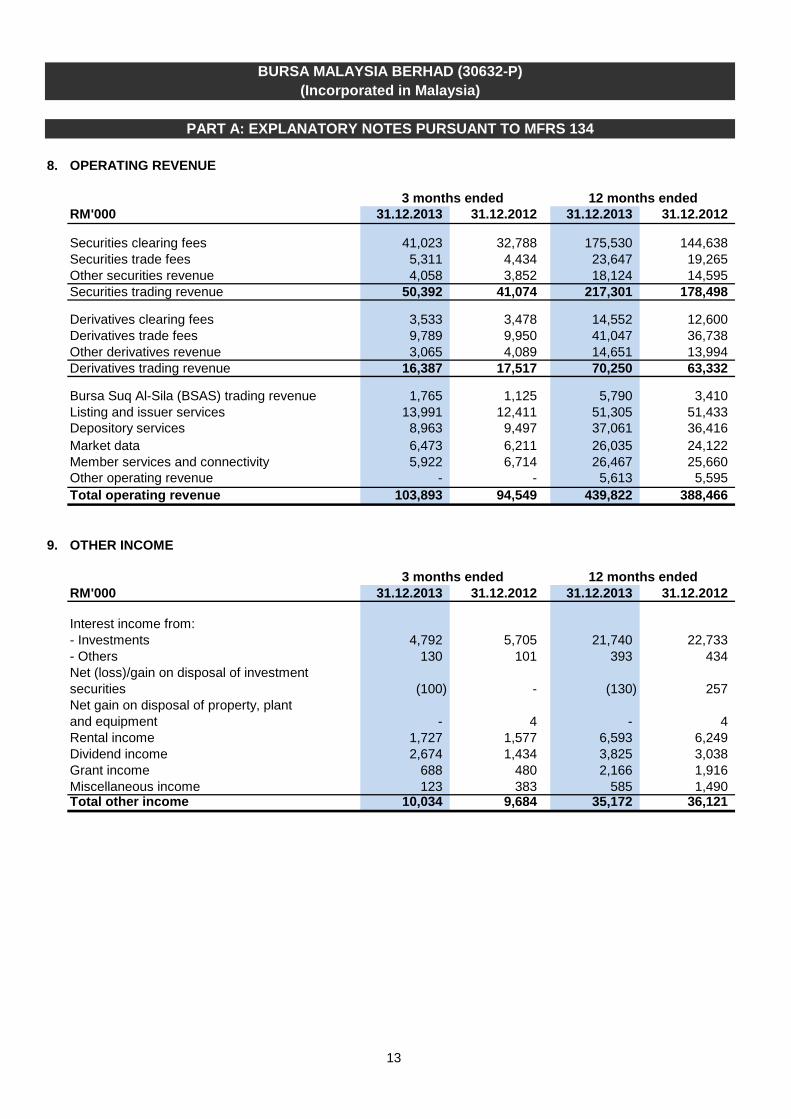
8. OPERATING REVENUE
RM'000 31.12.2013 31.12.2012 31.12.2013 31.12.2012
Securities clearing fees 41,023 32,788 175,530 144,638 Securities trade fees 5,311 4,434 23,647 19,265 Other securities revenue 4,058 3,852 18,124 14,595Securities trading revenue 50,392 41,074 217,301 178,498
Derivatives clearing fees 3,533 3,478 14,552 12,600 Derivatives trade fees 9,789 9,950 41,047 36,738 Other derivatives revenue 3,065 4,089 14,651 13,994Derivatives trading revenue 16,387 17,517 70,250 63,332
Bursa Suq Al-Sila (BSAS) trading revenue 1,765 1,125 5,790 3,410 Listing and issuer services 13,991 12,411 51,305 51,433 Depository services 8,963 9,497 37,061 36,416 Market data 6,473 6,211 26,035 24,122 Member services and connectivity 5,922 6,714 26,467 25,660 Other operating revenue - - 5,613 5,595 Total operating revenue 103,893 94,549 439,822 388,466
9. OTHER INCOME
RM'000 31.12.2013 31.12.2012 31.12.2013 31.12.2012
Interest income from:- Investments 4,792 5,705 21,740 22,733 - Others 130 101 393 434 Net (loss)/gain on disposal of investmentsecurities (100) - (130) 257 Net gain on disposal of property, plant and equipment - 4 - 4 Rental income 1,727 1,577 6,593 6,249 Dividend income 2,674 1,434 3,825 3,038 Grant income 688 480 2,166 1,916 Miscellaneous income 123 383 585 1,490 Total other income 10,034 9,684 35,172 36,121
3 months ended 12 months ended
12 months ended3 months ended
14
BURSA MALAYSIA BERHAD (30632-P)(Incorporated in Malaysia)
PART A: EXPLANATORY NOTES PURSUANT TO MFRS 134
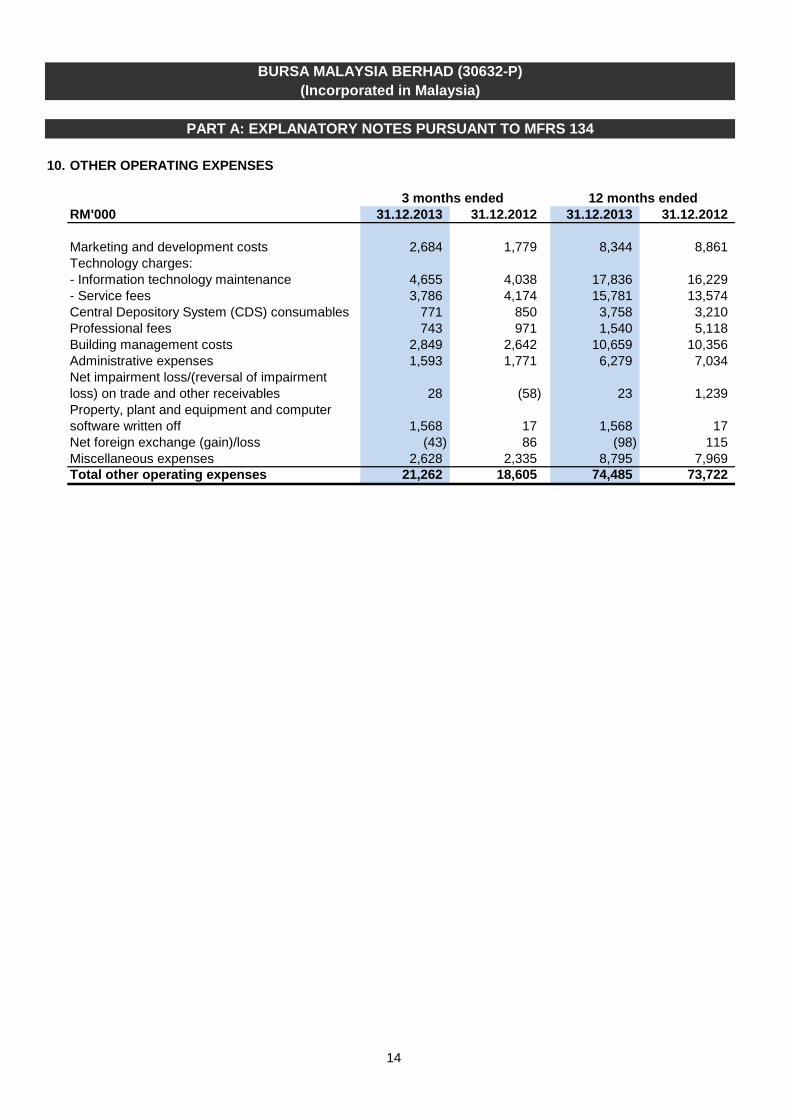
10. OTHER OPERATING EXPENSES
RM'000 31.12.2013 31.12.2012 31.12.2013 31.12.2012
Marketing and development costs 2,684 1,779 8,344 8,861 Technology charges:- Information technology maintenance 4,655 4,038 17,836 16,229 - Service fees 3,786 4,174 15,781 13,574 Central Depository System (CDS) consumables 771 850 3,758 3,210Professional fees 743 971 1,540 5,118Building management costs 2,849 2,642 10,659 10,356 Administrative expenses 1,593 1,771 6,279 7,034Net impairment loss/(reversal of impairment loss) on trade and other receivables 28 (58) 23 1,239 Property, plant and equipment and computersoftware written off 1,568 17 1,568 17 Net foreign exchange (gain)/loss (43) 86 (98) 115 Miscellaneous expenses 2,628 2,335 8,795 7,969Total other operating expenses 21,262 18,605 74,485 73,722
12 months ended3 months ended
15
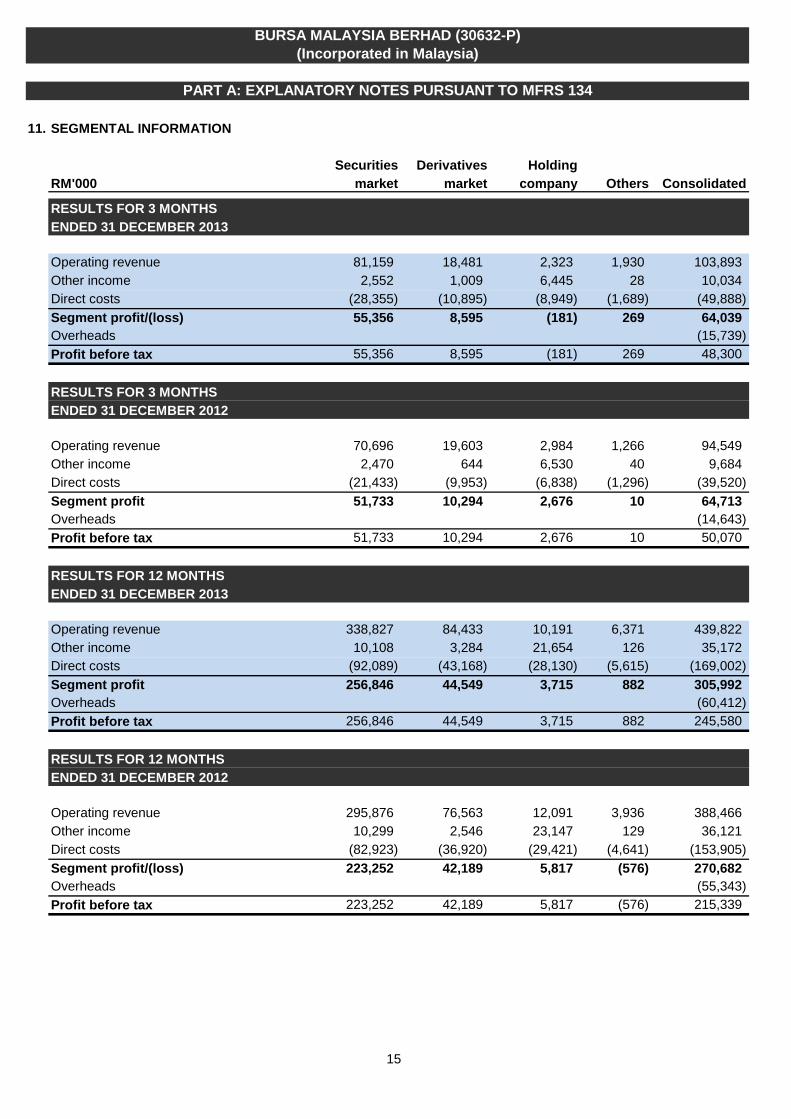
11. SEGMENTAL INFORMATION
Securities Derivatives HoldingRM'000 market market company Others Consolidated
RESULTS FOR 3 MONTHSENDED 31 DECEMBER 2013
Operating revenue 81,159 18,481 2,323 1,930 103,893 Other income 2,552 1,009 6,445 28 10,034 Direct costs (28,355) (10,895) (8,949) (1,689) (49,888) Segment profit/(loss) 55,356 8,595 (181) 269 64,039 Overheads (15,739) Profit before tax 55,356 8,595 (181) 269 48,300
RESULTS FOR 3 MONTHSENDED 31 DECEMBER 2012
Operating revenue 70,696 19,603 2,984 1,266 94,549 Other income 2,470 644 6,530 40 9,684 Direct costs (21,433) (9,953) (6,838) (1,296) (39,520) Segment profit 51,733 10,294 2,676 10 64,713 Overheads (14,643) Profit before tax 51,733 10,294 2,676 10 50,070
RESULTS FOR 12 MONTHSENDED 31 DECEMBER 2013
Operating revenue 338,827 84,433 10,191 6,371 439,822 Other income 10,108 3,284 21,654 126 35,172 Direct costs (92,089) (43,168) (28,130) (5,615) (169,002) Segment profit 256,846 44,549 3,715 882 305,992 Overheads (60,412) Profit before tax 256,846 44,549 3,715 882 245,580
RESULTS FOR 12 MONTHSENDED 31 DECEMBER 2012
Operating revenue 295,876 76,563 12,091 3,936 388,466 Other income 10,299 2,546 23,147 129 36,121 Direct costs (82,923) (36,920) (29,421) (4,641) (153,905) Segment profit/(loss) 223,252 42,189 5,817 (576) 270,682 Overheads (55,343) Profit before tax 223,252 42,189 5,817 (576) 215,339
BURSA MALAYSIA BERHAD (30632-P)(Incorporated in Malaysia)
PART A: EXPLANATORY NOTES PURSUANT TO MFRS 134
16
BURSA MALAYSIA BERHAD (30632-P)(Incorporated in Malaysia)
PART A: EXPLANATORY NOTES PURSUANT TO MFRS 134
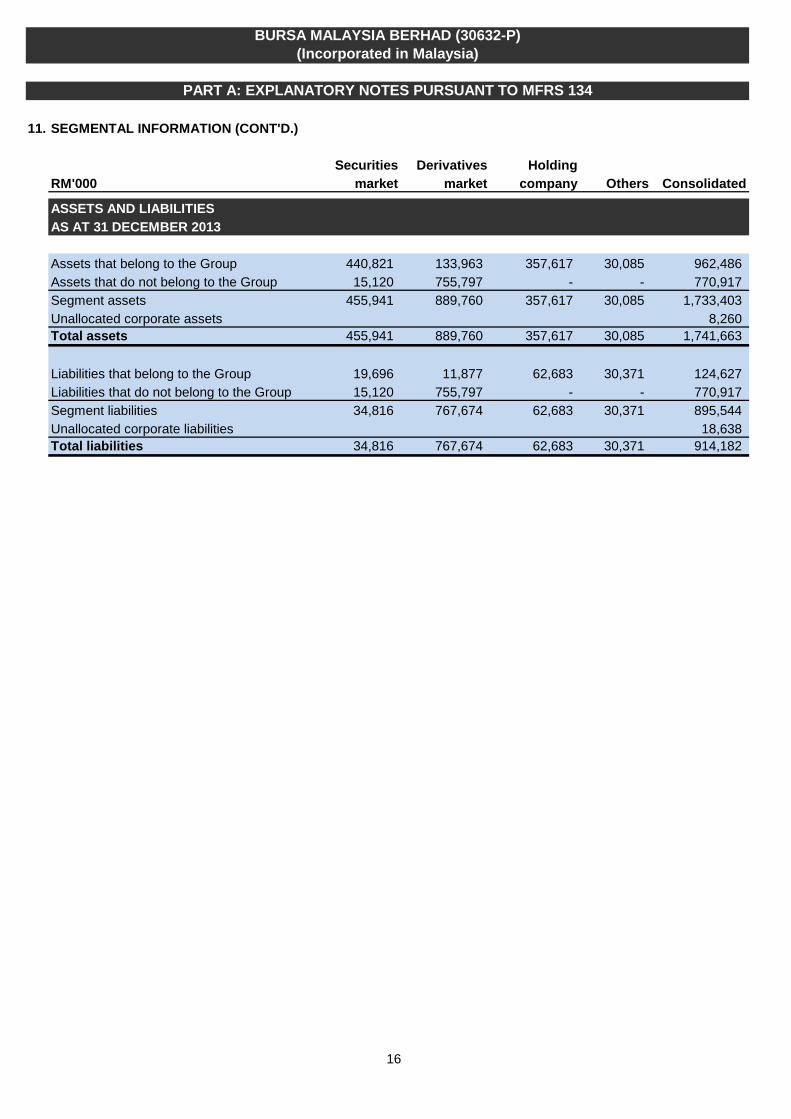
11. SEGMENTAL INFORMATION (CONT'D.)
Securities Derivatives HoldingRM'000 market market company Others Consolidated
ASSETS AND LIABILITIESAS AT 31 DECEMBER 2013
Assets that belong to the Group 440,821 133,963 357,617 30,085 962,486 Assets that do not belong to the Group 15,120 755,797 - - 770,917 Segment assets 455,941 889,760 357,617 30,085 1,733,403 Unallocated corporate assets 8,260 Total assets 455,941 889,760 357,617 30,085 1,741,663
Liabilities that belong to the Group 19,696 11,877 62,683 30,371 124,627 Liabilities that do not belong to the Group 15,120 755,797 - - 770,917 Segment liabilities 34,816 767,674 62,683 30,371 895,544 Unallocated corporate liabilities 18,638 Total liabilities 34,816 767,674 62,683 30,371 914,182
17
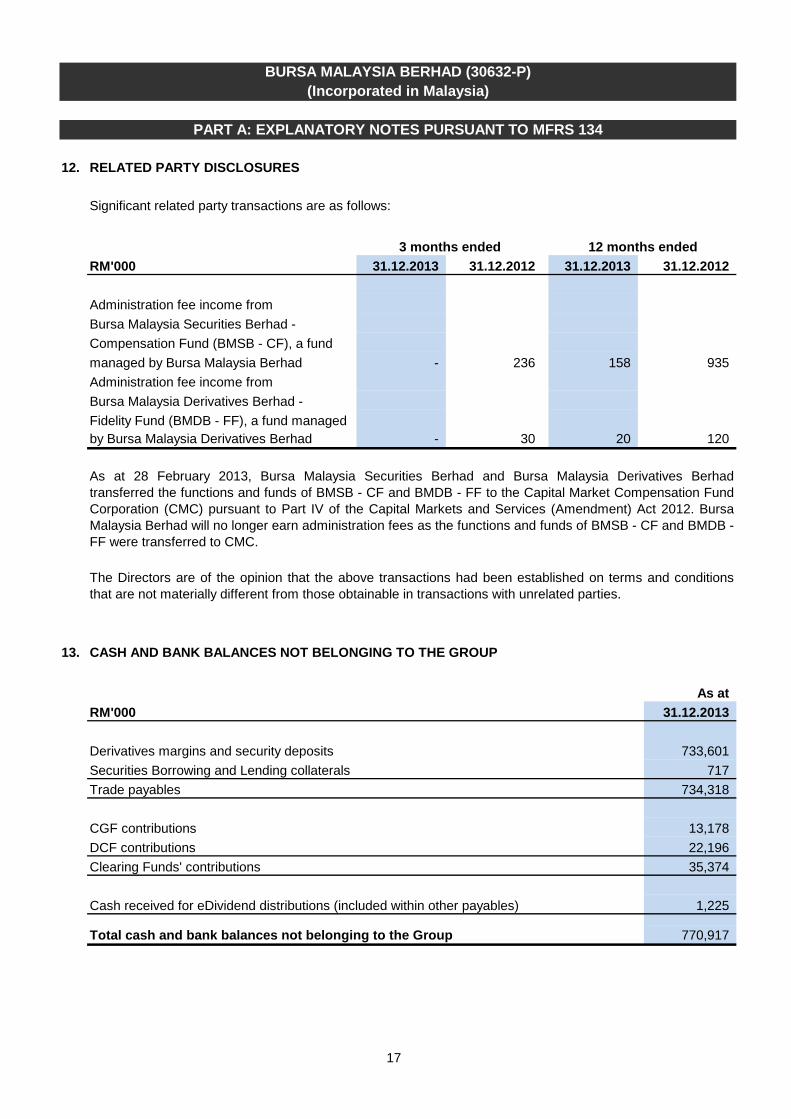
12. RELATED PARTY DISCLOSURES
RM'000 31.12.2013 31.12.2012 31.12.2013 31.12.2012
Administration fee income from Bursa Malaysia Securities Berhad -Compensation Fund (BMSB - CF), a fund managed by Bursa Malaysia Berhad - 236 158 935 Administration fee income from Bursa Malaysia Derivatives Berhad - Fidelity Fund (BMDB - FF), a fund managedby Bursa Malaysia Derivatives Berhad - 30 20 120
13. CASH AND BANK BALANCES NOT BELONGING TO THE GROUP
As atRM'000 31.12.2013
Derivatives margins and security deposits 733,601 Securities Borrowing and Lending collaterals 717 Trade payables 734,318
CGF contributions 13,178 DCF contributions 22,196 Clearing Funds' contributions 35,374
Cash received for eDividend distributions (included within other payables) 1,225
Total cash and bank balances not belonging to the Group 770,917
BURSA MALAYSIA BERHAD (30632-P)(Incorporated in Malaysia)
PART A: EXPLANATORY NOTES PURSUANT TO MFRS 134
Significant related party transactions are as follows:
The Directors are of the opinion that the above transactions had been established on terms and conditionsthat are not materially different from those obtainable in transactions with unrelated parties.
12 months ended
As at 28 February 2013, Bursa Malaysia Securities Berhad and Bursa Malaysia Derivatives Berhadtransferred the functions and funds of BMSB - CF and BMDB - FF to the Capital Market Compensation FundCorporation (CMC) pursuant to Part IV of the Capital Markets and Services (Amendment) Act 2012. BursaMalaysia Berhad will no longer earn administration fees as the functions and funds of BMSB - CF and BMDB -FF were transferred to CMC.
3 months ended
18
BURSA MALAYSIA BERHAD (30632-P)(Incorporated in Malaysia)
PART A: EXPLANATORY NOTES PURSUANT TO MFRS 134
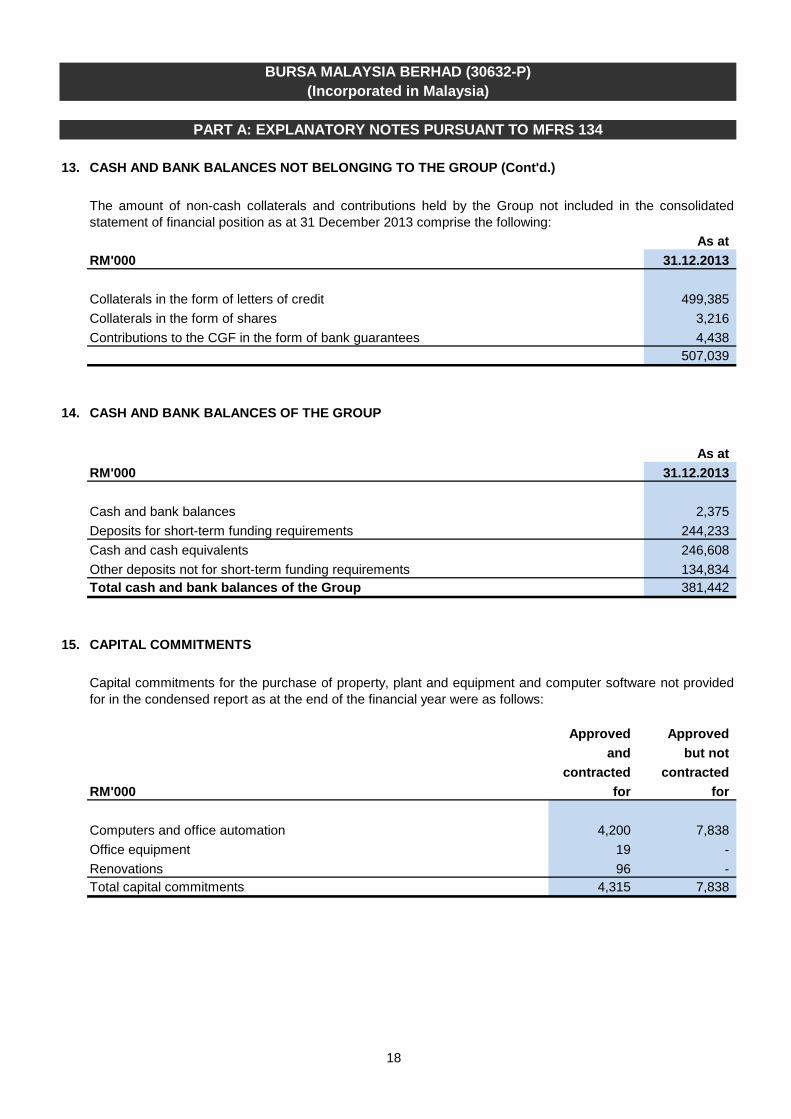
13. CASH AND BANK BALANCES NOT BELONGING TO THE GROUP (Cont'd.)
As atRM'000 31.12.2013
Collaterals in the form of letters of credit 499,385 Collaterals in the form of shares 3,216 Contributions to the CGF in the form of bank guarantees 4,438
507,039
14. CASH AND BANK BALANCES OF THE GROUP
As atRM'000 31.12.2013
Cash and bank balances 2,375 Deposits for short-term funding requirements 244,233 Cash and cash equivalents 246,608 Other deposits not for short-term funding requirements 134,834 Total cash and bank balances of the Group 381,442
15. CAPITAL COMMITMENTS
Approved Approvedand but not
contracted contractedRM'000 for for
Computers and office automation 4,200 7,838 Office equipment 19 - Renovations 96 - Total capital commitments 4,315 7,838
Capital commitments for the purchase of property, plant and equipment and computer software not providedfor in the condensed report as at the end of the financial year were as follows:
The amount of non-cash collaterals and contributions held by the Group not included in the consolidatedstatement of financial position as at 31 December 2013 comprise the following:
19
BURSA MALAYSIA BERHAD (30632-P)(Incorporated in Malaysia)
PART A: EXPLANATORY NOTES PURSUANT TO MFRS 134
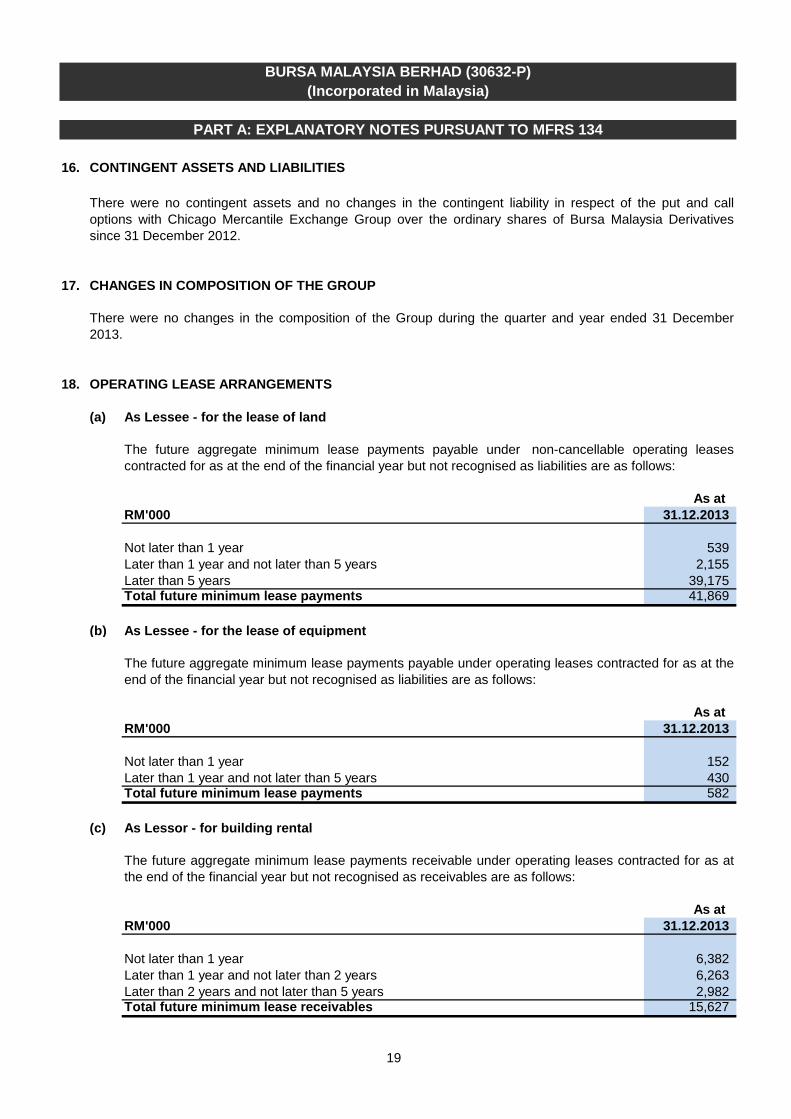
16. CONTINGENT ASSETS AND LIABILITIES
17. CHANGES IN COMPOSITION OF THE GROUP
18. OPERATING LEASE ARRANGEMENTS
(a) As Lessee - for the lease of land
As at RM'000 31.12.2013
Not later than 1 year 539 Later than 1 year and not later than 5 years 2,155 Later than 5 years 39,175 Total future minimum lease payments 41,869
(b) As Lessee - for the lease of equipment
As at RM'000 31.12.2013
Not later than 1 year 152 Later than 1 year and not later than 5 years 430 Total future minimum lease payments 582
(c) As Lessor - for building rental
As at RM'000 31.12.2013
Not later than 1 year 6,382 Later than 1 year and not later than 2 years 6,263 Later than 2 years and not later than 5 years 2,982 Total future minimum lease receivables 15,627
The future aggregate minimum lease payments receivable under operating leases contracted for as atthe end of the financial year but not recognised as receivables are as follows:
The future aggregate minimum lease payments payable under non-cancellable operating leasescontracted for as at the end of the financial year but not recognised as liabilities are as follows:
There were no contingent assets and no changes in the contingent liability in respect of the put and calloptions with Chicago Mercantile Exchange Group over the ordinary shares of Bursa Malaysia Derivativessince 31 December 2012.
The future aggregate minimum lease payments payable under operating leases contracted for as at theend of the financial year but not recognised as liabilities are as follows:
There were no changes in the composition of the Group during the quarter and year ended 31 December2013.
20
BURSA MALAYSIA BERHAD (30632-P)(Incorporated in Malaysia)
PART A: EXPLANATORY NOTES PURSUANT TO MFRS 134
19. EVENT AFTER THE REPORTING PERIOD
(1)
(i) 40 non-cumulative "A" preference shares;
(2)
The capital reduction via the cancellation of the existing preference shares and repayment of the parvalue thereof was approved by the ordinary shareholders and the holders of the non-cumulative "A", "B"and "C" preference shares of Bursa Malaysia Derivatives on 24 January 2014. This would need to befurther confirmed by the High Court of Malaya.
Subject to the completion of (1), new redeemable “A” or “B” preference shares of RM1.00 each will beissued to the entitled non-cumulative “A”, “B” and “C” preference shareholders and redeemed based onthe terms and conditions of the new redeemable preference shares. The transactions will fully utilise thebalance in Bursa Malaysia Derivatives' share premium account.
On 6 December 2013, the Board of Directors of Bursa Malaysia Derivatives approved the proposed revamp of Bursa Malaysia Derivatives' participantship structure by creating of a single trading right which would enableBursa Malaysia Derivatives TPs to trade all categories of products on the derivatives exchange (“theProposed Revamp”).
The Proposed Revamp involves the following:
(ii) 17 non-cumulative "B" preference shares; and
(iii) 28 non-cumulative "C" preference shares.
A capital reduction exercise via the cancellation of all the issued and paid-up non-cumulative "A", "B"and "C" preference shares of RM1.00 each and repayment of the par value thereof. The number ofexisting non-cumulative preference shares in issue as at 31 December 2013 are as follows:
21
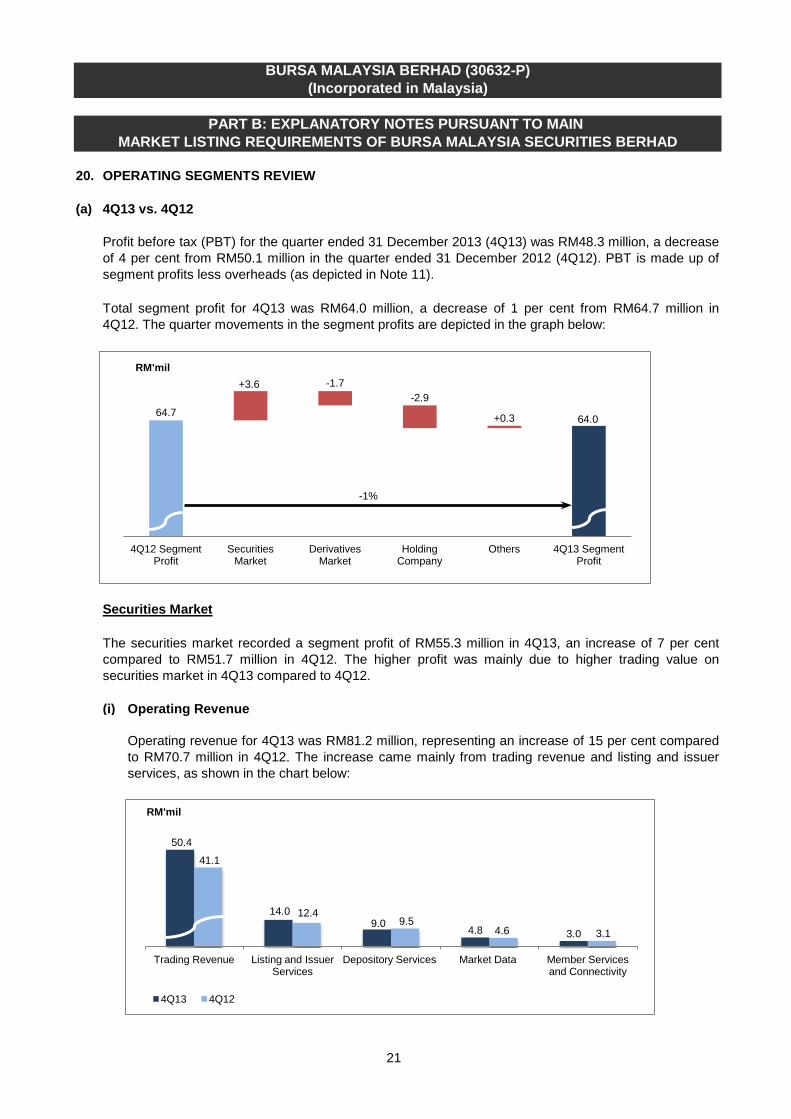
20. OPERATING SEGMENTS REVIEW
(a)
(i)
BURSA MALAYSIA BERHAD (30632-P)(Incorporated in Malaysia)
PART B: EXPLANATORY NOTES PURSUANT TO MAIN MARKET LISTING REQUIREMENTS OF BURSA MALAYSIA SECURITIES BERHAD
Securities Market
4Q13 vs. 4Q12
Profit before tax (PBT) for the quarter ended 31 December 2013 (4Q13) was RM48.3 million, a decreaseof 4 per cent from RM50.1 million in the quarter ended 31 December 2012 (4Q12). PBT is made up ofsegment profits less overheads (as depicted in Note 11).
Operating Revenue
Total segment profit for 4Q13 was RM64.0 million, a decrease of 1 per cent from RM64.7 million in4Q12. The quarter movements in the segment profits are depicted in the graph below:
Operating revenue for 4Q13 was RM81.2 million, representing an increase of 15 per cent comparedto RM70.7 million in 4Q12. The increase came mainly from trading revenue and listing and issuerservices, as shown in the chart below:
The securities market recorded a segment profit of RM55.3 million in 4Q13, an increase of 7 per centcompared to RM51.7 million in 4Q12. The higher profit was mainly due to higher trading value onsecurities market in 4Q13 compared to 4Q12.
50.4
14.0 9.0 4.8 3.0
41.1
12.4 9.5
4.6 3.1
Trading Revenue Listing and Issuer Services
Depository Services Market Data Member Services and Connectivity
RM'mil
4Q13 4Q12
64.7
39 51
55
64.0
+3.6 -1.7 -2.9
+0.3
4Q12 Segment Profit
Securities Market
Derivatives Market
Holding Company
Others 4Q13 Segment Profit
RM'mil
-1%
22
BURSA MALAYSIA BERHAD (30632-P)(Incorporated in Malaysia)
PART B: EXPLANATORY NOTES PURSUANT TO MAIN MARKET LISTING REQUIREMENTS OF BURSA MALAYSIA SECURITIES BERHAD
20. OPERATING SEGMENTS REVIEW (CONT'D.)
(a)
(i)
>
>
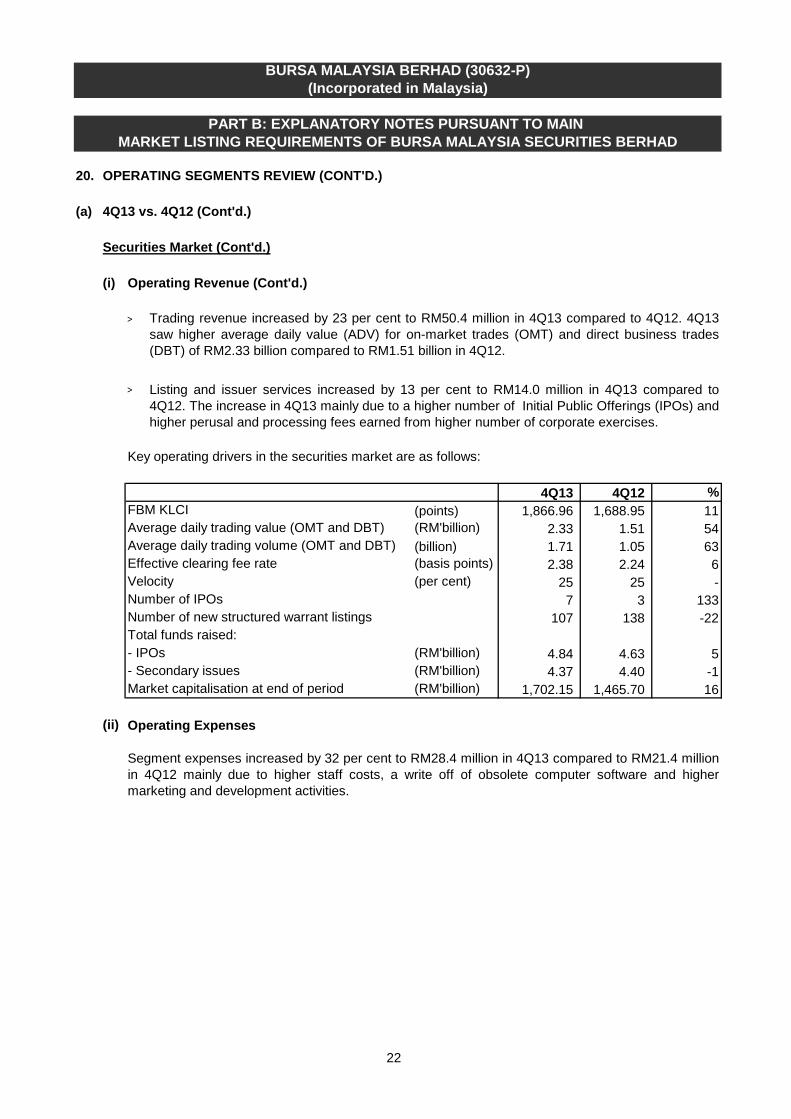
4Q13 4Q12 % FBM KLCI (points) 1,866.96 1,688.95 11Average daily trading value (OMT and DBT) (RM'billion) 2.33 1.51 54Average daily trading volume (OMT and DBT) (billion) 1.71 1.05 63Effective clearing fee rate (basis points) 2.38 2.24 6Velocity (per cent) 25 25 -Number of IPOs 7 3 133Number of new structured warrant listings 107 138 -22Total funds raised:- IPOs (RM'billion) 4.84 4.63 5- Secondary issues (RM'billion) 4.37 4.40 -1Market capitalisation at end of period (RM'billion) 1,702.15 1,465.70 16
(ii) Operating Expenses
Trading revenue increased by 23 per cent to RM50.4 million in 4Q13 compared to 4Q12. 4Q13saw higher average daily value (ADV) for on-market trades (OMT) and direct business trades(DBT) of RM2.33 billion compared to RM1.51 billion in 4Q12.
Key operating drivers in the securities market are as follows:
Operating Revenue (Cont'd.)
Listing and issuer services increased by 13 per cent to RM14.0 million in 4Q13 compared to4Q12. The increase in 4Q13 mainly due to a higher number of Initial Public Offerings (IPOs) andhigher perusal and processing fees earned from higher number of corporate exercises.
Securities Market (Cont'd.)
4Q13 vs. 4Q12 (Cont'd.)
Segment expenses increased by 32 per cent to RM28.4 million in 4Q13 compared to RM21.4 millionin 4Q12 mainly due to higher staff costs, a write off of obsolete computer software and highermarketing and development activities.
23
BURSA MALAYSIA BERHAD (30632-P)(Incorporated in Malaysia)
PART B: EXPLANATORY NOTES PURSUANT TO MAIN MARKET LISTING REQUIREMENTS OF BURSA MALAYSIA SECURITIES BERHAD
20. OPERATING SEGMENTS REVIEW (CONT'D.)
(a)
(i)
Key operating drivers in the derivatives market are as follows:
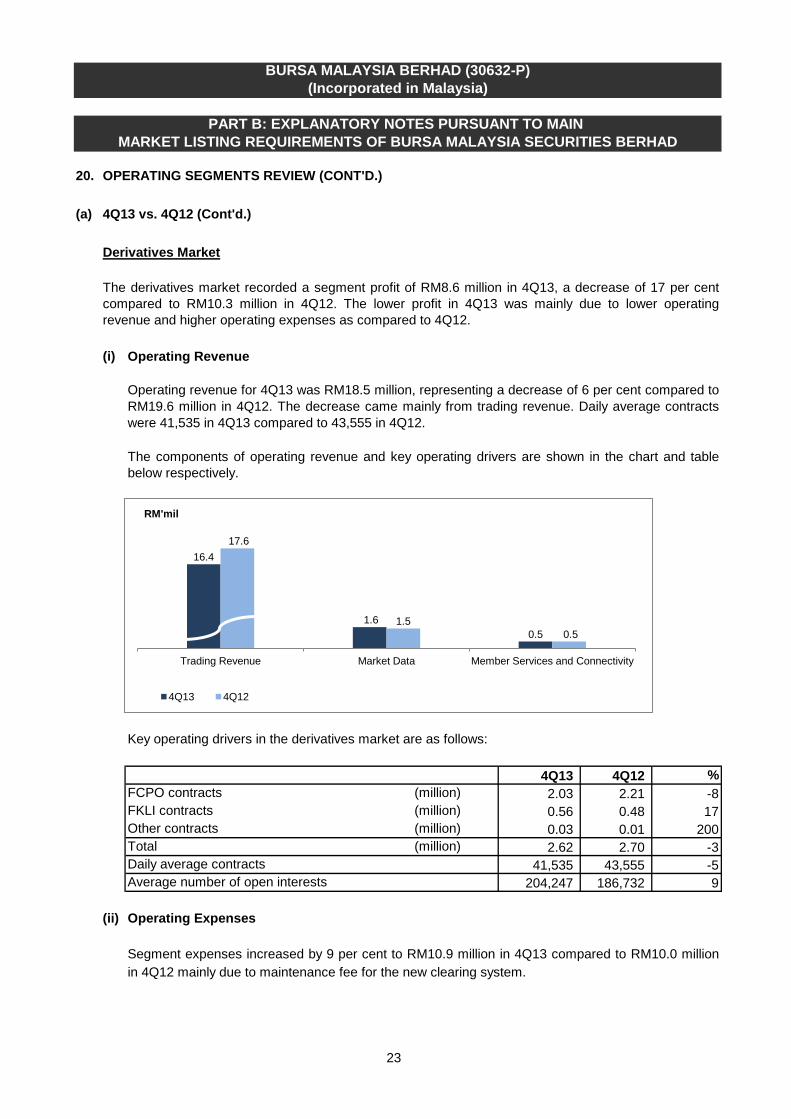
4Q13 4Q12 % FCPO contracts (million) 2.03 2.21 -8FKLI contracts (million) 0.56 0.48 17Other contracts (million) 0.03 0.01 200Total (million) 2.62 2.70 -3Daily average contracts 41,535 43,555 -5Average number of open interests 204,247 186,732 9
(ii)
Operating Revenue
Operating Expenses
4Q13 vs. 4Q12 (Cont'd.)
The components of operating revenue and key operating drivers are shown in the chart and tablebelow respectively.
Segment expenses increased by 9 per cent to RM10.9 million in 4Q13 compared to RM10.0 millionin 4Q12 mainly due to maintenance fee for the new clearing system.
The derivatives market recorded a segment profit of RM8.6 million in 4Q13, a decrease of 17 per centcompared to RM10.3 million in 4Q12. The lower profit in 4Q13 was mainly due to lower operatingrevenue and higher operating expenses as compared to 4Q12.
Derivatives Market
Operating revenue for 4Q13 was RM18.5 million, representing a decrease of 6 per cent compared toRM19.6 million in 4Q12. The decrease came mainly from trading revenue. Daily average contractswere 41,535 in 4Q13 compared to 43,555 in 4Q12.
16.4
1.6 0.5
17.6
1.5 0.5
Trading Revenue Market Data Member Services and Connectivity
RM'mil
4Q13 4Q12
24
BURSA MALAYSIA BERHAD (30632-P)(Incorporated in Malaysia)
PART B: EXPLANATORY NOTES PURSUANT TO MAIN MARKET LISTING REQUIREMENTS OF BURSA MALAYSIA SECURITIES BERHAD
20. OPERATING SEGMENTS REVIEW (CONT'D.)
(a)
Others
Exchange Holding Company
4Q13 vs. 4Q12 (Cont'd.)
Others segment is made up of our BSAS business, bonds trading and offshore exchange. The Otherssegment improved from RM0.1 million in 4Q12 to RM0.3 million in 4Q13 as a result of the increasing useof BSAS as a commodity murabahah trading platform.
Overheads increased by 7 per cent to RM15.7 million in 4Q13 compared to RM14.6 million in 4Q12 as aresult of higher corporate advertisements in 4Q13.
The exchange holding company recorded a segment loss position of RM0.2 million in 4Q13 compared tothe 4Q12 as a result of higher staff costs.
Overheads
25
BURSA MALAYSIA BERHAD (30632-P)(Incorporated in Malaysia)
PART B: EXPLANATORY NOTES PURSUANT TO MAIN MARKET LISTING REQUIREMENTS OF BURSA MALAYSIA SECURITIES BERHAD
20. OPERATING SEGMENTS REVIEW (CONT'D.)
(b)
(i)
The securities market recorded a segment profit of RM256.8 million in FY2013 compared to RM223.2million in FY2012. The higher profit in FY2013 was mainly a result of higher trading value on thesecurities market as compared to FY2012.
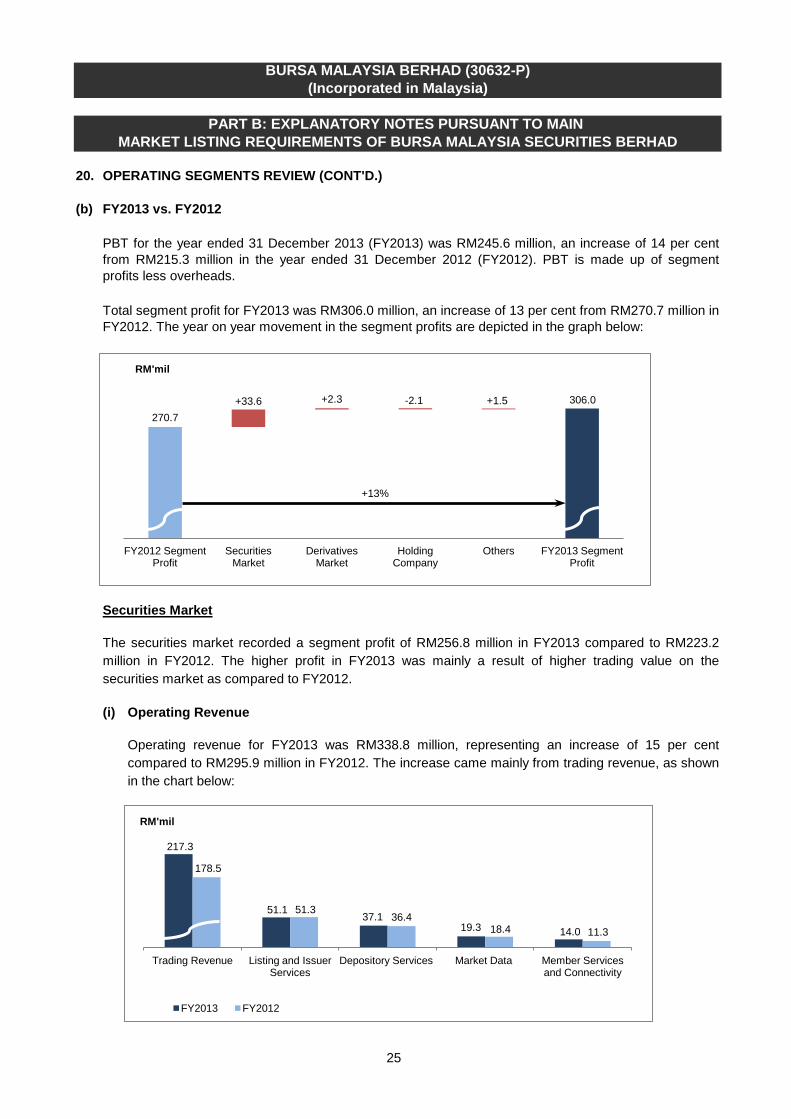
Total segment profit for FY2013 was RM306.0 million, an increase of 13 per cent from RM270.7 million inFY2012. The year on year movement in the segment profits are depicted in the graph below:
FY2013 vs. FY2012
PBT for the year ended 31 December 2013 (FY2013) was RM245.6 million, an increase of 14 per centfrom RM215.3 million in the year ended 31 December 2012 (FY2012). PBT is made up of segmentprofits less overheads.
Securities Market
Operating Revenue
Operating revenue for FY2013 was RM338.8 million, representing an increase of 15 per centcompared to RM295.9 million in FY2012. The increase came mainly from trading revenue, as shownin the chart below:
270.7
39 51 55 55
306.0 +33.6 +2.3 -2.1 +1.5
FY2012 Segment Profit
Securities Market
Derivatives Market
Holding Company
Others FY2013 Segment Profit
RM'mil
+13%
217.3
51.1 37.1
19.3 14.0
178.5
51.3 36.4
18.4 11.3
Trading Revenue Listing and Issuer Services
Depository Services Market Data Member Services and Connectivity
RM'mil
FY2013 FY2012

26
BURSA MALAYSIA BERHAD (30632-P)(Incorporated in Malaysia)
PART B: EXPLANATORY NOTES PURSUANT TO MAIN MARKET LISTING REQUIREMENTS OF BURSA MALAYSIA SECURITIES BERHAD
20. OPERATING SEGMENTS REVIEW (CONT'D.)
(b)
(i)
>
>
Key operating drivers in the securities market are as follows:
FY2013 FY2012 % FBM KLCI (points) 1,866.96 1,688.95 11Average daily trading value (OMT and DBT) (RM'billion) 2.14 1.67 28Average daily trading volume (OMT and DBT) (billion) 1.57 1.36 15Effective clearing fee rate (basis points) 2.30 2.29 -Velocity (per cent) 30 28 7Number of IPOs 18 17 6Number of new structured warrant listings 410 551 -26Total funds raised:- IPOs (RM'billion) 8.21 22.94 -64- Secondary issues (RM'billion) 14.34 8.79 63Market capitalisation at end of year (RM'billion) 1,702.15 1,465.70 16
(ii)
Securities Market (Cont'd.)
Operating Revenue (Cont'd.)
FY2013 vs. FY2012 (Cont'd.)
Operating Expenses
Trading revenue increased by 22 per cent to RM217.3 million in FY2013 compared to FY2012.FY2013 saw a higher ADV for OMT and DBT of RM2.14 billion compared to RM1.67 billion inFY2012.
Member services and connectivity increased by 24 per cent to RM14.0 million in FY2013compared to FY2012. The higher revenue was a result of a revision in fee structure for Bursaaccess fees in 2013.
Segment expenses increased by 11 per cent to RM92.1 million in FY2013 compared to RM82.9million in FY2012 mainly due to a write off of obsolete computer software and higher staff costs andinformation technology maintenance expenses.
27
BURSA MALAYSIA BERHAD (30632-P)(Incorporated in Malaysia)
PART B: EXPLANATORY NOTES PURSUANT TO MAIN MARKET LISTING REQUIREMENTS OF BURSA MALAYSIA SECURITIES BERHAD
20. OPERATING SEGMENTS REVIEW (CONT'D.)
(b)
(i)
>
>
Key operating drivers in the derivatives market are as follows:
FY2013 FY2012 % FCPO contracts (million) 8.01 7.46 7FKLI contracts (million) 2.68 2.13 26Other contracts (million) 0.05 0.06 -17Total (million) 10.74 9.65 11Daily average contracts 43,490 39,387 10Average number of open interests 212,828 171,518 24
Derivatives Market
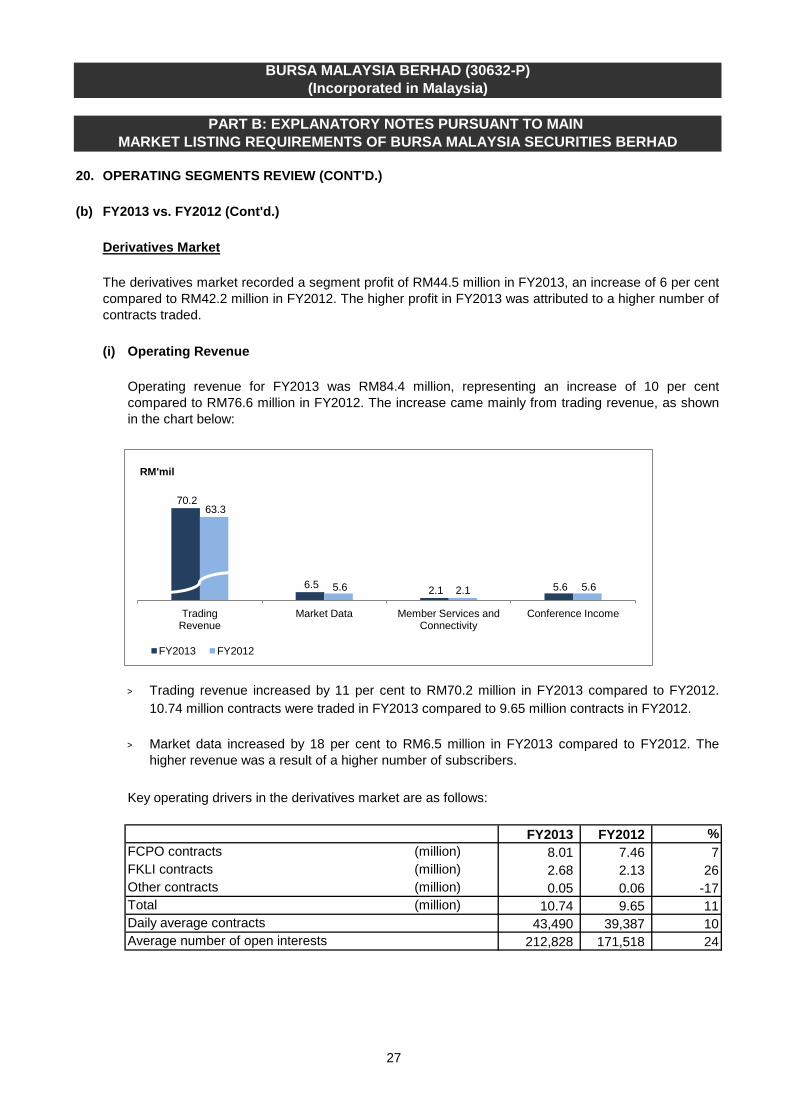
Operating revenue for FY2013 was RM84.4 million, representing an increase of 10 per centcompared to RM76.6 million in FY2012. The increase came mainly from trading revenue, as shownin the chart below:
The derivatives market recorded a segment profit of RM44.5 million in FY2013, an increase of 6 per centcompared to RM42.2 million in FY2012. The higher profit in FY2013 was attributed to a higher number ofcontracts traded.
Operating Revenue
Market data increased by 18 per cent to RM6.5 million in FY2013 compared to FY2012. Thehigher revenue was a result of a higher number of subscribers.
FY2013 vs. FY2012 (Cont'd.)
Trading revenue increased by 11 per cent to RM70.2 million in FY2013 compared to FY2012.10.74 million contracts were traded in FY2013 compared to 9.65 million contracts in FY2012.
70.2
6.5 2.1 5.6
63.3
5.6 2.1 5.6
Trading Revenue
Market Data Member Services and Connectivity
Conference Income
RM'mil
FY2013 FY2012
28
BURSA MALAYSIA BERHAD (30632-P)(Incorporated in Malaysia)
PART B: EXPLANATORY NOTES PURSUANT TO MAIN MARKET LISTING REQUIREMENTS OF BURSA MALAYSIA SECURITIES BERHAD
20. OPERATING SEGMENTS REVIEW (CONT'D.)
(b)
(ii)
Derivatives Market (Cont'd.)
Overheads increased by 9 per cent to RM60.4 million in FY2013 compared to RM55.3 million in FY2012.The higher overheads in FY2013 mainly due to higher staff costs.
Others segment is made up of our BSAS business, bonds trading and offshore exchange. The Otherssegment improved from a loss position of RM0.6 million in FY2012 to a profit position of RM0.9 million inFY2013 as a result of increasing use of BSAS as a commodity murabahah trading platform.
Operating Expenses
The exchange holding company recorded a segment profit of RM3.7 million in FY2013 compared toRM5.8 million in FY2012. The lower profit in FY2013 mainly due to lower broker service fees and interestincome.
Others
Overheads
Segment expenses increased by 17 per cent to RM43.2 million in FY2013 compared to RM36.9million in FY2012. The increase was mainly due to higher service fees charged as a result of theincrease in trade volumes and higher staff costs.
Exchange Holding Company
FY2013 vs. FY2012 (Cont'd.)
29
BURSA MALAYSIA BERHAD (30632-P)(Incorporated in Malaysia)
PART B: EXPLANATORY NOTES PURSUANT TO MAIN MARKET LISTING REQUIREMENTS OF BURSA MALAYSIA SECURITIES BERHAD
21.
(i)
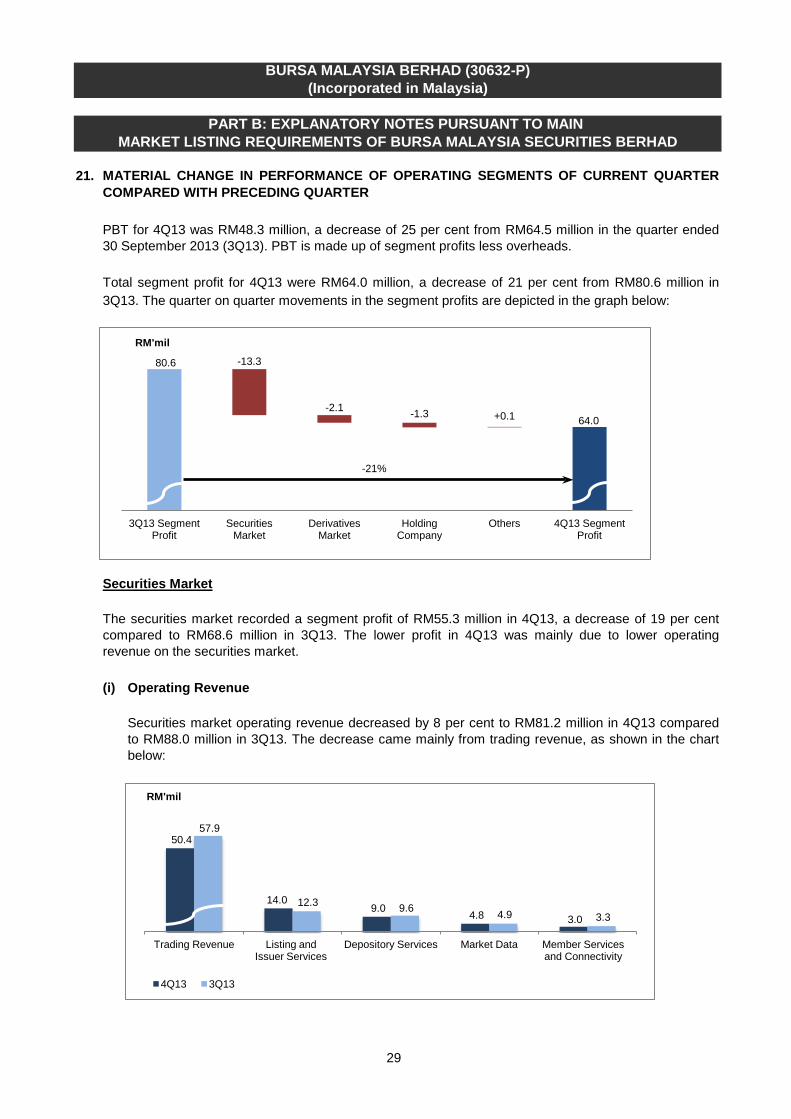
The securities market recorded a segment profit of RM55.3 million in 4Q13, a decrease of 19 per centcompared to RM68.6 million in 3Q13. The lower profit in 4Q13 was mainly due to lower operatingrevenue on the securities market.
Total segment profit for 4Q13 were RM64.0 million, a decrease of 21 per cent from RM80.6 million in3Q13. The quarter on quarter movements in the segment profits are depicted in the graph below:
MATERIAL CHANGE IN PERFORMANCE OF OPERATING SEGMENTS OF CURRENT QUARTERCOMPARED WITH PRECEDING QUARTER
PBT for 4Q13 was RM48.3 million, a decrease of 25 per cent from RM64.5 million in the quarter ended30 September 2013 (3Q13). PBT is made up of segment profits less overheads.
Operating Revenue
Securities Market
Securities market operating revenue decreased by 8 per cent to RM81.2 million in 4Q13 comparedto RM88.0 million in 3Q13. The decrease came mainly from trading revenue, as shown in the chartbelow:
80.6
39 51 55 55
64.0
-13.3
-2.1 -1.3 +0.1
3Q13 Segment Profit
Securities Market
Derivatives Market
Holding Company
Others 4Q13 Segment Profit
RM'mil
-21%
50.4
14.0 9.0 4.8 3.0
57.9
12.3 9.6 4.9 3.3
Trading Revenue Listing and Issuer Services
Depository Services Market Data Member Services and Connectivity
RM'mil
4Q13 3Q13
30
BURSA MALAYSIA BERHAD (30632-P)(Incorporated in Malaysia)
PART B: EXPLANATORY NOTES PURSUANT TO MAIN MARKET LISTING REQUIREMENTS OF BURSA MALAYSIA SECURITIES BERHAD
21.
(i)
>
>
>
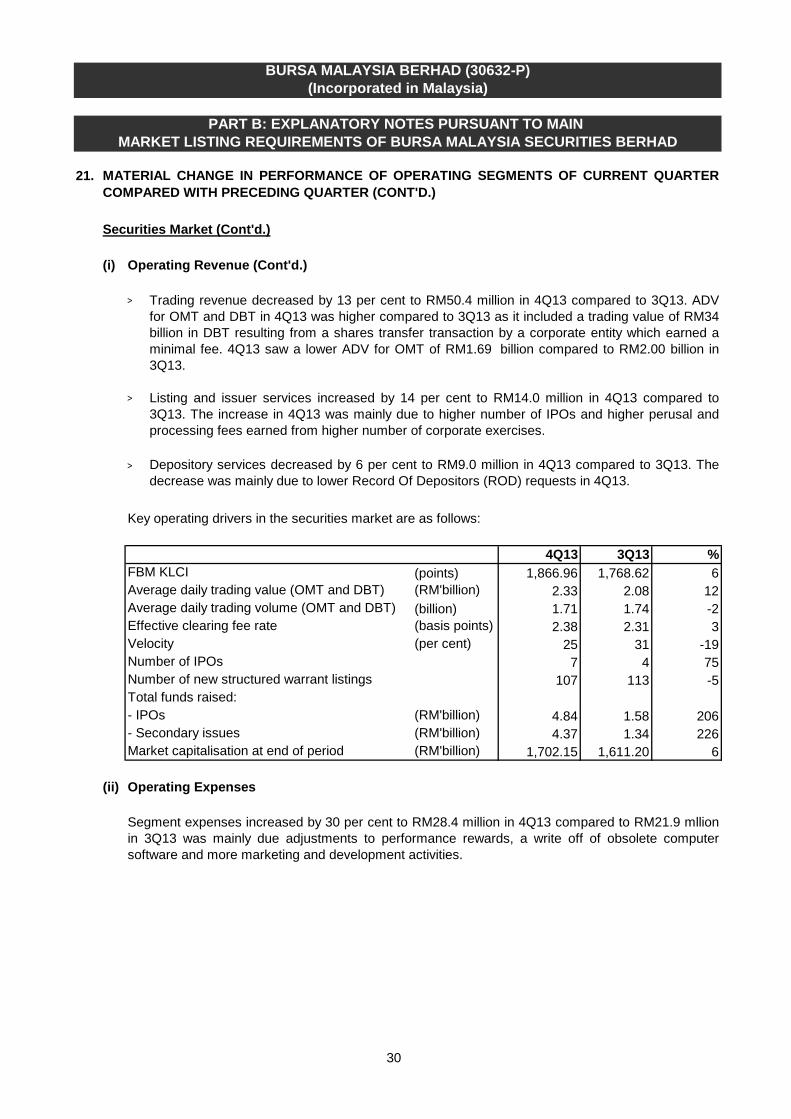
4Q13 3Q13 % FBM KLCI (points) 1,866.96 1,768.62 6Average daily trading value (OMT and DBT) (RM'billion) 2.33 2.08 12Average daily trading volume (OMT and DBT) (billion) 1.71 1.74 -2Effective clearing fee rate (basis points) 2.38 2.31 3Velocity (per cent) 25 31 -19Number of IPOs 7 4 75Number of new structured warrant listings 107 113 -5Total funds raised:- IPOs (RM'billion) 4.84 1.58 206- Secondary issues (RM'billion) 4.37 1.34 226Market capitalisation at end of period (RM'billion) 1,702.15 1,611.20 6
(ii)
Operating Revenue (Cont'd.)
MATERIAL CHANGE IN PERFORMANCE OF OPERATING SEGMENTS OF CURRENT QUARTERCOMPARED WITH PRECEDING QUARTER (CONT'D.)
Trading revenue decreased by 13 per cent to RM50.4 million in 4Q13 compared to 3Q13. ADVfor OMT and DBT in 4Q13 was higher compared to 3Q13 as it included a trading value of RM34billion in DBT resulting from a shares transfer transaction by a corporate entity which earned aminimal fee. 4Q13 saw a lower ADV for OMT of RM1.69 billion compared to RM2.00 billion in3Q13.
Depository services decreased by 6 per cent to RM9.0 million in 4Q13 compared to 3Q13. Thedecrease was mainly due to lower Record Of Depositors (ROD) requests in 4Q13.
Securities Market (Cont'd.)
Key operating drivers in the securities market are as follows:
Listing and issuer services increased by 14 per cent to RM14.0 million in 4Q13 compared to3Q13. The increase in 4Q13 was mainly due to higher number of IPOs and higher perusal andprocessing fees earned from higher number of corporate exercises.
Operating Expenses
Segment expenses increased by 30 per cent to RM28.4 million in 4Q13 compared to RM21.9 mllionin 3Q13 was mainly due adjustments to performance rewards, a write off of obsolete computersoftware and more marketing and development activities.
31
BURSA MALAYSIA BERHAD (30632-P)(Incorporated in Malaysia)
PART B: EXPLANATORY NOTES PURSUANT TO MAIN MARKET LISTING REQUIREMENTS OF BURSA MALAYSIA SECURITIES BERHAD
21.
(i)
Key operating drivers in the derivatives market are as follows:
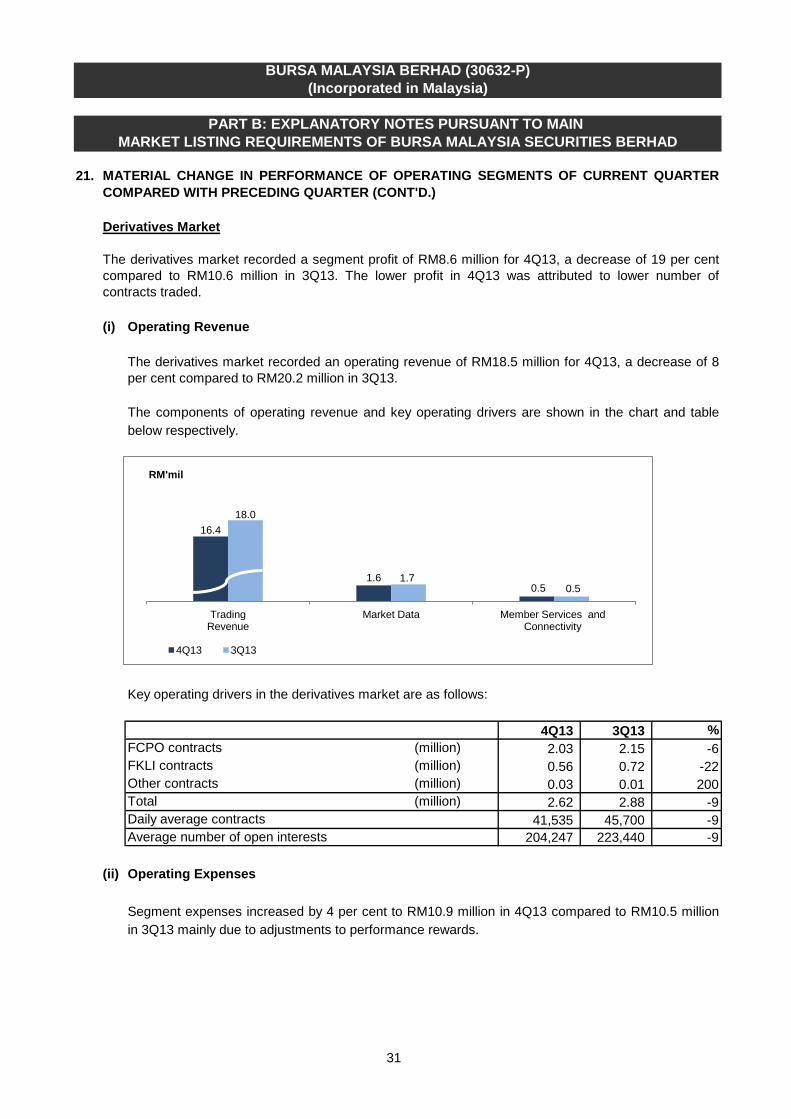
4Q13 3Q13 % FCPO contracts (million) 2.03 2.15 -6FKLI contracts (million) 0.56 0.72 -22Other contracts (million) 0.03 0.01 200Total (million) 2.62 2.88 -9Daily average contracts 41,535 45,700 -9Average number of open interests 204,247 223,440 -9
(ii)
The derivatives market recorded an operating revenue of RM18.5 million for 4Q13, a decrease of 8per cent compared to RM20.2 million in 3Q13.
MATERIAL CHANGE IN PERFORMANCE OF OPERATING SEGMENTS OF CURRENT QUARTERCOMPARED WITH PRECEDING QUARTER (CONT'D.)
Operating Revenue
Segment expenses increased by 4 per cent to RM10.9 million in 4Q13 compared to RM10.5 millionin 3Q13 mainly due to adjustments to performance rewards.
Operating Expenses
The components of operating revenue and key operating drivers are shown in the chart and tablebelow respectively.
The derivatives market recorded a segment profit of RM8.6 million for 4Q13, a decrease of 19 per centcompared to RM10.6 million in 3Q13. The lower profit in 4Q13 was attributed to lower number ofcontracts traded.
Derivatives Market
16.4
1.6 0.5
18.0
1.7 0.5
Trading Revenue
Market Data Member Services and Connectivity
RM'mil
4Q13 3Q13

32
BURSA MALAYSIA BERHAD (30632-P)(Incorporated in Malaysia)
PART B: EXPLANATORY NOTES PURSUANT TO MAIN MARKET LISTING REQUIREMENTS OF BURSA MALAYSIA SECURITIES BERHAD
21.
The exchange holding company recorded a segment loss of RM0.2 million in 4Q13 compared to 3Q13.The segmental loss in 4Q13 was mainly due to lower investment income and adjustments toperformance rewards.
Exchange Holding Company
Others
Others segment is made up of our BSAS business, bonds trading and offshore exchange. The Otherssegment profit was fairly stable at RM0.3 million in 4Q13 and 3Q13.
Overheads
Overheads decreased by 2 per cent to RM15.7 million in 4Q13 compared to RM16.1 million in 3Q13. Thelower overheads in 4Q13 was mainly due to lower information technology maintenance.
MATERIAL CHANGE IN PERFORMANCE OF OPERATING SEGMENTS OF CURRENT QUARTERCOMPARED WITH PRECEDING QUARTER (CONT'D.)
33
22. COMMENTARY ON PROSPECTS AND TARGETS
BURSA MALAYSIA BERHAD (30632-P)(Incorporated in Malaysia)
PART B: EXPLANATORY NOTES PURSUANT TO MAIN MARKET LISTING REQUIREMENTS OF BURSA MALAYSIA SECURITIES BERHAD
Moving forward, we expect the global environment to continue to be challenging. Malaysia's economy ishowever expected to remain resilient, supported by sustained domestic demand, private investment andtargeted economic measures to boost the country's fiscal health. Interest on the securities market isexpected to continue to be affected by global events and domestic developments described above.
On the derivatives front, with the expected Quantitative Easing tapering and the extreme cold weatherpatterns that have impacted many parts of the world, the financial, equity and commodity markets areexpected to be uncertain and volatile. We thus expect our derivatives trading volumes to continue to move on an upward trend in 2014.
The Exchange will continue to focus on unlocking the potential within the Malaysian capital market byextracting value from past initiatives and driving growth from new opportunities. We will pursue ourefforts to expand product and service offerings and to further enhance market accessibility for bothmarket participants and investors. The refresh of our trading and clearing systems has strengthened ourmarketplace and we will continue to enhance our regulatory framework to ensure an efficient, orderly andtransparent market.
Barring any unforseen circumstances, we expect our financial performance to improve in the comingyear.

34
23. INCOME TAX EXPENSE
RM'000 31.12.2013 31.12.2012 31.12.2013 31.12.2012
Income tax- Current provision 13,561 13,146 68,602 58,584 - (Over)/under provision of tax in prior years - - (7,434) 622
13,561 13,146 61,168 59,206
Deferred tax- Relating to origination and reversal of temporary differences (203) (448) (2,288) (427) - Under/(over) provision of tax in prior years - (25) 7,315 (326)
(203) (473) 5,027 (753)
Total income tax expense 13,358 12,673 66,195 58,453
24. RETAINED EARNINGS
As at As at As atRM'000 31.12.2013 31.12.2012 01.01.2012
Realised 395,350 475,418 456,989 Unrealised (11,414) (6,474) (6,338)
383,936 468,944 450,651 Consolidation adjustments (974) 5,312 11,411 Total retained earnings 382,962 474,256 462,062
25. CORPORATE PROPOSALS
26. BORROWINGS AND DEBT SECURITIES
As at the reporting date, there were no short-term borrowings and the Group had not issued any debtsecurities.
There were no corporate proposals announced but not completed as at the reporting date.
Income tax is calculated at the Malaysian statutory tax rate of 25% of the estimated assessable profitfor the period.
The effective tax rate of the Group for the current and previous corresponding quarters were higherthan the statutory tax rate of the respective year principally due to certain expenses which were notdeductible for tax purposes.
BURSA MALAYSIA BERHAD (30632-P)(Incorporated in Malaysia)
PART B: EXPLANATORY NOTES PURSUANT TO MAIN MARKET LISTING REQUIREMENTS OF BURSA MALAYSIA SECURITIES BERHAD
12 months ended3 months ended
35
BURSA MALAYSIA BERHAD (30632-P)(Incorporated in Malaysia)
PART B: EXPLANATORY NOTES PURSUANT TO MAIN MARKET LISTING REQUIREMENTS OF BURSA MALAYSIA SECURITIES BERHAD
27. CHANGES IN MATERIAL LITIGATION
There was no material litigation against the Group as at the reporting date.
28. PROPOSED DIVIDENDS
29. EPS
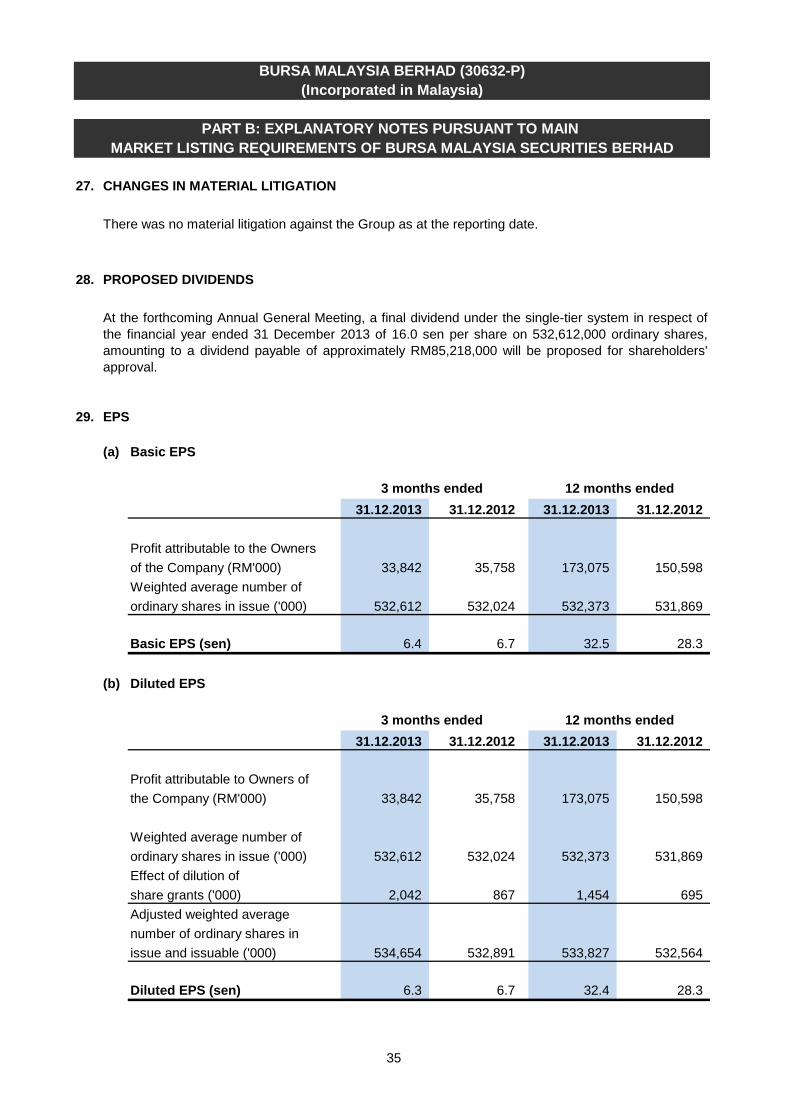
(a) Basic EPS
31.12.2013 31.12.2012 31.12.2013 31.12.2012
Profit attributable to the Owners of the Company (RM'000) 33,842 35,758 173,075 150,598 Weighted average number of ordinary shares in issue ('000) 532,612 532,024 532,373 531,869
Basic EPS (sen) 6.4 6.7 32.5 28.3
(b) Diluted EPS
31.12.2013 31.12.2012 31.12.2013 31.12.2012
Profit attributable to Owners of the Company (RM'000) 33,842 35,758 173,075 150,598
Weighted average number of ordinary shares in issue ('000) 532,612 532,024 532,373 531,869Effect of dilution of share grants ('000) 2,042 867 1,454 695 Adjusted weighted average number of ordinary shares in issue and issuable ('000) 534,654 532,891 533,827 532,564
Diluted EPS (sen) 6.3 6.7 32.4 28.3
At the forthcoming Annual General Meeting, a final dividend under the single-tier system in respect ofthe financial year ended 31 December 2013 of 16.0 sen per share on 532,612,000 ordinary shares,amounting to a dividend payable of approximately RM85,218,000 will be proposed for shareholders'approval.
12 months ended
12 months ended3 months ended
3 months ended
36
BURSA MALAYSIA BERHAD (30632-P)(Incorporated in Malaysia)
PART B: EXPLANATORY NOTES PURSUANT TO MAIN MARKET LISTING REQUIREMENTS OF BURSA MALAYSIA SECURITIES BERHAD
30. AUDITORS' REPORT ON PRECEDING ANNUAL FINANCIAL STATEMENTS
31. REVIEW BY EXTERNAL AUDITORS
32. AUTHORISED FOR ISSUE
The condensed consolidated interim financial statements were authorised for issue by the Board ofDirectors in accordance with a resolution of the Directors on 29 January 2014.
The auditors' report on the financial statements for the financial year ended 31 December 2012 wasunqualified.
The Board had engaged the external auditors to review and report on the condensed consolidatedfinancial statements of Bursa Malaysia Berhad for each of the three quarters ended 31 March 2013, 30June 2013, and 30 September 2013 during the financial year, in accordance with InternationalStandard on Review Engagements 2410, “Review of Interim Financial Information Performed by theIndependent Auditor of the Entity”.
The external auditors reported to the Board that nothing has come to their attention that causes themto believe that the said condensed consolidated financial statements were not prepared, in all materialrespects, in accordance with MFRS 134 Interim Financial Reporting and in accordance with IAS 34Interim Financial Reporting issued by the IASB. The report was made to the Board in accordance tothe terms of reference with the external auditors and for no other purpose.