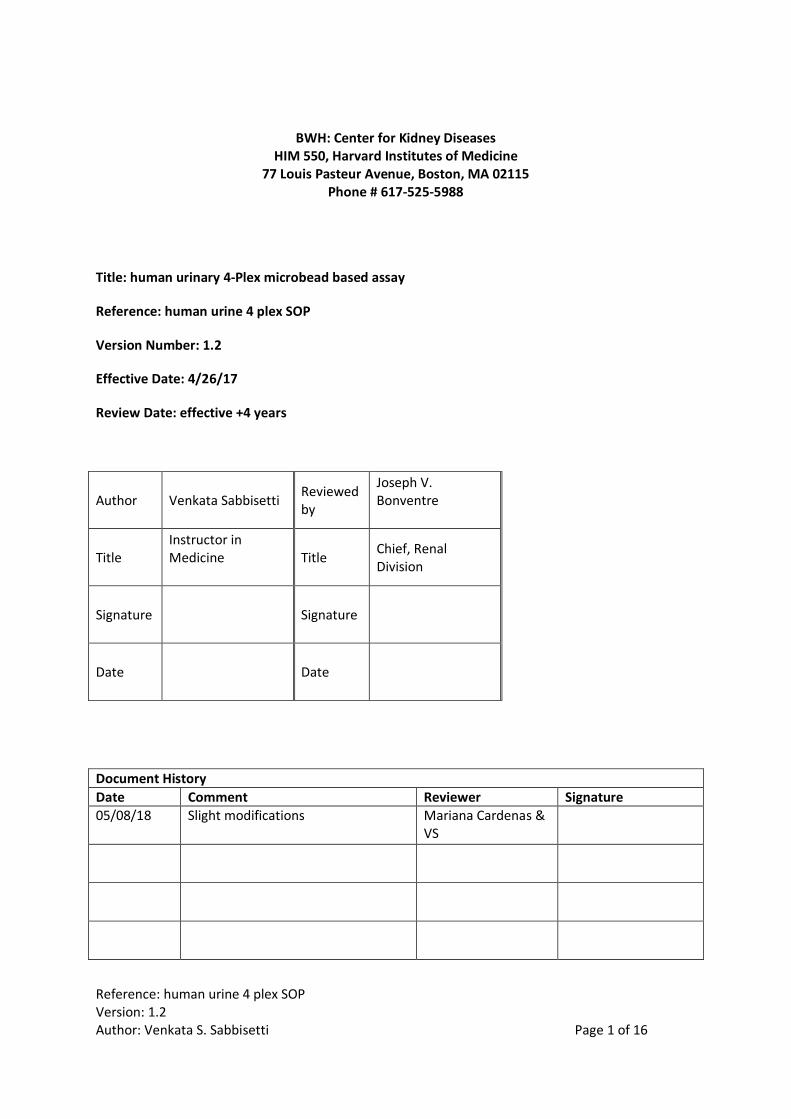
bwh: center for kidney diseases him 550, harvard institutes of … · epidermal growth factor...
TRANSCRIPT
Reference: human urine 4 plex SOP Version: 1.2 Author: Venkata S. Sabbisetti Page 1 of 16
BWH: Center for Kidney Diseases HIM 550, Harvard Institutes of Medicine
77 Louis Pasteur Avenue, Boston, MA 02115 Phone # 617-525-5988
Title: human urinary 4-Plex microbead based assay
Reference: human urine 4 plex SOP
Version Number: 1.2
Effective Date: 4/26/17
Review Date: effective +4 years
Author Venkata Sabbisetti Reviewed by
Joseph V. Bonventre
Title Instructor in Medicine
Title Chief, Renal Division
Signature Signature
Date Date
Document History
Date Comment Reviewer Signature 05/08/18 Slight modifications Mariana Cardenas &
VS

Reference: human urine 4 plex SOP Version: 1.2 Author: Venkata S. Sabbisetti Page 2 of 16
1. Purpose ............................................................................................................................................. 3
2. Introduction ...................................................................................................................................... 3
3. Sample Collection, Preperation & Storage ....................................................................................... 3
4. Procedure ......................................................................................................................................... 3
4.1. Location ..................................................................................................................................... 3
4.2. Required equipment / reagents ................................................................................................ 3
4.3. Buffer preparation ..................................................................................................................... 4
4.4. Microbead preparation ............................................................................................................. 5
4.5. Experimental Procedure ............................................................................................................ 6
4.6 Equipment ................................................................................................................................. 7
4.7 Plate layout ................................................................................................................................ 8
5. Data Generation & Processing .......................................................................................................10
5.1 Data output ................................................................................................................................10
5.2 Standard curve generation ........................................................................................................10
5.3 Data processing and caliculations ..............................................................................................11
6. Quality Control ...............................................................................................................................12
6.1 Quality control of the assay .......................................................................................................12
6.2 Quality control of each sample ..................................................................................................14
6.3 Quality control trouble shooting procedure ..............................................................................14
6.4 Data Storage & Reporting ..........................................................................................................14
6.5 4-Plex assay parameters ............................................................................................................15
7. References ......................................................................................................................................15
8. Product inserts ...............................................................................................................................16

Reference: human urine 4 plex SOP Version: 1.2 Author: Venkata S. Sabbisetti Page 3 of 16
1. Purpose
This Standard Operating Procedure (SOP) describes the process for the quantitative assessment of
ectodomain of Kidney injury molecule-1 (KIM-1), human Chitinase-3-like protein 1 (YKL-40),
Epidermal growth factor (EGF), and Monocyte chemoattractant Protein-1 (MCP-1) in human urine
specimens. The concentration of biomarkers in urine will be measured using a microbead-based
sandwich ELISA method that was developed and extensively validated in our laboratory.
2. Introduction
This SOP describes assays for studies designed to evaluate the utility of kidney injury markers and
inflammatory markers to predict the progression of kidney disease.
3. Sample Collection, Handling & Storage
Frozen plasma and urine samples received from investigators by the BWH central laboratory will be
immediately stored at – 80 °C. Our data indicate that KIM-1, EGF, MCP-1, and YKL 40 are stable for
up to at least 5 freeze thaw cycles. All the personnel handling the specimens will have undergone
Environmental Health & Safety training at Brigham & Women’s Hospital. Protective gear including
lab coats and gloves must be worn while working in the laboratory.
4. Procedure
4.1. Location
Harvard Institutes of Medicine Room 550
Renal Division/ Department of Medicine/ Brigham and Women’s Hospital
4.2. Required equipment / reagents
• 96 well micro filter plate (Millipore, Catalog # MAVBN 1250)
• Biotek EL406 Washer/Dispenser
• Refrigerated Centrifuge (Eppendorf 5430R Rotor F-35-6-30)
• Bio-Plex Luminex 200 &100 readers (Bio-Rad)
• MilliQ water (Type 1, reagent grade water)
• Refrigerated bench top centrifuge for sample centrifugation (Sorvall Bench top swing bucket centrifuge, Rotor RTH-250)
• Refrigerated Centrifuge for bead coupling reactions (Eppendorf 5430R, Rotor FA-45-30-11)
• Vortexe (Denville Scientific)
• Electronic Multichannel pipettes o VIAFLO II Electronic pipettes
• VIAFLO Electronic Pipets: single (Part # 4013), 8 (Part # 4624) and 12 (Part # 4632 and 4633) channels.
o Single Channel Manual Pipettes
• Rainin Classic 0.5 μl-10 μl (catalog # PR-10)
• Rainin Classic 10 μl-100 μl (catalog # PR-100)
• Rainin Classic 100 μl-1000 μl (catalog # PR-1000)

Reference: human urine 4 plex SOP Version: 1.2 Author: Venkata S. Sabbisetti Page 4 of 16
• Reagent Reservoirs o 100 ml reagent reservoir (Integra, catalog # 4322) o 25 ml reagent reservoir (Integra, catalog # 4312)
• Plate shaker (Denville Scientific)
• Orbital Plate shaker (IKA & Denville Scientific, Max speed 11000 rpm)
• 30C incubator (Thermo Scientific)
• Sample Diluent (HBS/BSA/Tween: 5.95g HEPES, 1.46g NaCl, 2.5g BSA, 0.25ml Tween-20, 250ml H2O adjust final pH to 7.4; filter prior to use, and store at 4°C)
• Magnetic microbeads coupled to capture antibodies of KIM-1, EGF, MCP-1, and YKL 40
• Capture Antibodies: o Human/Primate Chitinase 3-like 1 monoclonal, clone 384327 (Bio-techne, catalog #
MAB25991) o Human MCP-1 monoclonal, clone 23007 (Bio-techne, catalog # MAB679) o Human KIM-1, polyclonal (Bio-techne, catalog # AF1750) o Human EGF antibody (Bio-techne, catalog # MAB236)
• Detection Antibodies: o Human/Primate Chitinase 3-like 1 polyclonal (Bio-techne, catalog # BAF2599) o Human MCP-1 polyclonal (Bio-techne, catalog # BAF279) o Human KIM-1, polyclonal (Bio-techne, catalog # BAF1750) o Human EGF monoclonal (Bio-techne,catalog # BAF236)
• Recombinant Proteins: o Human/Primate Chitinase 3-like 1 recombinant protein (Bio-techne, catalog # 2599-
CH-050) o Human MCP-1 recombinant protein (Bio-techne, catalog # 279-MC) o Human KIM-1 recombinant protein (Bio-techne, catalog # 1750-TM) o Human EGF recombinant protein (Bio-techne, 236-EG-200)
• Streptavidin-Phycoerythrin Conjugate Solution (Conc: 1 mg/ml, Invitrogen, catalog # S-866), protected from light and stored at 4 °C.
• Wash Buffer (0.05% Tween-20 in 1X PBS), stored at 4 °C.
4.3. Buffer preparation
• The following buffers should be filtered and stored at 4oC.
Table 1. Microbead based assay buffers
Buffer Components
Wash buffer (Filtered) 1X Tween-PBS solution
1X Phosphate Buffered Solution
• 100 ml of 10X PBS solution (Fisher Scientific, Catalog # BP 399-1) will be mixed with 900 ml of MilliQ water (Millipore)
1X Tween-PBS solution
• 500 μl of Tween-20 (Fisher Scientific, catalog # BP 337-500) will be added to 1 L of 1X PBS and mixed for 5 min.
• Filter Sterilized using 0.2 μm filtration bottles (Corning)
• Buffer will be stored at 4 °C

Reference: human urine 4 plex SOP Version: 1.2 Author: Venkata S. Sabbisetti Page 5 of 16
Sample Diluent (Filtered)
Total volume 250 ml
HEPES (Fisher Scientific, Catalog # BP310-500) 5.95g
NaCl (Fisher Scientific, Catalog # BP337-500) 1.46g
BSA (Roche, Catalog# 9048-46-8) 2.5g
Tween (Fisher Scientific, Catalog # BP 337-500) 0.25 ml
Millipore water Up to 250 ml
pH is adjusted to 7.4 using 10 N NaOH, filter sterilized using 0.2 μm filtration bottles, and stored at 4 °C.
4.4. Preparation of antibody conjugated microbeads
Reagents: Bio-Plex Amine Coupling Kit (Bio-Rad, catalog # 171-406001)
EDC (Thermo Scientific, catalog # 77149)
Sulpho NHS (Thermo Scientific, Catalog # 24510)
Anti-KIM-1 antibody, anti-YKL40, anti-MCP1 and anti-EGF
Principle: Carboxyl groups on the surface of the polystyrene beads are first activated
with the carbodimide derivative EDC (Thermo Scientific) to form an intermediate that is
stabilized with S-NHS (Thermo Scientific). The intermediate then reacts with antibodies
primary amine to form an amide bond. The protein-coupled beads are stable for 1 year
when stored at 4 C and protected from light.
• All the buffers used in this protocol come with the coupling kit.
• Place EDC and S-NHS in desiccator at RT for one hour (until ready to use).
• Vortex Bio-Plex beads (1.25 x 10⁷ beads in 1 ml) for 40 seconds followed by bath sonication (25-30 pulses, 15 sec).
• Aliquot 500 µL (6.25 x 10⁶ beads) to a reaction tube.
• Centrifuge @ 14,000 rpm (20.82 x g) for 4 minutes at 4 °C.
• Discard supernatant carefully so as not to disturb pellet.
• Add 200 µL bead wash buffer to pellet and vortex for 20 seconds followed by bath sonication (25-30 pulses, 15 sec).
• Centrifuge @ 14,000 rpm (20.82 x g) for 4 minutes at 4 °C and discard the supernatant.
• Re-suspend the beads in 50 µL of bead activation buffer and vortex for 20 seconds followed by bath sonication (25-30 pulses, 15 sec).
Table 2. Antibody and PBS volumes required for the conjugation Stock
Concentration (µg/ml)
Amount capture
for 500 l of bead coupling (µg/ml)
Volume of Ab needed
for 150 l final
volume (l)
PBS needed to 500 l reaction
hMCP-1 500 µg/ml 12 9.4 490.6
hKIM-1 200 µg/ml 12 23.4 476.6
hYKL-40 500 µg/ml 10 9.4 490.6
hEGF 500 µg/ml 24 9.4 490.6

Reference: human urine 4 plex SOP Version: 1.2 Author: Venkata S. Sabbisetti Page 6 of 16
• Add 50 µL EDC (10 µg of EDC dissolved in 200 µL of bead activation buffer) and 50 µL Sulpho NHS (10 µg of EDC dissolved in 200 µL of bead activation buffer) to beads and vortex for 40 seconds.
• Cover tube with aluminum foil and rotate at room temperature for 40 minutes.
• After incubation, add 150 µL PBS buffer to the tube and centrifuge at 14,000 rpm for 4 minutes at 4 °C.
• Discard supernatant, re-suspend beads in 150 µL PBS buffer, vortex for 40 seconds, and centrifuge at 14000 rpm (20.82 x g) for 4 min at 4 °C.
• Re-suspend the beads in the needed volume of PBS, vortex for 20 seconds and add the respective amount of antibody (Table 2.).
• Cover the tube with aluminum foil and rotate overnight at 4 °C.
• After overnight incubation, centrifuge the tube at 14,000 rpm (20.817 x g) for 4 minutes at 4C, discard supernatant and re-suspend 500 µL PBS (pH 7.4) and repeat the washings with PBS for 2 more times.
• Re-suspend the beads in 250 µL blocking buffer, vortex for 20 seconds, cover the tube with aluminum foil, and incubate at room temperature for 45 minutes at 4 °C, discard the supernatant and re-suspend in 500 µL storage buffer, vortex 30 seconds.
• Repeat the washing step with storage buffer and re-suspend the beads in 150 µL storage
buffer in amber colored centrifuge tube, count the number of beads using Cellometer
(Nexcelom), and store the coupled beads at 4 °C.
Coupling Validation: Typically we get 70-80% bead recovery after bead coupling reaction.
Based on bead recovery, we calculate the volume of the bead solution that contains 5000
beads. We add 5000 beads per well. To validate the coupling reaction, each batch of freshly
made beads is analyzed by determining all four analyte levels in control urine samples using
these beads. If all analyte values are within ± 2SD, then we keep the beads for the analysis of
the samples. If any of the analyte values are outside of ± 2SD, we will repeat the analysis
procedure again If the beads fail again, then we will re-couple the beads with that particular
analyte and repeat the procedure.
4.5. Experimental Procedure
• Sample thawing: Sample tubes will be arranged in open tube racks with an empty space between each tube for better air circulation. Place these racks in a 30°C incubator until all samples are thawed (around 15 min, the tubes will still be cold after the samples are thawed). Vortex the tubes for 5 sec, centrifuge at 1800 x g for 5 min at 4°C, keep on ice, and proceed for the analysis.
• Quality control urines that contain high and low urine biomarker values are thawed.
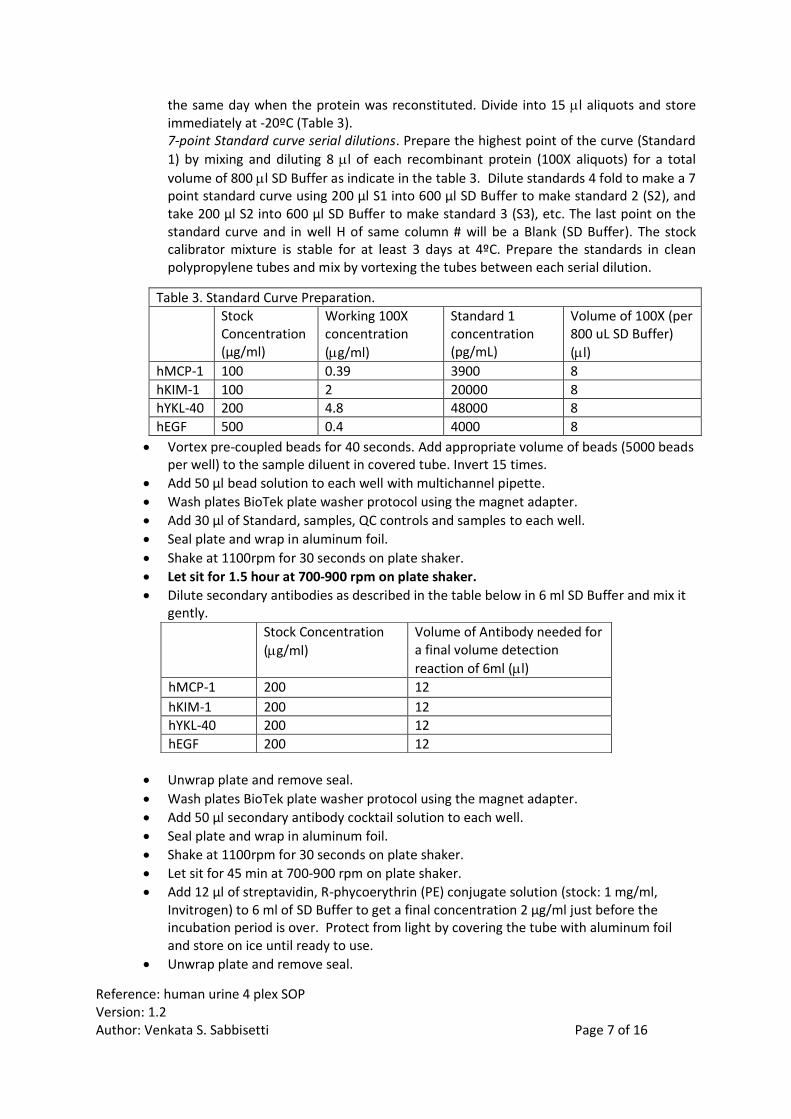
• Standard Curve Preparation: Recombinant protein reconstitution. Bring the calibrator vial(s) to room temperature. Reconstitute each vial of calibrator by adding the required volume of PBS to get the stock recommended concentrations. Mix 5 times using the pipet and Invert 3 times. Do not vortex. Let the reconstituted solution equilibrate at room temperature for 15-30
minutes and then vortex briefly. Divide into 50 l aliquots and store immediately at -80ºC. Preparation of working 100x aliquots. Depending on the highest point in the standard curve, 100x working aliquots will be prepared for each protein by diluting the stock aliquot at desired concentration using SD Buffer. Working aliquots should be prepared
Reference: human urine 4 plex SOP Version: 1.2 Author: Venkata S. Sabbisetti Page 7 of 16
the same day when the protein was reconstituted. Divide into 15 l aliquots and store immediately at -20ºC (Table 3). 7-point Standard curve serial dilutions. Prepare the highest point of the curve (Standard
1) by mixing and diluting 8 l of each recombinant protein (100X aliquots) for a total
volume of 800 l SD Buffer as indicate in the table 3. Dilute standards 4 fold to make a 7 point standard curve using 200 µl S1 into 600 µl SD Buffer to make standard 2 (S2), and take 200 µl S2 into 600 µl SD Buffer to make standard 3 (S3), etc. The last point on the standard curve and in well H of same column # will be a Blank (SD Buffer). The stock calibrator mixture is stable for at least 3 days at 4ºC. Prepare the standards in clean polypropylene tubes and mix by vortexing the tubes between each serial dilution.
• Vortex pre-coupled beads for 40 seconds. Add appropriate volume of beads (5000 beads per well) to the sample diluent in covered tube. Invert 15 times.
• Add 50 µl bead solution to each well with multichannel pipette.
• Wash plates BioTek plate washer protocol using the magnet adapter.
• Add 30 µl of Standard, samples, QC controls and samples to each well.
• Seal plate and wrap in aluminum foil.
• Shake at 1100rpm for 30 seconds on plate shaker.
• Let sit for 1.5 hour at 700-900 rpm on plate shaker.
• Dilute secondary antibodies as described in the table below in 6 ml SD Buffer and mix it gently.
• Unwrap plate and remove seal.
• Wash plates BioTek plate washer protocol using the magnet adapter.
• Add 50 µl secondary antibody cocktail solution to each well.
• Seal plate and wrap in aluminum foil.
• Shake at 1100rpm for 30 seconds on plate shaker.
• Let sit for 45 min at 700-900 rpm on plate shaker.
• Add 12 µl of streptavidin, R-phycoerythrin (PE) conjugate solution (stock: 1 mg/ml, Invitrogen) to 6 ml of SD Buffer to get a final concentration 2 μg/ml just before the incubation period is over. Protect from light by covering the tube with aluminum foil and store on ice until ready to use.
• Unwrap plate and remove seal.
Table 3. Standard Curve Preparation. Stock
Concentration (µg/ml)
Working 100X concentration
(g/ml)
Standard 1 concentration (pg/mL)
Volume of 100X (per 800 uL SD Buffer)
(l)
hMCP-1 100 0.39 3900 8
hKIM-1 100 2 20000 8 hYKL-40 200 4.8 48000 8
hEGF 500 0.4 4000 8
Stock Concentration
(g/ml)
Volume of Antibody needed for a final volume detection
reaction of 6ml (l)
hMCP-1 200 12
hKIM-1 200 12 hYKL-40 200 12
hEGF 200 12

Reference: human urine 4 plex SOP Version: 1.2 Author: Venkata S. Sabbisetti Page 8 of 16
• Wash plates BioTek plate washer protocol using the magnet adapter.
• Add 50 µl Streptavidin-PE to each well.
• Seal plate and wrap in aluminum foil.
• Shake at 1100rpm for 30 seconds on plate shaker.
• Let sit for 15 minutes at 700-900 rpm on shaker.
• Unwrap plate and remove seal.
• Wash the plate with Bio-Tek plate washer
• Add 125 µl of SD Buffer to each well.
• Seal plate and wrap in aluminum foil.
• Shake at 1100rpm for 30 seconds on plate shaker.
• Unwrap plate and remove seal.
• Blot gently, and then load plate into Luminex 200.
• Plates on-line for reading will be maintained on constant shaking (700 rpm) before loading them into the Luminex 200.
4.6 Plate Washer Protocol
• Delay 1 min.
• W-Aspirate, travel rate 3, delay 1 min.
• Delay 1 min.
• W-Wash 300 l for 3 cycles. 4.7 Equipment
• Bio-Plex 200
• Machine will be calibrated every day using Bio-Plex calibration kit (Bio-Rad, Catalog #171-203060)
• Machine will be validated every month using t Bio-Plex validation kit (Bio-Rad, Catalog # 171-203001). The kit validates following parameters: Optical Alignment: Confirms assay sensitivity and well-to-well precision and verifies that array reader optics are properly aligned Reporter performance: Measures linearity, instrument threshold, dynamic range, slope and accuracy Classification accuracy: Measures efficiency of determining bead regions and ensures proper bead classification
Fluidics Integrity: Monitors fluids performance and prevents cross-contamination. If the machine fails validation or calibration procedure, we will repeat the procedure again. If the problem persists, we will contact the technical support.
• Luminex undergoes preventive maintenance every 6 months.
4.7 Plate layout in the Bioplex-200 instrument
Initiation of Bio-Plex Software. Bio-Plex program will be started by clicking the Bio-Plex icon on the
desktop. The instrument will be initiated by clicking the start up program, followed by 30 min laser
warm up, and then calibrated using the Bio-Rad calibration kit. Once the instrument is ready, the
plate to be analyzed will be loaded into the instrument and the assay protocol template will be
created in the format given below:

Reference: human urine 4 plex SOP Version: 1.2 Author: Venkata S. Sabbisetti Page 9 of 16
PLATE TEMPLATE
S01-S073: Standards
U01-U35: Unknown Samples
QC1-QC3: Quality Control Samples
PR1-PR3: Proficiency Samples
B: Blank (Sample diluent buffer)
Note: It is very important that you be careful to highlight the correct cells when setting up the
template to assign the order and duplicates.
To acquire the above plate format the following procedures should be followed
• Click on new plate
• Select BioCon 4 Plex from the dropdown list
• Select plate format
o To assign standards on the plate follow these steps (See figure below)
▪ Click on the “123 icon with arrow pointing toward right side”
▪ Select “2” from the drop down menu
▪ Select “circled S icon “
▪ Now highlight the cells from A1 to G2 (this will highlight the columns 1 & 2)
and the software automatically assigns S01-S07 as shown in the plate
template above. Check that this assignment is correct.
o To assign Blanks on the plate follow these steps (See figure below)
▪ Click on the “123 icon with arrow pointing toward right side”

Reference: human urine 4 plex SOP Version: 1.2 Author: Venkata S. Sabbisetti Page 10 of 16
▪ Select “2” from the drop down menu
▪ Select “B icon ‘
▪ Now highlight the cells from H1 to H2 and the software automatically
assigns “BL” as shown in the plate template above. Check that this
assignment is correct.
o To assign “Controls” follow these steps (See figure below)
▪ Click on the “123 icon with arrow pointing toward right side”
▪ Select “3” from the drop down menu
▪ Select “C” icon
▪ Now highlight the cells from C11 to E12 and the software automatically
assigns QC1-QC3 as shown in the plate template above. Check that this
assignment is correct.
o To assign “Unknowns” on the plate follow these steps (See figure below)
▪ Click on the “123 icon with arrow pointing toward downwards”
▪ Select “2” from the drop down menu
▪ Select “X “ icon
▪ Now highlight the cells from A3 to H10 and the software automatically
assigns U01-U33 as shown in the plate template above. Check that this
assignment is correct.
▪ Now highlight the cells from A11 to B12 and the software automatically
assigns U34-U35 as shown in the plate template above. Check that this
assignment is correct.
o To assign “Proficiency Samples” on the plate follow these steps (See figure below)
▪ Click on the “123 icon with arrow pointing toward downwards”
▪ Select “2” from the drop down menu
▪ Select “X “ icon
▪ Now highlight the cells from F11 to H12 and the software automatically
assigns PR1-PR3 as shown in the plate template above. Check that this
assignment is correct.
• The information of the standards, description of the samples (sample IDs), controls (QC1-
QC3) will be incorporated into the template. Once the protocol is ready, the analysis will be
initiated by clicking the RUN button.
• In addition to barcode scanning, each sample tube will be numerically labeled for
subsequent cross verification in the order we aliquot the samples on the plate.
• The information of the standards, description of the samples (sample IDs), controls will be
incorporated into the template. Once the protocol is ready, the analysis will be initiated by
clicking the RUN button.

Reference: human urine 4 plex SOP Version: 1.2 Author: Venkata S. Sabbisetti Page 11 of 16
5. Data Generation & Processing
5.1 Data Output
• Data will be analyzed using Bio-Plex Manager Software integrated instrument operating software
• Standard curve recovery is a practical parameter commonly used to determine the overall accuracy of an assay. Bio-Plex Manager includes a mechanism for assessing the fit of a standard curve to its individual standard points. This is the recovery percentage. For each analyte standard, an observed concentration is back calculated by plotting the fluorescence intensity of the standard on the standard curve. This is divided by the expected concentration and multiplied by 100 to give a recovery percentage. The measurement can be performed automatically by software. The output is derived from the assigned (expected) concentration of each standard and the actual (observed) concentration using the formula: Observed concentration/Expected concentration] x 100.
• Working assay range is defined as the range between the lower limit of quantitation (LLOQ) and the upper limit of quantitation (ULOQ) in which an assay is both precise and accurate. The Bio Plex manager analyzes the curve fit based on observed/expected ratio.
5.2 Standard Curve generation
• The Bio-Plex manager uses the serially diluted standards to generate the standard curve. The software has options to choose the type of regression analysis. We use 5 parametric logistic regression analyses to predict the concentrations of unknown samples. (Below is the typical standard curve)
5.3 Data Processing and Data Calculations
• The Bio-Plex manager automatically generates the data of unknowns based on the standard curve. The data includes the fluorescence Intensity, predicted concentration of

Reference: human urine 4 plex SOP Version: 1.2 Author: Venkata S. Sabbisetti Page 12 of 16
unknowns, standard error, % CV, and errors in the run of all samples (below is the typical data output page).
• Data is exported from Bio-Plex manager to Microsoft excel using the automatic converter embedded into Bio-Plex manager software.
• The program will export information from the run including sample Type, information of
the wells, sample description, fluorescence intensity (FI), FI-Background, standard deviation, %CV, concentration in Range, observed concentration, and dilution. The QC samples and proficiency samples are evaluated for quality control.

Reference: human urine 4 plex SOP Version: 1.2 Author: Venkata S. Sabbisetti Page 13 of 16
• In addition to barcode scanning, each sample tube will be numerically labeled for cross
verification in the order we aliquot the samples on the plate. Once the data are transferred and compiled, we will again cross check the numerical number on the tube with the barcode scan.
• Another member in the facility will perform a secondary check to further validate the sample order
6 Quality Control
6.1. Quality control of the Assay.
• We will ensure that biomarker levels obtained using the assay on control specimens are within mean ± 2SD limit established from the Validation Protocol.

Reference: human urine 4 plex SOP Version: 1.2 Author: Venkata S. Sabbisetti Page 14 of 16
• If both samples are within mean ± 2SD limit, we will accept the data. If one of the two control values is outside mean ± 2SD, we will employ the Westgard 2 rules to determine
if the analysis run results can be accepted.If neither of the assayed control results is
within mean ± 2SD limits, then we will follow the westgard three-quality control rule and not accept the data.

Reference: human urine 4 plex SOP Version: 1.2 Author: Venkata S. Sabbisetti Page 15 of 16
6.2 Quality Control for each sample
• Sample measurements will be repeated if the %CV of the sample is > 15% for any particular analyte.
• Sample measurements will be repeated if the instrument produces any run errors for a sample.
6.3 Quality Control troubleshooting procedure
If the controls fail the Westgard quality control procedure, then we will employ the following
procedure to resolve the issue:
• Contact the Lab Director
• Rerun Control
• If the quality control values pass the above described Westgard rules proceed with unknown
testing
• If the quality control failed again, make up fresh reagents (couple new beads) and rerun
controls and document the problem
• If the quality control indicates that the Westgard rules are passed, proceed with testing
• If QC fails again, recalibrate the assay (use new standard lot)
• If after calibration the QC determinations have passed Westgard criteria, proceed with
testing and document correction
• If Westgard criteria were not met after preparation of fresh reagents, do not proceed with
the analysis and contact the Laboratory Director.
6.4 Data storage and reporting
• After the analysis has passed the quality control test Biomarker values of unknown samples with their corresponding %CV and SD will be copied and pasted into a master excel data workbook in the sequential order in sheet 1. Biomarker values, %CV, SD of quality control samples and proficiency samples will be copied and pasted in sheet 2. Both sheet 1 & 2 will be updated with addition of data from each run.
• The master data sheet that is reported to the coordinating center will contain the following information
1. Sample ID (Bio Con ID) 2. Date of the assay 3. Platform and the Instrument used for the assay 4. Reagent lot numbers which include, date of microbead preparation, lot numbers of
primary antibody, secondary antibody, substrate (PE-SAPE), and recombinant proteins
5. Concentration of biomarker 6. % CV across the sample replicates 7. Biomarker levels, SD and % CV of each control sample with the description of each
control sample 8. Biomarker levels, SD and %CV of each proficiency samples with the description of
each proficiency sample (the cells will be left blank if the proficiency samples are not run on that plate)

Reference: human urine 4 plex SOP Version: 1.2 Author: Venkata S. Sabbisetti Page 16 of 16
Levey-Jennings plots of Control samples and proficiency samples (These plots will be
updated and cumulative plots will be reported with each data submission.
6.5 Assay parameters
7. References
1. Vaidya VS, Waikar SS, Ferguson MA, Collings FB, Sunderland K, Gioules C, Bradwin G,
Matsouaka R, Betensky RA, Curhan GC, Bonventre JV. Urinary biomarkers for sensitive and
specific detection of acute kidney injury in humans. Clin Transl Sci. 2008 Dec;1(3):200-8.
2. Koyner JL, Vaidya VS, Bennett MR, Ma Q, Worcester E, Akhter SA, Raman J, Jeevanandam V, O'Connor MF, Devarajan P, Bonventre JV, Murray PT. Urinary biomarkers in the clinical prognosis and early detection of acute kidney injury. Clin J Am Soc Nephrol. 2010 Dec;5(12):2154-65
3. Vaidya VS, Niewczas MA, Ficociello LH, Johnson AC, Collings FB, Warram JH, Krolewski AS, Bonventre JV. Regression of microalbuminuria in type 1 diabetes is associated with lower levels of urinary tubular injury biomarkers, kidney injury molecule-1, and N-acetyl-β-D-glucosaminidase. Kidney Int. 2011 Feb;79(4):464-70
BiomarkerUrine
AssayRange(pg/ml)
LLOD(pg/ml)
Linearityof
Dilution
SpikeRecovery
Intraassay%CV
Interassay%Cv
Single Vs.MultiplexRecovery
Interfer-ence
KIM-1 20000-1.98 1.98 1.0:1:30 80-120% 4.8 7.8 80-120% No
EGF 4000-0.98 0.98 1.0:1:30 80-120% 6.7 9.2 80-120% No
MCP-1 3900-0.95 0.313 1.0:1:30 80-120% 6.6 8.6 80-120% No
YKL-40 192000-140 140 1.0:1:30 80-120% 7.1 9.1 80-120% No