by dr. theresa craig may 2011 feedlot management
TRANSCRIPT

By Dr. Theresa CraigMay 2011
Feedlot Management

Dr. Theresa M Craig Ph.D
Born in Canada on a Feedlot Ranching operation Attended Texas A & M University and University of
Missouri General Manager of Dairy Beef Feedlot Mexico Ruminant Nutrition Consulting in Portugal, Spain
Mexico, and Guatemala Ruminant Specialist Rhone Poulenc Australia Established “TARA” a Research and Consulting
Business, Australia (1997) working in feedlot, dairies, abattoirs, governments in
Australia and Internationally

Feedlot Management
Animal Supply Feed Supply and Inventory Feeding Bunk Management Integration with Health and Livestock Management End game: Profitable

Animal Supply
Genetics Age Weight
TYPE ------- Market
Condition ScoreFrame ScorePrior Nutritional History

Animal Supply – Phenotype & Genotype
Nutritional Windowing
.
Phenotype:Weight AgeCondition ScoreFrame Score
Genotype:Bos Indicus or Bos TaurusBeef/ DairyBreed
Genetic lineGender

Animal Supply – Frame Score
Predict performance, slaughter date, & carcass composition at slaughter
.
Information required at entry:
Date measurement takenAnimal identification numberAnimal estimate ageHip height in mm across hips
Adjustable parallel bar with level
Ruler with mm measurement scale
WeightBreedGenderCondition score

Feed Inventory Moisture Colour Odour Foreign Material Uniformity and Texture Evidence of heating Biotoxins
Feed Supply and Inventory“Dynamic”
Feed Supply Feed Type Quality Nutrient Specifications Cost/tonne Consistency of Supply and
Nutrient levels Associative Effects

Feed Supply and Inventory - Storage
Storage Principles Moisture Temperature Air movement Contaminants
Feed Type Forages Grains Protein Meal By-products Liquids Pre-mixes Special Products
Climatic Factors Relative Humidity Temperature Season
Expansion Capacity Logistics Labour
Feed Quality Changing
Nutrient Variability Oxidative loss AA to NPN
Pest Management Rodents Insects
Fire Management Plan

Feed Supply: By-Products
Type Energy Protein Roughage
Nutrients Dry Matter Consistency of Nutrient
specifications Creation of Imbalances
Correction with knowledge Interactions
Binding Non – Nutrients Factors
Toxins Phytochemicals
Palatability Limits intake
Supply Consistency Logistics
Storage Moisture/ Climate Flow
Silos Bunkers
Performance Feed Intake ADG, F/G Associative effects Carcass Composition
Cost Effective Cost per nutrient Effect on performance

Feed Supply and Inventory – Storage Guidelines
Ensure facility cleanliness Moisture levels of most dry commodities need to stay
below 13 % Moisture level of high moisture feed to be used
immediately or stored anaerobically Monitor Feed Temperature and Moisture constantly Monitor Feed for Insects and Rodents and have
program to eliminate these pests If unsure test for Micotoxins Aeration / Turning helpful in long-term storage of large
quantities of grain

Feeding
Ration Consistency Formulation
Nutrients Moisture
Processing Mixing Delivery

Ration Mixing - Consistency
Factors Affecting Particle Size Particle Shape Particle Density Adhesion Electrostatic Hygroscopic
Segregation Liquid Addition
Process Time Monitor Test Communication

Ration Mixing

Bunk Management
Amount to Feed Percentage body weight Challenge Weather
Ration Changes Limited Commodity changes
Bunk Cleanliness Consistent
Communication Accurate Constant
Delivery Assured Consistency
Ration Amount
Location Entire bunk
Timeliness 10 – 20 minutes

Bunk Management
Calls / Monitoring Consistency
Example
1. Initial A.M. call
2. Monitor during delivery
3. P.M. verification call
4. Monitor P.M. call
5. Late call

Bunk Management and Feed Intake
Feed Intake per DayProblem Bunk Management
0
10
20
30
40
1 3 5 7 9 11 13 15 17 19 21 23 25 27 29 31
Days on feed
kilo/day
Feed Intake per DayImproved Bunk Management
0
5
10
151 3 5 7 9
11
13
15
17
19
21
23
25
27
29
31
Days on feed
kilo/day Performance improved by approximately 30 %
Erratic feed intake
Feed intake stabilized

Bunk Management Codes
Identical for Everyone Timely Utilization
Example:
Bunk Animals
S = Slick A = Aggressive
E = Excellent N = Normal
F = Full L = Lazy

Bunk Management - Feed IntakeFeed Intake and Temperature
-4
-2
0
2
4
6
8
10
12
14
16
1 2 3 4 5 6 7 8 9 10111213141516171819202122232425262728293031
Fee
d I
nta
ke &
Lo
w T
emp
erat
ure
0
5
10
15
20
25
Hig
h T
emp
erat
ure
Feed Intake
Low Temp
High Temp
Erratic Feed Intake and Temperature
-5
0
5
10
15
20
25
30
1 2 3 4 5 6 7 8 9 10111213141516171819202122232425262728293031Fee
d I
nta
ke &
Lo
w T
emp
erat
ure
0
5
10
15
20
25
Hig
h T
emp
erat
ure
Feed Intake
High Temp
Low Temp

Bunk Management - General Rules
Increase feed given at P.M. feeding when required Do not increase feeding amount per day above 10 % Feed decreases done in A.M. feeding to allow close
monitoring Decrease feed allowance by greater than 10 % only
when needed to clean bunk Do not skip feeding Proportion of feed given needs to equate to time
between feeding therefore is not an equal amount

Bunk Management - Communication
Key to successful Bunk Management Timely Involves
Feed Manager Cattle Manager Truck Drivers Cattle Handlers Nutritionist

Bunk Management Focus Areas
Starting Cattle Ration Transition Sick Animals Storm Front Extreme Weather Long / Short Term Cattle
Heat Stress
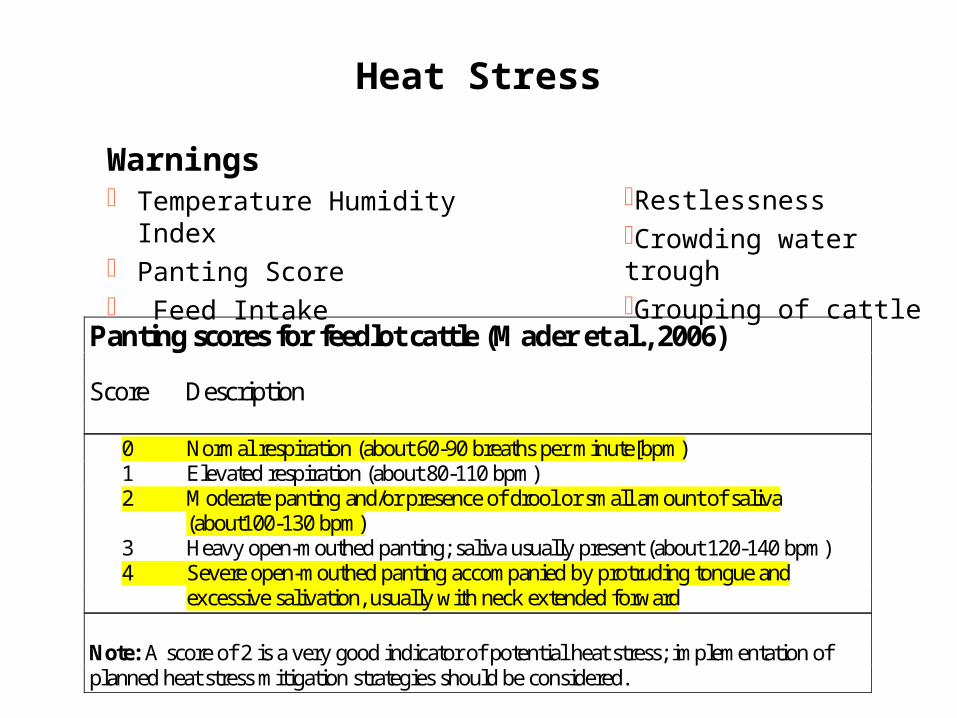
Warnings Temperature Humidity Index Panting Score Feed Intake
Panting scores for feedlot cattle (Mader et al., 2006) Score Description
0 Normal respiration (about 60-90 breaths per minute[bpm) 1 Elevated respiration (about 80-110 bpm) 2 Moderate panting and/or presence of drool or small amount of saliva
(about100-130 bpm) 3 Heavy open-mouthed panting; saliva usually present (about 120-140 bpm) 4 Severe open-mouthed panting accompanied by protruding tongue and
excessive salivation, usually with neck extended forward
Note: A score of 2 is a very good indicator of potential heat stress; implementation of planned heat stress mitigation strategies should be considered.
RestlessnessCrowding water troughGrouping of cattle

Heat Stress
Nutrition Decreasing the fermentative heat load by:
Ionophores Minimum roughage rations (use high digestive fibre) Inclusion of fat with low fibre diets Mineral intake
(DO include electrolyte mix) Increase K, Na, Cl, Mg
Increase maintenance requirement (7 to 25%)
Water consumption Increase 76 to 132 litres per day

Feed Management Altered to match the animals eating pattern. Do - Morning feed delivered predawn Do - Last feed of the day later in the day Do - Feed more than twice/dayManagement Lesson pen density Use a sprinkler system Providing shade
Without shade: feed intake decreased by 8 to 20% decrease weight gain by 12 to 25%
Shade 4 – 4.2 m high and provide 2 – 4 m2 space/animal
Heat Stress - cont’d

Water Trough Management
Nutrient Water restriction reduces feed intake
Quantity Back–up system
Quality Influences consumption Components / Contaminants Cleanliness
Monitor Space
30 mm/head

Integrations with Health and Livestock Management
Enhance immune system through nutrition Feed management and rations effect nutritional
disorders Acidosis Bloat Urinary Calculi (Urolithiasis) Toxins Nutritional imbalances
Sick rations

Integrations with Health and Livestock Management
Acidosis Acute: possible dead animal Chronic loss in performance
Faeces of animal with acidosis Faeces of animal that is normal

Performance Enhancement
Increase Dry Matter Intake Consistent ration
Nutrient levels Moisture levels Texture Energy
Improving Efficiency Management Animal
Physiology Nutrient requirements Behaviour

Feed Efficiency
Younger animals Large mature size Genetics Body Composition - leaner
Older animals Heavier animals Genetics with dairy influence
More Efficient Less Efficient

Average Daily Intake as a Percentage of Body Weight
22.12.22.32.42.52.62.7
7 14 28 56 112 140 166
Days on Feed
% B
od
y W
eig
ht
Accumulative Feed to Gain
4
5
6
7
8
9
10
7 14 28 56 112 140 166Days on Feed
Fe
ed
to
Gai
n
Performance Criteria

Performance Checklist
Weather Temperature Humidity Erratic
Cattle Genetics Health Gender Age Prior nutritional history
Feed Erratic rations changes Insufficient or poor quality
water Poor mixing
Management Bunk management Excessive handling of
cattle

Critical Control Points Critical Limits Monitor Action
Feed
Mixing test c.v. 5 – 10 % Weekly
Animal Treatment
Implant accuracy 90 – 95 % 10 % of feedlot
Facilities
Check for sharp objects None During monthlymaintenance
Record System
Feed intake monitor All pens Monitor by FeedManager weekly
Feed inventory 2 % Visual vs. predictedMonitor monthly
Critical Control Points

Relative Effect on Performance
Beef Bulls Beef Steers Beef Heifers
ADG 1.33 1.16 0.94
F/G 5.96 6.35 6.42
Fat levels % 30.8 40.1
Considered to put on more fat than steers or bulls
Lean levels % 52 44

Performance and Profit$220/tonne $230.00/tonne
ADG F/G $/gain F/G $/gain F/G $/gain F/G $/gain
1.2 9.41 2.07
1.5 7.53 1.65 6.64 1.45 6.64 1.53 4.78 1.10
1.8 6.28 1.38 5.53 1.21 5.53 1.27 5.32 1.22
2.0 5.65 1.24
ADG improves$/gain improves
ADG stable, F/G improves$/gain improves
Ration cost increase, no change in ADG or F/G $/gain decreases
Ration cost increase, no change in ADG, F/G improves $/gain improves

Performance Benchmarking- Example Feedlot Data Australia
Dairy Bulls
Beef Bulls
Beef Steers
(implant)
Beef Steers
(non implant)
Beef Steers Short fed
Beef Steers Mid fed
Beef Steers Mid fed
Entry weight (kg)
387 363 340 - 360 349 422 447 430
Exit weight (kg)
533 499 467 447 641 651 705
Days on feed
70 65 54 59 132 161 213
ADG 2.1 2.11.87 - 2.06
1.67 1.94 1.45 1.31
F/G 7.7 7.45.63 -6.06
6.39 7.9 9.4 10.9

Performance – SeasonalityADG
1.5
1.7
1.9
2.1
2.3
2.5
2.7
2.9
JAN FEB MAR APR MAY JUN JUL AUG SEP OCT NOV DEC
AV
ER
AG
E D
AIL
Y G
AIN
(kg
/day
)
2010
2009
2008
2007
2006
2005
2004
2003
2002

Performance – SeasonalityF/G
5.0
5.5
6.0
6.5
7.0
7.5
8.0
8.5
9.0
9.5
10.0
JAN FEB MAR APR MAY JUN JUL AUG SEP OCT NOV DEC
FE
ED
GA
IN (
kg
/KG
)
2010
2009
2008
2007
2006
2005
2004
2003
2002

Factors Affecting Carcass Outcomes
Input Factors Age Initial weight Sex Genetic potential Health Pre nutrition & management
Management Ration / Feed intake Implants
End Point Selection Days on feed Weight Fat thickness Carcass composition
Marketing Seasonality Sorting Market place conditions
Branded Value for standards

Marbling
Prolong high energy feeding Physiological stage of growth
Traditional feeding
Genetic capacity of animal Jersey, Murray Gray, Shorthorn,
Wagyu, Belmont Red
Prior nutritional history Weaning > Yearlings
Ref. MSA Australia 2011

Monitor – Protocols and SystemsAnimal incoming specificationsFeed Commodities consistencyWeight gainDaily feed intake
KnowHow specific rations affect performance (ration codes)How specific animal specification affect performance
ResultIncrease or Decrease Cost of Gain = Profitability
Performance for Profit - Bottom Line
Consistent End Product to Suit Market
Control Inputs

“Success Is Timely Attention to Detail”