by: drew zagala - minnesota landscape arboretum projects/2016... · green heron pond. compare...
TRANSCRIPT

By: Drew Zagala

Test the nitrate, phosphorus, and pH of the Iris Pond and Green Heron Pond. Compare results to previous water quality tests to understand changes in nutrient levels and pH of the Arboretum’s bodies of water.
Additionally, test the nitrate, phosphorus, and pH of Tamarack Lake to determine its water quality and create a baseline for future monitoring.

High nutrient levels in a water system can severely change its ecosystem Increases algae concentrations and algal blooms Decrease levels of dissolved oxygen Reduces biodiversity Reduces aesthetic appeal
Credit: Sevenhillslake.com

Additionally, Green Heron supplies irrigation for the Arboretum grounds High levels of nutrients can encourage weeds

Nitrogen Applied usually as Nitrate (NO3
-), Urea(CH4N2O), and Ammonia (NH3) Highly water soluble chemicals
Prone to erosion by rain events, over-watering, and groundwater runoff
Source: United States Geologic Survey. Copyright 2003

Phosphorus Applied as Phosphorus penta-oxide (P2O5)
▪ Not water soluble, but binds to soil particles
Prone to erosion as soil erodes from an area – rain events, over-watering, high slope gradients
Source: The Caribbean Environment Program. Copyright 2014

pH tends to determine the type of plants/animals that can live in a body of water Nutrient availability for plants Solubility of heavy metals or other toxins
Source: Fundamentals of Environmental Measurements. Copyright 2016
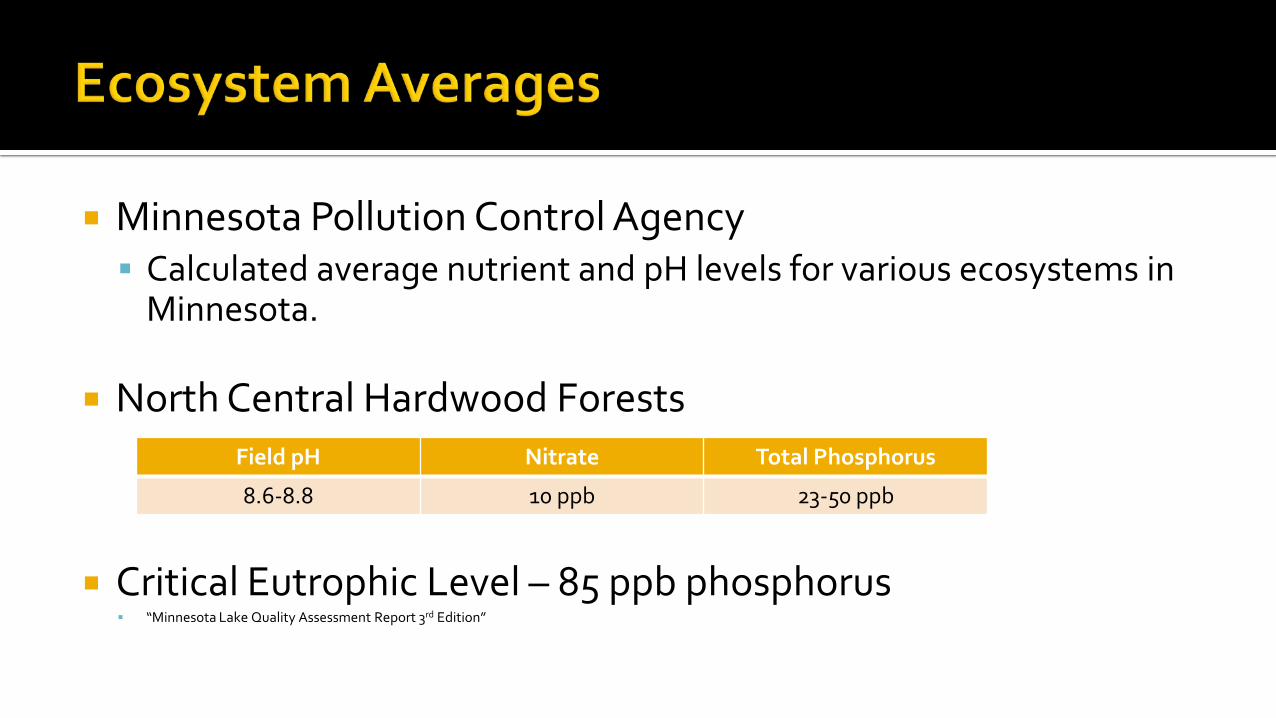
Minnesota Pollution Control Agency Calculated average nutrient and pH levels for various ecosystems in
Minnesota.
North Central Hardwood Forests
Critical Eutrophic Level – 85 ppb phosphorus “Minnesota Lake Quality Assessment Report 3rd Edition”
Field pH Nitrate Total Phosphorus
8.6-8.8 10 ppb 23-50 ppb


25.8
20.4 20 20
0
5
10
15
20
25
30
2011 2012 2013 2016
Nit
rate
(ppb
)
Year
Arboretum Water Body Nitrate Levels (ppb)
Iris PondEcosystem Average
10 ppb
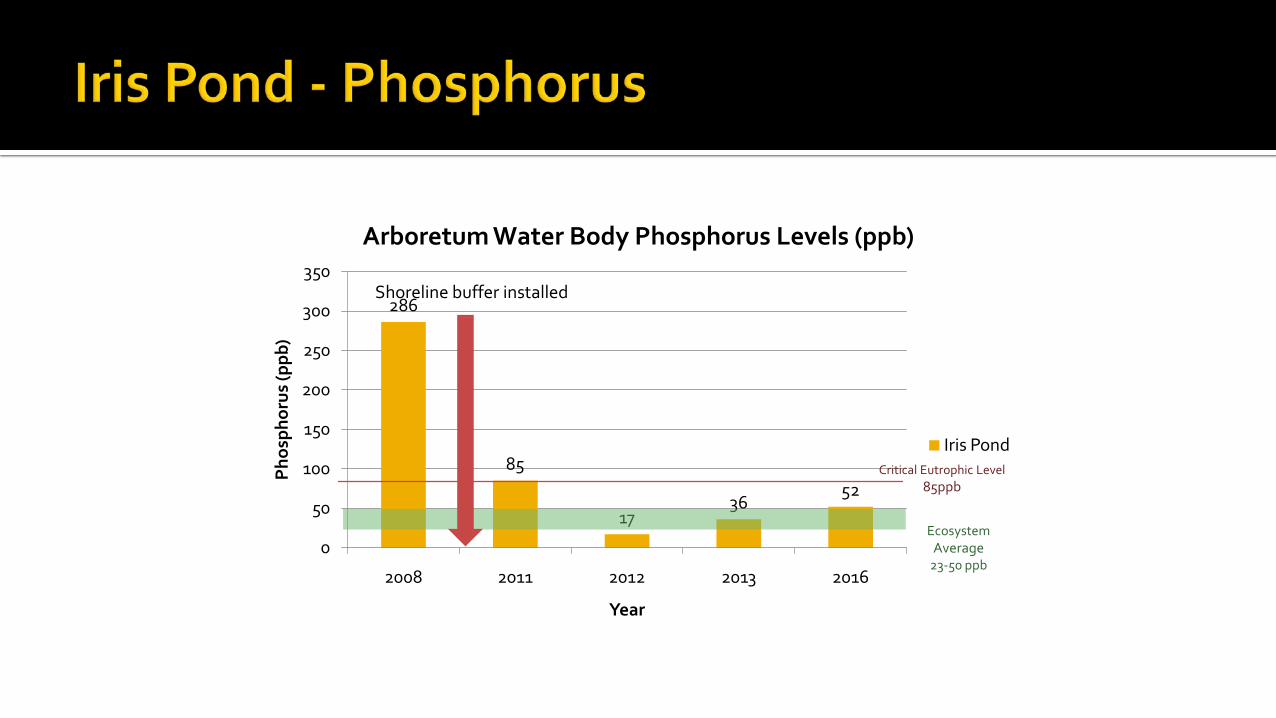
286
85
1736
52
0
50
100
150
200
250
300
350
2008 2011 2012 2013 2016
Pho
spho
rus
(ppb
)
Year
Arboretum Water Body Phosphorus Levels (ppb)
Iris Pond
Ecosystem Average
23-50 ppb
Critical Eutrophic Level85ppb
Shoreline buffer installed
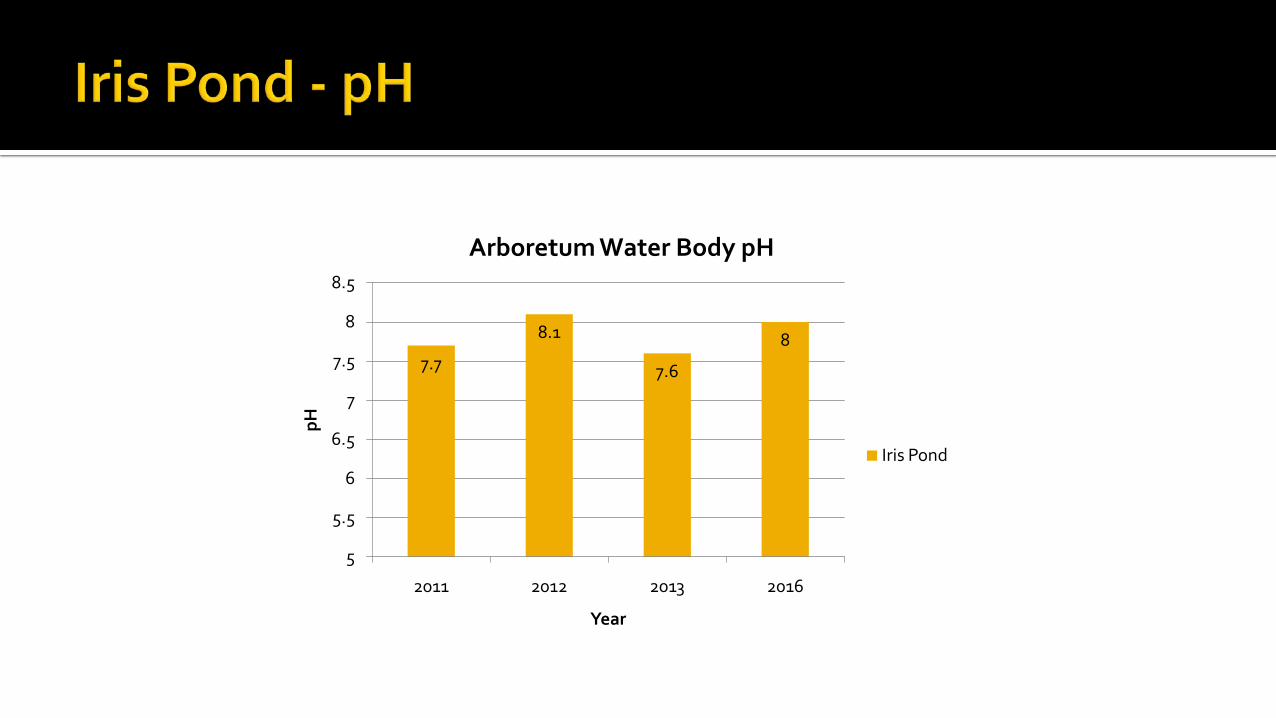
7.7
8.1
7.6
8
5
5.5
6
6.5
7
7.5
8
8.5
2011 2012 2013 2016
pH
Year
Arboretum Water Body pH
Iris Pond


2016 Data was collected for Green Heron Pond..
Unable to sample from “cleaner” center of lake High levels of decomposing matter▪ Bog would normally filter out high levels of phosphorus from entering greater
lake area
Nitrate Phosphorus pH
Green Heron Pond <20 ppb 1440 ppb 7.04

128
20.5
0
20
40
60
80
100
120
140
2011 2012
Nit
rate
(ppb
)
Year
Arboretum Water Body Nitrate Levels (ppb)
Green Heron
Ecosystem Average10 ppb
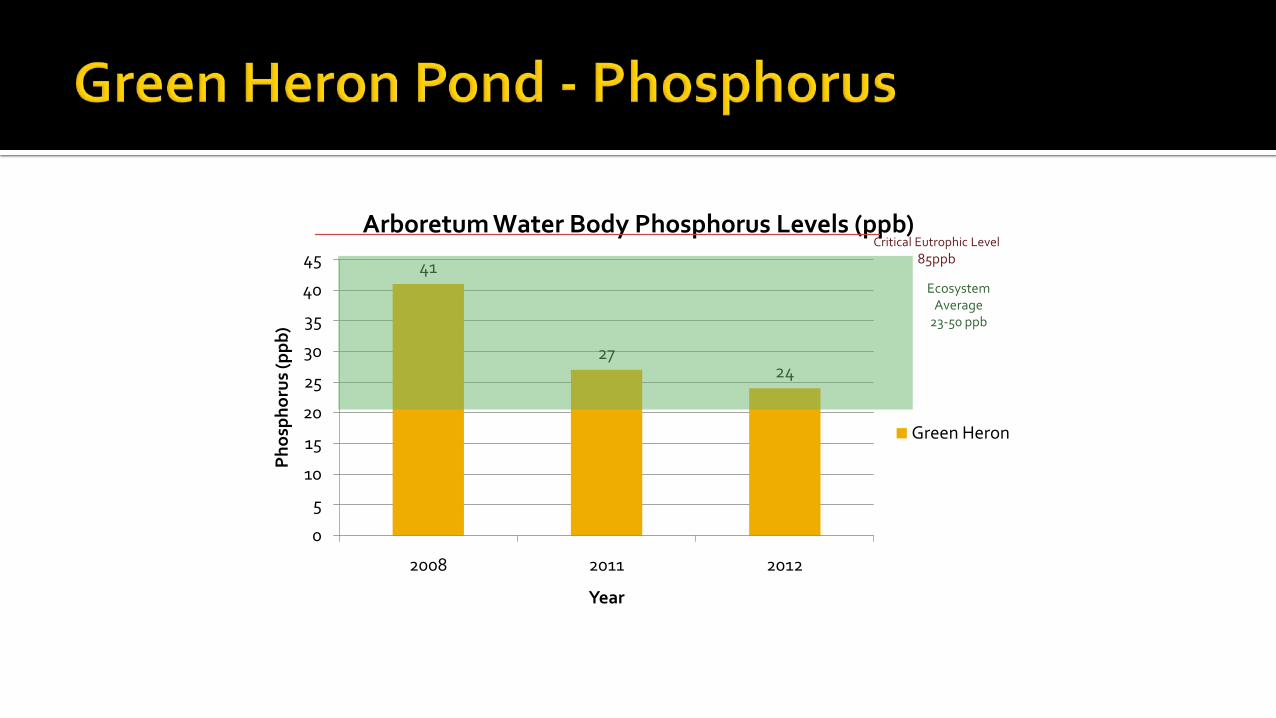
41
2724
0
5
10
15
20
25
30
35
40
45
2008 2011 2012
Pho
spho
rus
(ppb
)
Year
Arboretum Water Body Phosphorus Levels (ppb)
Green Heron
Ecosystem Average
23-50 ppb
Critical Eutrophic Level85ppb

8
8.7
5
5.5
6
6.5
7
7.5
8
8.5
9
2011 2012
pH
Year
Arboretum Water Body pH
Green Heron

Horticulture Research Center
Lake Minnewashta

20
0
5
10
15
20
25
2016
Nit
rate
(ppb
)
Year
Arboretum Water Body Nitrate Levels (ppb)
Tamarack Lake
Ecosystem Average10 ppb

65
0
10
20
30
40
50
60
70
2016
Pho
spho
rus
(ppb
)
Year
Arboretum Water Body Phosphorus Levels (ppb)
Tamarack Lake
Ecosystem Average23-50 ppb
Critical Eutrophic Level85ppb

8.5
5
5.5
6
6.5
7
7.5
8
8.5
9
2016
pH
Year
Arboretum Water Body pH
Tamarack Lake

Iris Pond Healthy!
Green Heron Pond Relatively healthy!
Tamarack Lake Healthy!
Good levels of dissolved oxygenLow levels of algae and algal bloomsSupport diverse biota
Safe levels of dissolved oxygenModerate algae and algal bloomsSupport biota
Good levels of dissolved oxygenLow levels of algae and algal bloomsSupport diverse biota

Reduce the use of liquid fertilizers Do not over-apply!
Clean up grass clippings and pulled weeds
Remove animal droppings
And….
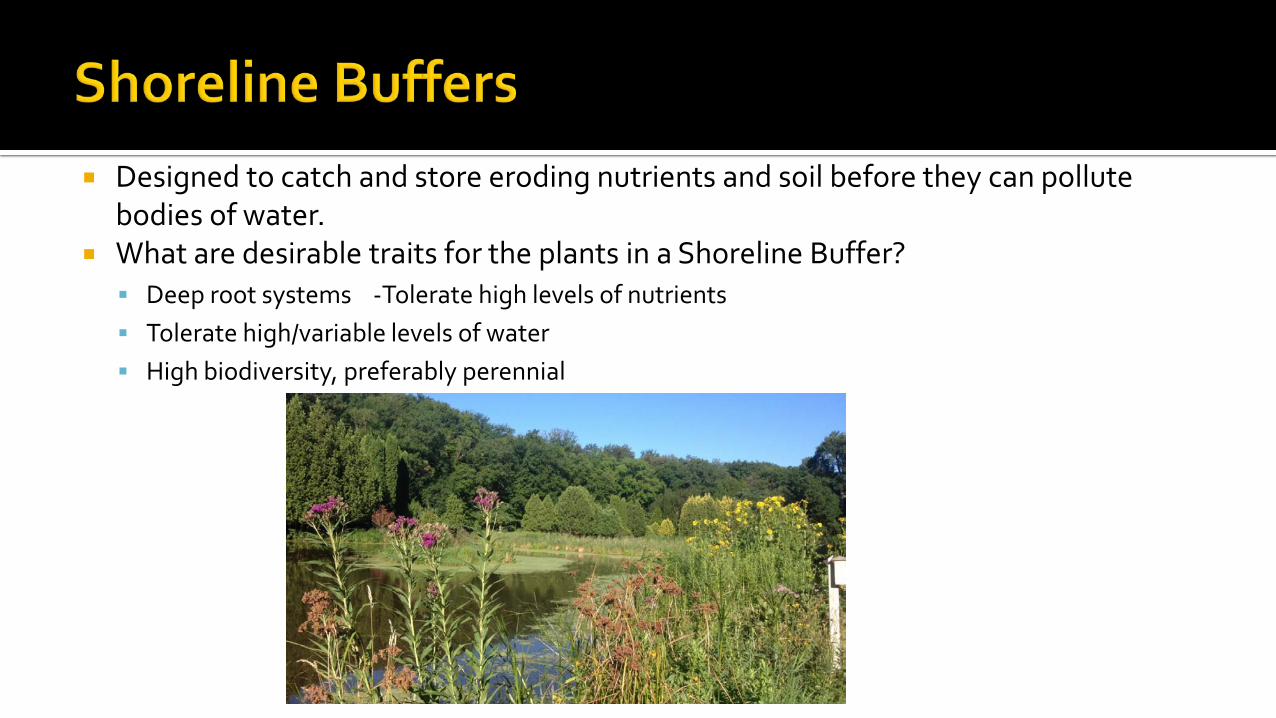
Designed to catch and store eroding nutrients and soil before they can pollute bodies of water.
What are desirable traits for the plants in a Shoreline Buffer? Deep root systems -Tolerate high levels of nutrients Tolerate high/variable levels of water High biodiversity, preferably perennial
Phosphorus erosion diagram: http://agrihelper.blogspot.com/2016/06/types-of-erosion-splashsheetrill-and.html Nitrogen erosion diagram: http://pubs.usgs.gov/fs/2003/fs091-03/ pH diagram: http://www.fondriest.com/environmental-measurements/parameters/water-quality/ph/ Minnesota Pollution Control Ecosystem Averages: https://www.pca.state.mn.us/quick-links/eda-guide-typical-minnesota-water-quality-
conditions Previous Water Quality data collected by past interns: Dan Miller. Water Quality Tests conducted by Tri-City/William Lloyd Analytical Laboratories Critical Eutrophic Levels from: Heiskary, Steven A., and C. Bruce Wilson. Minnesota lake water quality assessment report: Developing nutrient
criteria. Water Assessment & Environmental Information Section, Environmental Analysis & Outcomes Division, Minnesota Pollution Control Agency, 2005.
Eutrophic Lake Image: http://sevenhillslake.com/technical.html