c eo 1 detector - experimental hall...
TRANSCRIPT

NUCLEARINSTRUMENTS
Nuclear Instruments and Methods in Physics Research A320 (1992) 66-113
&METHODSNorth-Holland
IN VSICSRESEARCHSectionA
C EO 1 detectorY. Kubota ', J.K. Nelson a, D. Perticone a, R. Poling a, S. Schrenk a, M.S. Alam b, Z.H . Bian b,D. Chen b, I.J . Km b, V.C. Li b, X.C. LOU b, B. Nemati b, C.R. Sun b, P.-N. Wang b,
Zoeller b, G. Crawford c, R. Fulton c, K.K. Gan ", T. Jensen ", H. Kagan `,Kass ', R.
alchow ', F. Morrow e, M.K. Sung c, J. Whitmore c, P. Wilson 1,
F. Butler d, X. Fu d, G. Kalbfleisch d, M. Lambrecht d, P. Skubic d, J. Snow d,
vP.L. Wang d, D. Bortoletto e, D.N. Brown e, W.Y. Chen e, J. Dominick e, R.L. McIlwain e,
H. Miller e, M. Modesitt e, E.I . Shibata e, S.F. Schaffner e, I.P.J . Shipsey e, W.M. Yao e,
attle ', H. Kroha f, K. Sparks f, E.H. Thorndike f, C.-H . Wang f, R. Stroynowski g,so h, M. Goldberg h, T. Haupt °', R. Holmes h, N. Horwitz h, A. Jawahery h,
ubrano h, G.C.
oneti h, Y. Rozen h, P. Rubin h, V. Sharma h , T. Skwarnicki h, S. Stone h,ulasidas h, G. Zhu h, S.E. Csorna ', V. Jain ', T. Letson ', D.S. Akerib ', B. Barish ',
Chadha ', D.F. Cowen j, G. Eigen ', J.S . Miller ', J. Urheim ', A.J . Weinstein ',orrison k, H. Nelson k, J. Richman k, H. Tajima '`, D. Schmidt k, M. Witherell k,
A. Bean °, I. Brock ',
. Procario ', M. Daoudi ", W.T. Ford ', D.R. Johnson ",K. Lingel ",
. Lohner °", P. Rankin °', J.G. Smith ', J. Alexander ", C. Bebek ",K.
rkelman ", D. Besson ", E. Blucher ", T.E. Browder ", D.G. Cassel ", E. Cheu ",Co
an ", R. DeSalvo ", P.S. Drell ", R. Ehrlich ", R.S. Galik ",Garcia-Sciveres ", B. Geiser ", M.G.D. Gilchriese ", B. Gittelman ", S.W. Gray ",
.L. Hartill ", B.K. Heltsley ", K. Honscr~zid ", C. Jones ", J. Kandaswamy ", N. Katayama ",P.C.
°
", R. Kowalewski ", D.L. Kreinick ", G.S. Ludwig ", J. Masui ", J . Mevissen ",B.
istry ", J. Mueller ", R. Namjoshi ", S. Nandi ", C.R. Ng ", E. Nordberg ",C. O'Grady ". J.R. Patterson ", D. Peterson ", M. Pisharody ", D. Riley ", M. Sapper ",
Selen ". H. Worden ",
. Worris ", F.Würthwein ", P. Avery °, A. Freyberger °,J. Rodriguez ", J. Yelton °, T. Bowcock P, R. Giles P, S. Henderson P, K. Kinoshita P,F. Pl^kin P, M. Saulnier P, R. Wilson P, J. Wolinski P, D. Xiao P, H. Yamamoto P,A.r . Sadoff q, R. Ammar r, P. Baringer r, D. Coppage r, R. Davis `, P. Haas r, M. Kelly r,N. Kwak r,
. Lam r and S. Ro r' Uni: ersity of Minnesota, Minneapolis, MN 55455, USAState University of New York at Albany, Albany, NY 12222, USA
` Ohio State University . Columbus, OH 43210, USAd University of Oklahoma, Norman, OK 73019, USAe Prsrdue University, West Lafayette, IN 47907, USAf University of Rochester, Rochester, NY 14627, USARSouthern Methodist University, Dallas, TX 75275, USAh Syracuse University, Syracuse, NY 13244, USA' Vanderbilt University, Nashville, TN 37235, USA' California Institute of Technology, Pasadena, CA 91125, USAk University of California at Santa Barbara, Santa Barbara, CA 93106, USACarnegie-Mellon University, Pittsburgh, PA 15213, USA' University of Colorado, Boulder, CO 80309-0390, USAn Cornell University, Ithaca, NY 14853, USA° Unirary:oy of Florida, Gainesville, FL 32611, USAHarvard University, Cambridge, MA 02138, USA
Q Ithaca College, Ithaca, NY 14850, USAUniversity of Kansas, Lawrence, KS 66045, USA
0168-9002/92/$05.00 0 1992 - Elsevier Science Publishers B.V . All rights reserved

Received 16 January 1992
The new detector for data recording by the CLEO collaboration at the Cornell Electron Storage Ring is described . Thisdetector has been designed to optimize studying e+e- annihilation into hadronic matter at a total energy of 10 GeV. It consists ofhigh precision charged particle tracking chambers and an electromagnetic calorimeter together with systems for particleidentification . The design of the detector and its performance over the first year and a half of operation are presented .
1. Introduction
The Cornell Electron Storage Ring (CESR) wasconstructed in 1977-79, and started operating in 1979 .The storage ring provides electron-positron collisionsin the energy range of the T states, 9 to 11 GeV. Thephysics program is concentrated on the decay of the Tresonances and heavy quark flavoured mesons [1]. InSeptember 1979, two experimental groups, CLEO andCUSB. began recording and analyzing data . The firstseveral years of study led to the discovery of the TOS)and T(4S) resonances [2] and the reconstruction of Bmesons [3] coming from T(4S) decay. The overall dataindicated that these new particle states are compatiblewith the Standard Model but not describable by theother proposed symmetry models [4] of that time. By1983 it was realized that accurate tabulation of theproperties of B meson decay would provide importantparameters for the Standard Model and allow evalua-
L_ "A "
Y. Kubota el al. / The CLEO 11 detector
67
4-
HELIUM RESERVOIR
.-,, MOON CHAMBERS
SUPERCONDUCTINGCOIL
' MAGNET YOKE
BARRELCALORIMETER
MICRO-BETAQUADRUPOLE
POLE TIPCALORIMETER
POLE TIPTIME OF FLIGHT
DRIFT CHAMBER
PTL ANDVERTEX DETECTOR
BARRELTIME OF FLIGHT
CLE 11
tion of the ability of the Standard Model to describethe weak decay of heavy quark matter . However, tocarry out this program we needed a major upgrade inthe CLEO detector. The original CLEO detector [5],designed before the discovery of the T consisted of a17 layer drift chamber in a 0.4 T solenoid magneticfield of 1 m radius. In 1981, the magnet coil wasreplace with a superconducting coil and the field raisedto 1 .0 T [6].
At that time the outer detector, which providedparticle identification and magnetic flux return, wasfinalized to eight idc laical octants. Each octant con-tained a layer of drift chamber to measure the track Zcoordinate, a 20 layer proportional chamber to mea-sure specific ionization, time-of-flight counters, a leadlayered proportional chamber electromagneticcalorimeter, and a set of drift chambers outside of themagnet iron for muon identification. We began datarecording with this upgraded detector in March 1982.
Fig . 1 . The CLEO 11 detector (side view ai~û end view).
Section "A-A"

6.S
By 1953, it was clear we needed a better drift chamberand photon detector, and that the particle identifica-tion system had to be located inside of the coil .A program was initiated to build a new vertex
detector and drift chamber. The new vertex chamber(VD), a 10 layer hexagonal-cell drift chamber wascompleted and installed in the existing detector duringsummer 1954. While we continued data recording withthe new vertex detector, a 51 layer drift chamber wasbuilt. It was installed in the CLEO magnet [71 toreplace the original drift chamber in the summer of1956. In 1954. we requested funds to rebuild the rest ofthe CLEO detector [51, which we named CLEO 11 . Adiagram illustrating the CLEO II detector is shown ing. 1 . The major new elements are a SuperconductingMagnet with a coil radius of 1 .5 m and 1.5 T maximum
. a time-of-flight system which covers 95% of theangle, a CA electromagnetic calorimeter, and aidentification system. The CLEO 11 detector was
installed in the CESR south interaction region in1988-1959, and data recording began in October 1959.
n this paper the design properties of the CLEO IIdetector are described together with the current statusof calibration and resolution of the various subsystems.An expanded view of the detector inside of the magnetcoil is shown in fig. 2. The magnetic field is parallel to
e be
line and extends 1 .75 m from the centre ofthe interaction region to the magnet pole . We define
fielsol.,muo
Y. Kuhota et al. / The CLEO 11 defector
~o~r 1v
~ ;
`:vt4~,,
the Z axis to point along the direction of the positronbeam ; the X axis points horizontal (south), and the Yaxis points upward . We have been recording data withthe magnetic field at 1 .5 T, pointing in the -Z direc-tion. The electron and positron bunches at the interac-tion region are typically (FWHM) 1.1 mm wide, 0.1 mmhigh, and have a length of 4.2 cm . Each bunch passesthrough the interaction region 390 000 times per sec-ond. The machine currently operates with sevenbunches of electrons and seven bunches of positrons .The electrons and positrons have separated orbits thatpass through each other at the centre of the interactionregion.
When an "e + e - annihilation" occurs, most finalstate particles created in the collision pass through thebeam pipe and enter the detector . Particles moving atan angle between 25° and 155° with respect to thebeam pass through a 3.5 cm radius beryllium beampipe, 0.5 mm thick, and the precision tracking layer(PTL) which extends from the beam pipe to the vertexdetector. The PTL is a cell-strawtube-drift-chamber,which was designed and built in the Spring of 1959,after a decision was made to reduce the CESR beampipe radius at the interaction region from 5.5 to 3.5 cm .The vertex detector (VD), which operated in the CLEOI detector, covers the radial region from 7.5 to 17.5 cm .Beyond the VD is the 51 layer drift chamber (DR). Tomeasure the momentum vector of charged particles,
Fig. 2 . Schematic Drawing of one quadrant of the CLEO 11 detector . The following acronyms are used - DR, VD, PTL: The outer,intermediate and inner drift chambers . TF, CC, MU: The time-of-flight counters, crystal calorimeter and muon identification
system . Prefixes : B= barrel, E = endcap .

the data from all three chambers are combined.Charged particles created with a transverse momentumgreater than 225 McV/c and a polar angle greaterthan 45 ° will reach the outer radius of the DR and passthrough the barrel time-of-flight counters (BTF) andthe barrel crystal calorimeter (BCC). These tracks arethe best measured in the CLEO II detector. Chargedtracks with polar angles between 25° and 45° are mea-sured in the PTL, the VD, and part of the DR. Thetracking resolution in this small polar angle region issignificantly reduced, but is adequate for many pur-poses. The endcap time-of-flight counters (ETF) andendcap crystal calorimeter (ECC) cover the polar anglerange from 15° to 37° and are mounted on the magnetpole . The barrel and endcap time-of-flight and
Cryogenic SServicel
Current LeadAssembly
Stainless SteelCryostat
S.
Y. Kubota et aL / The CLEO I! detector 69
calorimeter systems overlap in polar angle range be-tween 35° and 37°. The barrel time-of-flight countersand the calorimeter cover the range from the 35° to145° . However, there is a reduction in their resolutionsin the region 35°-45° (and i35°-145°) arising from thematerials associated with the support structures for thedrift chamber and beam pipe, and the electrical cables .The barrel calorimeter fills the radial region from 1.02to 1 .44 m. It weighs approximately 30 tons and ismounted on the superconducting coil cryostat, whichextends radially to 1.74 m.
The magnet return yoke and muon identificationsystem (MU) are shown in fig . 1 . The iron of the returnyoke is octagonally divided. The first two 36 cm thicklayers arc the main elements for the magnetic field flux
Liquid HeliumStorage Dower
Thermal Redimion Screen
perconducting Coil
Liquid HeliumCooling Pipes
Iron Yoke
Fig. 3. Arrangement of the CLEO 11 superconducting coil and steel magnet yoke .

70
return . The third layer is primarily for the muon identi-fication system . Outside of each return yoke layerthere is a set of gas wire chambers used for muonidentification . These three sets of chambers cover theangular range 45°-135®. There is also one set of muonchambers outside each endcap which covers the polarangle range 30°-48®. Beyond the outermost muonchambers, there is a 2.5 cm thick piece of iron which ismounted to mechanically protect the chambers andshield them from radiation .
O ü magnet
sign goals and development
e primary requirements of the CLEO II magnetare a uniform, high magnetic field strength and suffi-cient size to contain the calorimeter inside the coil [8] .
h a new superconducting coil and new yoke wererequired.
e design of the new magnet is intended tokeep the g
features of the smallerCLEO I solenoid[b1 such as low, cryogenic load, while eliminating itsweaknesses such as
r insulating vacuum, sensitivityto refrigerator performance, susceptibility to utilityoutages and dependence on active quench protection.
e design goals are thus: increased stability, low cryo-genic load, passive cooling and passive protection .
Oxford Instruments, Ltd. and G.A. Technologies,Inc. each performed design studies with these require-ments in mind in late 1984. G.A . Technologies ex-plored a modern pool-boiling design using copper sta-bilized superconductor and Oxford Instruments usedthe novel thermosyphon approach to the cooling ofaluminum stabilized superconductor. Both designs metour criteria. These design studies were sent to a num-ber of potential coil fabricators who were asked tosubmit proposals based either on one of these studiesor on their own scheme. Oxford Instruments was se-lected on the basis of cost and design features and wasawarded the contract in June, 1985 . Construction wascompleted in July, 1987 at which time the coil wassuccessfully tested at 40% of full current at Oxford,
Table IParameters of the CLEO II magnet
ManufacturerMagnetic fieldDiameterLengthCoil, electricalWeightStabilityCooling
Y. Kubota et al. / The CLEO 11 detector
without its steel yoke. The coil arrived at Cornell inOctober, 1987 and passed full current acceptance testsin the steel yoke in February, 1988 . Dismantling of theCLEO I detector began in the summer of 1988 andassembly of CLEO II was completed in the fall of 1989 .
The design of the steel yoke for CLEO II under-went several revisions as the requirements were clari-fied . The CLEO I yoke was not adaptable as a unit tothe CLEO II requirements and the steel pieces couldnot easily be reworked . The availability of the old steelyoke of the Space Radiation Effects Laboratory syn-chrocyclotron that was stored at Brookhaven NationalLaboratory, and a use at Brookhaven for our oldCLEO I yoke and coil led to a natural trade . This steelwas machined by Dominion Bridge-Sulzer Inc . into theouter return yoke slabs. New, forged steel was pur-chased and machined into the pole pieces . Our sched-ule allowed interaction with Oxford Instruments onthose design features of the yoke that interfaced withthe superconducting coil . Fig. 3 shows a general viewof the magnet and table 1 provides its general parame-ters .
2.2. Magnet yoke and poles
The availability of the steel from Brookhaven Na-tional Laboratory determined the return yoke thick-ness to be 36 cm and led to octagonal symmetry as themost convenient geometry to incorporate these pieces .There are three layers of steel, separated by gaps of 9cm for muon detectors, with the inner two layersproviding almost all the magnetic flux return . A 2.5 cmthick sheet of steel outside the outermost muon cham-bers is added for protection and radiation shielding.The cut in the steel yoke for access to the supercon-ducting coil is made at a joint in the octagonal outerreturn layers . Thus the cryogenic utilities are at anangle of 22.5° from vertical .
The pole pieces of the magnet are formed of nest-ing rings on each end in order to satisfy the functionsof magnetic flux return, support structure, access andassembly. The outer collar with an octagonal outsideand circular inside supports the return yoke slabs of
Oxford Instruments, Ltd .1 .5 T, uniform to ±0.2% over 95% of the solid an-c! - in the drift chamber volume2.9 m clear bore, 3 .1 m coil3 .5 m coil, 3 .8 m cryostat3300 A, 4.6 H, 25 MJ7000 kg cold mass; 20000 kg cryostat ; 800000 kg steelIntrinsically stable, quenchback from high purity Al secondaryIndirect, thermosyphon

4.89or5.10
Fig . 4 . Schematic cross section of the superconducting wire.All dimensions are in millimetres.
steel and the cryostat. Penetrations provide access tothe adjustable radial and axial supports for the coil .Two more nesting rings and the inner pole are assem-bled in a way that allows the installation of the detec-tor elements. Holes and grooves are cut in them for thepassage of cables and lightpipes. The inner pole piecesof 2 m diameter and the nearby CESR quadrupolesrest on rails so that they may be withdrawn to provideaccess to the ends of the drift chamber and othercomponents near the interaction point.
RETURN YOKE
.----- 77"_- . . . . . .
. . .
SS VACUUM VESSEL
RADIAL SUPPORTLOCATION
SCALE IN CM
i0 5 10 15 20 25
Y. Kubota et al. / The CLEO 11detector
UTILITY STACK
HIGH PURITY AL.SECONDARY
�CONDUCTOR . . . . . . . . . . . . . .
��� . . . . . . ._ ._ . .~RADIATION SCREEN,..T_- _.~ .~ . . .-_: :
SUPERINSULATION
2.3. Superconducting coil
The design of the coil was driven by the primarygoals listed above. The choice of operating current,3300 A, is a compromise between low heat generationin the leads and large conductor size with its simplerconstruction and ease of protection . The choice of a5 x 16 mm= aluminum stabilized superconductor in-creased the point source energy necessary to cause aquench from less than 10 mJ in the CLEO I coil to 6 Jin the final CLEO II design . The high purity aluminumwith resistivity ratio, RRR = R(300 K)/R(4 K) = 1000,was coextruded by Vacuumschmelze over Cu-NbTiflat cable with a helical wind. Fig. 4 illustrates thiswire . An eleven-strand cable was used for the innerlayer and a nine-strand cable for the outer layer of thetwo layer coil. Eight pieces of conductor were usedaltogether in the soil . To improve the field uniformity,the current density over the end sections was increasedby 4% by reducing the width of the conductor from 5.1to 4.9 mm.
To support the magnetic hoop stress, Oxford Instru-ments chose to wind the coil on the inside of a struc-tural aluminum shell. For self-protection a single turnsecondary in the form of a 1.5 mm thick, high purity(RRR > 2000) aluminum sheet is first fastened to theinside of the shell . This sheet is an excellent thermaland electrical conductor and magnetically closely cou-pled to the primary winding . Its resistance is adjusted
POLE
71
Fig . 5 . Section near one end showing the cryostat . radiation screen, superconducting windings in the aluminum shell and an axialsupport fixture .

72
to protect the coil during a quench (about 1 min timeconstant) but not generate excessive heat during nor-mal charging and discharging (about 80 min time con-stant). The all aluminum construction greatly mini-mized thermal stresses.
The winding was done by feeding the conductor incompression on the inside of the coil shell, slowlyrotating on a turntable, synchronized to the conductorfeed. Several stations along the conductor path outsidethe shell prepared the conductor (shot blasting, de-greasing, drying, burr detection and taping). The laststation was a platform inside the coil form that used acaterpillar feed and runway to push the conductor ontothe previous turn. The platform rose as 650 turns perlayer were added to the coil. Using an inductive tech-nique, Oxford Instruments monitored the coil for turn-to- faults. The seven joints on the coil were madeby reducing the thickness of the conductor from 5 to3.3 mm, laying two such lengths together and makingtwo edge welds, using a high purity aluminum fillerover a length of 8
mm. Joint resistance is estimatedto
2X 10 - "' 11 . The joints between the coil andcurrent leads were made by copper-plating and soft-soldering, thus yielding demountable joints . Afterwinding, the coil was vacuum impregnated with anepoxy resin and cured at 120*C. A section near the endof the coil is shown in fig. 5.
24! Themt , phon system
A key design goal was to avoid quenches in cases ofutility or refrigerator problems. This has been achievedby, locating above the magnet a 700 1 dewar whichdelivers cold liquid helium to a manifold on the bottomof the coil. This manifold supplies 32 riser pipes fas-tened to the outside of the coil shell where the heliumabsorbs heat and decreases in density. The buoyancy oflower density liquid helium and gas bubbles rising inthe pipes draws the liquid around the circuit in onedirection. The two-phase flow returns to the dewarwhere it separates . This natural flow circulation, re-ferred to as a thermosyphon, is self regulating, reliableand avoids the use of a liquid helium pump. Some ofthe cold gas cools the current leads and the neck of thedewar; the rest returns cold to the refrigerator . Thesmall inventory of liquid helium in the coil means thatthe gaseous helium generated during a quench can beaccommodated in a benign way. The 700 1 dewarprovides over one day of operation with disabled re-frigeration . Valves inside the dewar allow forced flowcooling from the refrigerator during cooldown whenthere are no significant buoyancy effects to drive thethermosyphon circulation .
The details of the thermal coupling between therisers and the coil shell are important to both ramping
Y. Kubota et al. / The CLEO 11 detector
the coil and its protection in case of a quench. Therisers are stainless steel tubes embedded in indium-packed channels cut in the coil shell. The thermalimpedance of this interface turned out to be higherthan anticipated, limiting the cooling capacity of thethermosyphon to about 200 W. This limits our chargingvoltage to about 3 V or ramping rate to about 0.7 A/s,thus requiring a time of about 1.5 h to reach fullcurrent. Temperatures of 6 K on the coil shell aretypical during ramping. At the high heat loads encoun-tered in a quench the thermosyphon cooling loop be-comes saturated as the helium in the risers completelyevaporates . The cooling capacity of this dried out con-dition can be set by adjusting a constricting valve in theloop. It is set at the few hundred watts level but withthe higher than expected thermal impedance of theriser-coil shell interface, the drying out of the ther-mosyphon is not critical .
2.5 Radiation screen
Thermal isolation of the coil is provided by aliquid-nitrogen cooled radiation screen which is insu-lated from the cryostat by about 100 layers of alu-minized Mylar superinsulation. The screen consists ofinner and outer cylinders of aluminum honeycombpanels 15 mm thick with aluminum tubing bonded toone skin . The heat load to liquid nitrogen is slightlyless than 50 W. The coil-side surfaces of the radiationscreen are lined with a low emissivity material toreduce the radiant heat load on the coil . Fig. 5 includesa portion of the radiation screen. During cooldown ofthe system, a controller mixes liquid and gaseous nitro-gen to provide a controlled ramp of the temperature ofthe radiation screen over a period of days, thus match-ing the coil cooldown rate and avoiding thermalstresses. During normal operation, the radiation screenpiping is filled with liquid nitrogen .
2.6. Refrigeration system
The superconducting coil is cooled by either of twoKoch process model 1430 liquefiers. These previouslycooled the CLEO I coil . They have mechanical engineswith a refrigeration capacity of 100 W, liquefactioncapacity of 40 1/h or combinations between. The sys-tem is interconnected to have nearly complete redun-dancy for the active components, the refrigerators andcompressors. In addition to the 700 1 dewar above thecoil there is a 1000 1 dewar that can be filled by eitherrefrigerator or from a vendor's dewar. In normal oper-ations the refrigerators are switched approximated ev-ery 12 weeks and the 1000 1 dewar is not used . Thevarious sources of helium are connected in a largecryogenic valve box to a coaxial transfer line going tothe 700 1 dewar. This low-loss coaxial line, made by
Kabelmetal Electro GmbH, also returns cold heliumgas and carries liquid nitrogen for the radiation shield .The line is a semi-flexible design that permitted opera-tion in the test location without rebuilding . Estimatesof the cryogenic requirements are 8 W for the coil withcold gas return, a similar number for the valve box andtransfer line- ~ -. .-id 14 1/h liquid equivalen! with warmgas return . The refrigerators operate without attentionduring nights and weekends.
27. Current leads
The 3300 A current leads were designed by OxfordInstruments to have low heat conduction from roomtemperature to the liquid helium while maintaining amargin of safety against overheating in case of loss ofhelium gas coolant for the 80 min magnet rampdowntime . The extra thermal mass for this safety conditionwas obtained by adding material in the form of fins .Before installation the leads were tested to 110% ofnormal operating current and at operating current withno gas cooling. The performance indicated that themagnet would ramp down safely without quenching.The control, monitoring and alarm systems make oper-ation of the leads automatic. The helium gas flow iscontrolled at the warm return end by a regulating valvethat is set by the temperature of the lead at a point20% from the warm end. This regulation adjusts forthe current in the lead and the return pressure of thehelium compressors . The controller has two differenttemperature set-points: one optimized for refrigeratoroperation and tire other "over-cooled" for dewar oper-ation. A second set of controllers powers heaters onthe warm ends of the leads to prevent condensation .
2.8. Cryostat and supports
The stainless steel cryostat, which supports the 30ton weight of the CsI calorimeter, is supported by themassive steel return yoke . The cryostat consists of a 12mm thick outer cylinder, a 10 mm inner cylinder andtwo 20 mm thick end flanges which are bolted andsealed with O-rings. The coil is movable inside thecryostat in order to accommodate thermal contraction,to minimize magnetic decentering forces and to align_the magnetic axis . The titanium supports are adjustableat 4 K through their coupling to bellows sealed ports inthe cryostat wall and end flanges. There are four axialsupports, a1_1 at the service end of the coil, acting eitherin tension or compression. They have a stiffness ofseveral times the magnetic decentering forces . An axialsupport is shown in fig . 5. There are sixteen radial/azimuthal supports arranged in pairs tangential to thecoil to act purely in tension . Strain gauges on allsupports monitor the magnet loads and weight .
Y. Kubota et aL / The CLEO 11 detector
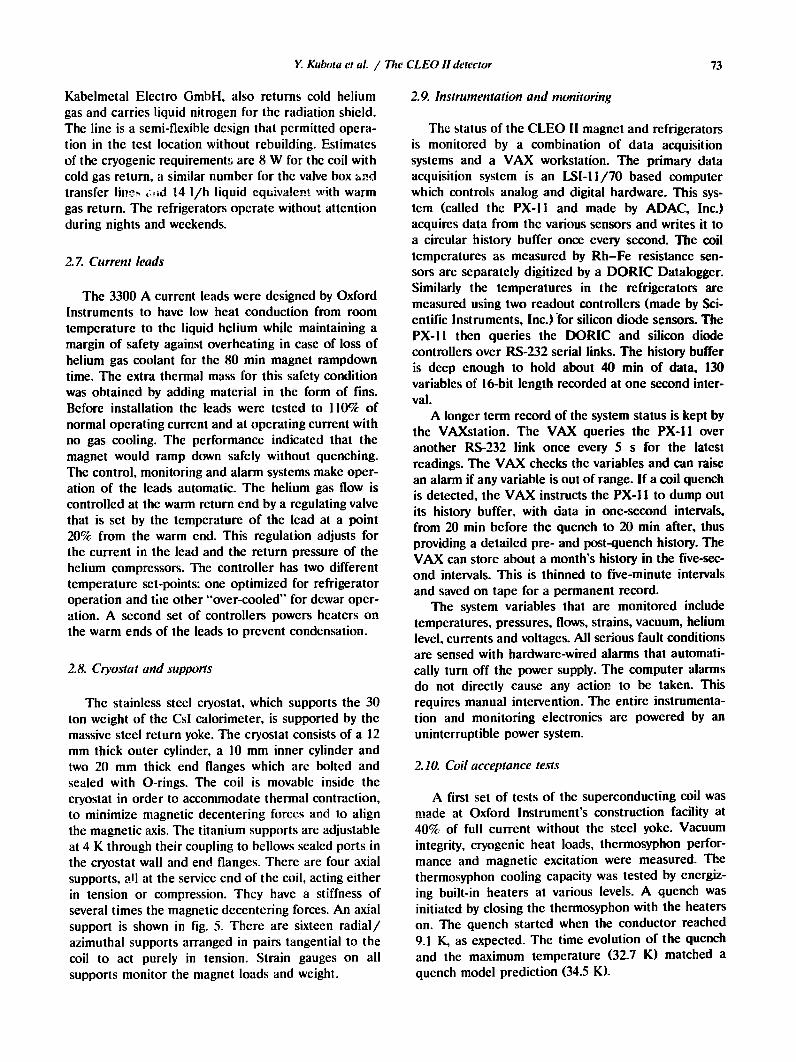
2.9. Instrumentation and monitoring
73
The status of the CLEO II magnet and refrigeratorsis monitored by a combination of data acquisitionsystems and a VAX workstation. The primary dataacquisition system is an LSI-l 1/70 based computerwhich controls analog and digital hardware . This sys-tem (called the PX-11 and made by ADAC, Inc.)acquires data from the various sensors and writes it toa circular history buffer once every second . The coiltemperatures as measured by Rh-Fe resistance sen-sors are separately digitized by a DORIC Datalogger.Similarly the temperatures in the refrigerators aremeasured using two readout controllers (made by Sci-entific Instruments, Inc.) for silicon diode sensors. ThePX-11 then queries the DORIC and silicon diodecontrollers over RS-232 serial links. The history bufferis deep enough to hold about 40 min of data, 130variables of 16-bit length recorded at one second inter-val.A longer term record of the system status is kept by
the VAXstation . The VAX queries the PX-11 overanother RS-232 link once every 5 s for the latestreadings . The VAX checks the variables and can raisean alarm if any variable is out of range. If a coil quenchis detected, the VAX instructs the PX-11 to dump outits history buffer, with data in one-second intervals,from 20 min before the quench to 20 min after, thusproviding a detailed pre- and post-quench history. TheVAX can store about a month's history in the five-sec-ond intervals. This is thinned to five-minute intervalsand saved on tape for a permanent record .
The system variables that are monitored includetemperatures, pressures, flows, strains, vacuum, heliumlevel, currents and voltages . All serious fault conditionsare sensed with hardware-wired alarms that automati-cally turn off the power supply . The computer alarmsdo not directly cause any action to be taken. Thisrequires manual intervention . The entire instrumenta-tion and monitoring electronics are powered by anuninterruptible power system.
2.10. Coil acceptance tests
A first set of tests of the superconducting coil wasmade at Oxford Instrument's construction facility at40% of full current without the steel yoke . Vacuumintegrity, cryogenic heat loads, thermosyphon perfor-mance and magnetic excitation were measured. Tl.ethermosyphon cooling capacity was tested by energiz-ing built-in heaters at various levels . A quench wasinitiated by closing the thermosyphon with the heaterson . The quench started when the conductor reached9.1 K, as expected . The time evolution of the quenchand the maximum temperature (32.7 K) matched aquench model prediction (34.5 K).

74
ä
W1.3a A 0 .6 cm rad.
O 19 .4 cm rad.O 39.4 cm rad.
1.2 v . . . t . .
!
I-200 -100 0 100 200
Z (cm)
Fig. 6. Plot of the axial magnetic field or three radii. Thedata are averaged over azimuth.
e coil and two layers of the return yoke wereassembled away from the beam line [9] at Cornell in1988. After a cooldown time of twelve days, using onerefrigerator, the tests started with two self-inducedquenches at full current . Their origin is still not under-stood, but were typical of training events . The currentdecayed during a quench in about one minute. The coilreached an average temperature of 65 K in agreementwith prediction. After operating the coil at the fullfield of 1.5 T at 3300 A, the temperature margin wastested by increasing the coil temperature 1 .5 K withthe heaters, out of an expected margin of 2.2 K . Thecurrent margin was explored by running at 102% of thefull current. Another quench occurred recently afterthe coil was warmed and recooled . The coil has beenwarmed and recooled several times in the past twoyears without experiencing subsequent quenches . Thisrecent quench is not understood.
2.11 . Magnetic field homogeneity
The magnetic field was mapped with a three-axisHall probe referenced to a fixed NMR probe. Tra-verses in z (the axial direction) were made at fixedradius and azimuth . The data, averaged over azimuth,were fit to appropriate polynomials in r and z in amanner consistent with Maxwell's equations . Fig. 6shows typical results for Bz . Field uniformity over the 2m long by 1 m radius drift chamber volume is betterthan 0.1% . These measurements in the test locationwere taken without the CESR samarium-cobalt per-manent magnet interaction quadrupoles in place . Cal-culations using the program TRIM indicate that theeffect of these quadrupoles is localized to forwarddirections, i .e ., near the physical quadrupoles, with therealistic condition that the permanent magnet materialhas a differential magnetic permeability of 1 .03 . Theexternal quadrupole field of this material has been
Y. Kubota et aL / The CLEO 11 detector
ignored in this calculation but its effect is small andfalls off as 1 /r ; . Overall the magnetic field is uniformto 0.2% in the drift chamber volume over 95% of thetotal solid angle . The tracking program assumes auniform field .
2.12. Magnetic field absolute vahse
During normal data-taking the magnetic field ismonitored with an NMR probe that is located a fewcentimetres beyond the end of the drift chamber . Thisis not the same position as in the field mapping whenthe samarium-cobalt quadrupoles were not installed .Therefore a calibration of the average, effective magnetic field in the drift chamber volume has been madeusing event reconstruction involving W pairs and theknown masses of the particles D11, 4 and K°. Thisyielded a correction to the magnetic field at the centreof the magnet of 0.11 % compared to the field measure-ment with the NMR probe, which is near the magnetpole, and the longitudinal field mapping . This correc-tion is within the estimated accuracy of the measure-ments .
3. Tracking system
3.1 . Overview
Charged particle trajectories are measured in CLEO11 with a set of three concentric, cylindrical wire driftchambers as shown in fig. 2. The common axis of thechambers is aligned along the direction of the storagering beams. Different goals are achieved with each ofthe three chambers that would be more difficult tosimultaneously meet with a single chamber . The outerdrift chamber, with radius from 17.5 to 95 cm, is usedprimarily to measure charged particle :mom=entum vec-tors at the vertex. Momentum transverse to the beamaxis, Pt , radial distance of closest approach of the trackextrapolation to the beam line, and the azimuthaldirection, 0, are measured with 40 axial (parallel to thebeam axis) wire layers. Longitudinal measurements,polar angle and the longitudinal distance from thecentre of the interaction region to the extrapolation ofthe track to the beam axis, are measured with 11 smallangle stereo wire layers and two layers of segmentedcathode readout .
In a 1 .5 T field, particles with a P, of 90 MeV/ccross only seven layers in the outer drift chamberbefore curling around. Transverse momentum is thenbetter measured in the intermediate drift chamber .This chamber, originally installed as a vertex detector,has ten axial wire layers with radius from 8.4 to 16.0 cmfor Pt and cß measurements . On average, the layerspacing and cell width is 70% that of the outer driftchamber, providing better granularity for separating
tracks . The polar angle is measured with two layers ofsegmented cathode readout in addition to charge divi-sion on all wires. The inner vertex detector has sixlongitudinal wire layers with radius from 4.7 to 7.2 cm .This provides the most precise transverse directionmeasurements for determining particle directions andseparating primary from secondary vertices .
The drift chambers provide acceptance that is ho-mogeneous over azimuth for the polar angle rangecos 01 < 0.90.
However, track
reconstruction efficiency and resolutions are poorer at polar angles below45° ( 1 cos 0 I > 0.71) because of the reduction in thenumber of layers . Each of the three drift chambers isdescribed below. This is followed by a description ofthe readout electronics and the gas circulation system .Finally, our current understanding of the momentum .direction and specific ionization resolutions is dis-cussed .
3.2. Outer drift chamber
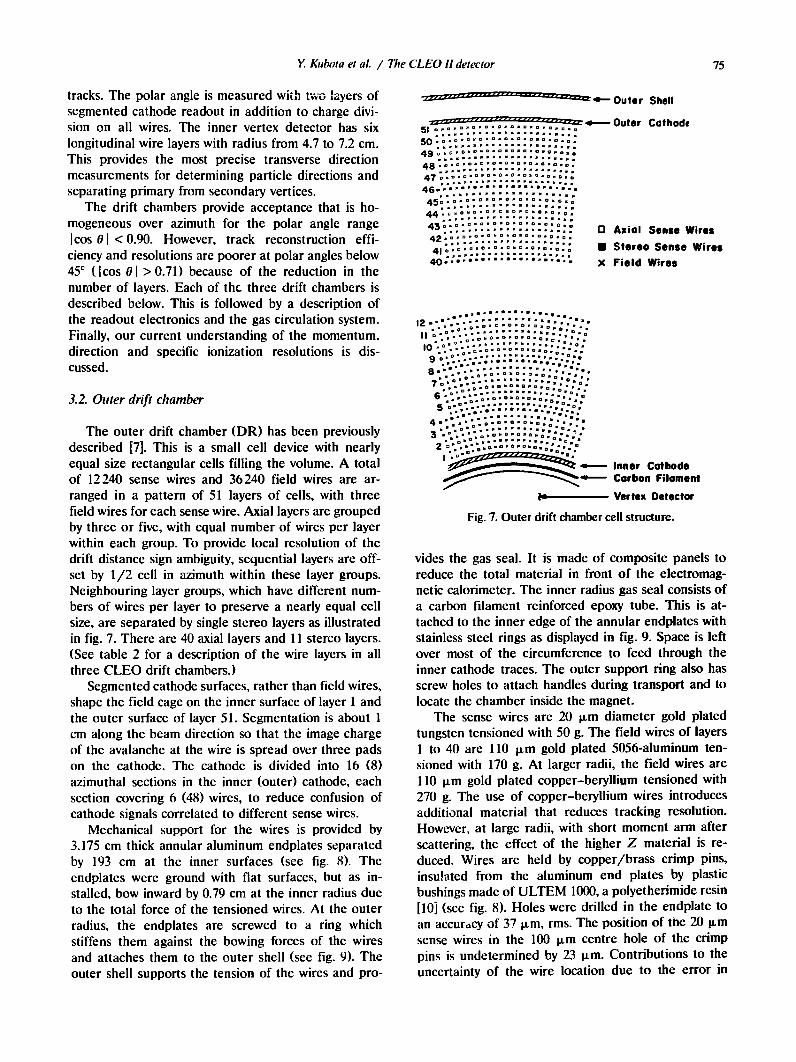
The outer drift chamber (DR) has been previouslydescribed [7]. This is a small cell device with nearlyequal size rectangular cells filling the volume . A totalof 12 240 sense wires and 36 240 field wires are ar-ranged in a pattern of 51 layers of cells, with threefield wires for each sense wire . Axial layers are groupedby three or five, with equal number of wires per layerwithin each group. To provide local resolution of thedrift distance sign ambiguity, sequential layers are off-set by 1/2 cell in azimuth within these layer groups.Neighbouring layer groups, which have different num-bers of wires per layer to preserve a nearly equal cellsize, are separated by single stereo layers as illustratedin fig . 7. There are 40 axial layers and 11 stereo layers .(See table 2 for a description of the wire layers in allthree CLEO drift chambers.)
Segmented cathode surfaces, rather than field wires,shape the field cage on the inner surface of layer 1 andthe outer surface of layer 51 . Segmentation is about 1cm along the beam direction so that the image chargeof the avalanche at the wire is spread over three padson the cathode . The cathode is divided into 16 (8)azimuthal sections in the inner (outer) cathode, eachsection covering 6 (48) wires, to reduce confusion ofcathode signals correlated to different sense wires.
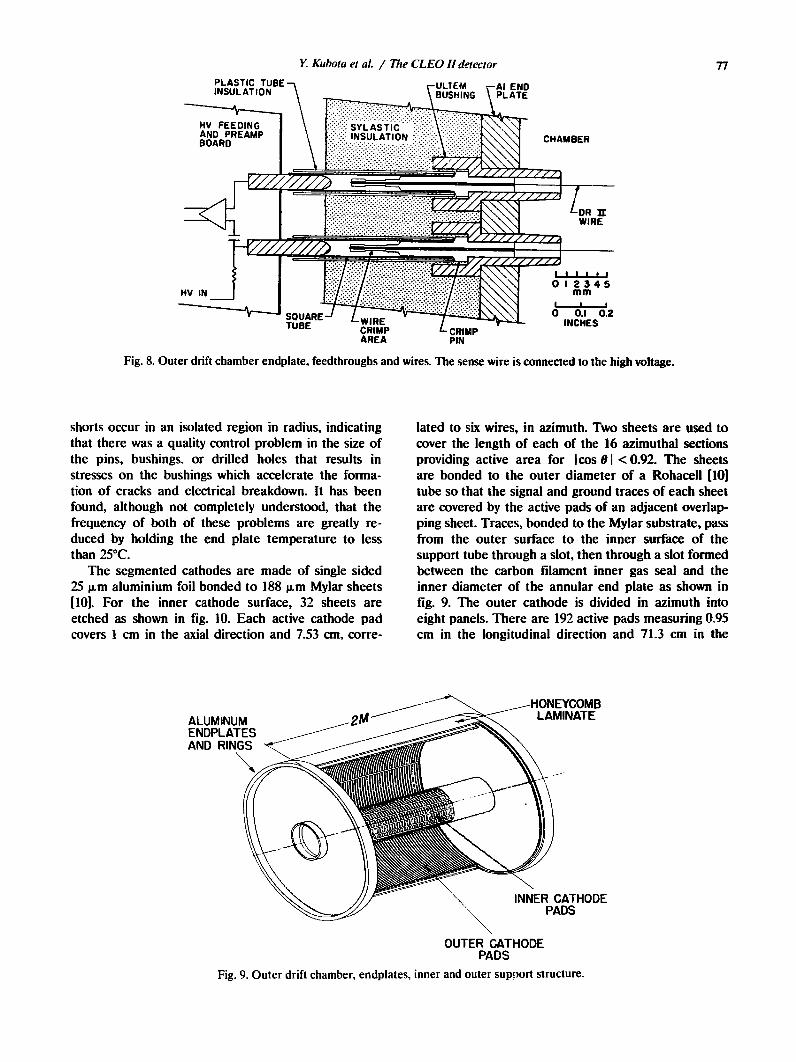
Mechanical support for the wires is provided by3.175 cm thick annular aluminum endplates separatedby 193 cm at the inner surfaces (see fig . 8) . Theendplates were ground with flat surfaces, but as in-stalled, bow inward by 0.79 cm at the inner radius dueto the total force of the tensioned wires. At the outerradius, the endplates are screwed to a ring whichstiffens them against the bowing forces of the wiresand attaches them to the outer shell (see fig. 9). Theouter shell supports the tension of the wires and pro-
Y. Kubota et al. / The CLEO 11 detector
51 o . c . o . o . o . o . o . o . o . o . o . o
®- Outer50,ca490 .0 .0 .0 .0 .0 . . . . . . . . .o, .48
ox :*.. . . . .
. . .
. . .4To .o .o . o . o .o
46-'- . :::: . . . . . .�� ,
44 " 11 " c " ~ ;o .o .o . . . . .oaca. o . o . o . o . o .43 .O .0
o . o , o
42 " o " o :*m " o :o : . .o . . .o .o .419a
a aPaaaa :~ :~ :a . o , o
40=:. . . . . . . . . . . . . . .�
t-Outer Shell
O Axial Sense WiresStereo Sense Wires
X Field Wires
Cathode
14
- Vertex Detector
Fig. 7. Outer drift chamber cell structure.
75
vides the gas seal. It is made of composite panels toreduce the total material in front of the electromag-netic calorimeter. The inner radius gas seal consists ofa carbon filament reinforced epoxy tube. This is at-tached to the inner edge of the annular endplates withstainless steel rings as displayed in fig. 9. Space is leftover most of the circumference to feed through theinner cathode traces . The outer support ring also hasscrew holes to attach handles during transport and tolocate the chamber inside the magnet .
The sense wires are 20 Wm diameter gold platedtungsten tensioned with 50 g. The field wires of layers1 to 40 are 110 Rm gold plated 5056-aluminum ten-sioned with 170 g. At larger radii, the field wires are110 l.Lm gold plated copper-beryllium tensioned with270 g. The use of copper-beryllium wires introducesadditional material that reduces tracking resolution .However, at large radii, with short moment arm afterscattering, the effect of the higher Z material is re-duced. Wires are held by copper/brass crimp pins,insulated from the aluminum end plates by plasticbushings made of ULTEM 1000, a polyetherimide resin[10] (see fig . 8) . Holes were drilled in the endplate toan accuracy of 37 Wm, rms. The position of the 20 Wmsense wires in the 100 Wm centre hole of the crimppins is undetermined by 23 Wm. Contributions to theuncertainty of the wire location due to the error in
76
concentricity of the crimp pins and plastic bushings are`mall compared to these two errors resulting in a totaluncertainty of 45 Rm, rms.
The method of holding the wires produced twoproblems in the reliability of the outer drift chamber.During operation, in the period from 1986 to mid 1990,there have been occurrences of broken wires at therate of one per six weeks and shorted bushings at therate of one per week. Wire breakage occurs mostly inthe aluminum field wires at the point where the crimp
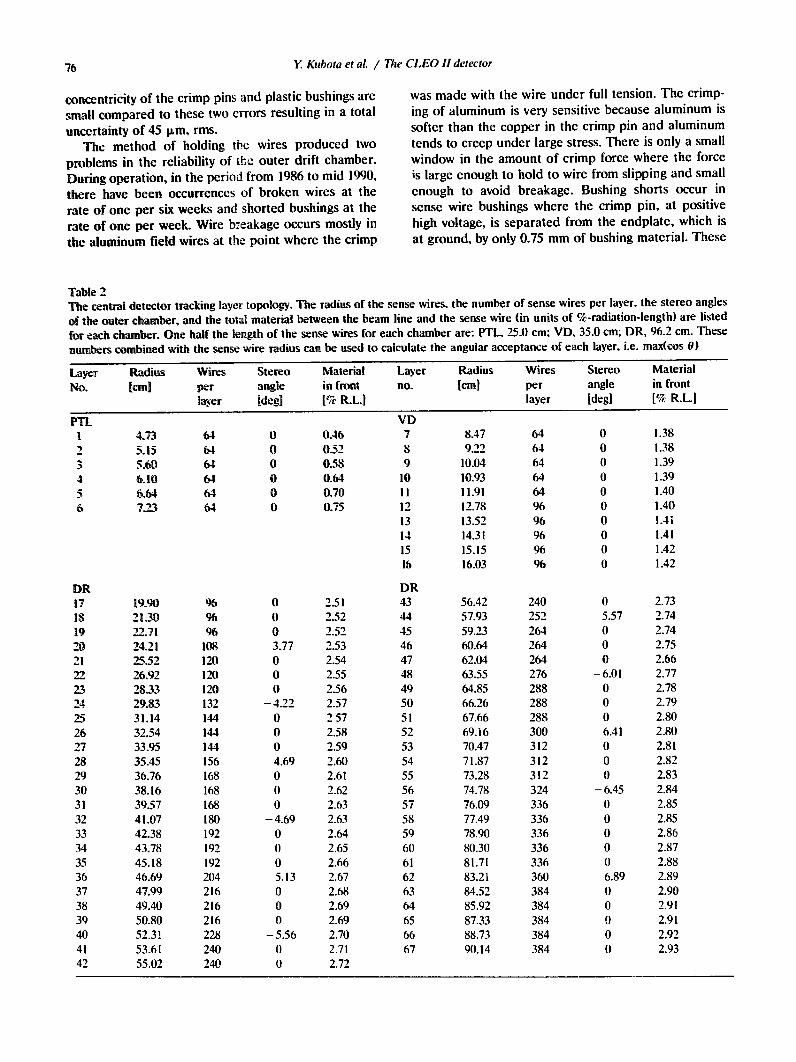
Table 2ecentral detector tracking layer topology. The radius of the sense wires, the number of sense wires per layer, the stereo angles
of the outer chamber, and the total material between the beam line and the sense wire (in units of %-radiation-length) are listedfor each chamber. One half the length of the sense wires for each chamber are: PTL 25.0 cm, VD, 35.0 cm, DR, 96.2 cm . Thesenumbers combined with the sense wire radius can be used to calculate the angular acceptance of each layer, i .e . max(cos 0)
Y. Kuhota et al. / The CLEO 11 detector
was made with the wire under full tension . The crimp-ing of aluminum is very sensitive because aluminum issofter than the copper in the crimp pin and aluminumtends to creep under large stress . There is only a smallwindow in the amount of crimp force where the forceis large enough to hold to wire from slipping and smallenough to avoid breakage . Bushing shorts occur insense wire bushings where the crimp pin, at positivehigh voltage, is separated from the endplate, which isat ground, by only 0.75 mm of bushing material. These
Laver Radius[cm]
Wiresperlayer
Stereoangle[deg]
Materialin front11% R.L.]
Layerno .
Radius[cm]
Wiresperlayer
Stereoangle[deg]
Materialin front[% R.L.]
VD1 4.73 64 0 0.46 7 8.47 64 0 1.382 5.15 64 0 0.52 8 9.22 64 0 1.38
5. 64 0 0.58 9 10 .04 64 0 1.394 6.10 64 0 0.64 10 10 .93 64 0 1 .395 6.64 64 0 0.70 11 11 .91 64 0 1 .406 7.213 64 0 0.75 12 12.78 96 0 1 .40
13 13 .52 96 0 1 .4114 14.31 96 0 1.4115 15 .15 96 0 1.4216 16 .03 96 0 1.42
R DR17 19. 96 0 2.51 43 56.42 240 0 2.7318 21 . 96 0 2.52 44 57.93 252 5.57 2.7419 2-1.71 96 0 2.52 45 59.23 264 0 2.7420 24.21 1 3.77 2.53 46 60.64 264 0 2.7521 25.52 120 0 2.54 47 62.04 264 0 2.6622 26.92 120 0 2.55 48 63.55 276 -6.01 2.7723 28.33 120 0 2.56 49 64.85 288 0 2.7824 29.83 132 -4.22 2.57 50 66.26 288 0 2.7925 31 .14 144 0 257 51 67.66 288 0 2.8026 32.54 144 0 2.58 52 69.l6 300 6.41 2.8027 33.95 144 0 2.59 53 70.47 3l2 0 2.8128 35.45 156 4.69 2.60 54 71.87 312 0 2.8229 36.76 168 0 2.61 55 73.28 312 0 2.8330 38.16 168 0 2.62 56 74.78 324 -6.45 2.8431 39.57 168 0 2.63 57 76.09 336 0 2.8532 41.07 180 -4.69 2.63 58 77.49 336 0 2.8533 42.38 192 0 2.64 59 78.90 336 0 2.8634 43.78 192 0 2.65 60 80.30 336 0 2.8735 45.18 192 0 2.66 61 81 .71 336 0 2.8836 46.69 204 5.l3 2.67 62 83 .2l 360 6.89 2.8937 47.99 216 0 2.68 63 84.52 384 0 2.9038 49.40 216 0 2.69 64 85.92 384 0 2.9l39 50.80 216 0 2.69 65 87.33 384 0 2.9l40 52.31 228 -5.56 2.70 66 88 .73 384 0 2.9241 53.61 240 0 2.71 67 90.14 384 0 2.9342 55.02 240 0 2.72
PLASTIC TUBE
~-ULTEM
AI ENDINSULATION
-
\ BUSHING
TAI
IV
HV FEEDINGAND PREAMPBOARD
Y. Kubota et al. / TheCLEO 11 detector
shorts occur in an isolated region in radius, indicatingthat there was a quality control problem in the size ofthe pins, bushings . or drilled holes that results instresses on the bushings which accelerate the forma-tion of cracks and electrical breakdown . It has beenfound, although not completely understood, that thefrequency of both of these problems are greatly re-duced by holding the end plate temperature to lessthan 25°C.
The segmented cathodes are made of single sided25 pm aluminium foil bonded to 188 pm Mylar sheets[101. For the inner cathode surface, 32 sheets areetched as shown in fig . 10. Each active cathode padcovers 1 cm in the axial direction and 7.53 cm, corre-
ALUMINUMENDPLATESAND RINGS
OUTER CATHODEPADS
CHAMBER
ei i 1 à i
012345mm00.1 0.2
INCHES
Fig . 8. Outer drift chamber endplate, feedthroughs and wires . The sense wire is connected to the high voltage .
lated to six wires, in azimuth . Two sheets are used tocover the length of each of the 16 azimuthal sectionsproviding active area for ICos 0 I < 0.92. The sheetsare bonded to the outer diameter of a Itohacell [101tube so that the signal and ground traces of each sheetare covered by the active pads of an adjacent overlap-ping sheet . Traces, bonded to the Mylar substrate, passfrom the outer surface to the inner surface of thesupport tube through a slot, then through a slot formedbetween the carbon filament inner gas seal and theinner diameter of the annular end plate as shown infig. 9. The outer cathode is divided in azimuth intoeight panels. There are 192 active pads measuring 0.95cm in the longitudinal direction and 71.3 cm in the
HONEYCOMBLAMINATE
INNER CATHODEPADS
Fig . 9 . Outer drift chamber, endplates, inner and outer support structure .
77

78
CONNECTORPADS (.254cmSPACING)
NON-ACTIVECATHODE PAD
\
CATHODE PAD
imuth
direction, contributing to the field cage of 48wires.
e full length of each panel is 1 .826 m, provid-ing an active area for I cos o C < 0.71. The panels arecomposite. The inner face is an etched aluminized
ylar sheet which forms the active surface. The outersurface is l exan [101 over a layer of fibreglass. Aninner core, needed to provide thickness for rigidity. isplastic honeycomb, 6.35 mm thick. Traces, etched ine aluminum on the Mylar substrate, wrap around an
axial edge from the inside surface of the panel to theoutside. There, the traces are connected to a twistedpair cable which is brought outside the gas volume*hrouagh slots machined in the endplate .
3.3 Intermediate drift chamber (vertex detector, VD)
The intermediate drift chamber was first installed inCLEO in 1984 as a vertex detector . A total of 800sense wires and 2272 field wires are arranged to form10 layers of small hexagonal cells, with three field wiresfor each sense wire, as shown in fig. 11 . All wires areaxial, and are divided into two groups with 64 cells perlayer in the inner group (layers 1 to 5), and 96 cells perlayer in the outer group. Ambiguity of the sign of thedrift distance can be resolved locally with half cellstaggering from layer to layer within the group. Toallow for running at a higher voltage and provide formore ionization the chamber is operated at 20 psiabsolute pressure. The gas is similar to that in theouter drift chamber, 50% argon and 50% ethane butwith a small amount of water added to reduce theamount of organic compound building up on the wires .
As in the outer drift chamber, segmented cathodesurfaces, rather than wires, shape the field cage on theinner surface of the first layer and the outer surface of
Y. Kubota et al. / The CLEO II detector
Fig. 10. Outer drift chamber, inner cathode etched surface.
the last layer. Segmentation is 5.85 (6.85) mm along thebeam direction on the inner (outer) cathode surface sothat the image charge of the avalanche at the wire isspread over three pads on the cathode. Both inner andouter cathode surfaces in the intermediate drift cham-ber are divided into eight azimuthal sections to reduceconfusion of cathode signals correlated to differentsense wires. To provide further measurements in theaxial direction, the sense wires are made of a nickel-chromium alloy with about three times the resistivity ofgold plated tungsten and are instrumented for chargeddivision measurements . The field wires are made ofaluminum.
Mechanical support for the wires is provided bycopper clad G-10 annular endplates separated by 70
" + "+®/coat10+-%+0+®+" + "+® """""""""""" ®9+
ENLARGED VIEW OFSIGNAL AND GROUNDTRACES
7+®®®®o"o00000 +
+ Sense wire6009 oe " oô®® "®"5 0 +0+ " +0+"""""""""A ..0+ " +o+0A
® ® 0 0 0 0 0 0 0"""""""""
2 +0+ " +0+®t0 0400 00000
-outer cathodestrips
® Field wire
\inner cathodestrips
Interaction point
Fig . 11 . Intermediate drift chamber cell structure .

cm at the inner surface (see fig . 12). The endplates aresupported by carbon filament reinforced epoxy tubes atthe inner and outer radii . On the inner surface, thecarbon filament tube is pinned and epoxied into posi-tion. On the outer surface, the carbon filament tube issealed to the endplates with O-rings, and screws hold itin position . Wires are positioned directly by ridge slotsurfaces machined on the inside surface of each G-10endplates at the appropriate radii . and holes drilled onthe other side . The radial positions of the wires aredefined by the slots machined 5.1 mm deep into thegas volume side of the endplates. Matching holes aredrilled 21 .6 mm deep into the outside surface of eachendplate, for each wire (see fig. 13) . These holes definethe azimuthal position, as the wires are pulled to oneside before pinning . The hole and slot overlap to forma "D" shape through which the wire can be easilyinserted and positioned without the added uncertain-ties of insulating bushings and crimp pins as in theouter drift chamber. Hollow cylindrical bushings areinserted into the holes on the outside of the endplate.A tapered pin inserted into the bushing holds the wirein place by friction . In the case of field wires, thebushings are brass to provide an electrical connectionto the copper cladding on the endplate, while for thesense wires, the bushings are made of Delrin [10] .
The segmented cathodes in the intermediate driftchamber are made of 76 gm Mylar sheets with 8 Wmaluminum foil bonded on both sides . Sheets are etchedas shown in fig . 14 with each sheet covering one half ofthe active length of the chamber and 1/8 of the
Y. Kuhota et al. / The CLEO !I detector
Fig. 12. Intermediate drift chamber.
azimuth . The signal lines for the active pads are thenon the reverse side of the Mylar. To provide a lowimpedance electrical connection from the active padsto the pick-up pads that terminate each signal line, asmall hole was made through the Mylar which wasfilled with silver ink. Each of the etched sheets arebonded directly to the structural carbon filament tubesthat define the inner and outer radii of the chamber.The signal lines are brought outside the gas volumethrough the glue joint or O-ring joint where the struc-tural tube connects to the endplates .
A! insert
C''
Fig. 13 . Intermediate drift chamber wire support.
79
80
Fig. 14. Intermediate drift chamber cathodes .
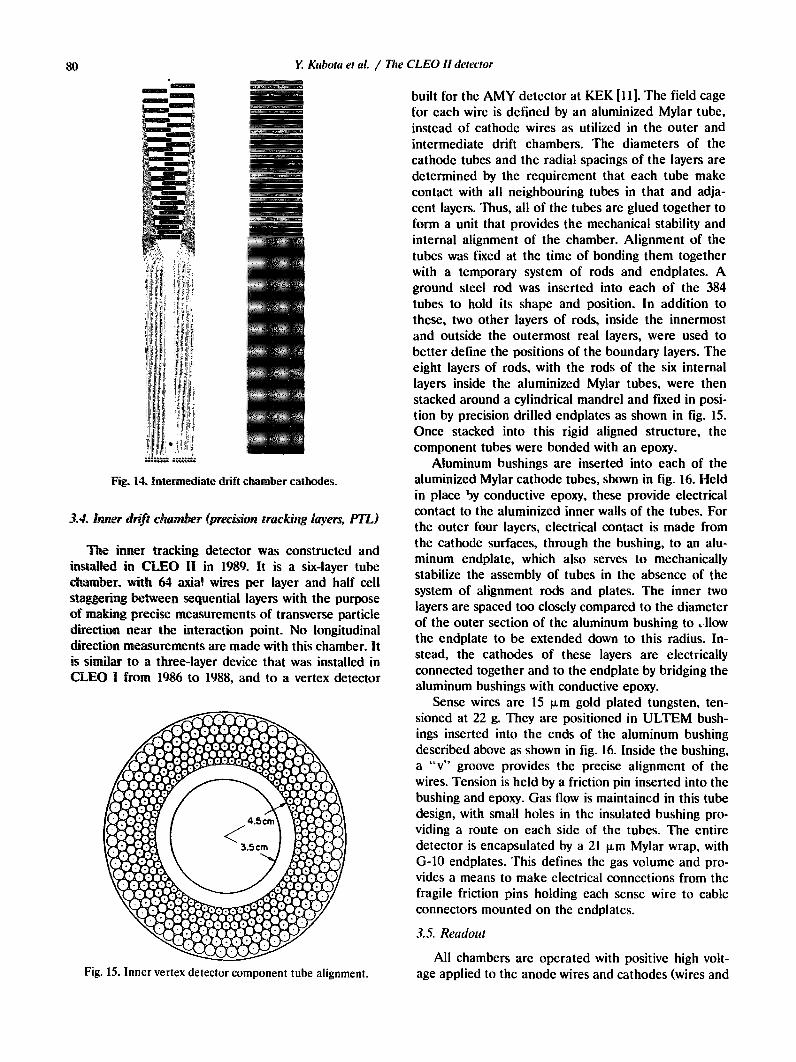
34 Inner drift chamber (precision tracking layers, PTL)
e inner tracking detector was constructed andinstalled in CLEO II in 1989. It is a six-layer tubechamber, with 64 axial wires per layer and half cellstaggering between sequential layers with the purposeof making precise measurements of transverse particledirection near the interaction point. No longitudinaldirection measurements are made with this chamber. Itis similar to a three-layer device that was installed inCLEO I from 1986 to 1988, and to a vertex detector
Fig. 15. Inner vertex detector component tube alignment.
Y. Kubota et al. / The CLEO 11 detector
built for the AMY detector at KEK [11] . The field cagefor each wire is defined by an aluminized Mylar tube,instead of cathode wires as utilized in the outer andintermediate drift chambers . The diameters of thecathode tubes and the radial spacings of the layers aredetermined by the requirement that each tube makecontact with all neighbouring tubes in that and adja-cent layers . Thus, all of the tubes are glued together toform a unit that provides the mechanical stability andinternal alignment of the chamber. Alignment of thetubes was fixed at the time of bonding them togetherwith a temporary system of rods and endplates. Aground steel rod was inserted into each of the 384tubes to hold its shape and position . In addition tothese, two other layers of rods, inside the innermostand outside the outermost real layers, were used tobetter define the positions of the boundary layers. Theeight layers of rods, with the rods of the six internallayers inside the aluminized Mylar tubes, were thenstacked around a cylindrical mandrel and fixed in posi-tion by precision drilled endplates as shown in fig. 15 .Once stacked into this rigid aligned structure, thecomponent tubes were bonded with an epoxy.
Aluminum bushings are inserted into each of thealuminized Mylar cathode tubes, shown in fig. 16 . Heldin place by conductive epoxy, these provide electricalcontact to the aluminized inner walls of the tubes. Forthe outer four layers, electrical contact is made fromthe cathode surfaces, through the bushing, to an alu-minum endplate, which also serves to mechanicallystabilize the assembly of tubes in the absence of thesystem of alignment rods and plates. The inner twolayers are spaced too closely compared to the diameterof the outer section of the aluminum bushing to allowthe endplate to be extended down to this radius . In-stead, the cathodes of these layers are electricallyconnected together and to the endplate by bridging thealuminum bushings with conductive epoxy.
Sense wires are 15 Wm gold plated tungsten, ten-sioned at 22 g. They are positioned in ULTEM bush-ings inserted into the ends of the aluminum bushingdescribed above as shown in fig. 16 . Inside the bushing,a "v" groove provides the precise alignment of thewires. Tension is held by a friction pin inserted into thebushing and epoxy. Gas flow is maintained in this tubedesign, with small holes in the insulated bushing pro-viding a route on each side of the tubes. The entiredetector is encapsulated by a 21 p,m Mylar wrap, withG-10 endplates. This defines the gas volume and pro-vides a means to make electrical connections from thefragile friction pins holding each sense wire to cableconnectors mounted on the endplates.
3.5 . Readout
All chambers are operated with positive high volt-age applied to the anode wires and cathodes (wires and

CESRBEAM PIPE
Y. Kubota et al. / The CLEO i/I detectorAluminized Polycorbonote
Ultem Feedthru
AI Bushing
AI Endplate
r- - Sense
pads) held at ground . Low impedance connection ofthe cathodes to ground is required to operate thechambers in the CESR storage ring environment. Eachanode wire is connected through a blocking capacitorto a preamplifier mounted on the endplate of the outerdrift chamber (see fig. 2). On the outer drift chamber,the blocking capacitors, preamplifier hybrids, and highvoltage distribution resistors are mounted on printedcircuit boards (24 channels per board) that are con-nected directly -z) the anode crimp pins. There are atotal of 515 of these boards on the two ends of thechambP : with odd numbered layers read out on thewest and even numbered layers on the east .
For the intermediate drift chamber, the VD, 95 cmof coaxial cable is used to connect each sense wire to a
I I . i I
c m -$f--+1.
Tubes
`~\IIIIIi``` --------------
4 .41 cmRod
Fig. 16. Inner vertex detector endplate, wires and bushings.
HoldTime
Vref (Stop)
Fig. 17. Schematic of sample-and-hold circuits.
. cmRad
rpl i
81
discrete preamplifier mounted on the outer drift cham-ber endplate . To extract an axial ordinate throughcharge division, the wires are read out on both ends .High voltage distribution and the preamplifier inputblocking capacitors are mounted on the endplate of theVD chamber.
The inner drift chamber, the PTL, is exposed to themost radiation and is the least accessible for repair . Toprovide the capability to turn off individual wires, thesignal for each wire is brought out to a position on theface of the outer drift chamber through a coaxial cable,at high voltage. There, groups of eight channels areterminated with a printed circuit board that providesthe high voltage distribution and anode blocking capac-itors . These connect to discrete component preampli-
Time
-~ 7 73
Charge

1000
500 f-
0 1000 2000 3000 4000âOC `vc.:~E: PT Loyer 2
Fig . 18 . Raw time of hits in the in-termemate drift chamber .The histogram is from data recording with normal trigger.The data points are from channels known to have already
ram
ddown and are currently in process of recovering.
fiers mounted along with those for the intermediatedrift ch
Amplified differential signals are transferred over 8m of twisted pair cable to readout electronics mountedoutside the endcap muon chambers on the steel plates(see fig . 2). e sample-and-hold circuits, which mea-sure time and pulse height (fig . 17), have only single hitcapability but have proven to be adequate in the CESRen:~ironmert . Rampdown of the timing capacitor, "A"in the figure . is started when the input amplified signalcrosses threshold and stopped after 800 ns. In the case
at the LO trigger was satisfied (see trigger section)the timing capacitor rampdowtt is stopped with a gate,input at "R", typically 430 ns after the beam crossing .For specific ionization measurement, charge is inte-grated from the threshold crossing for a time of 900 nsfor the outer (DR) and inner (PTL) drift chambers, butonly 5 ns for the intermediate (VD) detector toimprove the charge division resolution .
There is no active reset in the CLEO II electronics.Reset pulses create noise which may be above thresh-old in the timing circuits, especially of the segmentedcathodes in the outer drift chamber. Presently, thetime between crossings in CESR is 360 ns and themaximum drift time in the outer drift chamber, with amagnetic field of 1 .5 T, is about 400 ns which does not
r .
Y. Kubota et al. / The CLEO 11 detector
leave time to actively reset the electronics. Instead, allchannels are reset passively with an RC time constantof about four beam crossings. This causes some nonlin-earity in the time to charge relation but that is com-pensated for in the calibration . A more serious prob-lem due to the reset method is that the system issensitive to charge deposition from about 30 previouscrossings. Extra hits are a problem in the two innerdetectors which are closer to the beam and have lessazimuthal granularity . Most extra hits can be elimi-nated because the time measurement is not within thelimits placed by the time of the latest beam crossingand the maximum drift time as can be seen from theraw time of hits distribution in fig . 18 . Channels that lieon tracks from the latest crossing, but were rampeddown in a previous crossing are not used until theircapacitor recovers full charge . During this time perioda "stale data" bit is set on .
3.6. Argon-ethane gas system
The CLEO 11 gas system supplies all three trackingchambers (PTL, VD, DR) and the muon detectors witha mixture of 50% argon and 50% ethane(C,H(,). Thefunctions of the system are to prepare the proper gasmixture, to supply an adequate and stable flow to eachsubsystem . to maintain a stable operating pressure, andto provide continuous monitoring of all important flows,pressures, and gas composition . The needs of eachclient detector differ from one another, so the charac-teristics of the individual gas subsystems vary in thefour cases. Table 3 summarizes the gas-related proper-ties of the detectors .
There is one common gas mixer for â!! the detec-tors. The bulk argon and ethane are passed through10-Wm filters, and then fed into separate electronicmass flow controllers (MFCs) set to assure equal flowfor the two gases . The output from the MFCs then joinand accumulate in a 1300 1 buffer tank at 30 PSIG forsubsequent input to the detector systems .
All the subsystems are designed to run just aboveatmospheric pressure, except the VD, which operates
Table 3Operational properties of the four gas subsystems in CLEO 11 . Shown are the volume in litres, operating pressure in atmospheres,the influx of fresh gas, recirculation flow, the leak rate in 1/min, the number of detector volume changes per day, and the oxygenlevel at the detector exhaust
System Volume[1]
Pressure[atm]
Fresh[1/min]
Recirc[1/min]
Leaks[1/min]
Volumesper Day
OZ[ppm]
MU 9000 1.005 2 .1 9 .5 1 .5 1 .5 260DR 5100 1.005 2.4 8 .2 0 .3 2 .3 40VD 60 1.379 0.37 - 0.18 8.9 < 15PTL 8 1.005 0.21 - < 0.01 38.0 < 15

at 1.38 atm (20PSIA) . The pressures are maintainedseparately in each system by a proportional valve (PV)connected in a feedback loop with a pressure trans-ducer (see fig. 19 as an example of one system) . If thepressure dips below (goes above) a preset value, thePV closes (opens) slightly until the desired pressure isattained . The DR and MU systems each have a 300 1in-line buffer tank between the transducer and PV tostabilize the pressure oscillations. The PTL systemdoes not use such a valve; its output gas is venteddirectly through a few mm of oil to the exhaust. Oil-filled bubblers act as emergency pressure relief at theinput and output of the DR, MU, and PTL detectors.These bubblers are set slightly above and below therespective operating pressures. There must be protec-tion against both positive and negative pressures be-cause of the presence of the in-line recirculation pumps(for DR and MU) and a master exhaust line, whichbecause it is vented by a fan to the air, sits belowatmospheric pressure . The VD is protected by mechan-ical relief valves at input and output.
The DR and MU are both large volume detectorsneeding flows of at least one volume change per day.The cost of gas precludes such flows if the all chamberexhaust gas is vented to air. Hence the gas in each ofthese systems is recirculated . Recirculation allows set-ting the flow through the detectors independently ofthe influx of fresh gas, but also requires removing theoxygen that diffuses into the system through leaks.Nitrogen . of course, also accumulates to a limitedextent but does not adversely affect the ionizationprocess or chamber lifetime as does a high concentra-tion of oxygen . Fig. 19 shows a schematic of the DRrecirculation system . Flow around the recirculation loop
Y. Kubota et al. / The CLEO 11 detector
Fig . 19. DR gas recirculation system .
is maintained by an MFC. Just in front of the MFC is a1300 I buffer tank at 6 PSIG. That pressure is set by amechanical backpressure regulator, which, if the pres-sure exceeds the setting, sends excess gas out of theloop. Fresh gas is sent into the loop at 2.41/min, muchsmaller than the recirculation flow of 8.2 1/min. Therecirculation pump is located just after the PV at thechamber exhaust, and is followed by the purifier.
The gas purifier removes oxygen, large molecules,and particulates in the stream. A small flow of hydro-gen is injected into the gas just upstream of an in-linepalladium catalytic converter; the hydrogen and oxygenin the passive catalyst combine to form water. The gasthen passes through molecular sieve material, com-posed of a synthetic crystalline alumina-silicate with itswaters of hydration removed, which adsorbs all watervapour passing through up to 25% of its weight. Whenthe sieve becomes saturated it can be recycled off-lineby baking for a few hours at 300°C while flushing withargon. After the sieve. a 10-Lm in-line filter removesany remaining dust in the stream .
Oxygen levels are monitored at the output of eachdetector, as summarized in table 3. In addition . there isan oxygen probe just after the palladium catalyst in thepurifier. Flow of hydrogen into the purifier is adjustedto keep this oxygen level small (< 25 ppm).
Gas enters the DR volume through eight holes inthe endplates, four on each end of the chamber in itsupper half near the outer radius . Gas exits the cham-ber through eight holes in the lower half of the cham-ber, located symmetrically with the entrance holes.
Analogously, the MU gas system recirculates andpurifies its own flow. The "fresh" gas at the MU inputis actually the exhaust from the DR loop ; the exhaust
83

84
from the MU loop is vented to air. A total of 9.4 1/mflows from the 10001 buffer tank which is regulated at5 PSIG . The flow is then distributed to ten parallelstreams, one for each barrel octant and one for eachendcap. Each of those ten streams is again distributedin parallel to about ten routes, one per layer in theoctant/endcap ; counters in each layer are connectedin series . Each such parallel stream is protected againstover- and under-pressure with bubblers to air. Eachoctant/endcap is periodically checked for leaks byswitching in-line a pair of mass flow transducers andcomparing measured input and output flows .
The gas composition is periodically monitored at anumber of points by a gas analyzer which measures thegas density (relative to argon) via its thermal conductiv-ity . The relative flows in the gas mixer are calibrated bycomparing the mixed gas to a "standard" referencegas, commercially prepared to be (50.0 ± 0.1)% ethanewith the balance argon . The ethane fraction is main-tained to a stability of ± 0.1%.
Part of the input gas to the VD and PTL systems ispassed over a water reservoir prior to reaching thechamber (20% of the flow for the VD and 10% for thePTL). Presence of water vapour in drift chamber gashas been shown to have palliative effects on wirecurrents and chamber lifetimes in a high radiationenvironment [12] .
3.7. Momentum and angular resolution
Momentum resolution can be parameterized to havetwo components: one from the error in measurementof the curvature of a track due to individual measure-ment errors in drift distances ; the other from thedistortion of the track from a true helix due to multiplescattering . Thus, we expect to resolve momentum (per-pendicular to the magnetic field) according to therelation:
2 53sp t ~ 2),
Opl/pt)= (
BL2 -
~ 0.054~
2vFn BL
where s (in metres) is the accuracy of individual posi-tion measurements in the drift chambers, pt is thetransverse momentum in GeV/c, B is the magneticfield strength in tesla, L is the length in metres overwhich measurements are made, n is the number ofposition measurements and t is the thickness of ob-structing material in the chambers in radiation lengths .The position measurement resolution, s, for the outerdrift chamber is shown in fig . 20 . Close to the cell edge(distance from sense wire = 1.0) the resolution is de-graded because the electric field is weak and the driftpath is distorted in the 1 .5 T magnetic field . Alongwith the poor resolution, there is a loss of efficiencyclose to the cell edge, at a 1 .5 T field, so that the
Y. Kubota et al. / TheCLEO !I detector
N 250.0200
NO
300.
6 100.0E
50.
0.1--0.00
a020 0.04 0.06 0.08 I.00Normalized Distance from Sense Wire
Fig. 20 . Position measurement resolution vs position withinthe cell of the outer drift chamber . 0 .0 is at the sense wire and1.00 is at the edge of the cell ( - 7 mm from the sense wire).
average efficiency in the drift cell is only 85%. Nearthe wire, the resolution is limited by the spacing be-tween primary ions in the chamber gas . The resolutionobserved near the wire is poorer than expected indicat-ing the discriminator threshold is too high to be sensi-tive to single ions . These thresholds have not beenlowered because to do so would increase the noiserate . In the central part of the cell, the resolution isrelatively constant at 100 gm. In all regions of the cellthe resolution is actually somewhat worse than is shownin fig . 20 because there are non-Gaussian tails in thedistribution of measurement errors . This degrades theexpected momentum resolution either by increasingthe position measurement resolution, s, used in theequation above or, reducing the number of positionmeasurements, n, by not using hits which disagree withthe fit.
The scattering material in the central detector islisted in table 2 . In the active region the total materialhas a thickness of 0.0247 radiation lengths . Note that asubstantial portion of this material, 0.0108 radiationlengths, lies at the interface between the intermediateand outer drift chambers. A kink is allowed at theradius of this interface in fitting the tracks to minimizethe effect of the concentration of material . Using theformula given above with B = 1.5 T, L = 0.85 m, n =49, s = 150 lim, and t = 0.025 r .l . the expected resolu-tion becomes
( SPt/Pt)2 = «).()011 Pt ) 2 + (0.0067)2,
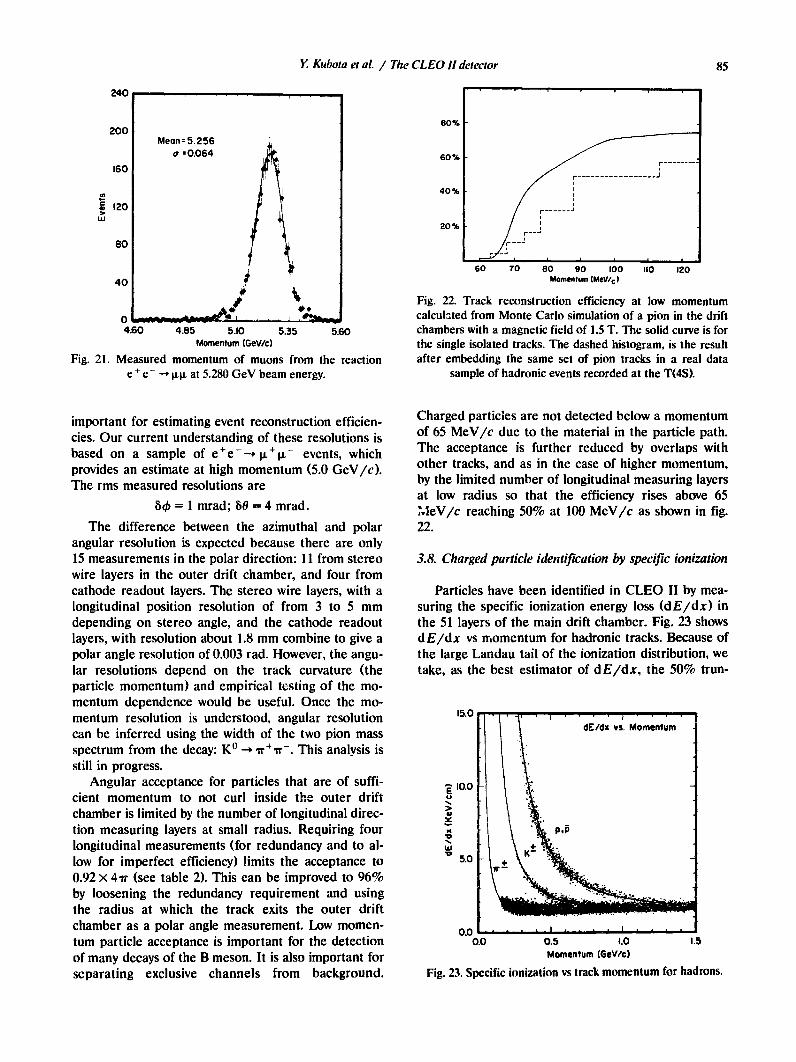
which leads to 8pt = 47 MeV/c at pt = 5.280 GeV/c.This is slightly lower than the measured resolution of64 MeV/c shown in fig . 21 .
Understandiig }he resolution of the azimuthal andpolar angle calculated from the reconstructed track is
80
40
04.60 4.85 5.10 5.35 5.60
Momentum (GeV/c)Fig. 21 . Measured momentum of muons from the reaction
e+e - - WW at 5.280 GeV beam energy.
important for estimating event reconstruction efficien-cies . Our current understanding of these resolutions isbased on a sample of e+ e- -- W + W - events, whichprovides an estimate at high momentum (5.0 GeV/c).The rms measured resolutions are
80 = 1 mrod; 60 = 4 mrod.The difference between the azimuthal and polar
angular resolution is expected because there are only15 measurements in the polar direction : 11 from stereowire layers in the outer drift chamber, and four fromcathode readout layers. The stereo wire layers, with alongitudinal position resolution of from 3 to 5 mmdepending on stereo angle, and the cathode readoutlayers, with resolution about 1.8 mm combine to give apolar angle resolution of 0.003 rod . However, the angu-lar resolutions depend on the track curvature (theparticle momentum) and empirical testing of the mo-mentum dependence would be useful . Once the mo-mentum resolution is understood, angular resolutioncan be inferred using the width of the two pion massspectrum from the decay : K° - zr' ,rr -. This analysis isstill in progress.
Angular acceptance for particles that are of suffi-cient momentum to not curl inside the outer driftchamber is limited by the number of longitudinal direc-tion measuring layers at small radius. Requiring fourlongitudinal measurements (for redundancy and to al-low for imperfect efficiency) limits the acceptance to0.92 x 4r. (see table 2) . This can be improved to 96%by loosening the redundancy requirement and usingthe radius at which the track exits the outer driftchamber as a polar angle measurement . Low momen-tum particle acceptance is important for the detectionof many decays of the B meson. It is also important forseparating exclusive channels from background .
Y. Kubota et al. / The CLEO 11detector
Fig. 22 . Track reconstruction efficiency at low momentumcalculated from Monte Carlo simulation of a pion in the driftchambers with a magnetic field of 1 .5 T. The solid curve is forthe single isolated tracks. The dashed histogram, is the resultafter embedding the same set of pion tracks in a real data
sample of hadronic events recorded at the TOS).
Charged particles are not detected below a momentumof 65 MeV/c due to the material in the particle path .The acceptance is further reduced by overlaps withother tracks, and as in the case of higher momentum,by the limited number of longitudinal measuring layersat low radius so that the efficiency rises above 651eV/c reaching 50% at 100 MeV/c as shown in fig .
22.
3.8. Charged particle identification by specific ionization
Particles have been identified in CLEO II by mea-suring the specific ionization energy loss (dE/dx) inthe 51 layers of the main drift chamber . Fig . 23 showsd E/dx vs momentum for hadronic tracks. Because ofthe large Landau tail of the ionization distribution, wetake, as the best estimator of dE/dx, the 50% trun-
60 70 80 90 100 110 120Momentum (MeV/c )
Momentum (GeV/0
85
Fig. 23. Specific ionization vs track momentum for hadrons.
240
80%200
Mean=5.256v =0.064 60%
160-_________________J
40% ii it
d 120i
W20% i
i

cated mean [131. In order to obtain optimum resolu-tion, the raw data must be corrected for the followingeffects.
a) Dip angle saturation. When a track is producedin a direction that is perpendicular to the sense wires,there is th;: highest density of ionization along the zdirection. This causes electric shielding which effec-tively reduces the gain (thus the collected charge) foreach hit on that track. Therefore the measured chargedepends on the polar angle of the track, with thelargest effect at angles close to 90°.
b) Drift distance . The amount of charge reachingthe wire within the gate time depends on the distancethe electrons have to drift from the track to the wire .This depends on the electric field shape within the cell,and in part on the magnetic field strength through theE xB effect .
c) Entrance angle. The drift distance distributiondepends on the magnitude of the entrance angle of thetrack, in the (r, -0) plane, into the cell. We have foundthere is also a dependence on the sign of the entranceangle due to the Ex B effect .
d) Axial-stereo layer. Again, due to different elec-tric field shapes of axial and stereo cells, the driftdistance distribution depends on the type of layer.
All of these dependencies have been measured anda five-dimensional, 1600 bin map has been producedwhich is used to correct the charge associated witheach hit on a track . For a track with 40 or more goodhits, a resolution of 6.2%G has been achieved for Bhabhatracks, while for minimum ionizing pions, we get 7.1% .
4. The time-of-flight system
4.1 . Introduction
The time-of-flight (TOF) system in the CLEO IIDetector is used as a primary trigger for data recording(the trigger system is described in section 7), and as atool for particle identification. The momentum of acharged particle is measured from the track curvaturein the drift chamber. Measuring the "time" to reachthe TOF scintillation counter allows constraint on theparticle mass which enables particle identification .
Y. Kubota et al. / TheCLEO 11 detector
There are two major parts of the TOF system, thebarrel and the endcap. The barrel counters cover thepolar angles from 36° to 144°, while the endcap coun-ters extend from about 15° to 36° on the west side andfrom 144° to 165° on the east . The solid angle sub-tended by the barrel counters is about 81% of 4,rr andthat by the endcap counters is 16%. Below, we presentdescriptions of the barrel and endcap counters andsummarize the current status of the measured timeresolutions .
4.2 Barrel tune-of-flight counters
There are 64 barrel counters located immediatelyoutside of the central drift chamber and fastened bystraps to the inside surface of the crystal container .Fig. 24 shows a drawing of a barrel counter. Thethickness of 5 cm was chosen to maximize the thicknesswithout harming the performance of the cesium iodidecalorimeter. Bicron BC-408 scintillator was chosen forthe fast decay time (2 .1 ns) and long attenuation length(2 .5 m) . At each end of the scintillator there is at-tached a light pipe made of UVT Lucite with a 17°bend . The light pipe was formed with the proper angleby using heat lamps to warm the Lucite and bending thelight pipe in a precisely constructed jig . The scintillatorand the light pipes are glued together with HE 17017epoxy obtained from Hartel Plastics. This epoxy formsa very strong bond with good light transmission . At thephototube end of the light pipe, there is a short UVTLucite transition piece from the end of the light pipe tothe cylindrical photomultiplier tube. The joints be-tween the light pipe and the transition piece and thephotomultiplier are made with Hexel Epolite 5313 .This epoxy was chosen for its optical quality, constantproperties over long times, and strong joint which canbe broken with a sharp knife to allow replacement ofthe photomultiplier tube . The counters were wrappedfirst with aluminum foil and subsequently with blacktape .
The photomultiplier tubes are a sliôht modificationof the Àmperex 2020 . The photocathode is somewhatdifferent with a higher quantum efficiency . The accel-erator electrode is not connected internally to dynode5, but is connected to a spare pin so that its voltage can
279.4 cm
Fig. 24. Barrel time-of-flight counter.
10 cmi-
189.8 cm --e~

be adjusted . Tests showed that the best time resolutionis obtained with the accelerator grid connected todynode 7. These modifications increase the dark cur-rent of the photomultiplier tube slightly . The photo-tube is wrapped in aluminum foil which is at the samepotential as the photocathode . The foil extends an inchbeyor, ~1 the photocathode onto the transition piece andis electrically -nsulated from the aluminum foil aroundthe light pipe-scintillator assembly with a piece ofwhite paper.
For mounting the counters, three bands were in-stalled onto the inner surface of the crystal containerwith sufficient thickness (0.546 cm) to locate the coun-ters beyond the rivet heads that are on the surface.The central band is made of G10 to minimize theamount of material in front of the barrel calorimeter.The two bands at the ends are made of aluminum. Thecounters are fastened to the end bands with flexiblemetal ties and to the middle band with plastic ties.
Fig. 25 shows a diagram of the photomultiplier tubebase . The base is a modification of the design sug-gested by Amperex and uses a voltage of approximately500 V between the photocathode and the first dynodeto improve time resolution . The base circuit is con-structed on a flexible PC board made of kevlar anddraws 0.68 mA at 3000 V. In operation the averagephototube voltage is 2200 V.
4.3. Endcap time-of-flight counters
A drawing of the CLEO lI endcap TOF counters isshown in fig . 26a. There are 28 wedge-shaped countersmounted on each endcap calorimeter. Each counter isa trapezoidal sector of 4.8 cm thick Bicron BC-408scintillator, which is the same material as that used forconstructing the barrel TOF counters . The scintillatorcovers the radial range from 25 .9 cm to 89.0 cm fromthe beamline at a longitudinal distance of 117.5 cmfrom the centre of the interaction region . The narrowend of the scintillator is shaped into a 45° prism, thusavoiding a glue joint that would be needed for aseparate prism piece. The scintillator design is shownin fig . 26b. A Hamamatsu R2490 photomultiplier tubeis glued directly to the square face of the prism withthe axis of the tube at right angles to the length of thecounter. There is no light guide between the tube andthe scintillator so that the photomultiplier operatesinside a 1 .5 T magnetic field, with the tube axis parallelto the field . There are 28 counters, mounted in a circleon the endcap calorimeters as shown in fig . 27. At thephototube end, the counters are supported by 3 mmthick aluminum fins inserted between each counterand attached to the fileï wâll of the endcap calorime-ter . A 1 .5 mm thick aluminum cylinder of radius 25.4cm is also suspended from the inner wall to protect thephotomultipliers. The photomultipliers are supported
Y. Kubota et al. / The CLEO Udetector
SHV iK
-2.35KV
NOTE: UNLESSOTHERWISE SPECIFIEDRESISTORS ARE Ii2W.
counters.
87
Fig. 25. Photomultiplier tube base used for barrel time-of-flight
by the glue joint at the prism face with industrialstrength HE17017 epoxy from Hartel Plastics .
The Hamamatsu R2490 is a 5.1 cm diameter, head-on type photomultiplier tube specially designed forhigh magnetic field environments . Supplied by themanufacturer with a resistor-divider base assembly,called H2520, it is rugged and compact with a totallength of 9 cm. The circuit diagram of the base assem-bly is shown in fig . 28. The design of the tube is basedon proximity mesh, transmissive dynodes with sixteenstages and can operate in magnetic fields of severaltesla . With respect to other operating characteristics,the tube is similar to the conventional Amperex XP2020used in the barrel counter. It has a borosilicate win-dow, with bialkali cathode and dynode secondary emit-ting surface . The cathode quantum efficiency at 390nm is about 20%, while the anode pulse risetime is 2.1ns . The magnetic field characteristics of 25 Hamamatsu

25.89 cm
Y. Kubota et al. / The CLEO 11 detector
BEAM LINE
4.76 cm
Fig. 26. (a) Side view of an endcap TOF counter mounted on the endcap calorimeter . (b) Design of the endcap TOF scintillator.
82490 tubes were tested by placing them in an experi-mental test setup with a 1 .5 T magnetic field parallel totle tube axis . We found the gain reduction varies from70 in the best case to about 250 in the worst case, foran operating voltage of 2400 V, which is typically about200 V above the plateau shoulder. In the same seriesof tests, we found no evidence of timing resolutiondegradation due to the magnetic field . The gain reduc-tion is compensated by a fast, high gain preamplifier atthe photomultiplier tube output . Its circuit diagram isshown in fig. 29 and is based on the Signetics widebandhigh frequency amplifier NE5205 . The amplifier gainused in laboratory tests was 50 and saturated at anoutput of about 5 V. Inside CLEO II, the photomulti-plier outputs were fed by RG58/U coaxial cables toamplifier cards mounted on the outside face of thesolenoidal pole tips and the amplifier gains were re-duced to about 15. All 56 endcap counters were testedin a laboratory bench setup at an operating voltage of2400 V with the preamplifier . The r.m.s . timing resolu-tion varied from 120 ps in the best case to 250 ps in theworst case, the average value being about 170 ps.
4.4. Readout electronics
The data acquisition cards for the time-of-flightsystem were designed and constructed at Harvard . Foreach photomultiplier signal there are two time to pulseheight converters and a circuit for recording the inte-grated charge in the pulse . For each of the time
channels there is a discriminator which determines thepoint on the input pulse at which the time measure-ment is started . The stop signal for the time measure-ment is derived from the rf frequency of CESR and is
Fig . 27 . Rear view of the east endcap TOF counters on theface of the Csl poletip calorimeter, and the relative locationof the barrel counters. The numbers shown are the phototubeaddresses. The 64 barrel counters each have two phototubes ;the tubes on the east side are odd integer ; those on the westside of the same counter have an address number one larger.
West endcap phototubes are addressed 157 through 184.

MNV IOK1/2W
Fig. 28. Circuit diagram of the base assembly for the Hamamatsu R2490 photomultiplier tube . Unless otherwise specified, allcapacitors are in VF, and the resistors are 470 kit, 1 W.
DY2 DY4 DY6
Fig. 29 . Circuit diagram of the fast preamplifier.
directly related to the time at which the beams collide.(The CLEO 11 timing system, which provides the stopsignal_ is described to section 7.) The two discriminatorsare set to separate threshold levels so a measurementof the two times can be used to correct for the risetime of the photomultiplier pulse. There is no reset forthe primary storage capacitor and each channel recov-
800
700
600
N 500I-
400W
300
200
100
Y. Kubota et al. / The CLEO 11 detector
-1 .00 -0.50 0.00 0.50 1.00T
-T
For Electron (nsec)MEAS . EXPECTED
DY6 DYIO DY12 DY14 DY16
600
500
400rn
W 300W
200
100
4.5. Calibrating the TOF system
ONC
SD-OEV5012
ers with a time constant of 2 Ws. The discrimatorthresholds are 40 and 80 mV, and phototube highvoltages are set so that a minimum ionizing particleproduces a 400 mV pulse. Upon receipt of a suitabletrigger, the analog signals of time and pulse heightmeasurements are stored using sample and hold cir-cuitry and read out by the crate controllers. A pro-grammed pulse generator is used to calibrate the elec-tronic circuits. The signals are recorded as a functionof the delay of the pulse and the data are analyzed todetermine the pedestal and time-(TDC counts) rela-tion for each electronic channel.
Bhabha events are used to calibrate the system .Events are selected for which there is only one hit in acounter and the momentum and trajectory are used tocalculate the time-of-flight. Let T.;j represent the timecalculated from TDC counts for phototube i for eventj. The calculation is based on electronic calibrationconstants. The time measured by a phototube is com-
0-1.6 -0.8 0.0 0.8 1.6
T
T
For Pion (nsec)MEAS . EXPECTED
Fig. 30 . Time resolution obtained with the barrel time-of-flight counters: (a) for Bhabbhs, and (b) for pions in hadronic events.
89
500W .04 .0276 .3 kV 400 400
55000 V V4V -
ioëV
V 50 œ 100lye 1/V8 lye rT
I.K DYI DY3 Nil DY5 DY7 DY9 DYII DY13 DYI5 A
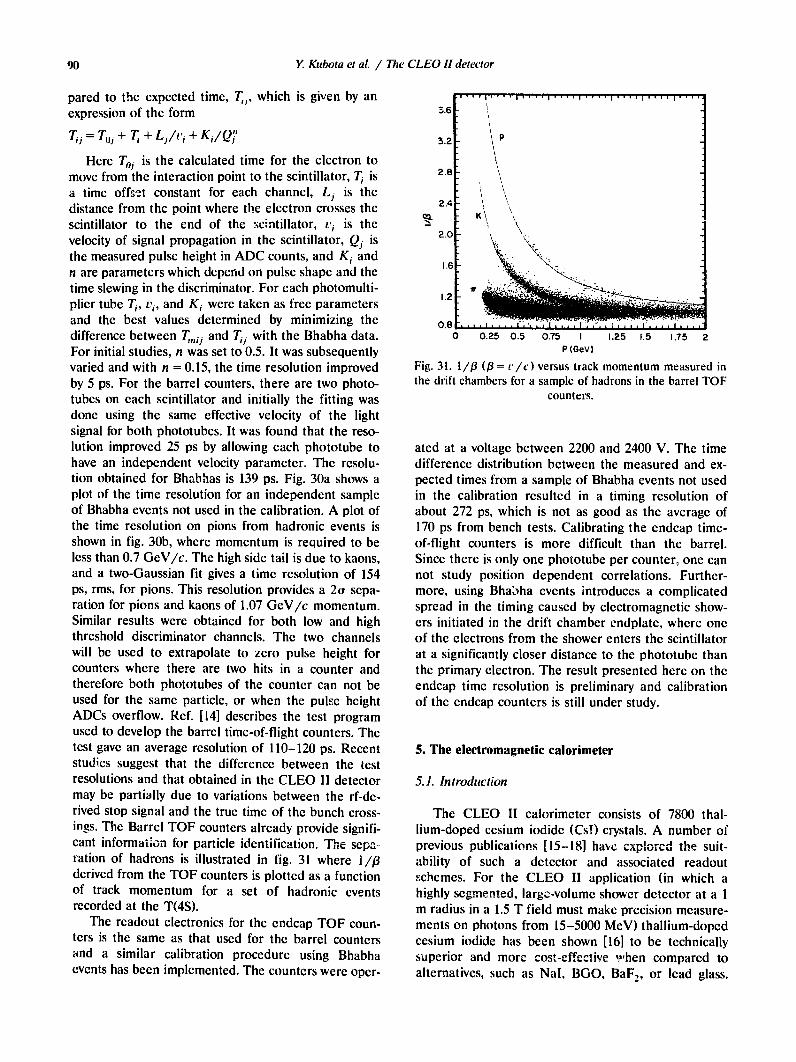
90
pared to the expected time, T,, which is given by anexpression of the form
Tj =T~j+T;+Lj/c,;+K;/Qj'
Here Toj is the calculated time for the electron tomove from the interaction point to the scintillator, T isa time off,~t constant for each channel, Lj is thedistance from the point where the electron crosses thescintillator to the end of the scintillator, L'; is thevelocity of signal propagation in the scintillator, Qj isthe measured pulse height in ADC counts, and K; andn are parameters which depend on pulse shape and thetime slewing in the discriminator. For each photomulti-plier tube T, v;, and K; were taken as free parametersand the best values determined by minimizing thedifference between T�,;j and Tj with the Bhabha data .For initial studies, n was set to 0.5 . It was subsequentlyvaried and with n = 0.15, the time resolution improvedby 5 ps. For the barrel counters, there are two photo-tubes on each scintillator and initially the fitting wasdone using the same effective velocity of the lightsignal for both phototubes . It was found that the reso-lution improved 25 ps by allowing each phototube tohave an independent velocity parameter . The resolu-tion obtained for Bhabtias is 139 ps. Fig . 30a shows aplot of the time resolution for an independent sampleof Bhabha events not used in the calibration . A plot ofthe time resolution on pions from hadronic events isshown in fig . 30b, where momentum is required to beless than 0.7 GeV/c. The high side tail is due to kaons,and a two-Gaussian fit gives a time resolution of 154ps, rms, for pions. This resolution provides a 2Q sepa-ration for pions and kaons of 1.07 GeV/c momentum .Similar results were obtained for both low and highthreshold discriminator channels . The two channelswill be used to extrapolate to zero pulse height forcounters where there are two hits in a counter andtherefore both phototubes of the counter can not beused for the same particle, or when the pulse heightADCs overflow . Ref. [141 describes the test programused to develop the barrel time-of-flight counters . Thetest gave an average resolution of 110-120 ps. Recentstudies suggest that the difference between the testresolutions and that obtained in the CLEO II detectormay be partially due to variations between the rf-de-rived stop signal and the true time of the bunch cross-ings . The Barrel TOF counters already provide signifi-cant information for particle identification . The sep----ration of hadrons is illustrated in fig . 31 where 1/13derived from the TOF counters is plotted as a functionof track momentum for a set of hadronic eventsrecorded at the T(4S).
The readout electronics for the endcap TOF coun-ters is the same as that used for the barrel countersand a similar calibration procedure using Bhabhaevents has been implemented . The counters were oper-
Y. Kubota et al. / The CLEO 11 detector
5.1 . Introduction
0 0.25 0.5 0.75 1 1 .25 1 .5 1 .75 2P(GeV)
Fig . 31 . 1/,6 (13 = v 1c) versus track momentum measured inthe drift chambers for a sample of hadrons in the barrel TOF
counters .
ated at a voltage between 2200 and 2400 V. The timedifference distribution between the measured and ex-pected times from a sample of Bhabha events not usedin the calibration resulted in a timing resolution ofabout 272 ps, which is not as good as the average of170 ps from bench tests . Calibrating the endcap time-of-flight counters is more difficult than the barrel .Since there is only one phototube per counter, one cannot study position dependent correlations . Further-more, using Bha,)ha events introduces a complicatedspread in the timing caused by electromagnetic show-ers initiated in the drift chamber endplate, where oneof the electrons from the shower enters the scintillatorat a significantly closer distance to the phototube thanthe primary electron . The result presented here on theendcap time resolution is preliminary and calibrationof the endcap counters is still under study .
5 . The electromagnetic calorimeter
The CLEO II calorimeter consists of 7800 thal-lium-doped cesium iodide (Cs!) crystals . A number ofprevious publications [15-18] have cxp:orcd the suit-ability of such a detector and associated readoutschemes. For the CLEO II application (in which ahighly segmented, large-volume shower detector at a 1m radius in a 1 .5 T field must make precision measure-ments on photons from 15-5000 MeV) thallium-dopedcesium iodide has been shown [161 to be technicallysuperior and more cost--effective v,hen compared toalternatives, such as Nal, BGO, BaF,, or lead glass .

The properties [19] of Cs1 include high light output, anemission spectrum well-matched to photodiodes, lowhygroscopicity, plasticity and resistance to cracking,ease of machining, high density (4.51 g/cm3), shortradiation length (1 .83 cm) and Molière radius (3.8 cm),and good thermal stability near room temperature. The900 ns decay time is relatively long but can be accom-modated adequately for triggering and readout.
5.2. Crystal dimensions, mounting and support
The choice of CsI block size [16] was dictated by theneed to attain adequate energy and position resolutionwhile keeping cost of the blocks, mounting, and read-out at a reasonable level . Longer crystals prevent leak-age at high energies where fluctuations in such leakagedominates the resolution, but are more expensive andhave poorer light transmission which adversely affectsresolution at low energy . Narrow lateral dimensionsgive optimal position resolution but increase the num-ber of channels as the inverse square, and so have anenormous impact on cost ; small crystals also raise thenumber that must be summed to compute showerenergy, degrading the resolution due to increased elec-tronic noise. The chosen dimensions, approximately 5cm (2.7 H.) square by 30 cm (16 H.) long, achieve aneconomical and technical compromise, resulting in a
Y. Kubota et al. / TheCLEO 11 detector
Table 4Barrel and endcap crystal dimensions [cm] as defined in fig . 32 . A-F have a tolerance of ±0.01, H has a tolerance of ±0.10
91
system of 7800 crystals. CLEO 11 has a calorimeterwith angular segmentation. finer by an order of magni-tude than the previous generation of crystal detectors(Crystal Ball [20] and CUSB [211) operating at e + estorage rings, and comparable to the 1.3 detector [22].
The calorimeter consists of the barrel and two end-caps, which together cover 95% of the solid angle. Thebarrel coverage starts at a polar angle of 32°, overlap-ping slightly with the endcap which ends at 36°. Thebarrel calorimeter contains 6144 blocks arranged in anearly vertex-pointing geometry of 48 z-rows with 128azimuthal segments in each . The 256 blocks in eachpair of symmetrically located z-rows have identicallytapered shapes . The dimensions of the 24 differentshapes are listed in table 4 and refer to the quantitiesshown in fig . 32 . The dimensions were chosen so thatthe gaps between crystals point a few centimetres away[23] from the nominal interaction point, preventingsmall losses in solid angle coverage by the full 16 r.l .depth of CsI. Photons originating at the interactionpoint strike barrel crystal faces at nearly normal inci-dence.
The barrel crystal holder is designed to bear theconsiderable load of the CsI blocks (27 x 103 kg), toallow for mounting and routing of the readout, cooling,and calibration systems, and to provide a sealed, mois-ture-free environment. Material in front of and be-
Row A B C D E F H
1 5.25 6.59 4.98 5.69 7.13 5.41 15 .02 5.22 5.92 4.98 6.05 6.83 5.78 27.03 5.20 5.71 4.98 6.16 6.72 5.91 30.04 5.19 5.65 4.98 6.119 6.69 5.94 30.05 5.18 5.59 4.98 6.22 6.66 5.98 30.06 5.18 5.53 4.98 6.25 6.63 6.02 30.07 5.17 5.47 4.98 6.28 6.60 6.06 30 .08 5.16 5.41 4.98 6.30 6.57 6.09 30.09 5.15 5.35 4.98 6.33 6.54 6.13 30 .0
10 5.14 5.30 4.98 6.35 6.51 6.17 30 .011 5.13 5.25 4.98 6.38 6.48 6.20 30.012 5.12 5.20 4.98 6.40 6.45 6.23 30.013 5.11 5.16 4.98 6.42 6.43 6.27 30.014 5.10 5.12 4.98 6.43 6.41 6.29 30.015 5.09 5.08 4.98 6.45 6.39 6.32 30.016 5.07 5 .04 4.98 6.46 6.37 6.35 30.017 5.06 5 .01 4.98 6.47 6.35 6.37 30.018 5.05 4.98 4.98 6.48 6.33 6.39 30.019 5.04 4.96 4.98 6.48 6.32 6.41 30 .020 5.03 4.94 4.98 6.48 6.32 6.43 30.021 5.02 4.93 4.98 6.48 6.32 6.44 30 .022 5.01 4.92 4.98 6.48 6.31 6.45 30 .023 5.00 4.92 4.98 6.47 6.31 6.45 30.024 4.99 5.02 4.98 6.46 5.74 6.46 30.0Endcap 5.00 5.00 5.00 5.00 5.00 5.00 30.0

92
Fig. 32. Definition of the dimensional parameters determiningcrystal size and shape .
tween crystals, which degrades energy resolution, iskept to a minimum . The holder, consisting entirely ofaluminum components, is shown in fig . 33 . It hascylindrical inner and outer walls, capped by a coverannulus at each end, and surrounds an internal latticeof 64 longitudinal fins (separating every other crystal inazimuth) and 13 lateral rows of fins (separating everyfourth row in z) . The fins provide the necessary rigid-ity and separate the CsI blocks into snugly packed2 x 4-block pockets. The holder is 3.37 m long and itsinner wall has a radius of 1.024 m and a thickness of1.59 mm; the fins are 0.51 mm thick . An outer skin ofradius 142 .5 cm consisting of eight panels, each 6.35
Fig . 33 . A portion of the barrel crystal holder .
Y Kubota et al. / The CLEO üdetector
91 44-
e
Fig . 34 . A quadrant of an endcap crystal holder showinglocation of the endcap crystals .
mm thick and covering the full barrel length, closes thestructure . The barrel holder was built on a steel innermandrel that provided strength while loading the crys-tals into the pockets and transporting the completedunit . The mandrel and barrel holder were rolled intoplace on a central rail and the whole unit loweredslightly to rest on the inner wall of the cryostat of thesuperconducting coil . The mandrel was then reducedin diameter and rolled back out .
Each endcap holds 828 crystals stacked inside acylindrical holder, as shown in fig . 34, so that themaximal amount of area near the outer radius is cov-ered by CsI . All endcap blocks are rectangular (seetable 4) . The arrangement of crystals in each endcap isfour-fold symmetric; the same pattern of 207 crystals isrepeated, rotated by 90° each time . The aluminumholder has inner and outer cylindrical walls capped bycircular cover plates. The inner and outer wall radii(thicknesses) are 0.321 m (6.35 mm) and 0.914 m (9.53mm), respectively, and the front cover plate is 6.35 mmthick. Each front plate is located 1 .248 m from theinteraction point .
Preamplifier boards are mounted directly behindthe crystals. Cables, light fibres, and cooling tubes passthrough the end covers in the barrel and near the outerradius of the endcaps. All joints, rivets, and openingsin the crystal holders were covered with sealant ; nitro-gen flows through each holder to keep the CsI dry . Theon-line computer routinely and automatically checkstemperature and humidity monitoring stations (eight inthe barrel and three in each endcap) to verify that thecooling and drying systems are working properly . Thetemperature is maintained at (28 ± 2)°C, and the hu-midity at less than 1%. The barrel and endcap holderdimensions allow for a tolerance of ±0.1 mm on thecrystal lateral dimensions, and for a total of 0.13 mm ofwrapping around each block .
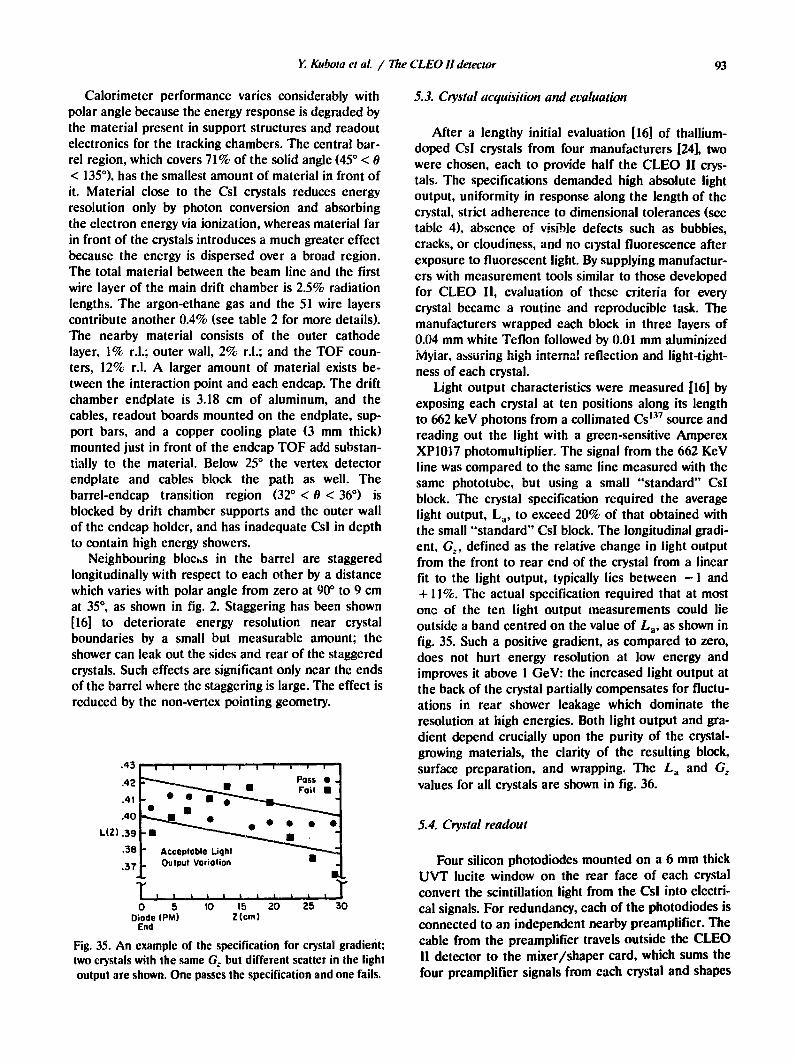
Calorimeter performance varies considerably withpolar angle because the energy response is degraded bythe material present in support structures and readoutelectronics for the tracking chambers. The central bar-rel region, which covers 71% of the solid angle (45° < 9< 135°), has the smallest amount of material in front ofit. Material close to the CsI crystals reduces energyresolution only by photon conversion and absorbingthe electron energy via ionization, whereas material farin front of the crystals introduces a much greater effectbecause the energy is dispersed over a broad region .The total material between the beam line and the firstwire layer of the main drift chamber is 2.5% radiationlengths . The argon-ethane gas and the 51 wire layerscontribute another 0.4% (see table 2 for more details) .The nearby material consists of the outer cathodelayer, 1% r.l. ; outer wall, 2% r.l . ; and the TOF coun-ters, 12% r.l . A larger amount of material exists be-tween the interaction point and each endcap . The driftchamber endplate is 3.18 cm of aluminum, and thecables, readout boards mounted on the endplate, sup-port bars, and a copper cooling plate (3 mm thick)mounted just in front of the endcap TOF add substan-tially to the material . Below 25° the vertex detectorendplate and cables block the path as well . Thebarrel-endcap transition region (32° < 6 < 36°) isblocked by drift chamber supports and the outer wallof the endcap holder, and has inadequate Csl in depthto contain high energy showers.
Neighbouring blocks in the barrel are staggeredlongitudinally with respect to each other by a distancewhich varies with polar angle from zero at 90° to 9 cmat 35°, as shown in fig . 2. Staggering has been shown[16] to deteriorate energy resolution near crystalboundaries by a small but measurable amount ; theshower can leak out the sides and rear of the staggeredcrystals . Such effects are significant only near the endsof the barrel where the staggering is large. The effect isreduced by the non-vertex pointing geometry .
0 5 10 15 20 25 30Diode (PM)
Z (cm)End
Fig . 35 . An example of the specification for crystal gradient,two crystals with the same G~ but different scatter in the lightoutput are shown. One passes the specification and one fails .
Y. Kubota et al. / TheCLEO 11 detector
5.3. Crystal acquisition and evaluation
5.4. Crystal readout
93
After a lengthy initial evaluation [161 of thallium-doped CsI crystals from four manufacturers [241, twowere chosen, each to provide half the CLEO II crys-tals. The specifications demanded high absolute lightoutput, uniformity in response along the length of thecrystal, strict adherence to dimensional tolerances (seetable 4), absence of visible defects such as bubbles,cracks, or cloudiness, and no crystal fluorescence afterexposure to fluorescent light . By supplying manufactur-ers with measurement tools similar to those developedfor CLEO 11, evaluation of these criteria for everycrystal became a routine and reproducible task . Themanufacturers wrapped each block in three layers of0.04 mm white Teflon followed by 0.01 mm aluminizedMyiar, assuring high liner:al reflection and light-tight-ness of each crystal.
Light output characteristics were measured [161 byexposing each crystal at ten positions along its lengthto 662 keV photons from a collimated Cs 137 source andreading out the light with a green-sensitive AmperexXP1017 photomultiplier. The signal from the 662 KeVline was compared to the same line measured with thesame phototube, but using a small "standard" CsIblock. The crystal specification required the averagelight output, La, to exceed 20% of that obtained withthe small "standard" CsI block. The longitudinal gradi-ent, GZ, defined as the relative change in light outputfrom the front to rear end of the crystal from a linearfit to the light output, typically lies between --1 and+I I%. The actual specification required that at mostone of the ten light output measurements could lieoutside a band centred on the value of La, as shown infig . 35 . Such a positive gradient, as compared to zero,does not hurt energy resolution at low energy andimproves it above 1 GeV: the increased light output atthe back of the crystal partially compensates for fluctu-ations in rear shower leakage which dominate theresolution at high energies. Both light output and gra-dient depend crucially upon the purity of the crystal-growing materials, the clarity of the resulting block,surface preparation, and wrapping . The La and GZvalues for all crystals are shown in fig. 36 .
Four silicon photodiodes mounted on a 6 mm thickUVT Lucite window on the rear face of each crystalconvert the scintillation light from the CsI into electri-cal signals . For redundancy, each of the photodiodes isconnected to an independent nearby preamplifier. Thecable from the preamplifier travels outside the CLEOü detector to the mixer/shaper card, which sums thefour preamplifier signals from each crystal and shapes

94
450 (a)Light Output (all crystals)
Y. Kuhota et al. / TheCLEO II detector
the signal for input to the ADC. Fig. 37 shows the timestructure of the pulses at each stage of readout .
The Hamamatsu S1723-00 photodiode [16-18] hasan active area of 1 x 1 cm2 . When a reverse biasvoltage of 10 V is applied, each diode has low leakagecurrent (typically 1 nA) and a junction capacitance of75 pF . Early diode failures from increased surfaceleakage currents were traced to the epoxy coating, andHamamatsu subsequently eliminated this problem. Themanufacturer checked the production orders by bakingat 80°C for two days and passing those diodes with lowleakage currents ( < 5 nA at 20 V and 25°C) . Afterdelivery, diodes wore operated for one week at 20 Vand 25°C, and those with high currents were discarded .A schematic of the charge preamplifier is shown in
fig . 38. It features hybrid implementation, a single + 15V power supply, differential noise immunity to outputcable pickup, a rise time of 15 ns, and fall time of 180~ts . The rise time of a pulse from the calorimeter isdominated by the 900 ns decay time of the CsI(Tl) .Noise referred to the input is about 250 electronswithout the photodiode connected . With a diode con-nected the noise is approximately 600 electrons rms .Under computer control, charge may be injected ateach channel's input to calibrate electronic gain andlinearity. Preamplifiers are arranged in groups of 16per board, servicing diodes on four neighbouring crys-tals . Each board dissipate% 3 W of power, so coppertubes, in thermal contact with a copper case surround-ing each board assembly, are used to circulate freonfor cooling . The FET is the most likely component tofail (see fig. 38) . The manufacturer thermally cycledthe preamps ten times between - 40°C and + 140°Cand operated them at 85°C for two days, rejecting anyfailures . The circuits were tested again after delivery.
AVU
1000
800
6600
w400
EZ
wôEaP
200
Ib )Gradient (all crystals)
0-0.1 -0.05 0 0.05 0 .1 0.15 0.2 0.25 0.3
La
GZ
Fig . 36 . Distributions : (a) average light output L,, and (b) gradient Gz from source measurements of all crystals in CLEO 11 .Crystals with L a < 0.2 and GZ > 0.15 are from early orders and were placed near the inner radius of the endcap .
The mixer/shaper first sums the four signals percrystal . It has a pole-zero shaper to eliminate the longtail of the preamp pulse ar!d has a circuit to drivetwisted-pair cables to the ADCs. The circuit diagram isshown in fig . 39 . The rise time is 2 Ws and fall time is 9p,s; fig . 37 shows the pulse shape . A fine gain adjust-ment is available to compensate with about 5% accu-racy for crystal-to-crystal variations in light output fortriggering purposes . Each input is computer-addressa-ble to select the preamp/diode channels to be used foreach crystal and simultaneously adjust the gain toaccount for any of the input channels turned off. Thecards reside in one of the 24-card crates specificallydesigned for the CLEO II calorimeter . There are atotal of twenty four mixer-shaper crates, 16 for the
Fig . 37. Pulse shapes at output of the preamps, andmixer/shaper circuits, and sampling gate for the ADC.

Y. Kubota et al. / TheC,EO IIdetector
Fig. 38 . Circuit diagram of the CLEO II hybrid charge sensitive preamplifier for crystal readout connected to the. siliconphotodiode . RF =100 MSt ±5%, CF=1 pF±5%, RB* to be trimmed for FET (0.6 kft <_ Rs< 1 .2 kit) .
barrel and four for each endcap . After the gain varia-tions have been equalized but before shaping for theADC, the analog signals from the 16 crystals on eachmixer/shaper card are differentiated and summed to-gether for trigger purposes . The resultant 16-crystalsum is fed to two on-board discriminators, set at 100and 500 MeV respectively, which then act as input bitsto the trigger system (section 7) .
LeCroy Fastbus model 1885N ADCs, with 96 chan-nels per card, digitize the analog pulse for readout into
4bit ComputerGain Compensation
(I<G<2)
the data acquisition system. The signal from themixer/shaper is attenuated by a factor of 20 at theADC, filtered with a 10 kHz high pass filter, andintegrated with a 1-Ws gate as shown in fig . 37. Thedigitized output has 12 bits of precision and an extrabit indicating high or low range . High and low rangediffer in gain by a factor of eight, so these moduleshave an effective 15 bit dynamic range. The ADCs areoperated in auto-range mode in which the ADC itselfautomatically chooses the appropriate gain for the
Integra'tor
Discriminator
Fig. 39. Schematic of the mixer/shaper circuits between the crystal preamplifiers and the ADCs.
95

Fig. 40. RMS noise levels in individual crystals, as brokendown between (a) the incoherent and (b) coherent contribu-
tions.
signal present at the input. Four Fastbus crates, with21 ADC slots filled per crate, house the ADCcards forCLEO II.
The electronic noise in the system can be given inADC counts (or equivalent MeV) and can be brokendown into coherent and incoherent contributions . Theincoherent contributions from agroup of summed crys-tals combine in quadrature, whereas the coherent onesadd linearly. The primary source of incoherent noise isSchottky noise from the photodiode leakage currents,whereas the coherent contribution is primarily in theADC module. These noise levels can be measured bythe width of individual and summed crystals whenthere is no true energy signal present, such as during apedestal calibration with no beams in CESR. Thedistributions of the rms pedestal values from a no-beamcalibration are shown in fig. 40 . The average values are0.5 MeV incoherent (2 .3 ADC counts) and 0.2 MeVcoherent (0.9 ADC counts); most channels have lessthan 1 MeV incoherent and 0.5 MeV coherent noiselevels .
The hardware components performing the sparsifi-cation of the ADC's output data is described in section7. The algorithm selects for readout into the computerthe address and ADC value of all crystals that arelocated within two blocks of any deposition > 6 MeV,and is more than a standard deviation above pedestal .
H . V.
Z
FX280
Reflector
Filters
Y. Kubota et al. / The CLEO II detector
X Bundle
Imm fibers
More precisely, a crystal's data is saved as part of theevent if it is both a) above pedestal by two or morecounts, and b) one of the crystals in the 5 x 5 blockarray centred around a crystal which is 25 or morecounts above pedestal . This results in approximately430 crystal digitizations written to tape on a typicalhadronic event.
The failure rate of the crystal readout componentsis an important figure of merit for performance, espe-cially for the diodes and preamplifiers inside the detec-tor because they cannot be repaired without disassem-bling CLEO 11. Diodes fail by exhibiting large leakagecurrents and hence a high noise level. Preamplifiersfail by yielding almost no signal or an erratic one.Fortunately, because the cables from all four diode/preamplifier combinations on each crystal are broughtoutside the crystal holder, those diodes (or preampli-fiers) that fail can be deactivated in the mixer/ shapercircuit. Crystals can operate adequately even with onlyone live diode/preamplifier combination, though theincoherent electronic noise relative to the signal is afactor of two smaller with all four channels alive. Ofthe total 31200 diode/preamp channels in CLEO 11,108 were found to be faulty or disconnected afterassembly of the calorimeter. In a subsequent 13 monthperiod of operation, from February 1990 until March1991, 35 preamplifiers and 9 diodes failed, and 6mixer/shaper cards and 2 ADC boards were replaceddue to malfunctions . At this rate, it should require inexcess of 19 years before one crystal has only one livediode/preamp, and more than 69 years until one crys-tal has all four of its channels dead .
5.5. Light flasher calibration system
A light flasher system monitors changes in the cali-bration of the photodiodes and the crystals (electronicpulser calibration monitors the components down-stream of the diodes). The goal of the system is todetect if the light-sensitive gain changes more than0.510 on a day-to-day basis. The schematic of thesystem is shown in fig. 41 . Light fibres transmit theflasher pulses from a flash tube to the readout end ofeach crystal. The light then reflects off the crystalsurfaces and is collected by the photodiodes.
Two EG and G FX280 xenon flash tubes each serve3900 crystals (an endcap and half of the barrel each).
Photodiode
Fig. 41 . Schematic of the light flasher system .

There is a parabolic mirror behind each of the flashtubes. Pieces of green and white plastic are placed inthe 5 cm gap between the tube and 1-mm fibre bundlesin order to match the light spectrum to that of CsIscintillation light, and to diffuse the light so that all thefibres are illuminated more uniformly . There are 1561-mm diameter PCS (plastic clad silica) fibres groupedin six bundles at the flash tube end. Each of these lmmfibres then connects to a bundle of 50 PCS fibres, each200 Wm in diameter. In turn these thin fibres transmitlight to individual crystals . There is a 1 cm gap betweeneach pair of mating 1 mm fibres and 200 wm fibrebundles. This ensures that all the 200 pm fibres areilluminated uniformly . The 200 Wm fibres are con-nected to the back of the crystals, where the photodi-odes are mounted, using Hewlett Packard snap-in con-nectors HFBR 4001/4005 .
The intensity of the light pulses changes too muchfrom pulse to pulse and from one day to the next tomonitor small changes in the absolute gain of eachcrystal . Therefore, only the gain change of a crystalrelative to its "neighbours" is monitored (those crystalsflashed by the same bundle of 200 p,m fibres aredefined as the neighbours) . Since the fluctuation of therelative pulse heights is typically 1% (3% for absolutenormalization), the statistical accuracy of a 25-pulsemeasurement is 0.2% for each crystal . The flashersystem has been useful in detecting failed diodes andswapped cables . When one of the four diodes on acrystal fails, it is obvious that a large change (> 10%)in the flasher calibration has occurred, whereas theelectronic calibration might only show a subtle increasein pedestal width in such a case . There has also beenan occurrence of swapped cables that went undetecteduntil the flasher data indicated the problem. This latterproblem is easier to detect with the flasher systembecause the optical characteristics vary from one crys-tal to the next more than the electronic gains .
5.6. Clustering and calibration
The ADC values in the raw data banks are con-verted into energies before shower reconstruction be-girl. This requires electronic pedestal subtraction, gainmultiplication appropriate to the run being analyzed,and conversion to absolute energy units. Periodic puls-ing of the electronics monitors changes in the pedestals,gains, and noise in the readout system, which can bedue to slow drifts in the electronics or different proper-ties of replaced mixer/shaper or ADC modules. Crys-tal-to-crystal calibrations, normalized for beam energyelectrons, are calculated using e+e - -> e+e - events.These constants are computed by minimizing the rmswidth of the Bhabha electron shower energy distribu-tion and constraining it to peak at the beam energy;this requires solving a linear equation involving a 7800
Y. Kubota et al. / The CLEO IIdetector
9
6
T
6
ô 5W
e 4
3
2
--- Monte Carlo (vi =0.62,o,0.26)
Dota
(v==0.5 ,ojO.2 ) 100MeYys-- Monte Carlo (o"I=o.31 ,cC OJ3 )
-,- Monte Carlo (No Noise)
. .JL__.. . .~
.
,0 5 10 15 20
Number of Blocks Summed
97
Fig. 42 . of /E as a function of the number of highest-Ncrystals summed . The curves were generated from MonteCarlo shower simulation of 100 MeV photons with appropri-ate noise included . The points were measured with real data,the 100 MeV photon lines at the TOS) . The arrow indicatesthe actual number summed in the CLEO II cluster algorithm
for 100 MeV photons .
x 7800 sparse matrix. In principle, these constants canbe obtained accurate to ±0.5% for every crystal in a30 pb-' dataset ( < 1 week of running at current CESRluminosities) . In practice, the crystal constants changeslowly with time and need to be updated only every fewmonths.
Reconstruction of calorimeter showers begins withthe formation of clusters from individual crystal hits .The most energetic crystal in any cluster is the onlycluster member exceeding 10 MeV to have higherenergy than any of its immediate neighbours. Eachmember of a cluster is physically located at most twoblocks away from another member of the same cluster.
The energy and position of each cluster are com-puted from its most energetic N crystals, where Nvaries logarithmically with the total cluster energy from4 at 25 MeV to 17 at 4 GeV (N = 4 below 25 MeV andN = 17 above 4 GeV). These values [25] of N minimizethe energy resolution, as shown in fig . 42, which wouldotherwise be degraded further by electronic noise. Thisalgorithm yields better energy resolution than otherpossible methods, such as summing a fixed number ofcrystals near the highest, or summing all neighbouringcrystals over some threshold . It does so by selectingcrystals with the largest energy deposition and rejectingthose most likely to be dominated by noise (i .e . thesmallest), and includes the right number ofcrystals as afunction of energy. In a small percentage of cases acrystal may belong to two clusters, in which case itsenergy is apportioned between them. The absolutecalibration coriection described below is then appliedto the cluster energy to yield the best estimate of theenergy of the incident particle assuming it to be aphoton.

98
ÊEc2û
ôVe
ôa.
12
8
4
0
-8
Position Correction vs Block Coordinate
-0 .4 -0 .2 0 0.2 0.4Centroid Coordinate
Fig. 43 . Lateral correction in azimuth as a function of blockcentroid coordinate for various energies. A positive centroidcoordinate is at larger azimuth angle than the block centre .The curves are not perfectly anti-symmetric about the blockcentre because the crystals are systematically tilted to point
away from the beam line .
The position vector of each cluster is computed intwo steps. First, the centroid is calculated as the en-ergy-weighted sum of the coordinates of each crystal'sgeometric centre . Then a correction vector is added tothe centroid . The correction has two pieces, a lateralcc:::ponent correcting the shower location in the planeperpendicular fo the incident particle's direction, and alongitudinal piece which adjusts the depth into CsI ofthe shower centre . Both components depend on clusterenergy . The lateral correction varies with the proximityof the centroid to the edges of a block . The lateralcorrection, which is only applied to barrel clusters(where particles strike a nearly rectangular array ofcrystals at normal incidence), is small near the centreand edge of a block, and moves the centroid away fromthe block centre in between [16) as shown in fig . 43 .The longitudinal correction places the shower at thedepth within the CsI where an electromagnetic showerwould have its mean energy deposition . This depth canbe calculated analytically for CsI as a function of theshower energy E as
Depth [cm] = 5 .45 + 0.97 ln(E[MeV])which varies from 10 cm at 100 MeV to 14 cm at 5GeV. Assigning the correct shower depth is importantfor matching showers to charged track trajectories pro-jected into the calorimeter, and in the endcaps toassign the polar angle correctly.
Absolute energy normalization for photon clustersrequires a number of techniques to cover the entirephoton energy range . Such normalization accounts forthe difference between photons and electrons at 5GeV and the effects of shower leakage, crystal gradi-ents, and the cluster algorithm, all of which vary with
Y. Kubota et al. / TheCLEO II detector
va>
c
EW
W
Fig . 44 . The correction factor Etrue /Emeasured for absolutephoton energy calibration, measured using different tech-
niques .
photon energy . Such a calibration has only been per-formed so far for showers in the region 45° < 0 < 135°,and is summarized in fig . 44 . Photon pairs from 7r °
decays, constrained to the expected mass, yield a cali-bration accurate to about ±0.5% below 2 GeV. Above500 MeV, photon energies in radiative Bhabha eventsare compared to the constrained value obtained fromthe measured momenta of the electron and positron,yielding calibrations accurate at the ±0.5% level . Simi-larly, radiative yy events (with three photons observed
10 100 1000 5000Er (MeV'
Fig . 45 . (a) Azimuthal angle resolution of the calorimeter as afunction of photon energy . (b) Shower energy resolution of
the calorimeter as a function of photon energy .
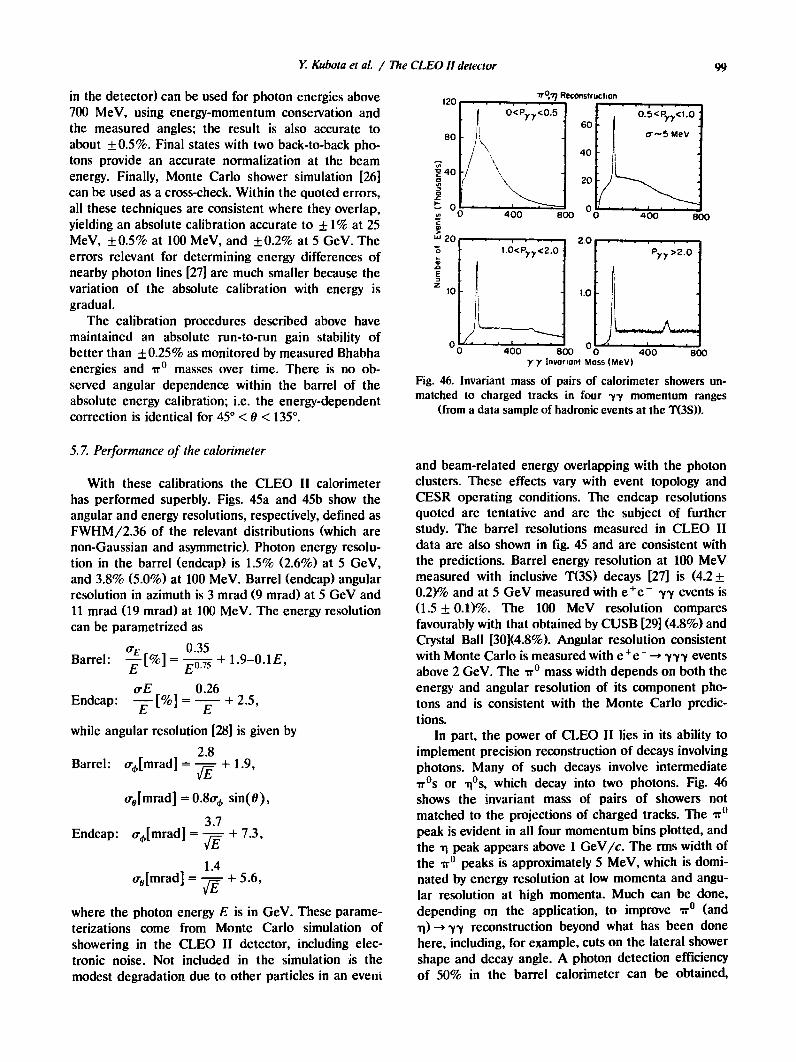
in the detector) can be used for photon energies above700 MeV, using energy-momentum conservation andthe measured angles ; the result is also accurate toabout ±0.5%. Final states with two back-to-back pho-tons provide an accurate normalization at the beamenergy . Finally, Monte Carlo shower simulation [26]can be used as a cross-check. Within the quoted errors,all these techniques are consistent where they overlap,yielding an absolute calibration accurate to ± 1% at 25MeV, ±0.5% at 100 MeV, and ±0.2% at 5 GeV. Theerrors relevant for determining energy differences ofnearby photon lines [27] are much smaller because thevariation of the absolute calibration with energy isgradual.
The calibration procedures described above havemaintained an absolute run-to-run gain stability ofbetter than ±0.25% as monitored by measured Bhabhaenergies and w° masses over time . There is no ob-served angular dependence within the barrel of theabsolute energy calibration; i.e . the energy-dependentcorrection is identical for 45° < 0 < 135° .
5.7. Performance of the calorimeter
With these calibrations the CLEO II calorimeterhas performed superbly. Figs . 45a and 45b show theangular and energy resolutions, respectively, defined asFWHM/2.36 of the relevant distributions (which arenon-Gaussian and asymmetric). Photon energy resolu-tion in the barrel (endcap) is 1 .5% (2.6%) at 5 GeV,and 3.8% (5.0%) at 100 MeV. Barrel (endcap) angularresolution in azimuth is 3 mrad (9 mrad) at 5 GeV and11 mrad (19 mrad) at 100 MeV. The energy resolutioncan be parametrized as
QBarrel :
1%] =0E
.o35.7s + 1 .9-0 .1 E,
o,E 0.26Endcap :
E [%]=-E +2.5,
while angular resolution [28] is given by2.8
Barrel :
ajmrad] =7E
+ 1 .9,
o,®[mrad] = 0.8o,, sin(9),3 .7
Endcap :
oo[mrad] =7E
+ 7.3,
1 .4o,e[mrad] =
7E+ 5.6,
where the photon energy E is in GeV. These parame-terizations come from Monte Carlo simulation ofshowering in the CLEO II detector, including elec-tronic noise. Not included in the simulation is themodest degradation due to other particles in an eveni
Y. Kubota et al. / The CLEO Adetector
Ez
10
t.0<Pyy<2.0
7TQ,77 Reconstruction
0
40
20
yy Invariant Mass (MeV)
0.5<Pyy<t.0
Q~5MeV
400 Boo
99
Fig . 46 . Invariant mass of pairs of calorimeter showers unmatched to charged tracks in four yy momentum ranges
(from a data sample of hadronic events at the T(3S)).
and beam-related energy overlapping with the photonclusters . These effects vary with event topology andCESR operating conditions . The endcap resolutionsquoted are tentative and are the subject of furtherstudy. The barrel resolutions measured in CLEO IIdata are also shown in fig . 45 and are consistent withthe predictions . Barrel energy resolution at 100 MeVmeasured with inclusive T(3S) decays [27] is (4.2 ±0.2)% and at 5 GeV measured with e+e - yy events is(1 .5 ± 0.1)% . The 100 MeV resolution comparesfavourably with that obtained by CUSB [29] (4.8%) andCrystal Ball [30](4.8%). Angular resolution consistentwith Monte Carlo is measured with e+e -- yyy eventsabove 2 GeV. The-rro mass width depends on both theenergy and angular resolution of its component pho-tons and is consistent with the Monte Carlo predic-tions.
In part, the power of CLEO II lies in its ability toimplement precision reconstruction of decays involvingphotons. Many of such decays involve intermediate-rr °s or q°s, which decay into two photons. Fig. 46shows the invariant mass of pairs of showers notmatched to the projections of charged tracks. The -Tr°peak is evident in all four momentum bins plotted, andthe il peak appears above 1 GeV/c. The rms width ofthe 7r° peaks is approximately 5 MeV, which is domi-nated by energy resolution at low momenta and angu-lar resolution at high momenta. Much can be done,depending on the application, to improve w° (and,n) --+ Yy reconstruction beyond what has been donehere, including, for example, cuts on the lateral showershape and decay angle. A photon detection efficiencyof 50% in the barrel calorimeter can be obtained,

ôô
600.
ô 400Fôw0
É
â 200
( Icos 01 < 0.71) .
r-+ 1-Prongs3-Prongs
0V.0:0 05 1 .0 1.5
Fig. 47. The ratio of shower energy to momentum E/p fortracks in events in the one-vs-three charged-track topology, asample rich in -r-pairs. The one-prong side tracks, shown inthe solid histogram, are normalized to the same number ofentries as the three-prong side tracks (dotted). The expected
electron peak is evident at E/p=1 for the loner track.
compared with 10% for CUSB [291 and 15% for Crys-tal Ball [30]. The fine segmentation allows the separa-tion of individual photon showers from r° decay up tor° energies of 2.5 GeV, above which energy the show-ers sometimes merge. Merged-shower -rr°s can be dis-tinguished from single photons by their larger lateralshower spread .
The calorimeter energy can be used in conjunctionwith the momentum and dE/dx from the trackingchambers for electron identification . By utilizing theratio of shower energy to momentum (E/p), lateralshower shape, difference between the projected trackposition and the shower location, and specific ioniza-tion in the drift chamber gas, powerful hadron rejec-tion (several hundred to one) is achieved while main-taining a high efficiency (> 90%). By far, the mostpowerful of these is E/p. Fig . 47 shows the ratio ofshower energy to track momentum for events in theone-vs-three topology, a sample rich in T-pairs. For the1-prong side, there is clear evidence for the expectedelectron peak near unity, in contrast to the 3-prongside, which shows no enhancement .
Data have been acquired with a random triggerunder normal colliding beam conditions. These datayield identical results for the rms pedestal width as theno-beam pedestal calibrations, but do show evidencefor occasional beam associated showers . For example,there is typically a shower in 1/10 random events ineach of the polar angular ranges(0.87 < Icos 01 < 0.94), (0 .71 < Icos 01 < 0 .87),
These beam related showers have energy distributionsas shown in fig. 48 . Approximately 115 of those show-
Y. Kubota et al. / The CLEO 11 detector
40.0
9) 30-0
10.0
6. The muon identification system
6.1 . Description of the hardware
0,0 JI .
114
h1 ° Lr1i A.. n. n Cf .
1
. n
0.00 0 .10 020 0.30 0.40 050
EShowa(GeV)
Fig. 48. Distribution of largest shower energy per event in thebarrel from a random trigger run under normal collidingbeam conditions . The bin with 0 to 10 MeV energy, whichcontains 90% of all events, is suppressed because a "showercluster" must contain at least one crystal with energy greater
than 10 MeV .
ers have energy above 50 MeV, and 1/10 above 100MeV. Such showers are present at low angles in theendcaps (< 20°) in about half of the events, and havean energy distribution similar to that of the barrel . Therate of such extra showers in both barrel and endcap,however, strongly depends on CESR beam conditions,and has been observed to be considerably higher forcertain run periods . No evidence for radiation damageyet exists, even for those crystals most at risk near theinner endcap radius. Inner endcap crystals have beenexposed to a dose of 100 rad, and with calibrationsbased on vertical cosmic rays, show less than 5% degra-dation in light output since installation. Other crystalshave been exposed to far less radiation, and also showno measurable decrease in light output .
The muon identification system for CLEO II wasdesigned with the goals of maximum solid angle cover-age, high efficiency, low probability of a hadron beingmisidentified as a muon (fake rate), reliability and easeof operation . Because of space limitations the muonchambers only cover the polar angle range 30° to 150°,which is 85% of the total solid angle . Here we presenta brief description of the system and a summary ofperformance level. A more detailed account of itsconstruction and performance can be found in a sepa-rate paper [31] . Barrel muon chambers are embeddedin an iron absorber at depths of 36, 72 and 108 cm ofiron (see `rig . 1) . Additional muon chambers (endcaps)

Fig . 49. Cross section of a plastic proportional tube in themuon detector.
cover the two ends of the detector. The total equiva-lent thickness of iron absorber varies from about 7.2 to10 nuclear absorption lengths (A ; = 16.8 cm in iron[32]), depending on the direction of the track.
Ease of operation is obtained by using "plasticstreamer counters" [33], operating in the proportionalmode, at 2500 V with a 50:50 argon-ethane mixture.The counters are about 5 m long and 8.3 cm wide . Thecross section of a counter is shown in fig. 49 . The eightanodes in each counter are 50 pm diameter silver-plated Cu-Be wires. They are ganged together, givingan rms space resolution per counter of 2.4 em, which isbetter than the spatial uncertainty due to multiplescattering at the momenta of interest in our experi-ment . The comb-like plastic profile [34] is coated withgraphite to provide a cathode on three sides of eachanode. One hit coordinate is obtained by reading outthe anode signal, while the orthogonal coordinate(along the counter) is measured with external copperpickup strips, of the same width as the counters . Theargon-ethane gas mixture is provided by the gas sys-tem developed for the central drift chamber, describedin section 3.
In order to achieve high efficiency, we have instru-mented each iron gap and the exterior of the ironabsorber with "units", each composed of three layersof 20, 25, 29, or 24 counters, depending on the unitlocation (see table 5). Each layer has readout of theorthogonal coordinates. The reason for having threelayers is the following: two slightly staggered layers areneeded to eliminate the geometrical inefficiency of asingle layer, and the third layer provides redundancy incase of malfunctioning of some counters . Furthermore
Y. Kubota et al. / The CLEO 11 detector
the use of appropriate logical combinations of hits inthe three layers allows noise rejection while maintain-ing an adequate efficiency.
High voltage is provided by 32 computer-controlledpower supplies, one for each unit. The high voltageripple is kept below levels at which it would contributeto the pedestal width. The voltage drops at most 1% atmaximum current draw. The normal current drawn bya unit is below 1 WA and a software-controlled trip isset at 10 tLA. External high voltage distribution boxesallow disconnecting individual counters .
Charge division read-out is used to determine thetwo orthogonal space coordinates for each hit - , themuon detector. Each layer of counters is divided intotwo subgroups (multiplets) of between 10 and 15 coun-ters each (see table 5). The anode wires from eachcounter within a multiplet are connected via 100 i2resistors to each neighbour and the string is connectedat each end to a charge integrator via a 15-20 footlong, 50 i2 cable. In each layer the external copperpickup strips that provide the orthogonal coordinateare divided into 4 multiplets of either 9 or 15 stripseach . These strips are also interconnected by 100 i2resistors to each neighbour and the two outside stripsare connected to charge integrators. In this way, signalsfrom the 2352 counters and 5472 strips are processedby a total of 1152 charge integrators and associatedelectronics. In order to monitor the electronic gainstability, provision has been made to inject a fixedcharge into each charge integrator from a pulser. Thereadout electronics is described in more detail in ref.[31] .
6.2. Hardware performance
After the initial shakedown period (June-Novem-ber, 1989), the CLEO II muon detector has performedreliably. We currently have 86 disconnected counters(out of a total of 2352) because of excessive gas leaksor broken wires. Most of these counters were found tobe defective during assembling and testing the units,but too late to make replacement practical. Since theinstallation and shakedown period, six counters had tobe disconnected because of shorted wires.
Table 5Unit structure. The first three entries in the table refer to eight octants, each containing three Units, surrounding the magnet coil
(see fig. 1). The Unit designated "Return" is at the inner most iron gap, "Inner" is at the middle gap, and "Outer" is at the outer
most gap. Four end cap units are required to cover an end of the detector
Unitlocation
No . ofunits
No. oflayers
Usefulsize [m21
Multipletcounters
Structurestrips
Return 8 3 4.39 x 1 .67 10+10 9+15+15+15
Inner 8 3 4.87x2.0 10+15 15+15+15+15
Outer 8 3 4.87x2.42 14+15 15+15+15+15
Endcap 8 3 4.38x2.00 10+14 9+15+15+15

Feg.
F
C
0
200
160
> 120
® soz
40
Multiplet of i0 Counters
0 0.25 0.50 0.75 1 .00
Pulse Height Raiio :R=PH2/(PHI+PH2)
Puise height ratio distribution from charge divisionreadout ofan anime multiplet.
The electronics has also performed well. Since Jane1989, we have changed only one out of a total of 24data cards (this was to fix two channels whose pedestalswere fluctuating). Calibration data is taken every twoor three days to monitor pedestal mean and widthstability. They have remained satisfactorily constant.During normal data recording we monitor the muonchambers on-line using cosmic rays and muon pairsproduced in the e'e - collisions . The on-line diagnos-tics are designed to detect problems which affect largeparts of the muon system - e.g. gas is turned off,disconnected data cards, etc.
6.3. Charge division calibration
The actual position of a hit (i.e . counter and stripnumber within a multiplet) can be determined fromthe ratio of pulse heights recorded at the two ends ofthe charge division line, which connects counters (orstrips) in the multiplet. The relation between pulseheight ratio and space coordinates is determined byoff-line calibration . The electronic gain ratio betweenthe two ends of each charge division multiplet areabsorbed into the calibration . The pulse height ratiodistributions for the anode wire readout produce clearlyresolved peaks for each individuaï counter as illus-trated in fig. 50 . The distributions are therefore self-calibrating . The peaks due to individual strips in thepulse height ratio distribution are much broader andnot easily resolved. The resolution of the charge divi-sion is worse in this case because of the smaller amountof charge induced on the strips compared to the wires,and there are counter-to-counter differences in theexternal pickup strip ratio due to slightly varying dis-tance between the counter wires and a pickup strip.This dependence has not yet been optimally calibratedunder real experimental conditions . The relation be-
Y. Kubota et al. / The CLEO II detector
tween the pulse height ratio and the space position ofthe hits is obtained by predicting the hit position fromthe muon trajectories measured in the central trackingsystem for e + e - -> p.+W- events . The resolution thusobtained is satisfactory and the electronic system hasbeen stable enough that the same calibration of thecharge division has been used for all data collected sofar.
The space resolution of the detector, defined as therms spread in the difference between the projectedtrack position in the layer and the hit position, isdetermined by three factors:
i) the propagation of the errors of the track parame-ters, measured in the drift chamber, when the track isprojected to a unit;
ü) multiple scattering in the CsI calorimeter and inthe iron absorber, important at the relatively low ener-gies typical of our experiment, and
iii) the intrinsic space resolution of the counters andstrips, i.e . the accuracy with which we can determinethe space position of a counter and strip hit. Theintrinsic space resolution of the counters is dominatedby the width of the individual counters (rms width =8.3/ 12 = 2.4 cm). For the strips the intrinsic rmswidth is approximately 5.3 cm . In both cases thesedistributions are symmetric but not Gaussian, as ex-plained in ref. [31] . The anode space resolution, takinginto account propagation of tracking errors and multi-ple scattering, for 5.28 GeV muons, is 3.7, 4.6 and 5.7cm for the barrel units at successively greater irondepth, and 7.2 cm for the endcap units, reflecting theincrease in multiple scattering of the tracks . The corre-sponding resolutions for the strips are: 5.5, 7.0, 7.5 and9.0 cm.
6.4. Muon identification procedure
The first step is to extrapolate into the muon detec-tor each track reconstructed in the central detector,taking into account dE/dx energy loss . The pathlength to each muon layer is calculated in terms ofnuclear absorption length . Then a search is made forhits in the muon units that are likely to be traversed bythe track and a two-dimensional X2 of the distancebetween the measured and the projected hit positionsis calculated. If this X 2 is less than 16, we consider thatlayer to be hit. Since the errors are not Gaussian, wecannot associate a confidence level to this number . Itshould be considered as an adjustable p_,>w"ameter to
reach the best compromise between maximizing themuon identification efficiency and minimizing the fakeprobability . The track is considered as definitely de-tected in a unit if at least two out of the three layers inthat unit are hit.
The track is assigned the depth of the outermostunit in which it is detected. If there are other units at
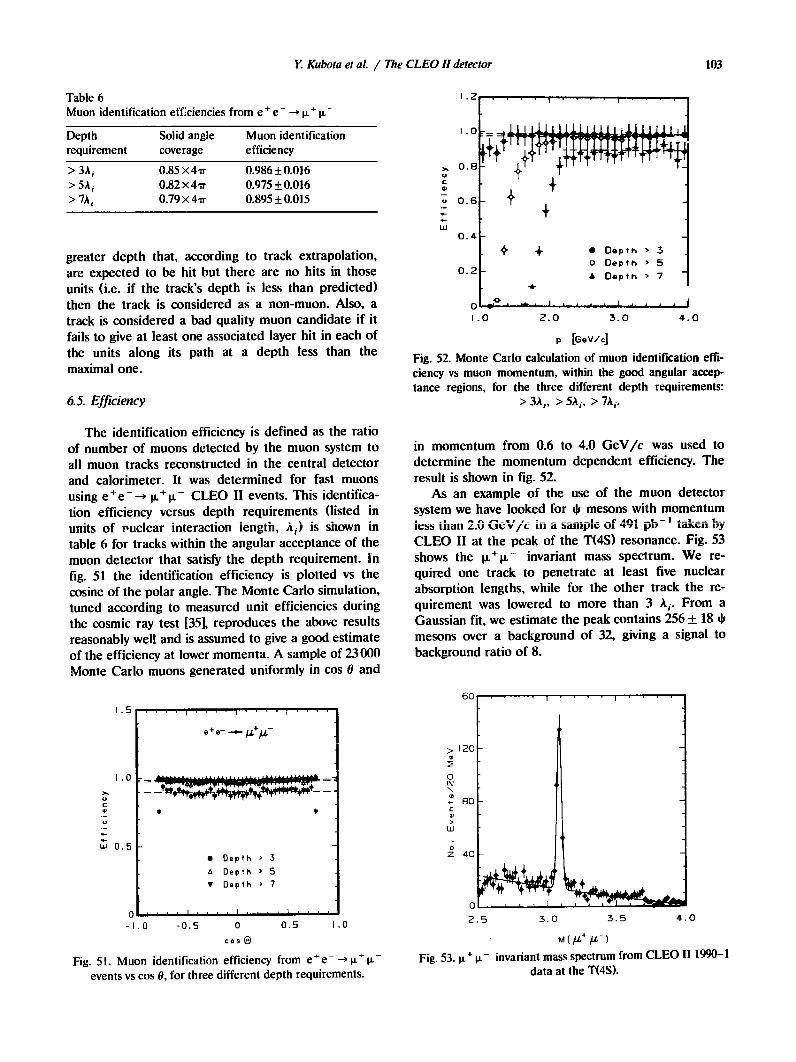
Table 6Muon identification efficiencies from e+e
greater depth that, according to track extrapolation,are expected to be hit but there are no hits in thoseunits (i .e . if the track's depth is less than predicted)then the track is considered as a non-muon . Also, atrack is considered a bad quality muon candidate if itfails to give at least one associated layer hit in each ofthe units along its path at a depth less than themaximal one.
6.5. Efficiency
The identification efficiency is defined as the ratioof number of muons detected by the muon system toall muon tracks reconstructed in the central detectorand calorimeter. It was determined for fast muonsusing e + e - -> W+ W- CLEO II events. This identifica-tion efficiency versus depth requirements (listed inunits of nuclear interaction iength, A;) is shown intable 6 for tracks within the angular acceptance of themuon detector that satisfy the depth requirement. Infig . 51 the identification efficiency is plotted vs thecosine of the polar angle. The Monte Carlo simulation,tuned according to measured unit efficiencies duringthe cosmic ray test [35], reproduces the above resultsreasonably well and is assumed to give a good estimateof the efficiency at lower momenta. A sample of 23 000Monte Carlo muons generated uniformly in cos 0 and
cos 8
Y. Kubota et al. / The CLEO 11 detector
Fig. 51 . Muon identification efficiency from e + e- - p' wevents vs cos 0, for three different depth requirements.
0NN
N
W
0
0 .e
0 .6
0 .4
0 .2
160
t 60C
Z 40
e Depth > 3o Depth > 5
Depth > 7
p [GeV/c]
1-J
4 .0
103
Fig. 52. Monte Carlo calculation of muon identification effi-ciency vs muon momentum, within the good angular acceptance regions, for the three different depth requirements :
> 3A ;, > 5A ;, > 7A ;.
in momentum from 0.6 to 4.0 GeV/c was used todetermine the momentum dependent efficiency. Theresult is shown in fig. 52.
As an example of the use of the muon detectorsystem we have looked for * mesons with momentumless ihan 2.0 Ge v /c in a sarn le of 'F71 ~lv tdliGll V9CLEO II at the peak of the T(4S) resonance. Fig. 53shows the W+W- invariant mass spectrum. We re-quired one track to penetrate at least five nuclearabsorption lengths, while for the other track the re-quirement was lowered to more than 3 A;. From aGaussian fit, we estimate the peak contains 256 ± 18mesons over a background of 32, giving a signal tobackground ratio of 8.
2 .5 3 .0 3 .5 4 .0
Fig. 53 . W + W- invariant mass spectrum from CLEO 111990-1data at the TOS) .
Depth Solid angle Muon identificationrequirement coverage efficiency
> 3A; 0.85 x 41r 0.986±0.016> 5A ; 0.82 x 4Tr 0.975±0.016> 7A, 0.79 x 41T 0.895 ±0.015

0.10
0.08
LLe 0.05
6.6 Fake probability per track
Pions
Y. Kubota et al. / The CLEO 11 detector
0 .20" Depth > 3o Depth > 5® Depth > 7
0.03 110 - -r-
o61 .0
(a)1 .8
2.6
3.4
[GeV/c]p
Fig. 54. Fake rate due to (a) it ± and (b) K ± as a functionsimulation).
The fake rate is defined here as the ratio of numberof hadrons misidentified as muons (i.e . fakes) to allcharged tracks within the muon detector geometricalacceptance and in a given momentum bin . The fakerates, Fr and F1, (due to rr and K, respectively), fordifferent depth requirements, determined by MonteCarlo simulation, are shown in fig . 54 as a function ofthe momentum of the incident hadron. The shape ofthe momentum dependence of the fakes rate for "rr andK are similar, but the fake probability per kaon isroughly four times higher than per pion . The momen-tum dependence reflects two effects :
i) the relative contributions of the different mecha-nisms leading to the fake muon signal change withincreasing momentum and depth ;
p [GeV/c]
rKaons
1 .0 1 .8 2 .6 3 .4IN
p [GeV/c]
of momentum, for different depth requirements (Monte Carlo
ii) with increasing momentum more information be-comes available from units at greater depths, thusallowing better hadron rejection via increased nuclearabsorbtion .
In order to verify experimentally the fake ratesobtained from the Monte Carlo simulation, 370000K"s decaying into rr + "rr- have been selected from theT(4S) data . Keeping only KS' with the decay vertex atleast I cm away from the beam line, the non K°background becomes negligible . The fake rate deter-mined this way is compared to the one produced byMonte Carlo simulation in fig. 55 . The agreement issatisfactory. The excess of the fakes in the -rr samplefrom K° decays for small momenta possibly comesfrom the random match of noise hits, not yet simulatedby our Monte Carlo . A more extensive check of thefake rate, including fakes due to K±, is underway. It
i DepthO Depth® Depth
357 _
p [GeV/c]
p [GeV/c]
Fig . 55 . Comparison between data and Monte Carlo of fake rate due to pions vs momentum for three different depth requirements .The pions are from reconstructed K" decays .

uses
K-
from
the
decay
chain
D*+ - D"-cr+ -*(K-,Tr+),Tr+ and T(1S) hadronic decays and will becompleted when more T(1S) data is available .
7. Timing, trigger and data acquisition
7.1 . CLEO II timing system
Every colliding beam experiment needs hardware toprovide gates and strobes properly timed to the cross-ing of the beams in the detector and to handle theenabling, disabling, and resetting the various detectorelements. At CESR, keeping these signals aligned withbeam in the interaction region is made more difficultby the uneven spacing of bunches in the storage ring(see fig. 56).
There are several particularly crucial timing param-eters in CLEO II . The time-of-flight electronics isgated every beam crossing . The time-to-amplitude con-verters are started by the arrival of a pulse from thescintillators and stopped in common by the end of thegate . Given that the intrinsic resolution of the time-of-flight system is on the order of 150 ps, we need to keepthe gate width and, more critically, the gate end timevery stable with respect to the beam crossing time . Inthe drift chamber the time-to-amplitude converters arestopped by the lowest level ("LO") trigger (see below) .The investigation of the trigger is done by latchingtrigger inputs on the leading edge of a strobe andinvestigating the trigger memory outputs on the trailingedge. Again the time of the end of this strobe arecritical to the experiment, since every nanosecond ofjitter adds 25-50 Win to the chamber spatial resolution .The calibration system needs a high degree of se-lectability in delay time and yet stability at any settingthat is as good as the beam stability in CESR.
To properly match the uneven inter-arrival times ofbeams in the interaction region and to create strobesand gates with reproducibilites of the same quality asthe beams themselves, the electronics used by theaccelerator staff to inject beams into CESR was repli-cated for CLEO II use. The two signals sent to CLEO
CESR RF~
hi
rc~~ rISIGNAL TD
M--CC ~r-LnL~SIGNAL
1 2 3 4
N 1 2 3
Fig. 56 . Timing structure of CESR . Shown are the rf synchro-nization signal from CESR and the OLEO crossing signal . ForN bunches of electrons and N of positrons there are N -1equal intervals Ta between collisions followed by one intervalof length rh . For N = 3, Ta = -r t, = 854 ns ; for N = 7 (thepresent configuration) T;, = 364 and Th = 378 ns. The offset Tdis chosen to open gates and time strobes for when the beams
collide in CLEO 11 .
Y. Kubota et al. / The CLEO 1! detector
II by the CESR timing system are a copy of the overalltiming start signal, which runs at 390 kHz, the revolu-tion frequency in the storage ring ; and a copy of theaccelerator's 23.8 MHz clock, derived from the rf sys-tem which operates at a frequency of 500 MHz.
Each critical signal [36] has a coarse delay circuitand a fine delay circuit [37], as shown in fig . 57. Thecourse circuit delays the overall start signal by an 8-bitprogrammable number of 24 MHz clock cycles ; i .e., thedelay is 0 to 11 Ws in 42.02 ns steps. This delayed startis the input to the fine delay circuit, which has a ratemultiplier to produce an internal 71.4 MHz clock. Justas shown in fig . 56, this circuit can be set to 1 . widebetween 1 and 61 equally spaced outputs, followed bythe appropriate gap until the start of the next train ofpulses. The time of the first of this train of outputswith respect to the input signal is also programmable in8-bits with roughly 165 ps steps.A beam pickup monitor has been used to evaluate
the performance of these fine delay circuits. Fig . 58ashows the arrival time of this pickup signal as mea-sured in the TF timing system whose common stop isthe output of such a circuit. The resolution of thissignal is 30 ps . The 8-bit input to this common stopsignal can be changed to check the linearity of thecircuits . The deviation from such linearity is depictedin fig . 58b for various values of the setting. Both ofthese figures are consistent with the 50 ps stabilitypredicted for these circuits [38].
Less-critical delays and widths are handled by 8-bitprogrammable delay generators (AD9500) located in amodule called the sequencer ; these signals are usuallyreferenced to the LO strobe . Examples of the signalsusing these generators are the start and width of thehigher level trigger strobes and the closing time of thepulse height gates in the central tracking chambers .
Two of the detector systems employ digital delays("pipelines") in generating trigger inputs [39) . Thetime-of-flight system has a simple double latch scheme
SETTINGS
FINEDELAY
105
Fig. 57. Schematic of delay generation of critically timedCLEO II signals. The "CESR Start" and "24 MHz TTLclock" are provided by CESR . The experimenter chooses the8 bits of coarse delay and 8 bits of fine delay as described inthe text . The resulting train has its number of equally spaced
pulses determined by the "bunch count".

1(M
Y. Kubota et aL / The CLEO 11 detector
150
mcc0LUwNc11,W
100
50
4Y=1 .5 channels=30 psec
95
100
105Positron Beam Arrival Time (Channel)
which would be necessary if coincidences between thecentral drift chamber and the time-of-flight were re-quired in the LO trigger or if CESR changes its modeof operation to use more than seven bunches of elec-tron and positrons (see fig. 59).
The CsI crystal system is rather slow in generatingtrigger signals. Triggers relying solely on energy deposi-tion in the crystals (eg., e+ e - -> yY) will thereforesatisfy the LO trigger at a much later time than thosethat have time-of-flight or tracking information avail-
Fig . 59 . Schematic of the time-of-flight trigger bit generationshowing the double latch scheme which is effectively a two-slotpipeline . The first latch is set by the arrival of a signal fromthe time-of-flight data electronics . To move the information inthe pipeline either i) the mode of operation must be "SAME"so that the second latch is transparent or ii) the "TF latchclock" must arrive before the "TF latch clear" . A "TEST"mode of operation exists to load patterns via the computer .
ôONcO
30
20
10
e
0
0
0
-20105
110
115Fine Time Setting
Fig. SS. (a) The positron beam arrival as timed by the time-of-flight system. The beam signal is from induced charge on a passivedetector located 5 m from the interaction point . (b) Residual from a straight line fit vs programmed delay for a fine delay circuit
used in CLEO 11 . The nominal difference between settings is 165 ps .
able at L0. Nonetheless, we wish to always examine thepulse height in the crystals at the same time withrespect to the collision that produced the event . There-fore, if LO was satisfied by time-of-flight and/or track-ing, the sequencer sends extra clock pulses to the Csldigital pipeline and delays the closing of the CsI pulseheight gate . If, on the other hand, the LO trigger wasdue exclusively to crystal energy, no extra clocking ordelay are generated .
One of the most important functions of the se-quencer is to reset detector and trigger electronics andto re-enable the experiment after an event . There arethree situations for executing the two-part reset se-quence : initialization, such as at the beginning of datacollection ; resumption of data collection, usually afterreading out the detector ; re-enabling of the triggersystem and detector after an unsuccessful search for ahigher level trigger [39] . A schematic of the operationof this reset sequence is shown in fig. 60 . The firstsignal in the sequence, ASRST, is generated asyn-chronously to collisions, immediately upon receipt ofthe request for the reset ; this resets all the sequencerlogic, clears the calibration controller, clears the CslADC buffers, restarts the CsI digital clocks (to clearthe CsI trigger pipeline described above), reopens allthe pulse height gates, and frees the drift chambertrigger logic to self-reset [40].
The second signal, SYRST, is synchronous with thebeams crossing in the interaction region, being timedby the programmable coarse and fine delay circuitsdescribed above [36] . The minimum amount of timebetween ASRST and SYRST is set by the experi-

Fig. 60. Schematic of the reset sequence showing the genera-tion of the asynchronous and synchronous pulses. TheAD9500affords 8 bits of programmable delay between generation of
ASRSTand the enabling of SYRST.
menter and is typically 800 ns . The functions of SYRSTare clearing the trigger logic, enabling the LO strobeand the detector timing gates, clearing the time-of-flighttrigger logic, and enabling the calibration controller .
For SYRST to be asserted the ENABL input to thesequencer must be armed. This signal is logically lowduring the readout of the detector . After an event theENABL line is not set logically high for approximately12 As after ASRST, allowing the devices to properlyclear their timing and charge capacitors before re-en-abling data recording .
7.2. CLEO II trigger system
The r"f TI\111CILE-00 ii trigger system is described in a previ-
ous article in this journal [39] . Here only an overview ofthe system and details of changes and modificationswill be given.A trigger system with three tiers or levels has been
developed. The flow of trigger logic is depicted in fig.61 . In the absence of triggers, the detector is active,with the wire chambers continuously collecting time
Y. Kubota et al. / The CLEO 11 detector
SYRST
107
and pulse height information. If the data is not readout, the information decays away with approximately a1.3 As time constant . The scintillator electronics isgated every beam crossing.
Level 0 (LO) is fast, simple, yet discriminatory. Itreceives inputs from the time-of-flight scintillators, fromthe vertex detector, and the CsI electromagneticcalorimeter, attempting to reduce the 2.7 MHzcrossingfrequency to a rate on the order of 20 kHz. Theexperimenter is able to define any numb;.: of sets ofcriteria for L0, all of which are logically ORA.
Whenever any of the LO criteria are met, all gates tothe detector arc disabled and a search for a .' of theLevel 1 (L1) trigger combinations requested by theexperimenter is initiated . Ll receives inputs from thescintillators, from the vertex detector and central driftchan,b--r, and from the electromagnetic calorimeter.The time required for these devices to all be "ready"for L1 interrogation is approximately 1 .0 As, so an LOrate of 20 kHz implies a minimum of 2% dead time.The goal of L1 is to reduce this rate to 25 Hz atpresent CESR luminosities . If no Ll criteria have beenmet, the trigger logic is reset and gating of the experi-ment resumes. Each set of Ll criteria has a specific setof L2 criteria which will be examined if those Llcriteria are met. The Ll triggers can be prescaled via8-bit programmable sealers.
At present only the vertex detector and drift cham-ber contribute to L2. The readiness time for L2 is now50 As, although implementation of new L2 schemesmight increase this waiting period . Since the Ll rate isnot envisioned to exceed 50 Hz, this wait for L2 resultsin only 0.25% dead time . As with Ll, if no proper L2criteria are met the system is reset and gating resumes.
Since submitting the article detailing this system[39], several significant changes have been made to thesystem :
Fig. 61 . Flow of the tiered trigger for CLEO 11, showing the various detector elements used in each level of the decision process.

108
Fig. 62 . An event in the CLEO 11 detector that was acceptedonly on the newly added two-photon trigger lines. This event
is ofthe type -" - f2 -> -mow() .
i) Two-photon physics: In an attempt to increaseour sensitivity to yy physics (i .e ., e +e - - e + e - -y-y),several new criteria have been added to the triggerspecifications. The coincidence of an endcap time-of-flight scintillator with a vertex detector track has beenadded as an acceptable combination to have an LOtrigger; this has increased the LO rate by roughly 25%.At Ll two new combinations appear. The first (desig-ned to capture untagged, all-neutral events) demandsnon-adjacent high-threshold bits set in the CA barrelcalorimeter in conjunction with no charged trackstraversing the drift chamber. The second new Ll com-bination is designed to find single-tagged yy events; itrequires an electron signature in the endcap time-of-flight and CsI endcap calorimeter, two non-adjacentlow threshold bits in the CsI barrel calorimeter, and atmost one short track in the drift chamber. There areno L2 requirements . In typical running conditions theseyy specifications add 8% to the overall trigger rate . Anexample of an event which we accepted by virtue ofhaving these new trigger requirements is shown in fig.62 .
Y. Kubota et aL / The CLEO 11 detector
25
Nx15
0
Nw0J
20
10
5
T
""" LO
0 150
Linst (1030 Cm 2s1 )
12
10
NxY
6 vô0J
Fig. 63 . Rates for the three trigger levels vs luminosity in arecent run . Note that the luminosities are the on-line datarecording values and that the points for LO use the right axis.
ii) Barrel time-of-flight inputs : Increases in CESRluminosity have forced us to use the AND of the twoends of the barrel time-of-flight scintillators as thebasic trigger element instead of the OR of the twoends . Coupled with improved background conditions,this change has reduced the LO rate by a factor of morethan 5.
iii) LO strobe time: The relative time of investigatingthe LO trigger inputs with respect to the beams crossinghas been increased to 405 ns . This has been done toimprove the efficiency of the vertex detector in the LOdecision process . This change does, unfortunately, re-duce the resolution of charge division in the vertexdetector since the charge collected now has more timeto equalize between the two ends of the chamber .
iv) Dead time induced by LO triggers : By fine-tuningvarious delays, the number of crossings "lost" when avalid LO combination fails to find a valid Ll combina-tion has been reduced from 7 to 6 . This makes thedead time associated with the lowest trigger level 0.22%per kHz . Given these changes, the actual rates for L0,
Table 7Readout crates in CLEO 11
Device Type Number Ready time Sparsificationcrates [ms]
Outer drift chamber Analog 20 7.2 T.AND.QVertex detector Analog 4 7.0 T.AND.QPrecision tracker Analog 1 4 .6 T.AND.QTime-of-flight Analog I 2 .4 Tl .OR.T2.OR.QMuons Analog 2 2.9 Q1.OR.Q2Trigger Digital 7 0.4 NoneCAMAC Digital I 0 .4 NoneCsl calorimeter Fastbus 1 8 .0 SPARXL
4L2
2
I - ' 0100 150 200

L1, and L2 in a typical data run are shown in fig. 63 asa function of instantaneous luminosity .
7.3. CLEO II data acquisition system
Once the trigger system has decided that an eventof interest has occurred, the data from the CLEO IIdetector must be read out to facilitate software tests ofevent quality (sometimes referred to as the "Level 3trigger") and record the event for subsequent analysis .CLEO II has three distinct types of data systems:
i) analog circuits developed by the CLEO II staffwhich store their timing or charge information oncapacitors ;
ii) Fastbus electronics for the storage of informationfrom the Cs! calorimeter; and
iii) digital information from the trigger system andvarious CAMAC modules.
The detector electronics is organized into "datacrates" as indicated in table 7. With each crate isassociated a microprogrammed controller which exe-cutes multiple instructions per clock cycle . The triggersystem generates a signal which interrupts both theon-line VAX-3200 and the data crate controllers. Thecontrollers for the analog devices have a fast ADC anda local memory for the storage of constants such aspedestals and time windows which allow us to suppresschannels that have no useful information. This sparsifi-cation has a different algorithm for each of the variousanalog systems. In the tracking devices (central driftchamber, vertex detector, precision tracker) the datastream consists of a cell ID, a time, and a charge . For
Y. Kubota et al. / The CLEO 11 detector
this triplet of data to be kept the time must be within aspecified window and the charge must be above acertain minimum. In the time-of-flight system the datastream has four entries: an address, two times, and acharge. For the quartet to be passed on, one of thethree variables must be within a specified range. Themuon system, which employs charge division, hastriplets of data consisting of an address and twocharges, this triplet is accepted if either of the twocharges is above a specified minimum value.
Upon receiving the event interrupt from the trigger,all the "analog" crates begin digitization in parallel,with a conversion time of 3 ps per channel; ~ . -, maxi-mum digitization time for a crate for each detectorelement is also shown in table 7. The sparsified datafor each crate is stored locally on the controller in abuffer RAM awaiting readout to the VAX-3200 . Inprinciple once the data is digitized the front end elec-tronics could be re-enabled. In practice the input elec-tronics, particularly for the tracking chambers, is sensi-tive to the crate controller clocking the data from itslocal memory to the on-line VAX-3200 and all cratesmust be digitized and read out before the re-enablingis performed. The controllers in the crates handlingdigital functions (trigger and CAMAC) prepare thedata for read back and load it into a local buffer RAM.As shown in table 7 the digital crates are ready quickly.
The CsI calorimeter analog data is transmitted toLeCroy Fastbus ADC cards which digitize the data in750 Ws . The data are then transferred to a sparsifier;this transfer takes 6 ms. Sparsification of the CsI datatakes less than I ms, leading to a total "ready time" for
Fig. 64. Schematic showing the flow of sparsification of the CA calorimeter data, as described in the text. On the first pass the hitlist memories are filled. On the second pass the data from the hit list cells are compared to the thresholds stored in the skim ram.

the calorimeter of 8 ms (see table 7). To get properresolution on 50 MeV photons, energies in CsI cells onthe order of 1 MeV must be kept if they are associatedwith a shower centre . The noise level in a cell istypically 600 keV, thus making it difficult to simplysparsify based on a single threshold; either too manycells would be kept, defeating the purpose of sparsify-ing, or too many cells needed for good resolutionwould be tossed out. Therefore we need two-dimen-sional sparsification (to look at nearest neighbours andnext-nearest neighbours of seed cells) and two passesof sparsification (since on the first pass we do not knowif a particular cell is a neighbour to a seed).
This procedure has been designed into a hardwaremodule called SPARXL; a schematic of SPARXL'soperation is shown in fig. 64 . The ADC information (13bits of data) and cell address (also 13 bits) come fromthe FASTBUS electronics. After a trigger, every crys-tal's pulse height is digitized and the ADC data areread into the raw data RAM. On the first pass, theADCvalue is compared with the seed threshold; if thecell qualifies as a seed, the addresses of its 24 neigh-bours (i .e .. a 5 x 5 array centred on the seed) arelooked up in the neighbour List RAM. The 25 hit listRAMS are then loaded with a logical TRUE. at theseaddresses (seed plus 24 neighbours). On the secondpass, the address generator simultaneously presentsthe same 13 bit address to the 25 hit list RAMs. theraw data RAM, and a skim RAM. This last memoryallows for each cell to have a different threshold to bekept as pza-t of the shower. If any of the 25 hit listRAMS hoe its memory location set TRUE. and theADC value from the raw data RAM exceeds the skimthreshold the address and data are put into the outputRAMs. The timing of the write clocks, the switchoverbetween passes, the cycling of addresses, and theevent-by-event clearing are all handled by the mi-crocode running in the SPARXL crate controller.
An on-line processor reads the data from the cratessequentially via a 16-bit bus (called YBUS) at a rate of1.5 MBytes/s, and places the data from each eventinto one of 32 buffers located in a dual-ported mem-ory. This FIFO buffer system consists of 1 MByte ofmemory in which we currently allocate 32 kBytes perevent. It is read asynchronously by the on-line data-log-ging process, which formats the data into sequentialZEBRA [41] records and writes them to disk. Thecrates s. ° addressed sequentially in the order that theynominally have data ready, as given in table 7 (time offlight first, CsI calorimeter last). The total readouttakes about 12 ms, after which the experiment is re-en-abled; hence the dead time incurred is 1 .2%/Hz. Thisdata bus is not a single cable since that cable would betoo long (requiring several repeaters) and would makefinding problem connections too difficult . Instead afan-out for the bus has been implemented 33 m from
Y. Kubota et al. / The CLEO !Idetector
8. Plans for the next few years
8.1. Upgrading the data acquisition system
Fig. 65. The CLEO Il bus scheme . The blocks labelled "CC"are crate controllers while "FO" is a fan-out for the YBUS.
the on-line computer which has six branches (see fig.65), therefore each branch has only a small number ofcrates attached to it and all the necessary amplificationdone in one location [42] .
As indicated in fig. 65 the VAX-3200 does notcommunicate with the YBUS directly but rather via aQBUS/YBUS interface . The data that has been readout of the crates is deposited in a dual port buffermemory to minimize dead time to the experiment . Alsoattached to the QBUS is another internal bus, denotedXBUS, which is used for setting high voltages, settingcalibration parameters, and many other hardware func-tions.
The existing data acquisition system of the CLEOdetector allows read out of the detector at a maximumrate of 10 Hz. This is limited by the on-line computerreading the event data from an intermediate_ memoryfile which can contain up to 32 events. Approximately100 ms are required to read out an event from thebuffer. At a trigger rate of 10 Hz, the detector live timeis approximately 88%. To put these numbers into con-text, one should keep in mind the hadronic crosssection at the T(4S) is 3.5 nb and CLEO typicallybegins data recording after beam filling with a luminos-ity of 1 .5 x 10;2/cm2/s . Hence, the hadronic eventrate at the beginning of a run at the T(4S) is 0.52 Hz .However, we read out many events in addition to thosefrom the hadronic cross section. There is much interestin studying T lepton decay and two photon physics.The trigger tagging of e+e---> T+,T_
and e+e - -,e + e -yy - e + e -
(hadrons)
events
requires
muchlooser trigger criteria because of the low multiplicity ofthese final states . Furthermore, one uses Bhabha and

muon pair events to help calibrate the detector. How-ever, these do not produce a major enhancement inour data acquisition needs since we can prescale themto reduce the rate at which we arc reading in the"calibration events ." (We have been prescaling theendcap Bhabha trigger by a factor of 30 .) Currently,our total trigger rate when recording data on the T(4S)is typically 6 Hz at the beginning of the run, and thedetector live time is 90%. Approximately 12% of thesetriggers are multi-pronged hadronic events with a visi-ble energy greater than 3.5 GeV, and 25% arc calibra-tion events. Therefore, the existing data acquisitionsystem is adequate.
However, we often want to search for new phenom-ena, which can only be done by running the detectorwith a looser trigger and not prescaling . Furthermore,we expect a luminosity increase of at least a factor twofrom CESR within the next few years. To handle thisincrease in luminosity it is critical to upgrade the rateat which we can acquire data. A new data acquisitionsystem, DAQ90, has been developed. The crate read-out system will be changed to reduce the detectorreadout dead time from 12 to 2 ms per event. The goalof the new system is to readout digitized events at ratesup to 50 Hz and to perform further rejection in soft-ware. This is accomplished by introducing point-to-point links between each crate and a central VME-based data sparsification and event formatting system.As each data item is digitized at the crate it is sent toits own dualported memory at the central system . FourMotorola 68040 processors empty the dualported mem-ories over VSB (VME sub-system bus) and sparsify thedata. A single 68040 then assembles the event frag-ments into an event record . This is then distributed toone of a set of DECstation 5000 computers where it isprocessed with code similar to our existing computerprogram, which allows event rejection and classifica-tion . We expect to enable more sophisticated eventselection prior to transferring the data into the on-linecomputer, which will provide an order of magnitudeincrease in our data acquisition capacity . We arepresently (June 1991) installing the DAQ90 system andwill start using it after the summer shutdown .
8.2. A future upgrade of the CLEO vertex detector
In order to significantly improve the vertexing capa-bility of the CLEO detector, it is necessary to furtherreduce the radius of the beam pipe, which is currently3.5 cm, compared to 5.5 cm in the CLEO I detector.The reduction in beam pipe radius led to an increasein background which must be minimized before thebeam pipe can be further reduced. Investigations indi-cated that the source of the background was, in roughlyequal measure, scattering of beam particles off residualgas upstream of the interaction region, and syn-chrotron radiation (SR). The source of the SR hitting
Y. Kuhota et al. / TheCLEO 11 detector
the beam pipe at the interaction region was found tobe reflections off of the wall of the vacuum chamber inthe bending magnet region of the machine upstream ofthe interaction region . It was proposed that moving thevacuum chamber in this region by 2 cm would result inthe SR that was hitting the IR being masked by anupstream flange . Subsequently, the vacuum chamberwas moved, and the SR evident in the CLEO detectorwas reduced. We arc now engaged in a program tounderstand and reduce the remaining beam gas back-ground .
There is a research-development effort in both sili-con and gas chamber detector which might be used in afuture vertex detector system . A beam test was per-formed at FNAL of a double sided silicon telescope[43] . 1 x 1 cm= prototype double sided detectors weremanufactured by Hammamatsu, and used with mi-croplex readout electronics based on the design usedfor the ALEPH detector at LEP. During the beam testthe detectors were successfully operated and read out,and the data indicated spatial resolutions of 20 pm,rms. There is not yet a detailed design for a smallerbeam pipe and a new vertex detector system but weanticipate being ready to install a 2 cm radius pipe withdouble sided silicon strip detectors by Spring 1994.
8.3. The physics program
Since the turn on in October 1989, we have accumu-lated 150 pb-' on the TOS), 15 pb-' on the T(1S),530 pb -' on the T(4S), 230 pb-' on the continuum 26MeV below the TOS), and 65 pb- ' above the T(4S).This data is being used to study T spectroscopy, charmand bottom decay, T lepton decay, and quark fragmen-tation . Although this is a significant data sample, toanswer the many questions related to these subjects weplan to record an additional 1 fb-' on the T(4S), 0.5fb -' below the TOS), and 0.1 fb -' on the T(1S) within the next two years. This will allow significant im-provement in tabulation of the B meson branchingfractions and better measurement of mixing and theCKM matrix elements . It will be interesting to see howmuch we learn with this new detector .
Acknowledgements
Design, construction and assembly of the CLEO IIdetector took place over a seven year time span, 1983to 1989 . During this time, we received enormous helpand advice from a wide array of technical profession-als. We wish to thank the experimental support staffsat each of the Universities who undertook major re-sponsibilities for building CLEO 11 . Design and con-struction of the calorimeter electronics was carried outthrough a coordinated effort between Cornell and Ohio
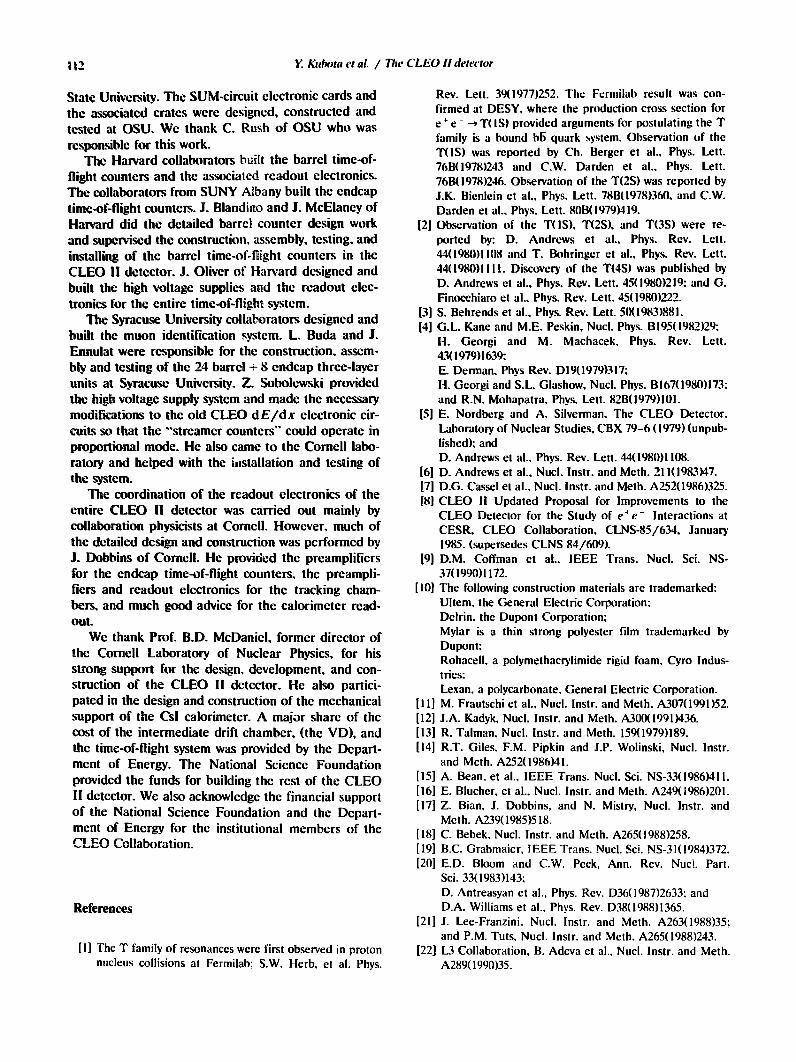
State University . The SUM-circuit electronic cards andthe associated crates were designed, constructed andtested at OSU. We thank C. Rush of OSU who wasresponsible for this work.
The Harvard collaborators built the barrel time-of-flight counters and the associated readout electronics.The collaborators from SUNY Albany built the endcaptime-of-flight counters. J . Blandino and J. McElaney ofHarvard did the detailed barrel counter design workand supervised the construction, assembly, testing, andinstalling of the barrel time-of-flight counters in theCLEO II detector. J . Oliver of Harvard designed andbuilt the high voltage supplies and the readout elec-tronics for the entire time-of-flight system.
The Syracuse University collaborators designed andbuilt the muon identification system . L. Buda and J .Ennulat were responsible for the construction, assem-bly and testing of the 24 barrel + 8 endcap three-layerunits at Syracuse University . Z . Sobolewski providedthe hi � voltage supply system and made the necessarymodifications to the old CLEO d E/d.r electronic cir-cuits so that the "streamer counters" could operate inproportional mode. He also came to the Cornell labo-ratory and helped with the nistallation and testing ofthe system.
The coordination of the readout electronics of theentire CLEO II detector was carried out mainly bycollaboration physicists at Cornell. However, much ofthe detailed design and construction was performed byJ . Dobbins of Cornell . He provided the preamplifiersfor the endcap time-of-flight counters, the preampli-fiers and readout electronics for the tracking cham-bers, and much good advice for the calorimeter read-out .We thank Prof. B.D. McDaniel, former director of
the Cornell Laboratory of Nuclear Physics, for hisstrong support for the design, development, and con-struction of the CLEO II detector. He also partici-pated in the design and construction of the mechanicalsupport of the CsI calorimeter . A major share of thecost of the intermediate drift chamber, (the VD), andthe time-of-flight system was provided by the Depart-ment of Energy. The National Science Foundationprovided the funds for building the rest of the CLEOII detector. We also acknowledge the financial supportof the National Science Foundation and the Depart-ment of Energy for the institutional members of theCLEO Collaboration.
References
[1] The T family of resonances were first observed in protonnucleus collisions at Fermilab; S.W . Herb, et al . Phys .
Y. Kculx)ta et al. / Thc" CLEO 11 detector
Rev. Lett . 39(1977)252 . The Fermilab result was con-firmed at DESY, where the production cross section fore + e - - T(1S) provided arguments for postulating the Tfamily is a bound b5 quark system . Observation of theTOS) was reported by Ch . Berger et al ., Phys . Lett .768(1978)243 and C.W. Darden et al ., Phys. Lett .76B(1978)246. Observation of the T(2S) was reported byJ.K. Bienlein et al., Phys. Lett . 78B(1978)360, and C.W.Darden et al ., Phys. Lett . 80B(1979)419,
[2] Observation of the TOS), TUS), and TOS) were re-ported by : D . Andrews et al., Phys . Rev. Lett.44(1980)1108 and T. Bohringer et al ., Phys . Rev. Lett .44(1980)1111 . Discovery of the T(4S) was published byD. Andrews et al ., Phys. Rev. Lett. 45(1980)219; and G.Finocchiaro et al ., Phys. Rev . Lett . 45(1980)222.
[3] S . Behrends et al ., Phys . Rev. Lett . 5(1(1983)881 .[4] G.L. Kane and M.E. Peskin, Nucl . Phys. 8195(1982)29 ;H . Georgi and M . Machacek, Phys . Rev. Lett .43(1979)1639 ;E . Derman, Phys Rev . 1319(1979)317;H . Georgi and S.L . Glashow, Nucl . Phys. 13167(1980)173;and R.N . Mohapatra, Phys . Lett . 82B(1979)101 .
[5] E. Nordberg and A. Silverman, The CLEO Detector,Laboratory of Nuclear Studies, CBX 79-6 (1979) (unpub-lished), andD. Andrews et al ., Phys. Rev. Lett. 44(1980)1108.
[61 D. Andrews et al ., Nucl . Instr . and Meth. 211(1983)47 .[7] D.G . Cassel et al ., Nucl . Instr. and Meth. A252(1986)325 .[8] CLEO Il Updated Proposal for Improvements to the
CLEO Detector for the Study of e'Fe - Interactions atCESR, CLEO Collaboration, CLNS-85/634, January1985 . (supersedes CLNS 84/609) .
[9] D.M . Coffman et al ., IEEE Trans . Nucl . Sci . NS-37(1990)1172.
[101 The following construction materials are trademarked:Ultem, the General Electric Corporation,Delrin, the Dupont Corporation ;Mylar is a thin strong polyester film trademarked byDupont;Rohacell, a polymethacrylimide rigid foam, Cyro Indus-tries,Lexan, a polycarbonate, General Electric Corporation .
[I 1 ] M . Frautschi et al., Nucl . Instr. and Meth . A307(1991)52 .[121 J.A. Kadyk, Nucl . Instr. and Meth. A300(1991)436.[13] R. Talman, Nucl . Instr . and Meth. 159(1979)189 .[141 R.T. Giles, F.M. Pipkin and J.P . Wolinski, Nucl . Instr .
and Meth . A252(1986)41 .[ 15] A . Bean, et a] ., IEEE Trans . Nucl . Sci . NS-33(1986)411 .[161 E . Blucher, et al ., Nucl . Instr. and Meth. A249(1986)201 .[17] Z . Bian, J . Dobbins, and N. Mistry, Nucl . Instr . and
Meth . A239(1985)518 .[181 C . Bebek, Nucl . Instr. and Meth . A265(1988)258 .[19] B.C. Grabmaier, IEEE Trans . Nucl. Sci, Ns-31(1984)372.[20] E.D. Bloom and C.W. Peck, Ann . Rev . Nucl . Part.
Sci . 33(1983)143 ;D . Antreasyan et al ., Phys. Rev . 1336(1987)2633 ; andD.A. Williams et al ., Phys . Rev . 1338(1988)1365 .
[21] J . Lee-Franzini, Nucl . Instr. and Meth . A263(1988)35 ;and P.M . Tuts, Nucl . Instr . and Meth . A265(1988)243 .
[22] L3 Collaboration, B . Adeva et al ., Nucl . Instr. and Meth .A2890990)35 .

[23] The gap at 0=90° does point directly at the nominalcollision vertex .
[24] The bulk of the thallium-doped Csl crystals for CLEO-IIwere manufactured by Horiba, Ltd, Kyoto, Japan. andBDH Chemicals, Ltd. . (now Merck Ltd.) Poole, England.About 100 endcap crystals were also supplied by each ofBicron Corp., Newbury. Ohio, and Harshaw/FiltrolCorp ., Solon, Ohio.
[25] The value of N is in general not an integer . the energycorresponding to the fractional part of N is taken as thatfraction of the next highest crystal's energy . For example,if N= 5.5, the cluster energy is taken as the sum of thehighest five crystals plus half of the sixth. This avoidsdiscrete jumps in shower energies which would occur ifN were required to be integral.
[26] The CERN detector-modeling software package knownas GÉANTforms the basis of the CLEO-II Monte Carlosimulation .
[27] Inclusive X(2P) Production in TOS) Decay. R. Morrison,et al ., Phys. Rev. Lett . 67(1991)1696.
[28] Angular resolution in the barrel crystals varies with theposition within a block, the resolution is much betternear a block boundary than near the center becausemore energy is shared with other crystals . For example.near the center (edge) of a block, the azimuthal resolu-tion is 3.8 mrad (2 .1 mrad) at 5 GeV and 14 mrad (5.7mrad) at 100 MeV. The values quoted in the text andfigure represent resolutions averaged over all angles .
[29] M. Narain et al.. Phys. Rev. Lett . 66(1991)3113.[30] R. Nernst et al., Phvs. Rev. Lett . 54(1985)2195.[31] D. Bortoletto et al., this issue, Nucl . Instr. and Meth.
A3200990114.[32] This quantity is called "nuclear interaction length" in the
Review of Particle Data of the Particle Data Group.[33] E. Iarocci, Nucl . Instr. and Meth . 217(1983)30.[34] From Costruzioni Meccaniche Bindi, San Giustino. PG,
Italy.
Y. Kahota et al. / The CLEO !I detector
[35] See Appendix A in ref. [31].[36] The signals are the start and stop of the time-of-flight
gate. the start and stop of the LO strobe, the hardwarereset, the strobe used to clock the readout bits in the CAcrystals trigger electronics pipeline, and two signals usedin calibrations.
[37] Diagrams for this and other components are availablefrom the LNS Drafting Room, Newman Laboratory. Cor-nell University, Ithaca. NY 14853, USA. The coarsetiming circuit is drawing 6044-33 and the 72 MHzphase-shifter circuit is on drawings 6044-99 (TTL out-puts) and 6044-115 (ECL outputs).
[38] R.E. Meller, IEEE Trans. Nucl. Sci. NS-26(1979)4152.The data shown in fig. 54a is averaged over the sevenbunches of positrons in CESR for one particular settingof the fine delay. Other settings of this delay producedistributions that have several such narrow peaks. withmeans between peaks varying up to 100 ps and each peakcorresponding to a particular subset of the seven bunches.Since we know with which bunch an event is associated,we can correct for this effect in software . if necessary.
[39] C. Bebek. et al ., Nucl . Instr. and Meth . A302(1991)261 .[40] The latches which form the trigger inputs from the track-
ing chambers are reset by an RC network which isenabled by this asynchronous reset signal . The time con-stant for this network to generate a reset is approxi-mately 500 ns.
[41] R. Brun and J. Zoll . CERNO-100. 1987. In order tominimize time spent formating, CERN ZEBRAcode wasnot used ; rather, code based on ZEBRA format waswritten for the CLEO-11 data structure.
[42] The circuit design for this fan-out is available, drawing6052-602. See ref. [37].
[43] J.P . Alexander et al.. Conference record of the 1990IEEE Nucl . Sci. Symp., Oct. 1990 (CLNS 90-1034) Vol.1, p. 766.