c interactive animation of cities over time paul c. dilorenzo, victor b. zordan, duong tran...
TRANSCRIPT

C
Interactive Animation Interactive Animation of Cities over Timeof Cities over Time
Paul C. DiLorenzo, Victor B. Zordan, Duong TranPaul C. DiLorenzo, Victor B. Zordan, Duong TranRiverside Graphics LabRiverside Graphics LabUniversity of California, RiversideUniversity of California, Riversidehttp://www.cs.ucr.edu/rglhttp://www.cs.ucr.edu/rgl

C
IntroductionIntroduction
• Cities are dynamic embodiments of the needs and wants of the population it holds
• Difficult problem to try to capture the dynamics of the city and present the information in an easy and intuitive way

C
Parts of a CityParts of a City
• Break down the city into primitive units– Central Business District (CBD)
• Economic heart of the city• Mostly commercial buildings in this area• Usually, have the tallest buildings
– Zoning Blocks• City block, or larger, area• Area assigned a zone type based on a city plan
– Residential, Commercial, municipal, and so on

C

C
BackgroundBackgroundComputer GraphicsComputer Graphics
• Cities– Capture data; Teller et al.
• http://city.lcs.mit.edu/city.html– Hand modeled; Hamill and O’Sullivan, 2003
– Procedural; Parish and Müller; 2001
• Building architecture– 3D models with photographs
• Jepson et al, 1995; Debevec et al, 1996; Ribarsky et al, 2002– Instant Architecture – Heuristic rules plus procedural
grammar; Wonka et al, 2003
• None of these efforts address the evolution of a city!

C
Problem StatementProblem Statement
• Animation– Two point boundary problem that only
manipulates the primitive units
• Solve using Citysack – Similar to the thief’s Knapsack problem

C
GoalsGoals
• Recreate the look and feel of a city growing, or decaying, over time
• Sociologically based
• Interactive
• Minimize the amount of inputs for the user

C
ApplicationsApplications
• Urban development and sociology– Play what-ifs– Determine what factors affect the growth and
development of their synthesized city
• Computer games and entertainment– Evolving cities

C
Models of Urban StructureModels of Urban Structure
• Burgess’ concentric zone model– Segregate land into business, manufacturing, and
residential usage– Cities grow radially in a series of concentric regions,
surrounding a central business district (CBD)

C
Models of Urban StructureModels of Urban Structure
• Hoyt’s sectoral model– Makes allowance for
growth along main arterial routes; highways and railways
– Cities develop in wedge-like sectors moving radially outward from the CBD
C
Models of Urban StructureModels of Urban Structure
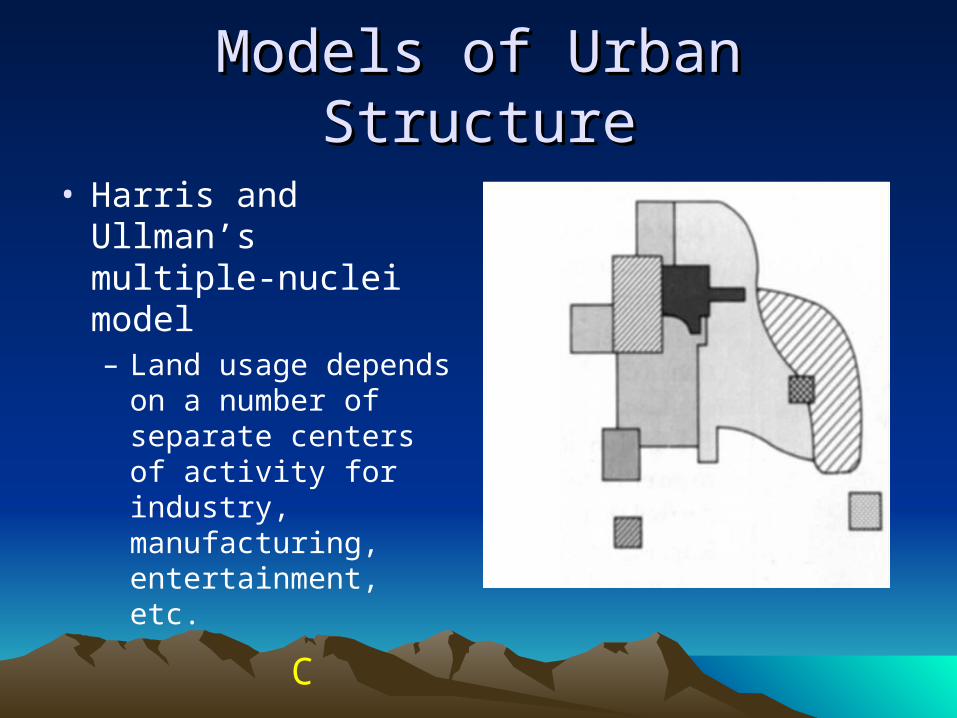
• Harris and Ullman’s multiple-nuclei model– Land usage depends
on a number of separate centers of activity for industry, manufacturing, entertainment, etc.

C
SolutionSolution

C
SolutionSolution
• Create a hierarchical model using the primitive units
CBD andother centers
Zoning Blocks... ... ...

C
Overview of SystemOverview of System
InputAnimate
City
Citysack
RenderBuildCity
Model

C
Overview of SystemOverview of System
InputAnimate
City
Citysack
RenderBuildCity
Model

C
Defining the ModelDefining the Model
• Zoning Unit• Zoning Types• Zoning usage
assigned based on percentages associated with the Burgess’ regions

C
Defining the ModelDefining the Model
• Density– Residential; Commercial– A key measure of land usage
• Maximum density based on fall-off curve

C
Building a Simple (static) CityBuilding a Simple (static) City
• Create empty (undeveloped) zones – Until the city’s area At, is met
• Develop zones randomly– Distance is weighted exponentially– Assign zoning usage and density
– Until the developed area, Ad, is met
• Make small, uniform corrections

C
DemoDemo
C
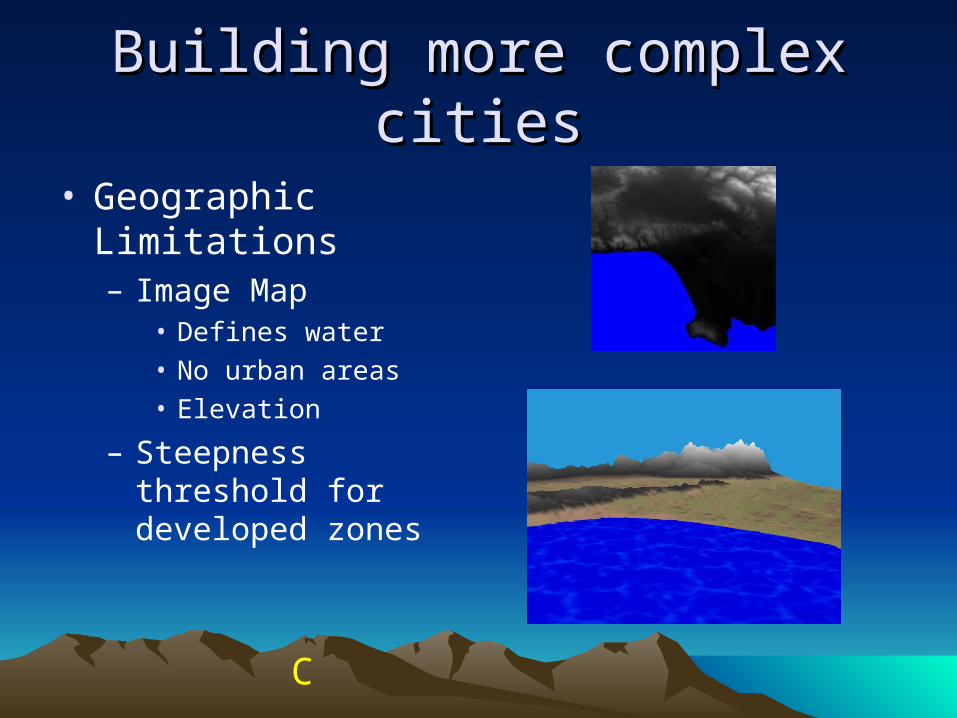
Building more complex citiesBuilding more complex cities
• Geographic Limitations– Image Map
• Defines water• No urban areas• Elevation
– Steepness threshold for developed zones

C
Building more complex citiesBuilding more complex cities
• Multiple Centers– Assign maximum densities, relative rates of
growth, and unique orientations– Zoning unit’s maximum density is the largest
maximum density of all centers

C
DemoDemo

C
Overview of SystemOverview of System
Input RenderBuild City
Model
AnimateCity
Citysack

C
Animate CityAnimate City
• User inputs – Number of years – Change in population, physical size of the city
• Two point-boundary problem– Current state and new state
• Creates a growth schedule for each year
• Sends yearly changes to Citysack

C
CitysackCitysack
• Map Citysack to Knapsack
• Knapsack
• Citysack

C
Solving CitysackSolving Citysack
• Generate new zones
• Develop randomly
• If city can hold new population, halt
• Else, redevelop– Solve using greedy approach– Solve using conservative approach– Update city based on approach with the
lowest cost

C
DemoDemo

C
Overview of SystemOverview of System
InputAnimate
City
Citysack
Build City
ModelRender
C
RenderingRendering
• Zones decomposed– density and zone type
• Height and number of buildings
C
DemoDemo

C
RenderingRendering
• Replaced buildings with commercial libraries
• Use zoning units to describe more about the city– Combine multiple zones
• Large parks
– Break down zones• Buildings• Houses• Trees

C

C
ConclusionConclusion
• Reduce city to primitive units
• Build city using these primitive units
• Simplify animating the city by adjusting the zoning blocks– Solve with a well known algorithm

C
Future WorkFuture Work
• Add roads– Main transportation networks
• Hoyt’s sectoral model
– Inner roads
• Visual appeal– People, traffic, etc…
• Added factors– Fire damage, demolition, vandalism

C
Thank you!!!Thank you!!!
C
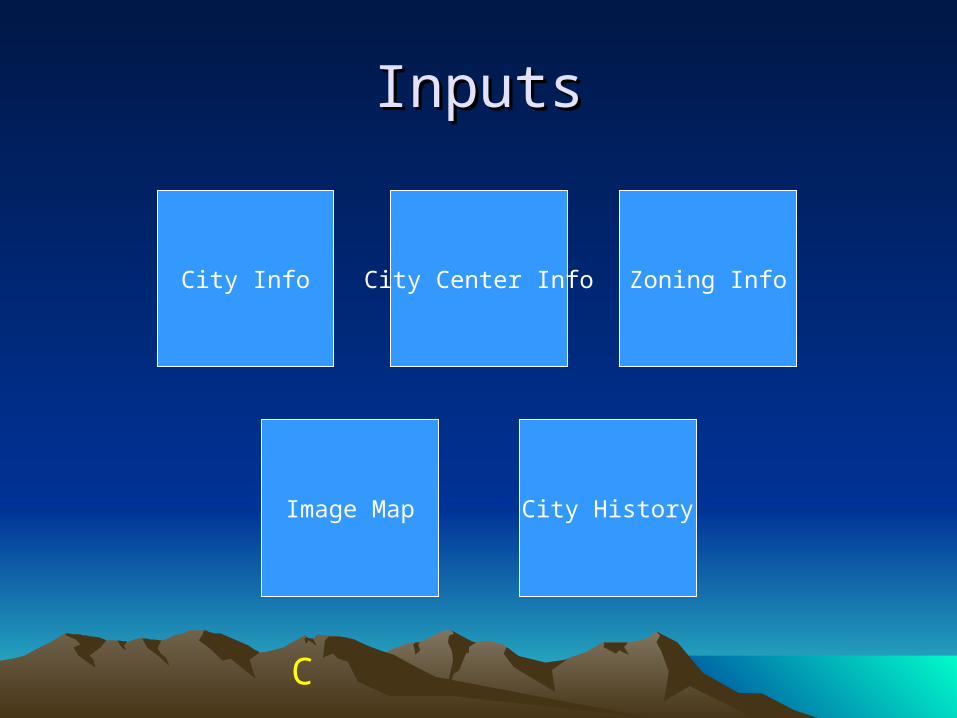
City Info City Center Info
Image Map
InputsInputs
City History
Zoning Info