c# numerical library chart programmer’s user guide · 2018-09-21 · 2 • imsl c# chart...
TRANSCRIPT

V E R S I O N 6 . 5
Chart Programmer’s User GuideC# Numerical Library
®

THIS RELEASE IS DEDICATED TO DR. JOHN F. BROPHY
1953‐2008
OUR MENTOR AND FRIEND WHOSE UNSELFISH EFFORTS WILL HAVE
A LASTING IMPACT ON THE IMSL PRODUCT LINE.
WE WERE BLESSED TO HAVE HAD JOHN AS A MEMBER OF OUR TEAM FOR 25 YEARS.
THE VISUAL NUMERICS PRODUCT DEVELOPMENT TEAM

IMSL Numerical Library V.6.5 Chart Programmer’s User Guide
Trusted for Over 35 Years
®

CORPORATE HEADQUARTERS Rogue Wave Software 5500 Flatiron Parkway Suite 200 Boulder, CO 80301 USA IMSL Libraries Contact Information USA Toll Free: 800.222.4675 T: 713.784.3131 F: 713.781.9260 Email: [email protected] Web site: www.vni.com
Worldwide Offices USA • UK • France • Germany • Japan For contact information, please visit www.vni.com/contact/worldwideoffices.php
© 1970-2010 Visual Numerics, Inc. All rights reserved. Visual Numerics, IMSL and PV-WAVE are registered trademarks of Visual Numerics, Inc. in the U.S. and other countries. JMSL, JWAVE, TS-WAVE, PyIMSL and Knowledge in Motion are trademarks of Visual Numerics, Inc. All other company, product or brand names are the property of their respective owners. IMPORTANT NOTICE: Information contained in this documentation is subject to change without notice. Use of this document is subject to the terms and conditions of a Visual Numerics Software License Agreement, including, without limitation, the Limited Warranty and Limitation of Liability. If you do not accept the terms of the license agreement, you may not use this documentation and should promptly return the product for a full refund. This documentation may not be copied or distributed in any form without the express written consent of Visual Numerics.
Embeddable mathematical and statistical algorithms available for C, C#/.NET, Java™, Fortran and Python applications

Table of Contents IMSL C# Chart Programmer’s User Guide • i
Table of Contents Preface 1
What’s in this Manual ................................................................................................................ 1 Contacting Visual Numerics Support ......................................................................................... 1
Chapter 1: Introduction – Chart 2D 4
Chart 2D ..................................................................................................................................... 4 Overview .................................................................................................................................... 4 Implicitly Created Nodes ........................................................................................................... 6 Adding a Chart to an Application .............................................................................................. 9
Chapter 2: Charting 2D Types 12
Chart Types .............................................................................................................................. 12 Scatter Plot ............................................................................................................................... 12
Simple Scatter Plot .................................................................................................... 13 Complex Scatter Plot ................................................................................................. 14
Line Plot ................................................................................................................................... 15 Simple Line Plot ........................................................................................................ 15 Mixed Line and Marker Plot ...................................................................................... 17
Area Plot .................................................................................................................................. 18 Simple Area Plot ........................................................................................................ 18 Painted Area Example ............................................................................................... 19 Attribute Reference .................................................................................................... 21
Function Plot ............................................................................................................................ 21 Example ..................................................................................................................... 21 Histogram Example ................................................................................................... 23 Spline Chart ............................................................................................................... 23
Log and SemiLog Plot ............................................................................................................. 24 SemiLog Plot ............................................................................................................. 24 Log-Log Plot .............................................................................................................. 26
Error Bar Plot ........................................................................................................................... 27 Vertical Error Bars ..................................................................................................... 27 Horizontal Error Bars ................................................................................................ 29 Mixed Error Bars ....................................................................................................... 30
High-Low-Close Plot ............................................................................................................... 32 Example ..................................................................................................................... 32
Candlestick Chart ..................................................................................................................... 34 Example ..................................................................................................................... 35
Pie Chart................................................................................................................................... 37 Example ..................................................................................................................... 38
Box Plot ................................................................................................................................... 40 Example ..................................................................................................................... 40

ii • IMSL C# Chart Programmer’s User Guide Table of Contents
Bar Chart .................................................................................................................................. 42 Simple Bar Chart ....................................................................................................... 42 Attribute BarGap ........................................................................................................ 44 Attribute BarWidth .................................................................................................... 44
Grouped Bar Chart ................................................................................................................... 44 Stacked Grouped Bar Chart ...................................................................................................... 45 Legend ...................................................................................................................................... 47 Contour Chart ........................................................................................................................... 48
Example ..................................................................................................................... 49 Heatmap ................................................................................................................................... 50
Example ..................................................................................................................... 51 Treemap ................................................................................................................................... 52
Example ..................................................................................................................... 52 Histogram ................................................................................................................................. 54
Example ..................................................................................................................... 54 Polar Plot .................................................................................................................................. 56
Example ..................................................................................................................... 57 Dendrogram Chart .................................................................................................................... 59
Example ..................................................................................................................... 59
Chapter 3: Quality Control and Improvement Charts 64
Introduction .............................................................................................................................. 64 Shewhart Charts ....................................................................................................................... 64 Variable Control Charts: .......................................................................................................... 66 Attribute Control Charts: .......................................................................................................... 67 Other Control Charts ................................................................................................................ 67 Process Improvement Charts .................................................................................................... 67 ShewhartControlChart and ControlLimit ................................................................................. 67 XbarS and SChart ..................................................................................................................... 70
XbarS Example .......................................................................................................... 70 SChart Example ......................................................................................................... 72 XbarSCombo Example .............................................................................................. 74 XbarSUnequal Example ............................................................................................. 76
XbarR and RChart .................................................................................................................... 78 XbarR Example .......................................................................................................... 79
XbarRCombo Example ............................................................................................................ 81 XmR ......................................................................................................................................... 82
XmR Example............................................................................................................ 83 PChart ...................................................................................................................................... 84
PChart Example ......................................................................................................... 84 PChartUnequal Example ............................................................................................ 86
NpChart .................................................................................................................................... 87 NpChart Example ...................................................................................................... 88
CChart ...................................................................................................................................... 89 CChart Example ......................................................................................................... 89 CChartOmit Example................................................................................................. 91
UChart ...................................................................................................................................... 92 UChart Example ........................................................................................................ 93 UChartUnequal Example ........................................................................................... 94
EWMA ..................................................................................................................................... 96 EWMA Example ........................................................................................................ 96

Table of Contents IMSL C# Chart Programmer’s User Guide • iii
CuSum ..................................................................................................................................... 98 CuSum Example ........................................................................................................ 98
CuSumStatus .......................................................................................................................... 100 CuSumStatus Example ............................................................................................ 100
Pareto Chart ........................................................................................................................... 102 ParetoChart Example ............................................................................................... 102
Cumulative Probability .......................................................................................................... 104 CumulativeProbability Example .............................................................................. 104
Chapter 4: Drawing Elements 108
Chart 2D Drawing Elements .................................................................................................. 108 Line Attributes ....................................................................................................................... 108
Attribute LineColor ................................................................................................. 108 Attribute LineWidth ................................................................................................. 108 Attribute LineDashPattern ....................................................................................... 109 Samples .................................................................................................................... 109
Marker Attributes ................................................................................................................... 109 Attribute MarkerType .............................................................................................. 109 Attribute MarkerColor ............................................................................................. 110 Attribute MarkerSize ............................................................................................... 110 Attribute MarkerThickness ...................................................................................... 111 Attribute MarkerDashPattern ................................................................................... 111 Samples .................................................................................................................... 111
Fill Area Attributes ................................................................................................................ 111 FillOutlineType........................................................................................................ 111 FillOutlineColor ....................................................................................................... 112 FillType ................................................................................................................... 112 FillColor................................................................................................................... 112 Gradient ................................................................................................................... 112
FillPaint .................................................................................................................................. 113 Text Attributes ....................................................................................................................... 114
Attribute Font .......................................................................................................... 114 Attribute FontName ................................................................................................. 114 Attribute FontSize .................................................................................................... 115 Attribute FontStyle .................................................................................................. 115 Attribute TextAngle ................................................................................................. 115 Attribute TextColor ................................................................................................. 115 Attribute TextFormat ............................................................................................... 115 Attribute TextFormatProvider ................................................................................. 115 Attribute Title .......................................................................................................... 115 Samples .................................................................................................................... 116
Labels ..................................................................................................................................... 117 Attribute LabelType ................................................................................................. 117 Data Point Labeling Example .................................................................................. 117 Annotation ............................................................................................................... 119
AxisXY .................................................................................................................................. 121 Axis Layout ............................................................................................................. 122 Transform ................................................................................................................ 124
iv • IMSL C# Chart Programmer’s User Guide Table of Contents
Autoscale ................................................................................................................. 125 Axis Label .............................................................................................................................. 126 Axis Title................................................................................................................................ 126 Axis Unit ................................................................................................................................ 129 Major and Minor Tick Marks ................................................................................................. 131 Grid ........................................................................................................................................ 133 Custom Transform ................................................................................................................. 135 Multiple Axes ......................................................................................................................... 138
Cross Example ......................................................................................................... 140 Background ............................................................................................................................ 142
Solid Color Background .......................................................................................... 142 Gradient Color Background ..................................................................................... 144 Pattern Background .................................................................................................. 145
Legend .................................................................................................................................... 146 Simple Legend Example .......................................................................................... 146 Legend Example ...................................................................................................... 148
Colormaps .............................................................................................................................. 150 Tool Tips ................................................................................................................................ 151
Example ................................................................................................................... 151
Chapter 5: Actions 154
IMSL C# Numerical Libraries ............................................................................................... 154 Picking ................................................................................................................................... 154
Example ................................................................................................................... 154 Zoom ...................................................................................................................................... 156
Example ................................................................................................................... 156 Printing ................................................................................................................................... 161
Printing from FrameChart ........................................................................................ 161 Printable Interface .................................................................................................... 162
Appendix A: Web Server Application 164
Appendix B: Writing a Chart as a Bitmap Image 166
Using the ImageIO class ........................................................................................................ 166
Appendix C: Picture-in-Picture 170
Index 175

Preface IMSL C# Chart Programmer’s User Guide • 1
Preface
What’s in this Manual The IMSL C# Numerical Library Chart Programmer’s Guide explains how to create 2D charting with the IMSL C# Numerical Library.
Chart 2D contains the following sections: Provides an overview of the scope of the most commonly used 2D charting classes. .......................... Introduction - Chart2D Describes the IMSL C# Library 2D Charts. ....... Charting 2D Types Quality Control Charts. ... Quality Control and Improvement Charts Discusses the IMSL C# Library chart drawing elements. ......................................... 2D Drawing Elements Discusses actions available in 2D charting. ........................ Actions
Appendices: Describes IMSL C# and web servlets ........ Web Server Application Describes the ways to save bitmap images.................... Writing a Chart as a Bitmap Image File Describes the picture-in-picture effects. .............. Picture-in-Picture
Contacting Visual Numerics Support Users within support warranty may contact Visual Numerics, Inc.regarding the use of the IMSL C# Numerical Library. Visual Numerics, Inc. can consult on the following topics:
• Clarity of documentation
• Possible Visual Numerics-related programming problems
• Choice of IMSL Numerical Libraries functions or procedures for a particular problem
Not included in these topics are mathematical/statistical consulting and debugging of your program.
Refer to the following for the IMSL Libraries Technical Support:
• http://www.vni.com/tech/imsl/index.php
The following describes the procedure for consultation with Visual Numerics:
2 • IMSL C# Chart Programmer’s User Guide Preface
• Include your Visual Numerics license number
• Include the product name and version number: IMSL C# Numerical Library Version 6.5
• Include compiler and operating system version numbers
• Include the name of the class for which assistance is needed and a description of the problem


4 • IMSL C# Chart Programmer’s User Guide Chapter 1: Introduction – Chart 2D
Chapter 1: Introduction – Chart 2D
Chart 2D The IMSL C# Numerical Library Chart Programmer User’s Guide is an overview and discussion of the IMSL C# Numerical Library charting package. It is intended to be used in conjunction with the online Reference Manual.
This guide is both an introductory tutorial on the charting package and a “cookbook” for creating common chart types. The Reference Manual contains the complete details of the classes.
NOTE: Charts in the printed version of this manual appear in black and white. If you are reading this manual in print and wish to see the charts in color, please open the Acrobat Reader file: /manual/WordDocuments/chartpg.pdf.
If you do not have Acrobat Reader installed on your machine, you can download it for free at: http://get.adobe.com/reader/.
Or you may also view the Guide in color from our Web site at: http://www.vni.com/products/imsl/documentation/index.php#imslcnumlib65 .
Overview The IMSL C# Numerical Library chart package is designed to allow the creation of highly customizable charts using any .NET language. An IMSL C# Numerical Library chart is created by assembling ChartNodes into a tree. This chart tree is then rendered to the screen or printer.
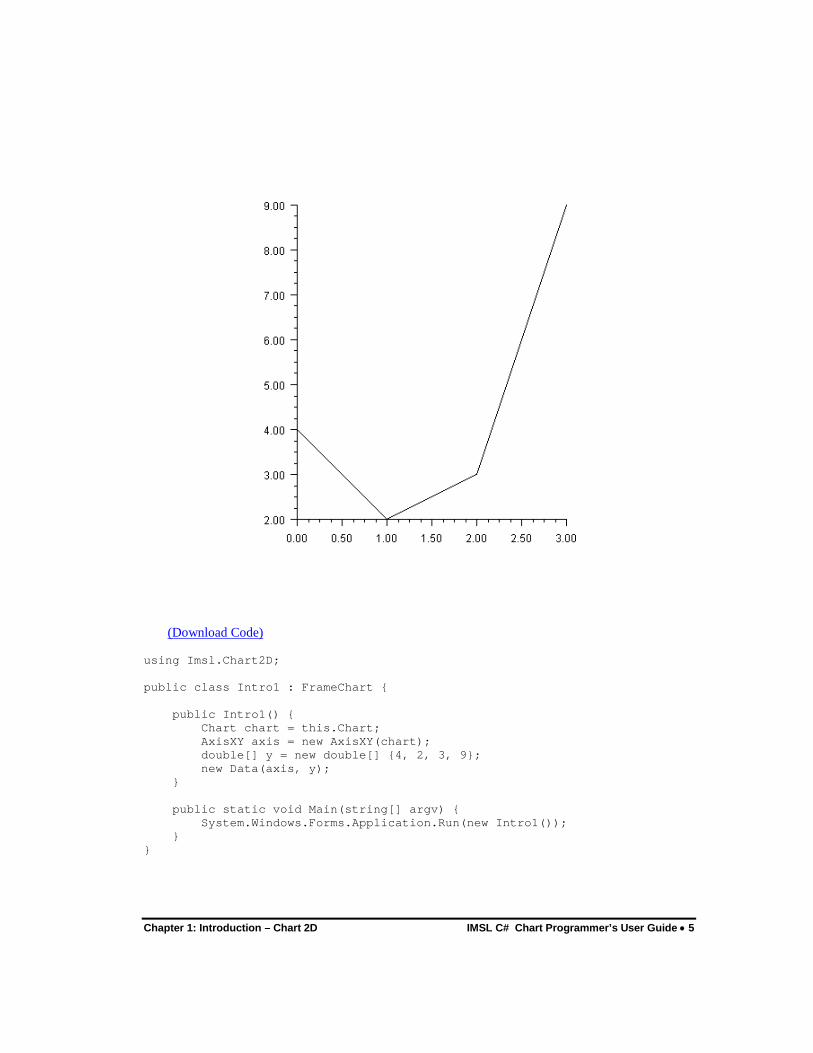
The following class is a simple example of the use of the IMSL C# Numerical Library chart package. The chart is displayed in a Windows.Forms.Form. The code to create the chart is all in the constructor. The IMSL C# Numerical Library class FrameChart extends the .NET class Form and creates a Chart object.
Chapter 1: Introduction – Chart 2D IMSL C# Chart Programmer’s User Guide • 5
(Download Code) using Imsl.Chart2D; public class Intro1 : FrameChart { public Intro1() { Chart chart = this.Chart; AxisXY axis = new AxisXY(chart); double[] y = new double[] {4, 2, 3, 9}; new Data(axis, y); } public static void Main(string[] argv) { System.Windows.Forms.Application.Run(new Intro1()); } }
6 • IMSL C# Chart Programmer’s User Guide Chapter 1: Introduction – Chart 2D
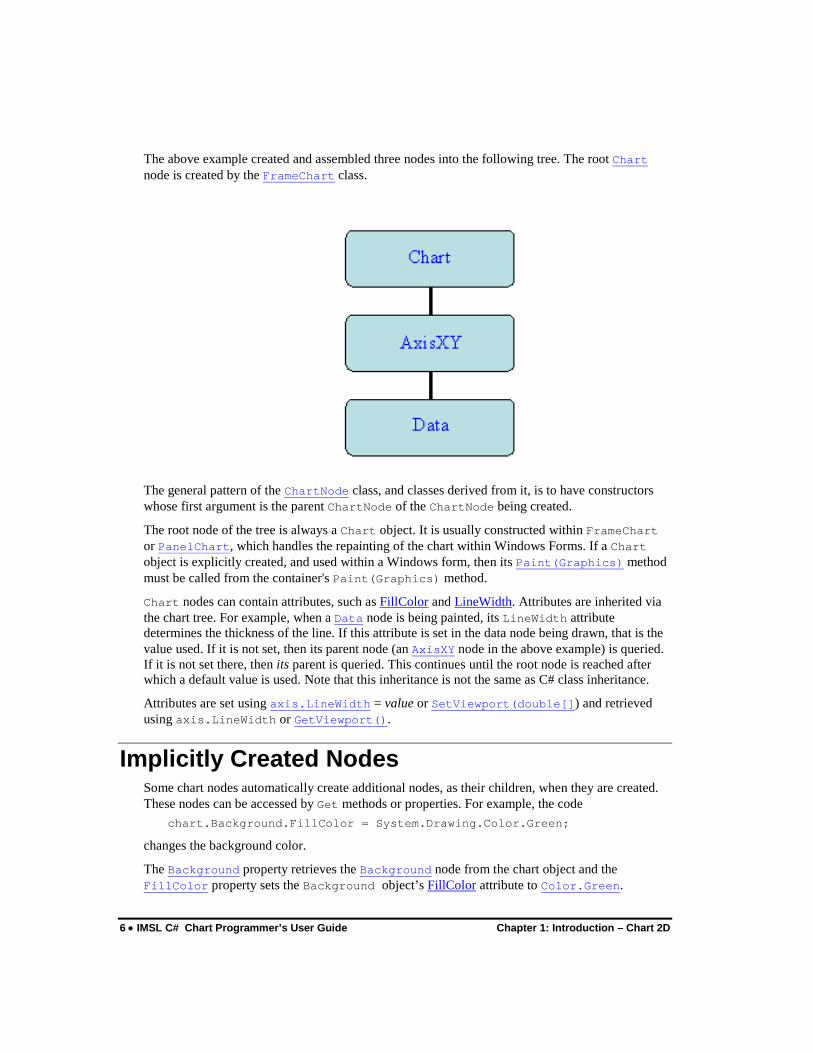
The above example created and assembled three nodes into the following tree. The root Chart node is created by the FrameChart class.
The general pattern of the ChartNode class, and classes derived from it, is to have constructors whose first argument is the parent ChartNode of the ChartNode being created.
The root node of the tree is always a Chart object. It is usually constructed within FrameChart or PanelChart, which handles the repainting of the chart within Windows Forms. If a Chart object is explicitly created, and used within a Windows form, then its Paint(Graphics) method must be called from the container's Paint(Graphics) method.
Chart nodes can contain attributes, such as FillColor and LineWidth. Attributes are inherited via the chart tree. For example, when a Data node is being painted, its LineWidth attribute determines the thickness of the line. If this attribute is set in the data node being drawn, that is the value used. If it is not set, then its parent node (an AxisXY node in the above example) is queried. If it is not set there, then its parent is queried. This continues until the root node is reached after which a default value is used. Note that this inheritance is not the same as C# class inheritance.
Attributes are set using axis.LineWidth = value or SetViewport(double[]) and retrieved using axis.LineWidth or GetViewport().
Implicitly Created Nodes Some chart nodes automatically create additional nodes, as their children, when they are created. These nodes can be accessed by Get methods or properties. For example, the code
chart.Background.FillColor = System.Drawing.Color.Green;
changes the background color.
The Background property retrieves the Background node from the chart object and the FillColor property sets the Background object’s FillColor attribute to Color.Green.

Chapter 1: Introduction – Chart 2D IMSL C# Chart Programmer’s User Guide • 7
In the following diagram, the nodes automatically created are shown in light green (to view in color see the online documentation).
Method calls and property references can be chained together. For example, the following sets the thickness of the major tick marks on the x-axis:
axis.AxisX.MajorTick.LineWidth = 2.0;
where axis is an AxisXY object.
A customized version of the above chart can be obtained by changing its constructor as in the following:

8 • IMSL C# Chart Programmer’s User Guide Chapter 1: Introduction – Chart 2D
(Download Code) using Imsl.Chart2D; public class Intro2 : FrameChart { public Intro2() { Chart chart = this.Chart; AxisXY axis = new AxisXY(chart); double[] y = new double[] {4, 2, 3, 9}; new Data(axis, y); chart.Background.FillColor = System.Drawing.Color.Lime; axis.AxisX.MajorTick.LineWidth = 2.0;

Chapter 1: Introduction – Chart 2D IMSL C# Chart Programmer’s User Guide • 9
} public static void Main(string[] argv) { System.Windows.Forms.Application.Run(new Intro2()); } }
Adding a Chart to an Application For simplicity, most of the examples in this manual use the FrameChart class. FrameChart is useful for quickly building an application that is a chart. The class PanelChart is used to build a chart into a larger application. It extends .NET’s Windows.Forms.Panel class and can be used wherever a Panel can be used. The following code shows a PanelChart being created, added to a Form, which contains the Chart hierarchy. (The generated chart is very similar to that shown at the beginning of this chapter.)
(Download Code)
using Imsl.Chart2D;

10 • IMSL C# Chart Programmer’s User Guide Chapter 1: Introduction – Chart 2D
public class SamplePanel : System.Windows.Forms.Form { private PanelChart panelChart; public SamplePanel() { panelChart = new PanelChart(); panelChart.Dock = System.Windows.Forms.DockStyle.Fill; this.Controls.Add(panelChart); Chart chart = panelChart.Chart; AxisXY axis = new AxisXY(chart); double[] y = new double[] {4, 2, 3, 9}; new Data(axis, y); } public static void Main(string[] argv) { System.Windows.Forms.Application.Run(new SamplePanel()); } }


12 • IMSL C# Chart Programmer’s User Guide Chapter 2: Charting 2D Types
Chapter 2: Charting 2D Types
Chart Types This chapter describes these IMSL C# Numerical Library charting types:
• “Scatter Plot” on page 12
• “Line Plot” on page 15
• “Area Plot” on page 18
• “Function Plot” on page 21
• “Log and SemiLog Plot” on page 24
• “Error Bar Plot” on page 27
• “High-Low-Close Plot” on page 32
• “Candlestick Chart” on page 34
• “Pie Chart” on page 37
• “Box Plot” on page 40
• “Bar Chart” on page 42
• “Contour Chart” on page 48
• “Heatmap” on page 50
• “Treemap” on page 52
• “Histogram” on page 54
• “Polar Plot” on page 56
• “Dendrogram Chart” on page 59
Scatter Plot This section describes the construction of scatter plots. The markers can be formatted using the Marker Attributes.
It is also possible to mix lines and markers (see “Mixed Line and Marker Plot” on page 17).
Chapter 2: Charting 2D Types IMSL C# Chart Programmer’s User Guide • 13
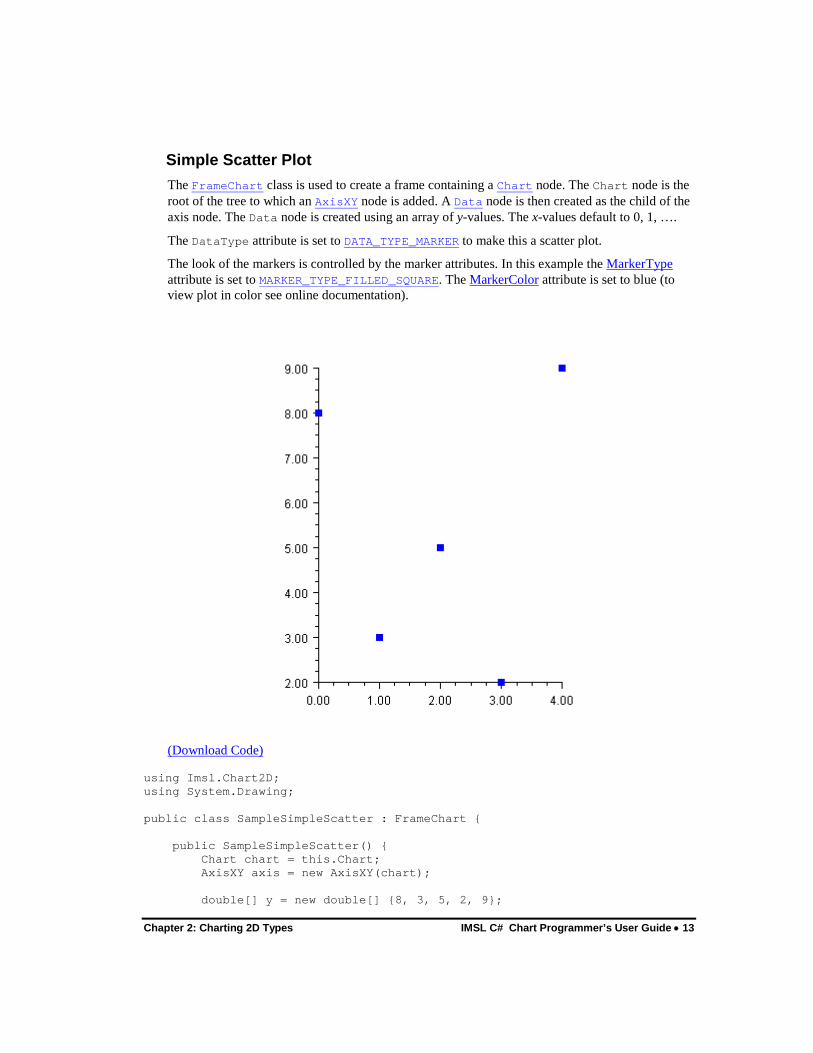
Simple Scatter Plot The FrameChart class is used to create a frame containing a Chart node. The Chart node is the root of the tree to which an AxisXY node is added. A Data node is then created as the child of the axis node. The Data node is created using an array of y-values. The x-values default to 0, 1, ….
The DataType attribute is set to DATA_TYPE_MARKER to make this a scatter plot.
The look of the markers is controlled by the marker attributes. In this example the MarkerType attribute is set to MARKER_TYPE_FILLED_SQUARE. The MarkerColor attribute is set to blue (to view plot in color see online documentation).
(Download Code) using Imsl.Chart2D; using System.Drawing; public class SampleSimpleScatter : FrameChart { public SampleSimpleScatter() { Chart chart = this.Chart; AxisXY axis = new AxisXY(chart); double[] y = new double[] {8, 3, 5, 2, 9};

14 • IMSL C# Chart Programmer’s User Guide Chapter 2: Charting 2D Types
Data data1 = new Data(axis, y); data1.DataType = Data.DATA_TYPE_MARKER; data1.MarkerType = Data.MARKER_TYPE_FILLED_SQUARE; data1.MarkerColor = Color.Blue; } public static void Main(string[] argv) { System.Windows.Forms.Application.Run(new SampleSimpleScatter()); } }
Complex Scatter Plot This example shows a scatter plot with two data sets. The Data nodes are created using random y-values generated by Random. The x-values default to 0, 1, ….
The axes are labeled by setting the AxisTitle attribute for the x and y axes.
The DataType attribute is set in the axis node (axis.DataType = Data.DATA_TYPE_MARKER;). The axis node does not itself use this attribute, but from there it is inherited by the child Data nodes.
Chapter 2: Charting 2D Types IMSL C# Chart Programmer’s User Guide • 15
(Download Code) using Imsl.Chart2D; using System.Drawing; using Imsl.Stat; public class SampleScatter : FrameChart { public SampleScatter() { Random r = new Random(123457); Chart chart = this.Chart; AxisXY axis = new AxisXY(chart); axis.AxisX.AxisTitle.SetTitle("X Axis"); axis.AxisY.AxisTitle.SetTitle("Y Axis"); axis.DataType = Data.DATA_TYPE_MARKER; // Data set 1 double[] y1 = new double[20]; for (int k = 0; k < y1.Length; k++) y1[k] = r.NextDouble(); Data data1 = new Data(axis, y1); data1.MarkerType = Data.MARKER_TYPE_FILLED_SQUARE; data1.MarkerColor = Color.Green; // Data set 2 double[] y2 = new double[20]; for (int k = 0; k < y2.Length; k++) y2[k] = r.NextDouble(); Data data2 = new Data(axis, y2); data2.MarkerType = Data.MARKER_TYPE_PLUS; data2.MarkerColor = Color.Blue; } public static void Main(string[] argv) { System.Windows.Forms.Application.Run(new SampleScatter()); } }
Line Plot A line plot consists of points by lines. The lines can be formatted using the “Line Attributes” on page 108.
Simple Line Plot This example shows a simple line plot. The Data node is created using an array of y-values. The x-values default to 0, 1, …. The DataType attribute is set to DATA_TYPE_LINE to make this a line chart. The look of the line is controlled by the line attributes. Here the LineColor attribute is set to blue.

16 • IMSL C# Chart Programmer’s User Guide Chapter 2: Charting 2D Types
(Download Code) using Imsl.Chart2D; using System.Drawing; public class SampleSimpleLine : FrameChart { public SampleSimpleLine() { Chart chart = this.Chart; AxisXY axis = new AxisXY(chart); double[] y = new double[] {8, 3, 5, 2, 9}; Data data1 = new Data(axis, y); data1.DataType = Data.DATA_TYPE_LINE; data1.LineColor = Color.Blue; } public static void Main(string[] argv) { System.Windows.Forms.Application.Run(new SampleSimpleLine()); } }

Chapter 2: Charting 2D Types IMSL C# Chart Programmer’s User Guide • 17
Mixed Line and Marker Plot The DataType attribute can be set using “or” syntax to combine types. In this example, it is set to DATA_TYPE_LINE | DATA_TYPE_MARKER. This example also explicitly sets both the x-value and the y-value of the data points. Note that the x-values do not have to be uniformly spaced.
(Download Code) using Imsl.Chart2D; using System.Drawing; public class SampleLineMarker : FrameChart { public SampleLineMarker() { Chart chart = this.Chart; AxisXY axis = new AxisXY(chart); double[] x = new double[] {1, 3, 4, 5, 9}; double[] y = new double[] {8, 3, 5, 2, 9}; Data data1 = new Data(axis, x, y); data1.DataType = Data.DATA_TYPE_LINE | Data.DATA_TYPE_MARKER; data1.LineColor = Color.Blue; data1.MarkerColor = Color.Red;

18 • IMSL C# Chart Programmer’s User Guide Chapter 2: Charting 2D Types
data1.MarkerType = Data.MARKER_TYPE_FILLED_SQUARE; } public static void Main(string[] argv) { System.Windows.Forms.Application.Run(new SampleLineMarker()); } }
Area Plot Area plots are similar to line plots, but with the area between the line and a reference line filled in. An area plot is created if the DATA_TYPE_FILL bit is on in the value of the DataType attribute. The default reference line is y = 0. The location of the reference line can be changed from 0 by setting the Reference property. The Fill Area Attributes determine how the area is filled.
Simple Area Plot This example draws a simple area plot. The default value of the FillType attribute is FILL_TYPE_SOLID. The example sets the FillColor attribute to Color.Blue. So the area between the line y = 0 is solid blue
Chapter 2: Charting 2D Types IMSL C# Chart Programmer’s User Guide • 19
(Download Code) using Imsl.Chart2D; using System.Drawing; public class SampleArea : FrameChart { public SampleArea() { Chart chart = this.Chart; AxisXY axis = new AxisXY(chart); double[] y = new double[] {4, -6, 2, 1, -8}; Data data1 = new Data(axis, y); data1.DataType = Data.DATA_TYPE_FILL; data1.FillColor = Color.Blue; } public static void Main(string[] argv) { System.Windows.Forms.Application.Run(new SampleArea()); } }
Painted Area Example This example shows an area chart filled in with a painted texture. The texture is created by a static method FillPaint.Crosshatch.
A second data set is plotted as a set of markers.
The Legend node is painted in this example and has entries for both the filled area data set and the marker data set.

20 • IMSL C# Chart Programmer’s User Guide Chapter 2: Charting 2D Types
(Download Code)
using Imsl.Chart2D; using System.Drawing; public class SampleAreaPaint : FrameChart { public SampleAreaPaint() { Chart chart = this.Chart; AxisXY axis = new AxisXY(chart); chart.Legend.IsVisible = true; double[] y = new double[] {4, -6, 2, 1, -8}; Data data1 = new Data(axis, y); data1.SetTitle("Area"); data1.DataType = Data.DATA_TYPE_FILL; data1.FillType = Data.FILL_TYPE_PAINT; data1.SetFillPaint(FillPaint.Crosshatch( 10, 5, Color.Red, Color.Yellow)); double[] y2 = {5, -3, 6, -7, 2}; Data data2 = new Data(axis, y2); data2.SetTitle("Marker"); data2.DataType = Data.DATA_TYPE_MARKER; data2.MarkerColor = Color.Blue; data2.MarkerType = Data.MARKER_TYPE_FILLED_CIRCLE; }

Chapter 2: Charting 2D Types IMSL C# Chart Programmer’s User Guide • 21
public static void Main(string[] argv) { System.Windows.Forms.Application.Run(new SampleAreaPaint()); } }
Attribute Reference The attribute Reference defines the reference line. If its value is a, then the reference line is y = a. Its default value is 0.
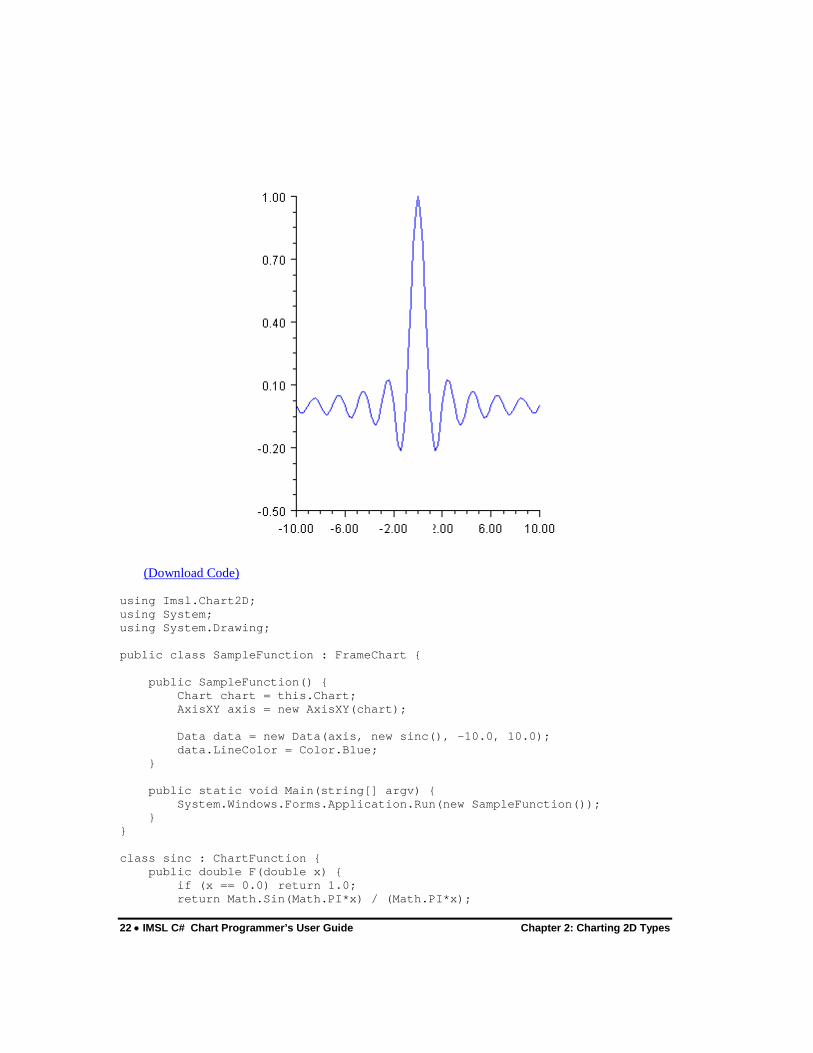
Function Plot A function plot shows the value of a function f(x) over an interval [a,b]. The function must be defined as an implementation of the ChartFunction interface. A Data node constructor creates a line chart from the function. The look of the function is controlled by the line attributes.
The ChartFunction interface requires that the function name be "F", that the function has a single double argument and that it returns a double.
Example This example plots the sinc function on the interval [-10,10]. The sinc function is defined to be sin(πx)/πx. In this example, Sinc is a class that implements ChartFunction. This is required by the function Data constructor. In the code, the case x = 0 is handled specially to avoid returning NaN.
22 • IMSL C# Chart Programmer’s User Guide Chapter 2: Charting 2D Types
(Download Code) using Imsl.Chart2D; using System; using System.Drawing; public class SampleFunction : FrameChart { public SampleFunction() { Chart chart = this.Chart; AxisXY axis = new AxisXY(chart); Data data = new Data(axis, new sinc(), -10.0, 10.0); data.LineColor = Color.Blue; } public static void Main(string[] argv) { System.Windows.Forms.Application.Run(new SampleFunction()); } } class sinc : ChartFunction { public double F(double x) { if (x == 0.0) return 1.0; return Math.Sin(Math.PI*x) / (Math.PI*x);

Chapter 2: Charting 2D Types IMSL C# Chart Programmer’s User Guide • 23
} }
Histogram Example For another example of a ChartFunction, see Histogram" on page 54.
Spline Chart This example shows raw data points, as markers, and their fit to a shape preserving spline. The spline is computed using CsShape found in the IMSL C# Numerical Library Math namespace (which extends Spline). The ChartSpline class wraps the Spline into a ChartFunction. This example also enables the Legend.
(Download Code) using Imsl.Chart2D; using Imsl.Math; using System.Drawing; public class SampleSpline : FrameChart { public SampleSpline() { Chart chart = this.Chart;

24 • IMSL C# Chart Programmer’s User Guide Chapter 2: Charting 2D Types
AxisXY axis = new AxisXY(chart); chart.Legend.IsVisible = true; double[] x = {0, 1, 2, 3, 4, 5, 8, 9, 10}; double[] y = {1.0, 0.8, 2.4, 3.1, 4.5, 5.8, 6.2, 4.9, 3.7}; Data dataMarker = new Data(axis, x, y); dataMarker.SetTitle("Data"); dataMarker.DataType = Data.DATA_TYPE_MARKER; dataMarker.MarkerType = Data.MARKER_TYPE_FILLED_CIRCLE; CsShape spline = new CsShape(x, y); Data dataSpline = new Data(axis, new ChartSpline(spline), 0.0, 10.0); dataSpline.SetTitle("Fit"); dataSpline.LineColor = Color.Blue; } public static void Main(string[] argv) { System.Windows.Forms.Application.Run(new SampleSpline()); } }
Log and SemiLog Plot In a semilog plot the y-axis is logarithmically scaled, while the x-axis is linearly scaled. In a log-log plot both axes are logarithmically scaled.
SemiLog Plot In this example, data is plotted as lines and markers on a semilog axis.
To set up the y-axis as a logarithmic axis:
• the Transform attribute is set to TRANSFORM_LOG.
• the Density on page 124 attribute is set to 9. Density is the number of minor ticks between major ticks. It is 9 because base 10 is used and the major tick marks are not counted.
The TextFormat, used by AxisLabel, is changed to use scientific notation (see “Text Attributes”). The default decimal format would result in large numbers written with many zeros.

Chapter 2: Charting 2D Types IMSL C# Chart Programmer’s User Guide • 25
(Download Code)
using Imsl.Chart2D; using System.Drawing; public class SampleSemiLog : FrameChart { public SampleSemiLog() { Chart chart = this.Chart; AxisXY axis = new AxisXY(chart); axis.AxisY.Transform = Axis.TRANSFORM_LOG; axis.AxisY.Density = 9; axis.AxisY.TextFormat = "0.E0"; double[] y = new double[] {4e2, 6e6, 2e3, 1e4, 8e1}; Data data1 = new Data(axis, y); data1.DataType = Data.DATA_TYPE_LINE | Data.DATA_TYPE_MARKER; data1.LineColor = Color.Blue; data1.MarkerType = Data.MARKER_TYPE_FILLED_SQUARE; } public static void Main(string[] argv) { System.Windows.Forms.Application.Run(new SampleSemiLog()); } }

26 • IMSL C# Chart Programmer’s User Guide Chapter 2: Charting 2D Types
Log-Log Plot A log-log plot is set up similarly as a semilog plot, except that the changes must be made to both the x-axis and the y-axis. In this example, the changes are made to the axis node and inherited by both the x and y-axis nodes.
(Download Code) using Imsl.Chart2D; using System.Drawing; public class SampleLogLog : FrameChart { public SampleLogLog() { Chart chart = this.Chart; AxisXY axis = new AxisXY(chart); axis.Transform = Axis.TRANSFORM_LOG; axis.Density = 9; axis.TextFormat = "0.E0"; double[] x = new double[] {1e1, 1e2, 1e3, 1e4, 1e5}; double[] y = new double[] {4e2, 6e6, 2e3, 1e4, 8e1}; Data data1 = new Data(axis, x, y); data1.DataType = Data.DATA_TYPE_LINE | Data.DATA_TYPE_MARKER; data1.LineColor = Color.Blue;
Chapter 2: Charting 2D Types IMSL C# Chart Programmer’s User Guide • 27
data1.MarkerType = Data.MARKER_TYPE_FILLED_SQUARE; } public static void Main(string[] argv) { System.Windows.Forms.Application.Run(new SampleLogLog()); } }
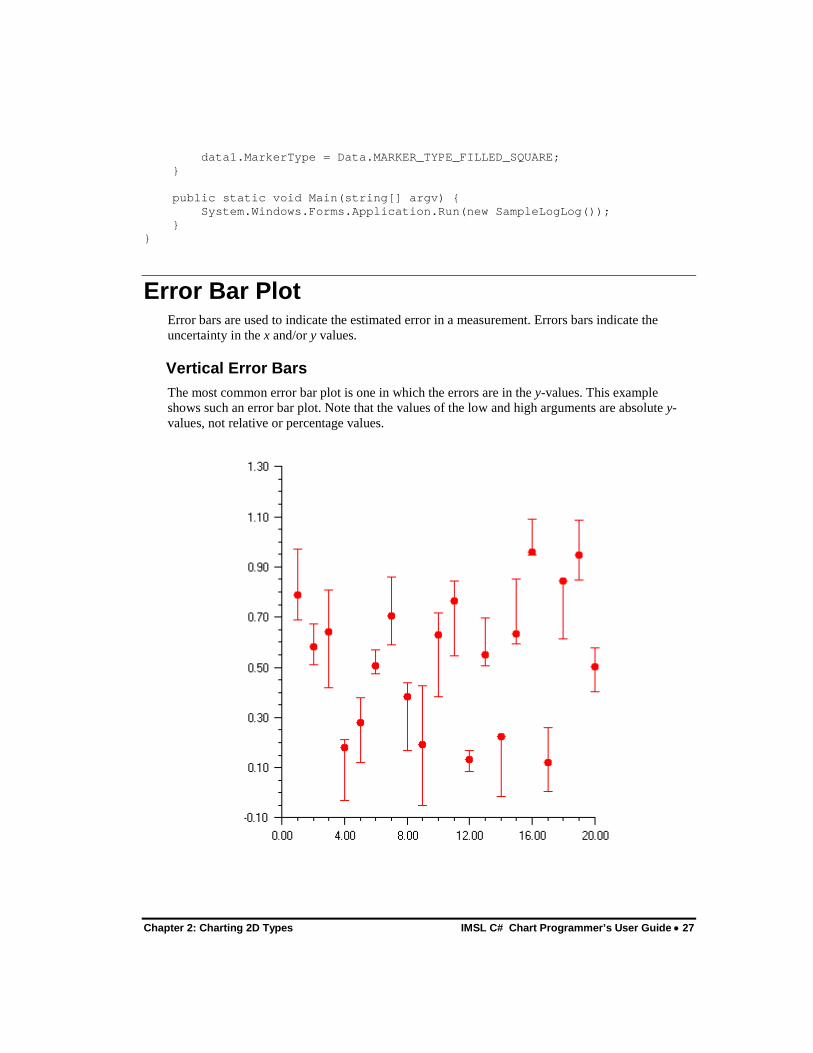
Error Bar Plot Error bars are used to indicate the estimated error in a measurement. Errors bars indicate the uncertainty in the x and/or y values.
Vertical Error Bars The most common error bar plot is one in which the errors are in the y-values. This example shows such an error bar plot. Note that the values of the low and high arguments are absolute y-values, not relative or percentage values.

28 • IMSL C# Chart Programmer’s User Guide Chapter 2: Charting 2D Types
(Download Code) using Imsl.Chart2D; using System.Drawing; using Imsl.Stat; public class SampleErrorBar : FrameChart { public SampleErrorBar() { Random r = new Random(123457); Chart chart = this.Chart; AxisXY axis = new AxisXY(chart); // Generate a random data set, with random errors int n = 20; double[] x = new double[n]; double[] y = new double[n]; double[] low = new double[n]; double[] high = new double[n]; for (int k = 0; k < n; k++) { x[k] = k + 1; y[k] = r.NextDouble(); low[k] = y[k] - 0.25*r.NextDouble(); high[k] = y[k] + 0.25*r.NextDouble(); } ErrorBar data = new ErrorBar(axis, x, y, low, high); data.DataType = ErrorBar.DATA_TYPE_ERROR_Y | Data.DATA_TYPE_MARKER; data.MarkerType = Data.MARKER_TYPE_FILLED_CIRCLE; data.MarkerColor = Color.Red; } public static void Main(string[] argv) { System.Windows.Forms.Application.Run(new SampleErrorBar()); } }

Chapter 2: Charting 2D Types IMSL C# Chart Programmer’s User Guide • 29
Horizontal Error Bars It is also possible to have horizontal error bars, indicating errors in x, as shown in this example.
(Download Code) using Imsl.Chart2D; using System.Drawing; using Imsl.Stat; public class SampleHorizontalErrorBar : FrameChart { public SampleHorizontalErrorBar() { Random r = new Random(123457); Chart chart = this.Chart; AxisXY axis = new AxisXY(chart); // Generate a random data set, with random errors int n = 20; double[] x = new double[n];
30 • IMSL C# Chart Programmer’s User Guide Chapter 2: Charting 2D Types
double[] y = new double[n]; double[] low = new double[n]; double[] high = new double[n]; for (int k = 0; k < n; k++) { x[k] = k; y[k] = r.NextDouble(); low[k] = x[k] - 5.0*r.NextDouble(); high[k] = x[k] + 5.0*r.NextDouble(); } ErrorBar data = new ErrorBar(axis, x, y, low, high); data.DataType = ErrorBar.DATA_TYPE_ERROR_X | Data.DATA_TYPE_MARKER; data.MarkerType = Data.MARKER_TYPE_FILLED_CIRCLE; data.MarkerColor = Color.Red; } public static void Main(string[] argv) { System.Windows.Forms.Application.Run( new SampleHorizontalErrorBar()); } }
Mixed Error Bars To show errors in both x and y, it is necessary to create both vertical and horizontal error bar objects. This example shows such a chart.

Chapter 2: Charting 2D Types IMSL C# Chart Programmer’s User Guide • 31
(Download Code)
using Imsl.Chart2D; using System.Drawing; using Imsl.Stat; public class SampleMixedErrorBar : FrameChart { public SampleMixedErrorBar() { Random r = new Random(123457); Chart chart = this.Chart; AxisXY axis = new AxisXY(chart); // Generate a random data set, with random errors int n = 20; double[] x = new double[n]; double[] y = new double[n]; double[] xlow = new double[n]; double[] xhigh = new double[n]; double[] ylow = new double[n]; double[] yhigh = new double[n]; for (int k = 0; k < n; k++) {

32 • IMSL C# Chart Programmer’s User Guide Chapter 2: Charting 2D Types
x[k] = k; y[k] = r.NextDouble(); xlow[k] = x[k] - r.NextDouble(); xhigh[k] = x[k] + r.NextDouble(); ylow[k] = y[k] - 0.25*r.NextDouble(); yhigh[k] = y[k] + 0.25*r.NextDouble(); } ErrorBar dataY = new ErrorBar(axis, x, y, ylow, yhigh); dataY.DataType = ErrorBar.DATA_TYPE_ERROR_Y | Data.DATA_TYPE_MARKER; dataY.MarkerType = Data.MARKER_TYPE_FILLED_CIRCLE; dataY.MarkerColor = Color.Red; ErrorBar dataX = new ErrorBar(axis, x, y, xlow, xhigh); dataX.DataType = ErrorBar.DATA_TYPE_ERROR_X; dataX.MarkerType = Data.MARKER_TYPE_FILLED_CIRCLE; dataX.MarkerColor = Color.Red; } public static void Main(string[] argv) { System.Windows.Forms.Application.Run(new SampleMixedErrorBar()); } }
High-Low-Close Plot High-Low-Close plots are used to show stock prices. They are created using the HighLowClose class.
The markers can be formatted using the attribute MarkerColor.
In a high-low-close plot the vertical line represent`s the high and low values. The close value is represented by a “tick” to the right. The open value, if present, is represented by a tick to the left.
The HighLowClose.SetDateAxis method will configure the x-axis for dates. This turns off autoscaling of the axis.
Example In this example, random security prices are computed in the CreateData method. The time axis is prepared by calling HighLowClose.SetDateAxis.

Chapter 2: Charting 2D Types IMSL C# Chart Programmer’s User Guide • 33
(Download Code) using Imsl.Chart2D; using System; using System.Drawing; public class SampleHighLowClose : FrameChart { private double[] high, low, close; public SampleHighLowClose() { Chart chart = this.Chart; AxisXY axis = new AxisXY(chart); // Date is June 27, 1999 DateTime date = new DateTime(1999, 6, 27); int n = 30; CreateData(n);

34 • IMSL C# Chart Programmer’s User Guide Chapter 2: Charting 2D Types
// Create an instance of a HighLowClose Chart HighLowClose hilo = new HighLowClose(axis, date, high, low, close); hilo.MarkerColor = Color.Blue; // Set the HighLowClose Chart Title chart.ChartTitle.SetTitle("Stock Prices"); // Setup the x axis Axis1D axisX = axis.AxisX; // Set the text angle for the X axis labels axisX.AxisLabel.TextAngle = 270; // Setup the time axis hilo.SetDateAxis("d"); // Turn on grid and make it light gray axisX.Grid.IsVisible = true; axisX.Grid.LineColor = Color.LightGray; axis.AxisY.Grid.IsVisible = true; axis.AxisY.Grid.LineColor = Color.LightGray; } private void CreateData(int n) { high = new double[n]; low = new double[n]; close = new double[n]; Random r = new Random(123457); for (int k = 0; k < n; k++) { double f = r.NextDouble(); if (k == 0) { close[0] = 100; } else { close[k] = (0.95+0.10*f)*close[k-1]; } high[k] = close[k]*(1+0.05*r.NextDouble()); low[k] = close[k]*(1-0.05*r.NextDouble()); } } public static void Main(string[] argv) { System.Windows.Forms.Application.Run( new SampleHighLowClose()); } }
Candlestick Chart A Candlestick chart is used to show stock price. Each candlestick shows the stock’s high, low, opening and closing prices.
Chapter 2: Charting 2D Types IMSL C# Chart Programmer’s User Guide • 35
The Candlestick constructors create two child CandlestickItem nodes. One is for the up days and one is for the down days. A day is an up day if the closing price is greater than the opening price. The Up and Down accessor properties can be used to retrieve these nodes.
The line (“whisker”) part of a candlestick shows the stock’s high and low prices. The whiskers can be formatted using the line attributes (see “Line Attributes” on page 108).
The body of a candlestick shows the stock’s opening and closing prices. The body color is used to flag if the top of the body is the closing price (up day) or the opening price (down day). The fill area attributes determine how the body is drawn (see “Fill Area Attributes” on page 111. By default, up days are white and down days are black.
The width of a candlestick is controlled by the MarkerSize attribute (see Attribute MarkerSize on page 110).
Example In this example, random security prices are computed in the CreateData method. The time axis is prepared by calling SetDateAxis.
The up days are colored green and the down days are colored red.

36 • IMSL C# Chart Programmer’s User Guide Chapter 2: Charting 2D Types
(Download Code)
using Imsl.Chart2D; using System; using System.Drawing; public class SampleCandlestick : FrameChart { private double[] high, low, open, close; public SampleCandlestick() { Chart chart = this.Chart; AxisXY axis = new AxisXY(chart); // Date is June 27, 1999 DateTime date = new DateTime(1999, 6, 27); int n = 30; CreateData(n);

Chapter 2: Charting 2D Types IMSL C# Chart Programmer’s User Guide • 37
// Create an instance of a Candlestick Chart Candlestick stick = new Candlestick(axis, date, high, low, close, open); // show up days in green and down days in red stick.Up.FillColor = Color.ForestGreen; stick.Down.FillColor = Color.Red; // Set the HighLowClose Chart Title chart.ChartTitle.SetTitle("Stock Prices"); // Setup the time axis stick.SetDateAxis("d"); // Turn on grid and make it light gray axis.AxisX.Grid.IsVisible = true; axis.AxisX.Grid.LineColor = Color.LightGray; axis.AxisY.Grid.IsVisible = true; axis.AxisY.Grid.LineColor = Color.LightGray; } private void CreateData(int n) { high = new double[n]; low = new double[n]; close = new double[n]; open = new double[n]; Random r = new Random(123457); for (int k = 0; k < n; k++) { double f = r.NextDouble(); if (k == 0) { close[0] = 100; } else { close[k] = (0.95+0.10*f)*close[k-1]; } high[k] = close[k]*(1+0.05*r.NextDouble()); low[k] = close[k]*(1-0.05*r.NextDouble()); open[k] = low[k] + r.NextDouble()*(high[k]-low[k]); } } public static void Main(string[] argv) { System.Windows.Forms.Application.Run(new SampleCandlestick()); } }
Pie Chart A pie chart is a graphical way to organize data. This section describes the construction of a pie chart.
38 • IMSL C# Chart Programmer’s User Guide Chapter 2: Charting 2D Types
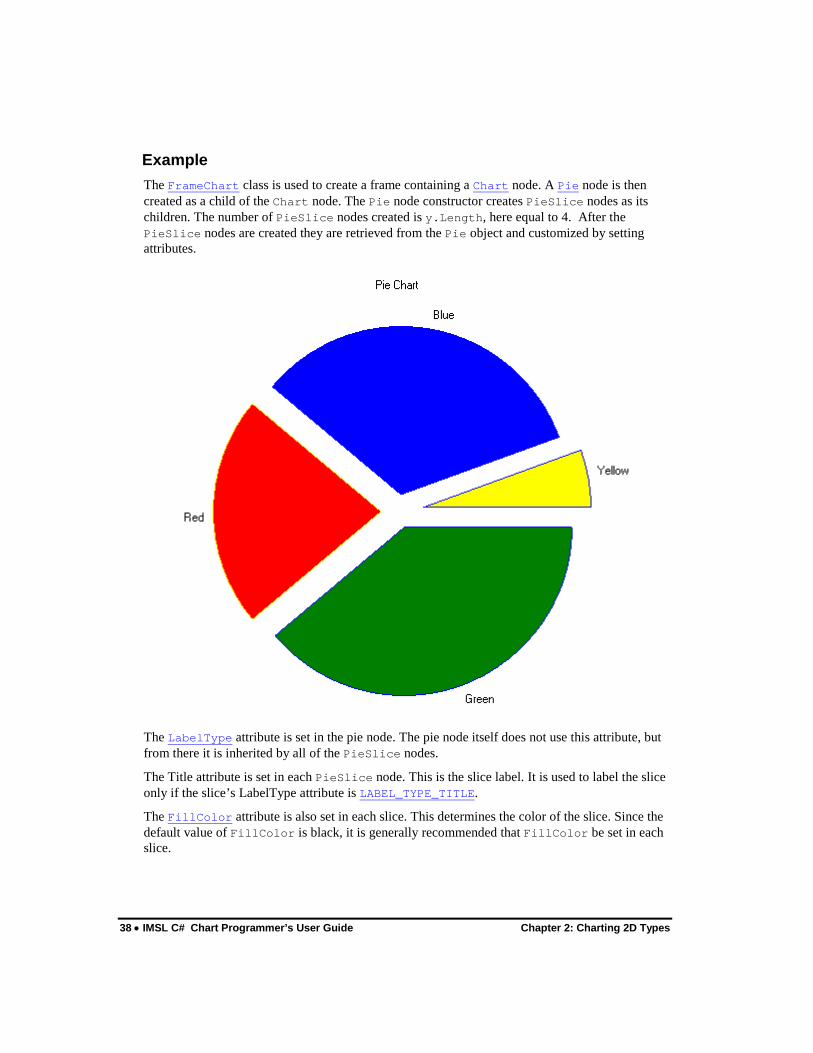
Example The FrameChart class is used to create a frame containing a Chart node. A Pie node is then created as a child of the Chart node. The Pie node constructor creates PieSlice nodes as its children. The number of PieSlice nodes created is y.Length, here equal to 4. After the PieSlice nodes are created they are retrieved from the Pie object and customized by setting attributes.
The LabelType attribute is set in the pie node. The pie node itself does not use this attribute, but from there it is inherited by all of the PieSlice nodes.
The Title attribute is set in each PieSlice node. This is the slice label. It is used to label the slice only if the slice’s LabelType attribute is LABEL_TYPE_TITLE.
The FillColor attribute is also set in each slice. This determines the color of the slice. Since the default value of FillColor is black, it is generally recommended that FillColor be set in each slice.

Chapter 2: Charting 2D Types IMSL C# Chart Programmer’s User Guide • 39
The FillOutlineColor attribute sets the border color of each slice. In this example it is set in the pie node to be blue and set in the slice[1] node to be yellow. All except slice[1] are outlined in blue, and slice[1] is outlined in yellow.
The Explode attribute moves a pie slice out from the center. Its default value is 0, which puts the slice vertex in the center. A value of 1.0 would put the slice vertex on the circumference.
(Download Code) using Imsl.Chart2D; using System.Drawing; public class SamplePieChart : FrameChart { public SamplePieChart() { Chart chart = this.Chart; chart.ChartTitle.SetTitle("Pie Chart"); double[] y = new double[] {35, 20, 30, 5}; Pie pie = new Pie(chart, y); pie.LabelType = Pie.LABEL_TYPE_TITLE; pie.FillOutlineColor = Color.Blue; pie.SetViewport(0.0, 1.0, 0.0, 1.0); PieSlice[] slice = pie.GetPieSlice(); slice[0].FillColor = Color.Green; slice[0].SetTitle("Green"); slice[0].Explode = 0.1; slice[1].FillColor = Color.Red; slice[1].SetTitle("Red"); slice[1].FillOutlineColor = Color.Yellow; slice[1].Explode = 0.1; slice[2].FillColor = Color.Blue; slice[2].SetTitle("Blue"); slice[2].Explode = 0.1; slice[3].FillColor = Color.Yellow; slice[3].SetTitle("Yellow"); slice[3].Explode = 0.15; } public static void Main(string[] argv) { System.Windows.Forms.Application.Run(new SamplePieChart()); } }

40 • IMSL C# Chart Programmer’s User Guide Chapter 2: Charting 2D Types
Box Plot BoxPlot plots are used to show statistics about multiple groups of observations.
For each group of observations, the box limits represent the lower quartile (25-th percentile) and upper quartile (75-th percentile). The median is displayed as a line across the box. Whiskers are drawn from the upper quartile to the upper adjacent value, and from the lower quartile to the lower adjacent value.
Optional notches may be displayed to show a 95 percent confidence interval about the median, at
1.58 /IRQ n±
where IRQ is the interquartile range and n is the number of observations. Outside and far outside values may be displayed as symbols. Outside values are outside the inner fence. Far out values are outside the outer fence.
The BoxPlot has several child nodes. Any of these nodes can be disabled by setting their IsVisible property to false.
• The Bodies node has the main body of the box plot elements. Its fill attributes determine the drawing of (notched) rectangle (see “Fill Area Attributes” on page 111). Its line attributes determine the drawing of the median line. The width of the box is controlled by the MarkerSize attribute (see Attribute MarkerSize on page 110).
• The Whiskers node draws the lines to the upper and lower quartile. Its drawing is affected by the marker attributes.
• The FarMarkers node holds the far markers. Its drawing is affected by the marker attributes.
• The OutsideMarkers node holds the outside markers. Its drawing is affected by the marker attributes.
Example In this example, the Fisher iris data set is read from a file and a Box plot is created from data. The data is in a file called FisherIris.csv in the same directory as this class.
The y-axis labels are taken from the column names.
The boxes are colored green; the markers are all filled circles. The outside markers are blue and the far outside markers would be red, if there were any.

Chapter 2: Charting 2D Types IMSL C# Chart Programmer’s User Guide • 41
(Download Code)
using Imsl.Chart2D; using System.Drawing; using System.IO; public class SampleBoxPlot : FrameChart { private double[][] irisData; private string[] labels; public SampleBoxPlot() { ReadData("FisherIris.csv"); Chart chart = this.Chart; AxisXY axis = new AxisXY(chart); BoxPlot boxPlot = new BoxPlot(axis, irisData); boxPlot.BoxPlotType = BoxPlot.BOXPLOT_TYPE_HORIZONTAL; boxPlot.SetLabels(labels); boxPlot.Bodies.FillColor = Color.Green; boxPlot.MarkerType = BoxPlot.MARKER_TYPE_FILLED_CIRCLE; boxPlot.OutsideMarkers.MarkerColor = Color.Blue; boxPlot.FarMarkers.MarkerColor = Color.Red; boxPlot.Notch = true;

42 • IMSL C# Chart Programmer’s User Guide Chapter 2: Charting 2D Types
} public static void Main(string[] argv) { System.Windows.Forms.Application.Run(new SampleBoxPlot()); } private void ReadData(string fileName) { int nColumns = 5; int nObs = 150; irisData = new double[nColumns][]; for (int i = 0; i < nColumns; i++) irisData[i] = new double[nObs]; string line; string[] tokens; int lineCount = 0; StreamReader sr = new StreamReader(fileName); line = sr.ReadLine(); labels = line.Split(','); for (int i = 0; i < nObs; i++) { line = sr.ReadLine(); tokens = line.Split(','); for (int j = 0; j < nColumns; j++) { irisData[j][lineCount] = double.Parse(tokens[j].Trim()); } lineCount++; } } }
Bar Chart The class Bar is used to create bar charts and histograms. This page describes the construction of labeled bar charts. For a discussion of histograms, see “Histogram” on page 54.
Simple Bar Chart The following code creates this labeled bar chart. The BarType attribute can be either BAR_TYPE_VERTICAL or BAR_TYPE_HORIZONTAL. The method SetLabels sets the bar labels and adjusts the attributes of the axis to be appropriate for bar labels. The SetLabels method must be called after the BarType method, so that the correct axis has its attributes adjusted.
The drawing of the bars is controlled by the FillType and FillOutlineType attributes. By default FillType has the value FILL_TYPE_SOLID, so setting the associated attribute FillColor to red causes solid red bars to be drawn.

Chapter 2: Charting 2D Types IMSL C# Chart Programmer’s User Guide • 43
(Download Code)
using Imsl.Chart2D; using System.Drawing; public class SampleBar : FrameChart { public SampleBar() { Chart chart = this.Chart; AxisXY axis = new AxisXY(chart); double[] y = new double[] {4, 2, 3, 9}; Bar bar = new Bar(axis, y); bar.BarType = Bar.BAR_TYPE_VERTICAL; bar.SetLabels(new string[] {"A","B","C","D"}); bar.FillColor = Color.Red; } public static void Main(string[] argv) { System.Windows.Forms.Application.Run(new SampleBar()); } }
44 • IMSL C# Chart Programmer’s User Guide Chapter 2: Charting 2D Types
Attribute BarGap The BarGap attribute sets the gap between bars in a group. A gap of 1.0 means that space between bars is the same as the width of an individual bar in the group. Its default value is 0.0, meaning there is no space between groups.
Attribute BarWidth The BarWidth attribute sets the width of the groups of bars at each index. Its default value is 0.5. If the number of groups is increased, the width of each individual bar is reduced proportionately.
See Histogram on page 54 for an example of the use of the BarWidth attribute.
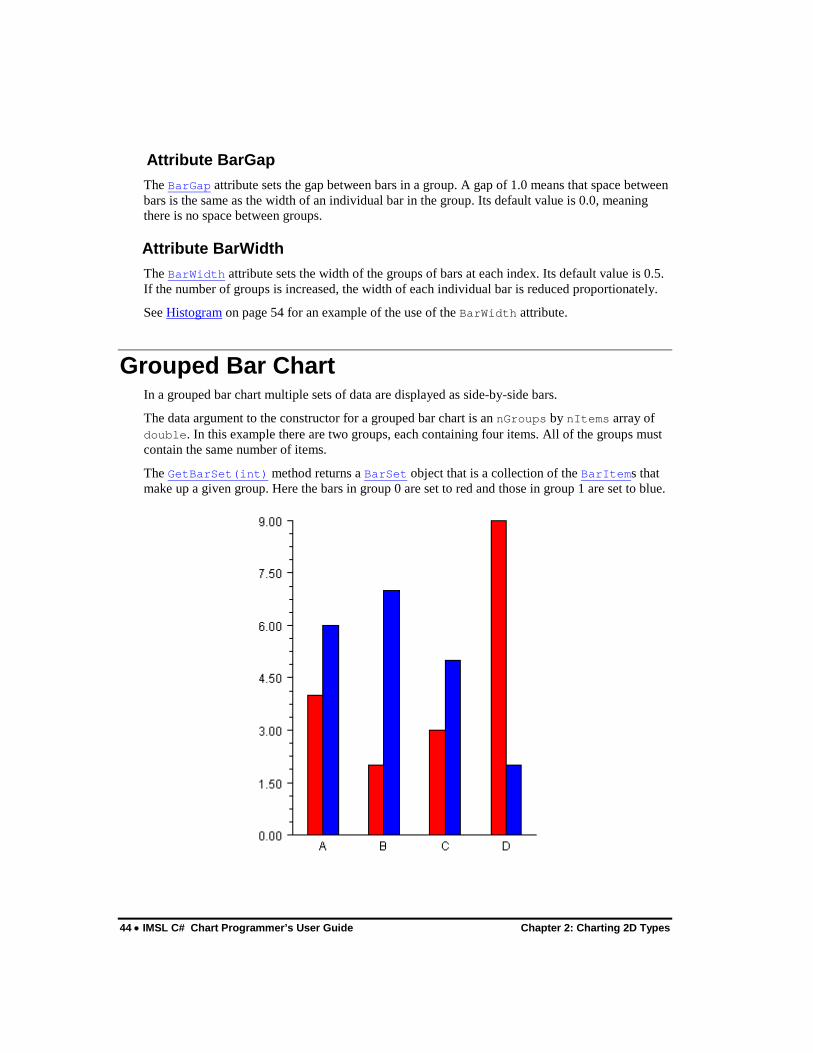
Grouped Bar Chart In a grouped bar chart multiple sets of data are displayed as side-by-side bars.
The data argument to the constructor for a grouped bar chart is an nGroups by nItems array of double. In this example there are two groups, each containing four items. All of the groups must contain the same number of items.
The GetBarSet(int) method returns a BarSet object that is a collection of the BarItems that make up a given group. Here the bars in group 0 are set to red and those in group 1 are set to blue.
Chapter 2: Charting 2D Types IMSL C# Chart Programmer’s User Guide • 45
(Download Code) using Imsl.Chart2D; using System.Drawing; public class SampleBarGroup : FrameChart { public SampleBarGroup() { Chart chart = this.Chart; AxisXY axis = new AxisXY(chart); double[][] y = new double[2][] { new double[] {4, 2, 3, 9}, new double[] {6, 7, 5, 2}}; Bar bar = new Bar(axis, y); bar.BarType = Bar.BAR_TYPE_VERTICAL;
bar.SetLabels(new string[] {"A","B","C","D"}); bar.GetBarSet(0).FillColor = Color.Red; bar.GetBarSet(1).FillColor = Color.Blue; } public static void Main(string[] argv) { System.Windows.Forms.Application.Run(new SampleBarGroup()); } }
In the above grouped bar chart example, the Bar constructor creates a collection of chart nodes. For each group, it creates a BarSet node as its direct child. Each BarSet node has BarItem nodes as children, one for each bar in the set.
Stacked Grouped Bar Chart The most general form of the bar chart is a stacked, grouped bar chart.
The data argument to the constructor for a stacked, grouped bar chart is an nStacks by nGroups by nItems array of double. In this example there are two stacks in three groups each containing four items. All of the stacks must contain the same number of groups and all of the groups must contain the same number of items.
The GetBarSet(int,int) method returns a BarSet object that is a collection of the BarItems that make up a given stack/group. Here within each group the stacks are set to shades of the same color.
A stacked bar chart, without groups, can be constructed as a stacked-grouped bar chart with one group

46 • IMSL C# Chart Programmer’s User Guide Chapter 2: Charting 2D Types
(Download Code)
using Imsl.Chart2D; using System.Drawing; public class SampleBarGroupStack : FrameChart { public SampleBarGroupStack() { Chart chart = this.Chart; AxisXY axis = new AxisXY(chart); // y is a 2 by 3 by 4 array double[][][] y = new double[2][][] { new double[3][] { new double[] {4, 2, 3, 9}, new double[] {8, 4, 2, 3}, new double[] {1, 5, 3, 8}}, new double[3][] { new double[] {6, 7, 5, 2}, new double[] {4, 1, 7, 2}, new double[] {8, 5, 6, 1}}}; Bar bar = new Bar(axis, y); bar.BarType = Bar.BAR_TYPE_VERTICAL; bar.SetLabels(new string[] {"A","B","C","D"}); // group 0 - shades of red bar.GetBarSet(0,0).FillColor = Color.Red; bar.GetBarSet(1,0).FillColor = Color.DarkRed; // group 1 - shades of blue
Chapter 2: Charting 2D Types IMSL C# Chart Programmer’s User Guide • 47
bar.GetBarSet(0,1).FillColor = Color.Blue; bar.GetBarSet(1,1).FillColor = Color.LightBlue; // group 2 - shades of gray bar.GetBarSet(0,2).FillColor = Color.Gray; bar.GetBarSet(1,2).FillColor = Color.LightGray; } public static void Main(string[] argv) { System.Windows.Forms.Application.Run( new SampleBarGroupStack()); } }
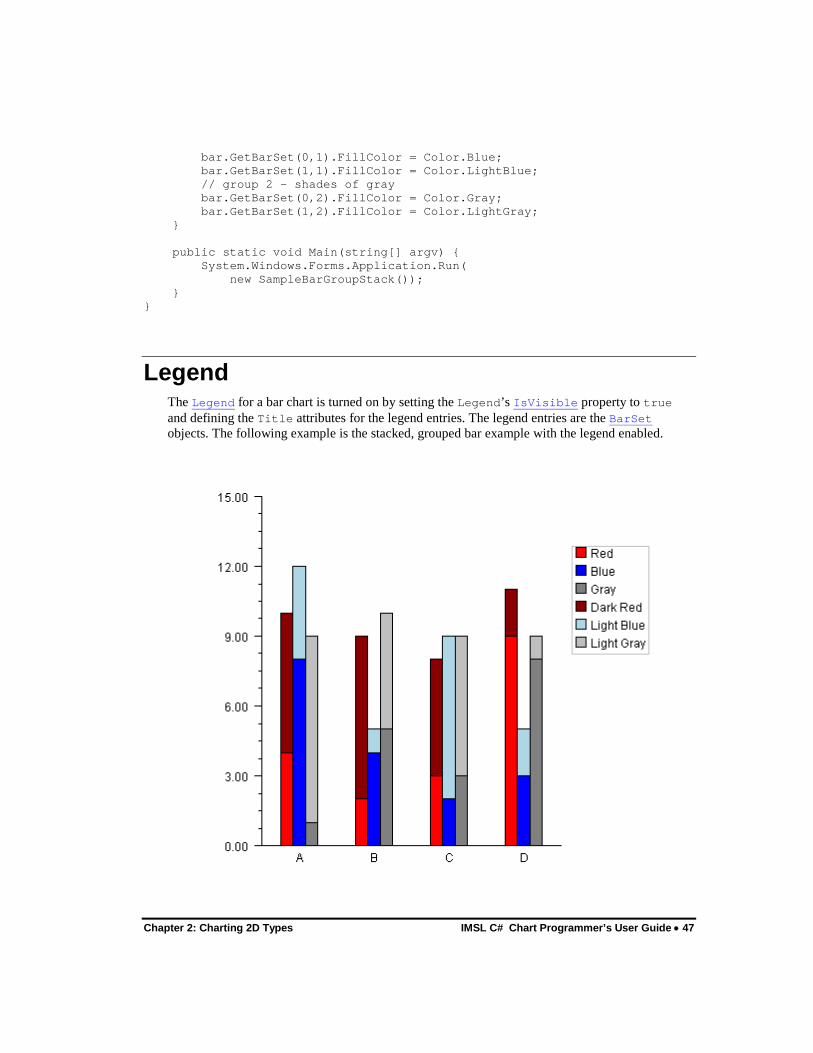
Legend The Legend for a bar chart is turned on by setting the Legend’s IsVisible property to true and defining the Title attributes for the legend entries. The legend entries are the BarSet objects. The following example is the stacked, grouped bar example with the legend enabled.

48 • IMSL C# Chart Programmer’s User Guide Chapter 2: Charting 2D Types
(Download Code) using Imsl.Chart2D; using System.Drawing; public class SampleBarLegend : FrameChart { public SampleBarLegend() { Chart chart = this.Chart; AxisXY axis = new AxisXY(chart); chart.Legend.IsVisible = true; // y is a 2 by 3 by 4 array double[][][] y = new double[2][][] { new double[3][] { new double[] {4, 2, 3, 9}, new double[] {8, 4, 2, 3}, new double[] {1, 5, 3, 8}}, new double[3][] { new double[] {6, 7, 5, 2}, new double[] {4, 1, 7, 2}, new double[] {8, 5, 6, 1}}}; Bar bar = new Bar(axis, y); bar.BarType = Bar.BAR_TYPE_VERTICAL; bar.SetLabels(new string[] {"A","B","C","D"}); // group 0 - shades of red bar.GetBarSet(0,0).SetTitle("Red"); bar.GetBarSet(0,0).FillColor = Color.Red; bar.GetBarSet(1,0).SetTitle("Dark Red"); bar.GetBarSet(1,0).FillColor = Color.DarkRed; // group 1 - shades of blue bar.GetBarSet(0,1).SetTitle("Blue"); bar.GetBarSet(0,1).FillColor = Color.Blue; bar.GetBarSet(1,1).SetTitle("Light Blue"); bar.GetBarSet(1,1).FillColor = Color.LightBlue; // group 2 - shades of gray bar.GetBarSet(0,2).SetTitle("Gray"); bar.GetBarSet(0,2).FillColor = Color.Gray; bar.GetBarSet(1,2).SetTitle("Light Gray"); bar.GetBarSet(1,2).FillColor = Color.LightGray; } public static void Main(string[] argv) { System.Windows.Forms.Application.Run(new SampleBarLegend()); } }
Contour Chart A Contour chart shows level curves of a two-dimensional function.
Chapter 2: Charting 2D Types IMSL C# Chart Programmer’s User Guide • 49
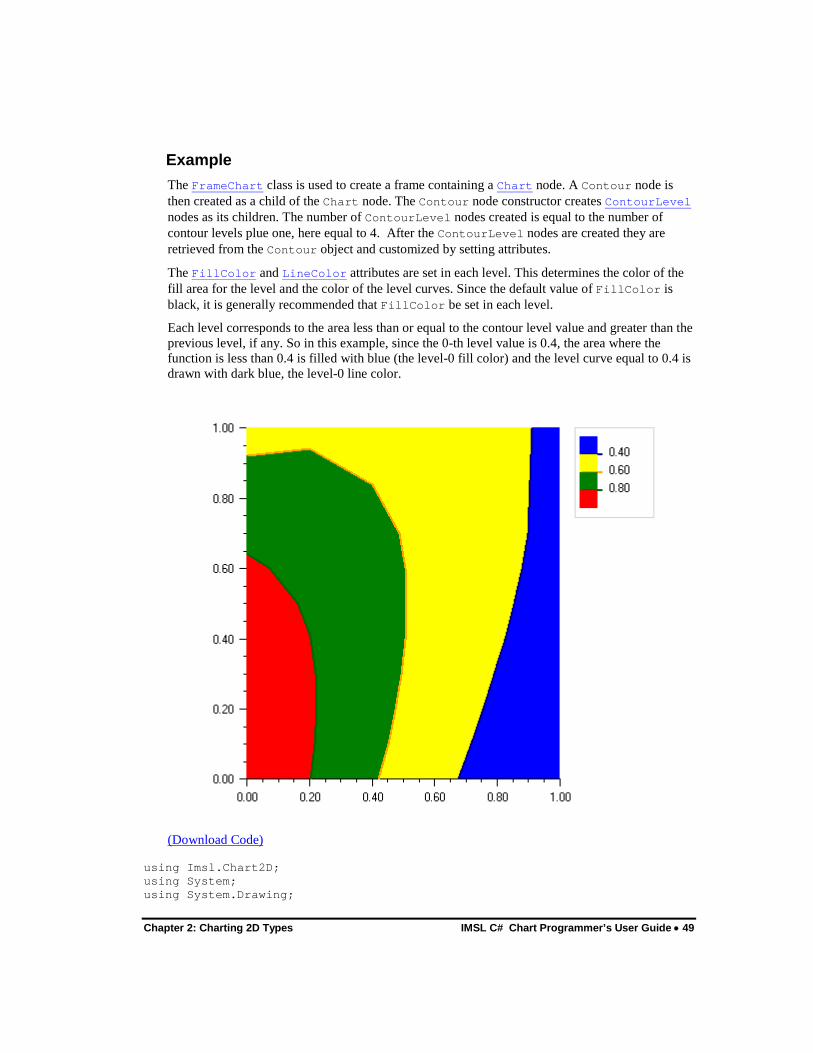
Example The FrameChart class is used to create a frame containing a Chart node. A Contour node is then created as a child of the Chart node. The Contour node constructor creates ContourLevel nodes as its children. The number of ContourLevel nodes created is equal to the number of contour levels plue one, here equal to 4. After the ContourLevel nodes are created they are retrieved from the Contour object and customized by setting attributes.
The FillColor and LineColor attributes are set in each level. This determines the color of the fill area for the level and the color of the level curves. Since the default value of FillColor is black, it is generally recommended that FillColor be set in each level.
Each level corresponds to the area less than or equal to the contour level value and greater than the previous level, if any. So in this example, since the 0-th level value is 0.4, the area where the function is less than 0.4 is filled with blue (the level-0 fill color) and the level curve equal to 0.4 is drawn with dark blue, the level-0 line color.
(Download Code)
using Imsl.Chart2D; using System; using System.Drawing;
50 • IMSL C# Chart Programmer’s User Guide Chapter 2: Charting 2D Types
public class SampleContour : FrameChart { public SampleContour() { Chart chart = this.Chart; AxisXY axis = new AxisXY(chart); double[] xGrid = {0, 0.2, 0.4, 0.6, 0.8, 1.0}; double[] yGrid = {0, 0.1, 0.2, 0.3, 0.4, 0.5, 0.6, 0.7, 1.0}; double[,] zData = new double[xGrid.Length, yGrid.Length]; for (int i = 0; i < xGrid.Length; i++) { for (int j = 0; j < yGrid.Length; j++) { double x = xGrid[i]; double y = yGrid[j]; zData[i,j] = Math.Exp(-x) * Math.Cos(x-y); } } double[] level = {0.4, 0.6, 0.8}; Contour contour = new Contour(axis, xGrid, yGrid, zData, level); contour.ContourLegend.IsVisible = true; contour.GetContourLevel(0).FillColor = Color.Blue; contour.GetContourLevel(1).FillColor = Color.Yellow; contour.GetContourLevel(2).FillColor = Color.Green; contour.GetContourLevel(3).FillColor = Color.Red; contour.GetContourLevel(0).LineColor = Color.DarkBlue; contour.GetContourLevel(1).LineColor = Color.Orange; contour.GetContourLevel(2).LineColor = Color.DarkGreen; contour.GetContourLevel(3).LineColor = Color.DarkRed; } public static void Main(string[] argv) { System.Windows.Forms.Application.Run(new SampleContour()); } }
Heatmap A Heatmap divides a rectangle into subrectangles. The color of each subrectangle is determined by the value of a data array and a colormap.
If the data array is m by n then there are m divisions along the x-axis and n divisions along the y-axis.
A Colormap is a mapping from [0,1] to color values. The blue-red colormap, used in the example below, maps 0 to red and 1 to dark blue and interpolates between these endpoints values. The heatmap maps the minimum data value to the color corresponding to 0 and the highest data value to the color corresponding to 1.
The Heatmap class has a special legend for colormaps. It displays the color values as a gradient labeled with corresponding data values.

Chapter 2: Charting 2D Types IMSL C# Chart Programmer’s User Guide • 51
Example In this example a two-dimensional array of data is plotted as a heatmap. The “red-blue” Colormap is used. The HeatmapLegend is enabled by setting its IsVisible property to true.
(Download Code)
using Imsl.Chart2D; public class SampleHeatmap : FrameChart { public SampleHeatmap() { Chart chart = this.Chart; AxisXY axis = new AxisXY(chart); double xmin = 0.0; double xmax = 5.0; double ymin = 0.0; double ymax = 4.0; double zmin = 0.0; double zmax = 100.0; double[,] data = new double [,] { {23, 48, 16, 56}, {89, 74, 54, 32}, {12, 45, 18, 9}, {72, 15, 42, 92},

52 • IMSL C# Chart Programmer’s User Guide Chapter 2: Charting 2D Types
{63, 36, 78, 29} }; Heatmap heatmap = new Heatmap(axis, xmin, xmax, ymin, ymax, zmin, zmax, data, Colormap_Fields.BLUE_RED); heatmap.HeatmapLegend.IsVisible = true; } public static void Main(string[] argv) { System.Windows.Forms.Application.Run(new SampleHeatmap()); } }
Treemap A Treemap divides a rectangle into subrectangles. The size of each rectangle is determined by an array of data values. The color of each subrectangle is determined by the value of a second data array and a Colormap.
The primary data array is a sorted set of values to map to the subrectangle areas. The placement algorithm is adapted from Bruls, Mark and Huizing, Kees and Wijk, Jarke J. van (2000) Squarified Treemaps. In Proceedings of the Joint Eurographics and IEEE TCVG Symposium on Visualization.
By default, the algorithm fills either rows first or columns first determined by the aspect ratio of the resulting subrectangles. The user may force drawing orientation by using the Orientation property with Treemap.OrientationMethod.ColumnFirst or Treemap.OrientationMethod.RowFirst.
A Colormap is a mapping from [0,1] to color values. The Treemap maps the minimum value of the second data array to the color corresponding to 0 and the highest value to the color corresponding to 1.
The TreemapLegend is enabled by setting its IsVisible property to true.
Example In this example an array of country data is plotted as a Treemap. The area is proportional to the country’s land area while the shading maps to the population. The “green-white-linear” Colormap is used. The TreemapLegend is enabled by setting its IsVisible property to true.

Chapter 2: Charting 2D Types IMSL C# Chart Programmer’s User Guide • 53
(Download Code)
using Imsl.Chart2D; using System.Drawing; public class SampleTreemap : FrameChart { public SampleTreemap() { Chart chart = this.Chart; AxisXY axis = new AxisXY(chart); double[] areas = { 6592735, 3855081, 3718691, 3705386, 3286470, 2967893, 1269338, 1068296}; double[] population = { 142.893540, 33.098932, 298.444215, 1313.973713, 188.078227, 20.264082, 1095.351995, 39.930091}; string[] names = {

54 • IMSL C# Chart Programmer’s User Guide Chapter 2: Charting 2D Types
"Russia", "Canada", "United States", "China", "Brazil", "Australia", "India", "Argentina"}; Treemap treemap = new Treemap(axis, areas, population, Colormap_Fields.GREEN_WHITE_LINEAR); treemap.SetTreemapLabels(names); treemap.TextColor = Color.Gray; treemap.TreemapLegend.IsVisible = true; treemap.TreemapLegend.SetTitle("Pop. (M)"); treemap.TreemapLegend.TextFormat = "0"; axis.SetViewport(0.05, 0.8, 0.1, 0.95); } public static void Main(string[] argv) { System.Windows.Forms.Application.Run(new SampleTreemap()); } }
Histogram A histogram is a bar chart in which the height of the bars is proportional to the frequencies. A histogram generally uses the same axis style as a scatter plot (i.e. the bars are numbered not labeled.)
In IMSL C# Numerical Library, histograms are drawn using the Bar class, but its SetLabels method is not used.
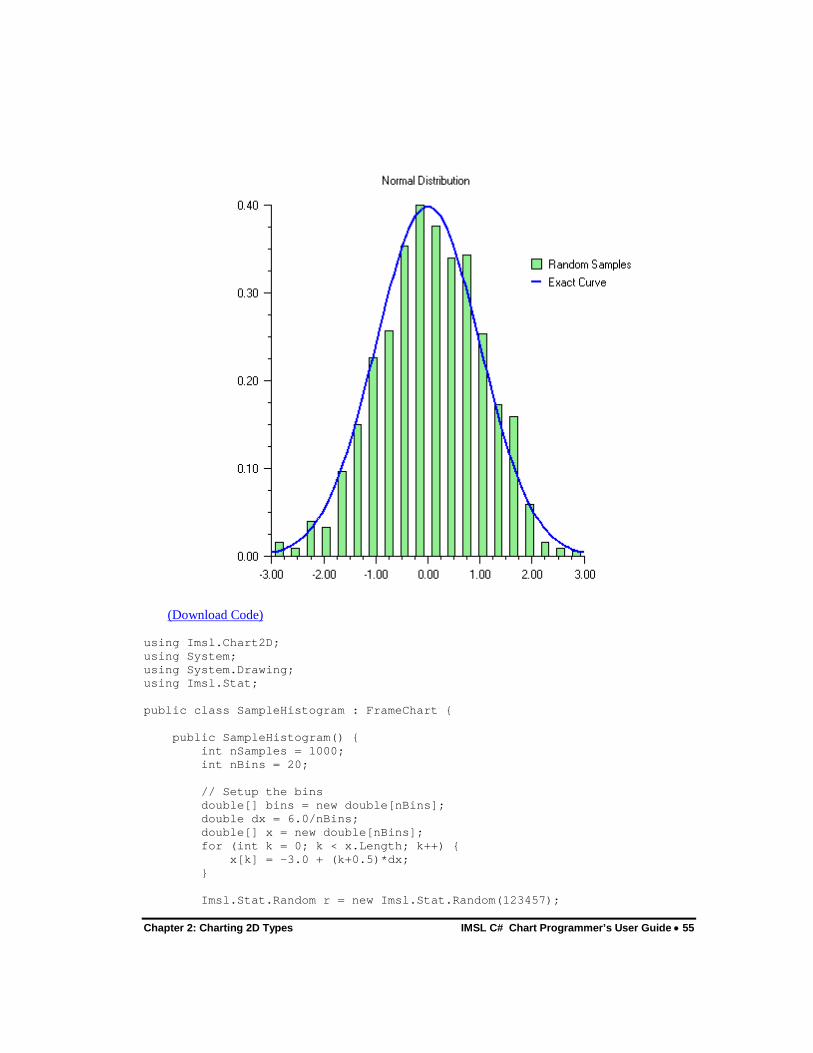
Example In this example normally distributed random numbers are generated and placed into 20 uniformly sized bins in the interval [-3,3]. Points outside of this interval are ignored. The bin counts are scaled by the number of samples and the bin width. The scaled bin counts are charted using Bar chart. The exact normal distribution is implemented as a ChartFunction and plotted.
The Legend is displayed by setting the legend node’s IsVisible property to true and defining the bar chart’s Title attribute. The Legend is positioned on the chart by setting its Viewport attribute.
Chapter 2: Charting 2D Types IMSL C# Chart Programmer’s User Guide • 55
(Download Code)
using Imsl.Chart2D; using System; using System.Drawing; using Imsl.Stat; public class SampleHistogram : FrameChart { public SampleHistogram() { int nSamples = 1000; int nBins = 20; // Setup the bins double[] bins = new double[nBins]; double dx = 6.0/nBins; double[] x = new double[nBins]; for (int k = 0; k < x.Length; k++) { x[k] = -3.0 + (k+0.5)*dx; } Imsl.Stat.Random r = new Imsl.Stat.Random(123457);

56 • IMSL C# Chart Programmer’s User Guide Chapter 2: Charting 2D Types
for (int k = 0; k < nSamples; k++) { double t = r.NextNormal(); int j = (int)Math.Round((t+3.0-0.5*dx)/dx); if (j >= 0 && j < nBins) bins[j]++; } // Scale the bins for (int k = 0; k < nBins; k++) { bins[k] /= nSamples*dx; } // create the chart Chart chart = this.Chart; AxisXY axis = new AxisXY(chart); chart.ChartTitle.SetTitle("Normal Distribution"); chart.Legend.IsVisible = true; chart.Legend.SetViewport(0.7, 1.0, 0.2, 0.3); chart.Legend.FillOutlineType = Chart.FILL_TYPE_NONE; Bar bar = new Bar(axis, x, bins); bar.BarType = Bar.BAR_TYPE_VERTICAL; bar.FillColor = Color.LightGreen; bar.BarWidth = 0.5*dx; bar.SetTitle("Random Samples"); // plot the expected curve Data data = new Data(axis, new NormalDist(), -3, 3.0); data.LineColor = Color.Blue; data.SetTitle("Exact Curve"); data.LineWidth = 2.0; } public static void Main(string[] argv) { System.Windows.Forms.Application.Run(new SampleHistogram()); } } class NormalDist : ChartFunction { public double F(double x) { return Math.Exp(-0.5*x*x)/Math.Sqrt(2.0*Math.PI); } }
Polar Plot The class Polar is used to plot (r,theta) data, where r is the distance from the origin and theta is the angle from the positive x-axis. Data node (x, y) values are treated as if they were (r,theta) values.
When a Polar node is created, a subtree of other nodes is created. These automatically created nodes are shown in the following diagram.

Chapter 2: Charting 2D Types IMSL C# Chart Programmer’s User Guide • 57
AxisR is the r-axis node. This is drawn along the positive x-axis. This node has three subnodes: AxisRLine for the actual line, AxisRMajorTick for the tick marks along the line and AxisRLabel for the tick mark labels.
The drawing of the AxisRLine and the AxisRMajorTick is controlled by the Line Attributes. The drawing of the AxisRLabel is controlled by the Text Attributes.
The Window attribute in AxisR specifies the length of the r-axis. Since the r-axis range is [0, rmax], the Window attribute for this node is the rmax value. Autoscaling is used to automatically determine rmax from the data. Autoscaling can be turned off. See Autoscale for more details.
AxisTheta is the theta-axis node. It is drawn as a circle around the plot. The drawing of the circle itself is controlled by the line attributes. The drawing of the axis labels is controlled by the text attributes. The Window attribute in the AxisTheta node contains the angular range, in radians. Its default value is [0,2π]. The Window attribute can be explicitly set to change the range, but autoscaling is not available to determine the angular range.
GridPolar is the plot grid. It consists of both radial and circular lines. The drawing of these lines is controlled by the line attributes. By default, these lines are drawn and are light gray.
Example The function r = 0.5 + cos(q), for 0 <= q <= p is plotted.

58 • IMSL C# Chart Programmer’s User Guide Chapter 2: Charting 2D Types
(Download Code)
using Imsl.Chart2D; using System.Drawing; using System; public class SamplePolar : FrameChart { public SamplePolar() { Chart chart = this.Chart; Polar axis = new Polar(chart); double[] r = new double[20]; double[] theta = new double[r.Length]; for (int k = 0; k < r.Length; k++) { theta[k] = Math.PI*k/(r.Length-1); r[k] = 0.5 + Math.Cos(theta[k]); } Data data = new Data(axis, r, theta); data.DataType = Data.DATA_TYPE_MARKER | Data.DATA_TYPE_LINE; data.LineColor = Color.Lime;
Chapter 2: Charting 2D Types IMSL C# Chart Programmer’s User Guide • 59
data.MarkerColor = Color.Blue; } public static void Main(string[] argv) { System.Windows.Forms.Application.Run(new SamplePolar()); } }
Dendrogram Chart A Dendrogram chart is a graphical way to display results from hierarchical cluster analysis. This section describes the construction of a dendrogram chart.
Example The data for this example is grouped into clusters using the Dissimilarities and ClusterHierarchical classes. A Dendrogram node is then created as a child of an axis node. The Dendrogram constructor requires input values from the ClusterHierarchical object.
The SetLables and SetLineColors methods are used to customize the look of the chart. Labels are provided in a String array in the order of the input data and sorted by the Dendrogram object to match the output order. Clusters are grouped by color based on the number of elements in the array passed to the SetLineColors method.

60 • IMSL C# Chart Programmer’s User Guide Chapter 2: Charting 2D Types
(Download Code)
using Imsl.Chart2D; using Imsl.Stat; using System.Drawing; public class SampleDendrogram : FrameChart { public SampleDendrogram() { /* 1998 test data from 17 school districts in Los Angeles County. The variables were: lep - Proportion of LEP students to total tested read - The Reading Scaled Score for 5th Grade math - The Math Scaled Score for 5th Grade lang - The Language Scaled Score for 5th Grade The districts were: lau - Los Angeles ccu - Culver City bhu - Beverly Hills ing - Inglewood com - Compton smm - Santa Monica Malibu

Chapter 2: Charting 2D Types IMSL C# Chart Programmer’s User Guide • 61
bur - Burbank gln - Glendale pvu - Palos Verdes sgu - San Gabriel abc - Artesia, Bloomfield, and Carmenita pas - Pasadena lan - Lancaster plm - Palmdale tor - Torrance dow - Downey lbu - Long Beach input lep read math lang str3 district .38 626.5 601.3 605.3 lau .18 654.0 647.1 641.8 ccu .07 677.2 676.5 670.5 bhu .09 639.9 640.3 636.0 ing .19 614.7 617.3 606.2 com .12 670.2 666.0 659.3 smm .20 651.1 645.2 643.4 bur .41 645.4 645.8 644.8 gln .07 683.5 682.9 674.3 pvu .39 648.6 647.8 643.1 sgu .21 650.4 650.8 643.9 abc .24 637.0 636.9 626.5 pas .09 641.1 628.8 629.4 lan .12 638.0 627.7 628.6 plm .11 661.4 659.0 651.8 tor .22 646.4 646.2 647.0 dow .33 634.1 632.0 627.8 lbu */ double[,] data = { {.38, 626.5, 601.3, 605.3}, {.18, 654.0, 647.1, 641.8}, {.07, 677.2, 676.5, 670.5}, {.09, 639.9, 640.3, 636.0}, {.19, 614.7, 617.3, 606.2}, {.12, 670.2, 666.0, 659.3}, {.20, 651.1, 645.2, 643.4}, {.41, 645.4, 645.8, 644.8}, {.07, 683.5, 682.9, 674.3}, {.39, 648.6, 647.8, 643.1}, {.21, 650.4, 650.8, 643.9}, {.24, 637.0, 636.9, 626.5}, {.09, 641.1, 628.8, 629.4}, {.12, 638.0, 627.7, 628.6}, {.11, 661.4, 659.0, 651.8}, {.22, 646.4, 646.2, 647.0}, {.33, 634.1, 632.0, 627.8}}; string[] lab = {"lau", "ccu", "bhu", "ing", "com", "smm", "bur", "gln", "pvu", "sgu", "abc", "pas", "lan", "plm", "tor", "dor", "lbu"};
62 • IMSL C# Chart Programmer’s User Guide Chapter 2: Charting 2D Types
// 3rd arg in Dissimilarities gives different results for 0,1,2 Dissimilarities dist = new Dissimilarities(data, 0, 1, 1); ClusterHierarchical clink = new ClusterHierarchical(dist.DistanceMatrix, 4, 0); int nClusters = 4; int[] iclus = clink.GetClusterMembership(nClusters); int[] nclus = clink.GetObsPerCluster(nClusters); Chart chart = this.Chart; AxisXY axis = new AxisXY(chart); // use either method below to create the chart Dendrogram dc = new Dendrogram(axis, clink, Data.DENDROGRAM_TYPE_HORIZONTAL); /* new Dendrogram(axis, clink.getClusterLevel(), clink.getClusterLeftSons(), clink.getClusterRightSons(), Data.DENDROGRAM_TYPE_HORIZONTAL); */ dc.SetLabels(lab); dc.SetLineColors(new Color[]{Color.Blue, Color.Green, Color.Red, Color.Orange}); } public static void Main(string[] argv) { System.Windows.Forms.Application.Run(new SampleDendrogram()); } }


64 • IMSL C# Chart Programmer’s User Guide Chapter 3: Quality Control and Improvement Charts
Chapter 3: Quality Control and Improvement Charts
Introduction Quality improvement charts have a variety of uses. In this library the charts are organized into three broad groups: Shewhart control charts, other control charts and process improvement charts. The Shewhart control charts were originally described by the statistician Dr. Walter A. Shewhart (1931). Since this early work, other charts have been developed for engineering and management analysis of processes. In the 1980s customized charts were developed for other retrospective analysis of quality management data.
This chapter discusses these IMSL C# Numerical Library Quality Control Charts: IMSL C# Numerical Library provides these Quality Control Charts:
• “ShewhartControlChart and ControlLimit” on page 67
• “XbarS and SChart” on page 70
• “XbarR and RChart” on page 78
• “XmR” on page 82
• “PChart” on page 84
• “NpChart” on page 87
• “CChart” on page 89
• “UChart” on page 92
• “EWMA” on page 96
• “CuSum” on page 98
• “CuSumStatus” on page 100
• “Pareto Chart” on page 102
• “Cumulative Probability” on page 104
Shewhart Charts While working for Western Electric in the 1920s, Dr. Shewhart developed a general, practical approach to statistical monitoring of manufacturing processes. He advised managers on
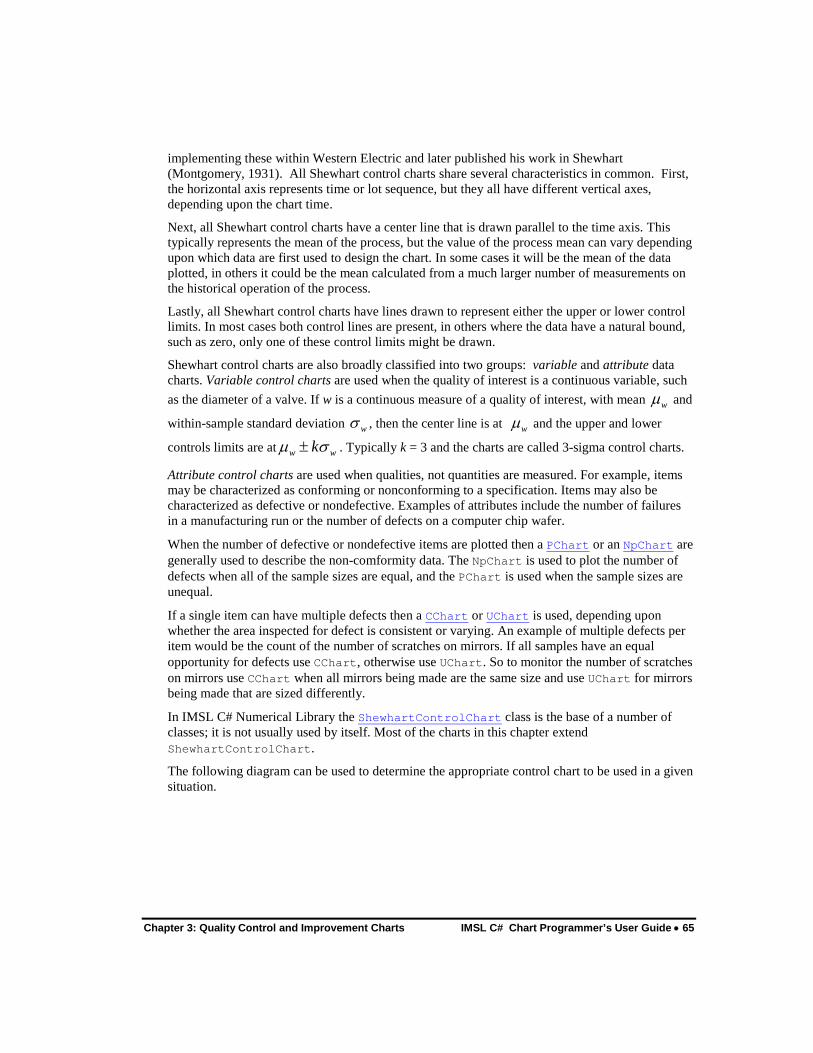
Chapter 3: Quality Control and Improvement Charts IMSL C# Chart Programmer’s User Guide • 65
implementing these within Western Electric and later published his work in Shewhart (Montgomery, 1931). All Shewhart control charts share several characteristics in common. First, the horizontal axis represents time or lot sequence, but they all have different vertical axes, depending upon the chart time.
Next, all Shewhart control charts have a center line that is drawn parallel to the time axis. This typically represents the mean of the process, but the value of the process mean can vary depending upon which data are first used to design the chart. In some cases it will be the mean of the data plotted, in others it could be the mean calculated from a much larger number of measurements on the historical operation of the process.
Lastly, all Shewhart control charts have lines drawn to represent either the upper or lower control limits. In most cases both control lines are present, in others where the data have a natural bound, such as zero, only one of these control limits might be drawn.
Shewhart control charts are also broadly classified into two groups: variable and attribute data charts. Variable control charts are used when the quality of interest is a continuous variable, such as the diameter of a valve. If w is a continuous measure of a quality of interest, with mean wµ and
within-sample standard deviation wσ , then the center line is at wµ and the upper and lower
controls limits are at w wkµ σ± . Typically k = 3 and the charts are called 3-sigma control charts.
Attribute control charts are used when qualities, not quantities are measured. For example, items may be characterized as conforming or nonconforming to a specification. Items may also be characterized as defective or nondefective. Examples of attributes include the number of failures in a manufacturing run or the number of defects on a computer chip wafer.
When the number of defective or nondefective items are plotted then a PChart or an NpChart are generally used to describe the non-comformity data. The NpChart is used to plot the number of defects when all of the sample sizes are equal, and the PChart is used when the sample sizes are unequal.
If a single item can have multiple defects then a CChart or UChart is used, depending upon whether the area inspected for defect is consistent or varying. An example of multiple defects per item would be the count of the number of scratches on mirrors. If all samples have an equal opportunity for defects use CChart, otherwise use UChart. So to monitor the number of scratches on mirrors use CChart when all mirrors being made are the same size and use UChart for mirrors being made that are sized differently.
In IMSL C# Numerical Library the ShewhartControlChart class is the base of a number of classes; it is not usually used by itself. Most of the charts in this chapter extend ShewhartControlChart.
The following diagram can be used to determine the appropriate control chart to be used in a given situation.

66 • IMSL C# Chart Programmer’s User Guide Chapter 3: Quality Control and Improvement Charts
Variable Control Charts: • XbarR estimates wµ and wσ using the ranges of the samples. It is best used
when the sample size of a continuous variable is between 2 and 10.
• RChart plots the sample ranges. It is typically used in conjunction with XbarR.
• XbarS estimates wµ and wσ using the means and standard deviations of the samples. It is best used when the sample size of a continuous variable is at least 10.
• SChart plots the sample standard deviations. It is typically used in conjunction with XbarS.
• XmR is a moving range chart. It is used when the sample size of a continuous variable is one.

Chapter 3: Quality Control and Improvement Charts IMSL C# Chart Programmer’s User Guide • 67
• EWMA (Exponentially Weighted Moving-Average) plots weighted moving average values. It is used when the sample size of a continuous variable is one.
Attribute Control Charts: • NpChart plots the number of defects. It is used when defects are not rare.
• PChart plots the rate of defects. It is used when defects are not rare.
• CChart plots the defect count. It is used when defects are rare.
• UChart plots the rate of defects. It is used when defects are rare.
Other Control Charts CuSum and CuSumStatus The CuSum and CuSumStatus charts are more efficient than Shewhart charts at detecting small shifts in the process mean because the plot represents the moving average of the cumulative differences between the process and its target (centerline).
Cumulative Probability Cumulative probability charts are used if the defect rate is so small that there will be long runs when the number of defects is zero.
Process Improvement Charts Pareto Chart Pareto charts are used to analyze the root cause of process defects. They are based on the “Pareto Principal” which claims that 80% of the defects are caused by only 20% of the defect categories.
Pareto charts resemble bar charts but are different. In a Pareto chart, the defect category with the largest number of defects always appears as the first and tallest bar on the chart. The other bars represent the remaining defect categories in descending order of magnitude.
ShewhartControlChart and ControlLimit The ShewhartControlChart class is primarily used as the base class of other control chart classes. It provides the common functionality for the control charts.
For example, the default IMSL.NET control charts include a center line and an upper and lower control limit at plus or minus three standard deviations from the center line. The Western Electric Company Rules (or WECO) are control limits at plus or minus one, two, and three standard deviations from the mean. They can be added using the method AddWecoLimits in the ShewhartControlChart class.

68 • IMSL C# Chart Programmer’s User Guide Chapter 3: Quality Control and Improvement Charts
The ShewhartControlChart uses the ControlLimit class for the upper and lower control limits and for the center line. Additional control limits, such as the WECO limits, can be added to a ShewhartControlChart. The line attributes can be used with ControlLimit to modify the drawing of each control limit.
The ShewhartControlChart class can be used directly when the statistics are computed by the user. In this example, data from Montgomery, Douglas C., Introduction to Statistical Quality Control, 4th Ed,., 2001, New York: John Wiley and Sons, p. 406 is plotted. The code explicitly sets the lower control limit to 7 and the upper control limit to 13.
Further citations throughout this chapter for data plotted from Montgomery appear as parenthetical citations, e.g. (Montgomery 406).
Control Limit Customization Control Limits and center lines can be added using the ControlLimit.SetValue methods; AddCenterLine().SetValue(int) (see AddCenterLine()), AddUpperControlLimit().SetValue(int) (see AddUpperControlLimit()) and AddLowerControlLimit().SetValue(int) (see AddLowerControlLimit()). It is foreseeable that the default appearance might not be optimal for every application. In particular moving components or removing the ControlLimit objects can accomplished.
Before modifying a ControlLimit title it is important to realize the ControlLimit title text is justified in the lower right corner of a Text object (TEXT_X_RIGHT | TEXT_Y_BOTTOM). With this in mind, formatted strings may be used to alter their appearance. For example, to retain the ControlLimit line but eliminate the title, get the ControlLimit and set the title to an empty string (i.e. UpperControlLimit.SetTitle("");). In addition, the following can be used to move the title closer to the y-axis (note that repeated, leading, and trailing new lines "\n" and spaces are ignored):
xbars.UpperControlLimit.SetTitle("ucl=15\t\t\t");
After being added, it may be the case that a ControlLimit should be removed. This is accomplished with the object’s inherited Remove() method.

Chapter 3: Quality Control and Improvement Charts IMSL C# Chart Programmer’s User Guide • 69
(Download Code)
using Imsl.Chart2D; using Imsl.Chart2D.QC; public class SampleShewhart : FrameChart { static double[] data = { 9.45, 7.99, 9.29, 11.66, 12.16, 10.18, 8.04, 11.46, 9.20, 10.34, 9.03, 11.47, 10.51, 9.40, 10.08, 9.37, 10.62, 10.31, 8.52, 10.84, 10.90, 9.33, 12.29, 11.50, 10.60, 11.08, 10.38, 11.62, 11.31, 10.52 }; public SampleShewhart() { Chart chart = this.Chart; AxisXY axis = new AxisXY(chart); ShewhartControlChart xbars = new ShewhartControlChart(axis); xbars.SetData(data); xbars.AddLowerControlLimit().SetValue(7); xbars.AddCenterLine().SetValue(10); xbars.AddUpperControlLimit().SetValue(13); }

70 • IMSL C# Chart Programmer’s User Guide Chapter 3: Quality Control and Improvement Charts
public static void Main(string[] argv) { System.Windows.Forms.Application.Run(new SampleShewhart()); } }
XbarS and SChart The XbarS class plots the mean of each sample as well as control limits computed using the mean of the in-sample standard deviations. The positions of the control limits are determined by the equations
43 sUCL x
c n= +
Centerline x=
43 sLCL x
c n= −
where x is the grand mean, the average of all the observations.
The factor of three in the above equations can be changed by setting the chart attribute ControlLimit. The attribute applies similarly to all of the control charts.
XbarS Example The process of forging piston rings for automobile engines was monitored. The inside diameters of 25 samples, each containing 5 piston rings, were measured. The center line is at 74.001, the average diameter of all of the measured piston rings. The upper and lower control limits are determined by the average of the standard deviations of the 25 samples of 5 rings (Montgomery 215).
The SChart plots the in-sample standard deviations of the observations as well as control limits computed using
24
43 1sUCL s c
c= + −
Centerline s=

Chapter 3: Quality Control and Improvement Charts IMSL C# Chart Programmer’s User Guide • 71
24
43 1sLCL s c
c= − −
The factor 4c is such that 4/s c is an unbiased estimator of standard deviation.
(Download Code)
using Imsl.Chart2D; using Imsl.Chart2D.QC; public class SampleXbarS : FrameChart { static double[][] diameter = { new double[] {74.03, 74.002, 74.019, 73.992, 74.008}, new double[] {73.995, 73.992, 74.001, 74.011, 74.004}, new double[] {73.988, 74.024, 74.021, 74.005, 74.002}, new double[] {74.002, 73.996, 73.993, 74.015, 74.009}, new double[] {73.992, 74.007, 74.015, 73.989, 74.014}, new double[] {74.009, 73.994, 73.997, 73.985, 73.993}, new double[] {73.995, 74.006, 73.994, 74, 74.005},

72 • IMSL C# Chart Programmer’s User Guide Chapter 3: Quality Control and Improvement Charts
new double[] {73.985, 74.003, 73.993, 74.015, 73.988}, new double[] {74.008, 73.995, 74.009, 74.005, 74.004}, new double[] {73.998, 74, 73.99, 74.007, 73.995}, new double[] {73.994, 73.998, 73.994, 73.995, 73.99}, new double[] {74.004, 74, 74.007, 74, 73.996}, new double[] {73.983, 74.002, 73.998, 73.997, 74.012}, new double[] {74.006, 73.967, 73.994, 74, 73.984}, new double[] {74.012, 74.014, 73.998, 73.999, 74.007}, new double[] {74, 73.984, 74.005, 73.998, 73.996}, new double[] {73.994, 74.012, 73.986, 74.005, 74.007}, new double[] {74.006, 74.01, 74.018, 74.003, 74}, new double[] {73.984, 74.002, 74.003, 74.005, 73.997}, new double[] {74, 74.01, 74.013, 74.02, 74.003}, new double[] {73.982, 74.001, 74.015, 74.005, 73.996}, new double[] {74.004, 73.999, 73.99, 74.006, 74.009}, new double[] {74.01, 73.989, 73.99, 74.009, 74.014}, new double[] {74.015, 74.008, 73.993, 74, 74.01}, new double[] {73.982, 73.984, 73.995, 74.017, 74.013} }; public SampleXbarS() { Chart chart = this.Chart; AxisXY axis = new AxisXY(chart); XbarS xbars = new XbarS(axis, diameter); xbars.UpperControlLimit.SetTitle("ucl = {0:0.0000}"); axis.AxisX.AxisTitle.SetTitle("Sample Number"); axis.AxisX.AxisLabel.TextFormat = "0"; axis.AxisY.AxisTitle.SetTitle("Piston Ring Diameter"); axis.AxisY.AutoscaleInput = Axis.AUTOSCALE_OFF; axis.AxisY.SetWindow(73.985, 74.015); } public static void Main(string[] argv) { System.Windows.Forms.Application.Run(new SampleXbarS()); } }
SChart Example This example uses the same piston ring data as was used in the XbarS example on page 70, but now the standard deviations of the samples are plotted. The center line is at 0.009, the average of the sample standard deviations.
Often the XbarS and SChart are plotted together. The XbarS class contains the static method CreateCharts, which creates this pair of plots on a single chart.

Chapter 3: Quality Control and Improvement Charts IMSL C# Chart Programmer’s User Guide • 73
(Download Code)
using Imsl.Chart2D; using Imsl.Chart2D.QC; public class SampleSChart : FrameChart { static double[][] diameter = { new double[] {74.03, 74.002, 74.019, 73.992, 74.008}, new double[] {73.995, 73.992, 74.001, 74.011, 74.004}, new double[] {73.988, 74.024, 74.021, 74.005, 74.002}, new double[] {74.002, 73.996, 73.993, 74.015, 74.009}, new double[] {73.992, 74.007, 74.015, 73.989, 74.014}, new double[] {74.009, 73.994, 73.997, 73.985, 73.993}, new double[] {73.995, 74.006, 73.994, 74, 74.005}, new double[] {73.985, 74.003, 73.993, 74.015, 73.988}, new double[] {74.008, 73.995, 74.009, 74.005, 74.004}, new double[] {73.998, 74, 73.99, 74.007, 73.995}, new double[] {73.994, 73.998, 73.994, 73.995, 73.99}, new double[] {74.004, 74, 74.007, 74, 73.996}, new double[] {73.983, 74.002, 73.998, 73.997, 74.012}, new double[] {74.006, 73.967, 73.994, 74, 73.984}, new double[] {74.012, 74.014, 73.998, 73.999, 74.007},
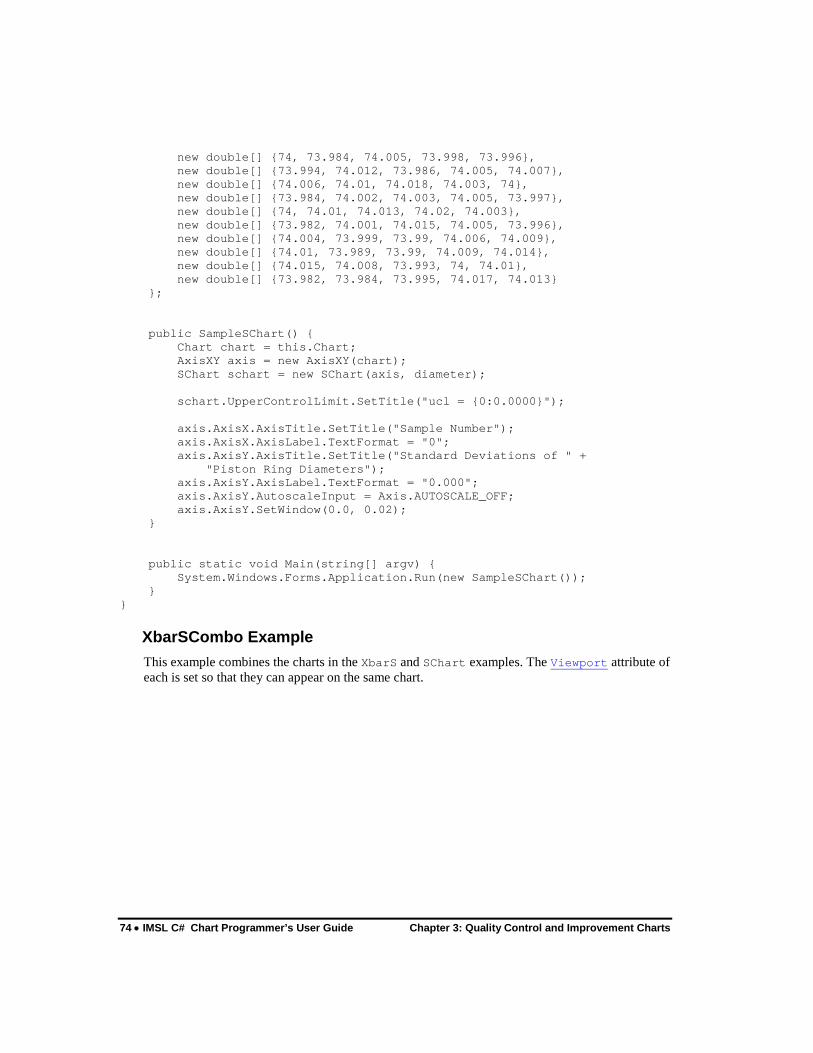
74 • IMSL C# Chart Programmer’s User Guide Chapter 3: Quality Control and Improvement Charts
new double[] {74, 73.984, 74.005, 73.998, 73.996}, new double[] {73.994, 74.012, 73.986, 74.005, 74.007}, new double[] {74.006, 74.01, 74.018, 74.003, 74}, new double[] {73.984, 74.002, 74.003, 74.005, 73.997}, new double[] {74, 74.01, 74.013, 74.02, 74.003}, new double[] {73.982, 74.001, 74.015, 74.005, 73.996}, new double[] {74.004, 73.999, 73.99, 74.006, 74.009}, new double[] {74.01, 73.989, 73.99, 74.009, 74.014}, new double[] {74.015, 74.008, 73.993, 74, 74.01}, new double[] {73.982, 73.984, 73.995, 74.017, 74.013} }; public SampleSChart() { Chart chart = this.Chart; AxisXY axis = new AxisXY(chart); SChart schart = new SChart(axis, diameter); schart.UpperControlLimit.SetTitle("ucl = {0:0.0000}"); axis.AxisX.AxisTitle.SetTitle("Sample Number"); axis.AxisX.AxisLabel.TextFormat = "0"; axis.AxisY.AxisTitle.SetTitle("Standard Deviations of " + "Piston Ring Diameters"); axis.AxisY.AxisLabel.TextFormat = "0.000"; axis.AxisY.AutoscaleInput = Axis.AUTOSCALE_OFF; axis.AxisY.SetWindow(0.0, 0.02); } public static void Main(string[] argv) { System.Windows.Forms.Application.Run(new SampleSChart()); } }
XbarSCombo Example This example combines the charts in the XbarS and SChart examples. The Viewport attribute of each is set so that they can appear on the same chart.

Chapter 3: Quality Control and Improvement Charts IMSL C# Chart Programmer’s User Guide • 75
(Download Code)
using Imsl.Chart2D; using Imsl.Chart2D.QC; public class SampleXbarSCombo : FrameChart { static double[][] diameter = { new double[] {74.03, 74.002, 74.019, 73.992, 74.008}, new double[] {73.995, 73.992, 74.001, 74.011, 74.004}, new double[] {73.988, 74.024, 74.021, 74.005, 74.002}, new double[] {74.002, 73.996, 73.993, 74.015, 74.009}, new double[] {73.992, 74.007, 74.015, 73.989, 74.014}, new double[] {74.009, 73.994, 73.997, 73.985, 73.993}, new double[] {73.995, 74.006, 73.994, 74, 74.005}, new double[] {73.985, 74.003, 73.993, 74.015, 73.988}, new double[] {74.008, 73.995, 74.009, 74.005, 74.004}, new double[] {73.998, 74, 73.99, 74.007, 73.995}, new double[] {73.994, 73.998, 73.994, 73.995, 73.99},

76 • IMSL C# Chart Programmer’s User Guide Chapter 3: Quality Control and Improvement Charts
new double[] {74.004, 74, 74.007, 74, 73.996}, new double[] {73.983, 74.002, 73.998, 73.997, 74.012}, new double[] {74.006, 73.967, 73.994, 74, 73.984}, new double[] {74.012, 74.014, 73.998, 73.999, 74.007}, new double[] {74, 73.984, 74.005, 73.998, 73.996}, new double[] {73.994, 74.012, 73.986, 74.005, 74.007}, new double[] {74.006, 74.01, 74.018, 74.003, 74}, new double[] {73.984, 74.002, 74.003, 74.005, 73.997}, new double[] {74, 74.01, 74.013, 74.02, 74.003}, new double[] {73.982, 74.001, 74.015, 74.005, 73.996}, new double[] {74.004, 73.999, 73.99, 74.006, 74.009}, new double[] {74.01, 73.989, 73.99, 74.009, 74.014}, new double[] {74.015, 74.008, 73.993, 74, 74.01}, new double[] {73.982, 73.984, 73.995, 74.017, 74.013} }; public SampleXbarSCombo() { Chart chart = this.Chart; ShewhartControlChart[] charts = XbarS.CreateCharts(chart, diameter); AxisXY axis = (AxisXY)(charts[0].Axis); axis.AxisY.AutoscaleInput = Axis.AUTOSCALE_OFF; axis.AxisY.SetWindow(73.985, 74.015); axis = (AxisXY)(charts[1].Axis); axis.AxisY.AxisLabel.TextFormat = "0.000"; axis.AxisY.AutoscaleInput = Axis.AUTOSCALE_OFF; axis.AxisY.SetWindow(0.0, 0.02); ((SChart)charts[1]).UpperControlLimit.SetTitle("ucl = {0:0.0000}"); } public static void Main(string[] argv) { System.Windows.Forms.Application.Run(new SampleXbarSCombo()); } }
XbarSUnequal Example The example again uses the piston ring data, but now the sample size is not uniform. The upper and lower control limits are now stair-step lines. The control limits are farther apart for smaller samples.
It is also possible to plot just the XbarS or SChart with unequal sample sizes.

Chapter 3: Quality Control and Improvement Charts IMSL C# Chart Programmer’s User Guide • 77
(Download Code)
using Imsl.Chart2D; using Imsl.Chart2D.QC; public class SampleXbarSUnequal : FrameChart { static double[][] diameter = { new double[] {74.03, 74.002, 74.019, 73.992, 74.008}, new double[] {73.995, 73.992, 74.001}, new double[] {73.988, 74.024, 74.021, 74.005, 74.002}, new double[] {74.002, 73.996, 73.993, 74.015, 74.009}, new double[] {73.992, 74.007, 74.015, 73.989, 74.014}, new double[] {74.009, 73.994, 73.997, 73.985}, new double[] {73.995, 74.006, 73.994, 74}, new double[] {73.985, 74.003, 73.993, 74.015, 73.988}, new double[] {74.008, 73.995, 74.009, 74.005}, new double[] {73.998, 74, 73.99, 74.007, 73.995}, new double[] {73.994, 73.998, 73.994, 73.995, 73.99}, new double[] {74.004, 74, 74.007, 74, 73.996}, new double[] {73.983, 74.002, 73.998}, new double[] {74.006, 73.967, 73.994, 74, 73.984},
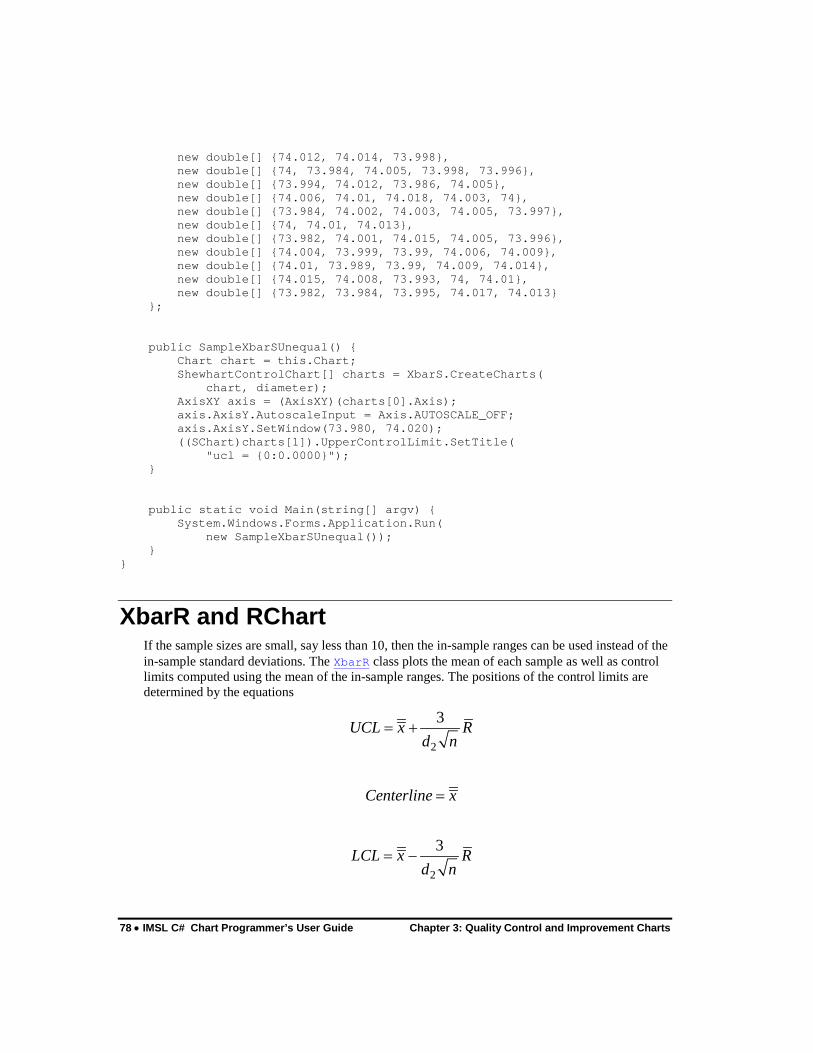
78 • IMSL C# Chart Programmer’s User Guide Chapter 3: Quality Control and Improvement Charts
new double[] {74.012, 74.014, 73.998}, new double[] {74, 73.984, 74.005, 73.998, 73.996}, new double[] {73.994, 74.012, 73.986, 74.005}, new double[] {74.006, 74.01, 74.018, 74.003, 74}, new double[] {73.984, 74.002, 74.003, 74.005, 73.997}, new double[] {74, 74.01, 74.013}, new double[] {73.982, 74.001, 74.015, 74.005, 73.996}, new double[] {74.004, 73.999, 73.99, 74.006, 74.009}, new double[] {74.01, 73.989, 73.99, 74.009, 74.014}, new double[] {74.015, 74.008, 73.993, 74, 74.01}, new double[] {73.982, 73.984, 73.995, 74.017, 74.013} }; public SampleXbarSUnequal() { Chart chart = this.Chart; ShewhartControlChart[] charts = XbarS.CreateCharts( chart, diameter); AxisXY axis = (AxisXY)(charts[0].Axis); axis.AxisY.AutoscaleInput = Axis.AUTOSCALE_OFF; axis.AxisY.SetWindow(73.980, 74.020); ((SChart)charts[1]).UpperControlLimit.SetTitle( "ucl = {0:0.0000}"); } public static void Main(string[] argv) { System.Windows.Forms.Application.Run( new SampleXbarSUnequal()); } }
XbarR and RChart If the sample sizes are small, say less than 10, then the in-sample ranges can be used instead of the in-sample standard deviations. The XbarR class plots the mean of each sample as well as control limits computed using the mean of the in-sample ranges. The positions of the control limits are determined by the equations
2
3UCL x Rd n
= +
Centerline x=
2
3LCL x Rd n
= −

Chapter 3: Quality Control and Improvement Charts IMSL C# Chart Programmer’s User Guide • 79
where x is the grand mean (the average of all obeservations), and 2d is the mean of the distribution of the ranges of n samples from the normal distribution with mean of zero and standard deviation of one. The standard deviation of this distribution is 3d . Therefore
3
2
d Rd
is an estimator of the standard deviation of the ranges.
XbarR Example This example creates an XbarR chart using the same piston ring data previously used for the XbarS example. Here the in-sample ranges are used to compute the control limits, rather than the in-sample standard deviations (Montgomery 215).
(Download Code)
using Imsl.Chart2D;

80 • IMSL C# Chart Programmer’s User Guide Chapter 3: Quality Control and Improvement Charts
using Imsl.Chart2D.QC; public class SampleXbarR : FrameChart { static double[][] diameter = { new double[] {74.03, 74.002, 74.019, 73.992, 74.008}, new double[] {73.995, 73.992, 74.001, 74.011, 74.004}, new double[] {73.988, 74.024, 74.021, 74.005, 74.002}, new double[] {74.002, 73.996, 73.993, 74.015, 74.009}, new double[] {73.992, 74.007, 74.015, 73.989, 74.014}, new double[] {74.009, 73.994, 73.997, 73.985, 73.993}, new double[] {73.995, 74.006, 73.994, 74, 74.005}, new double[] {73.985, 74.003, 73.993, 74.015, 73.988}, new double[] {74.008, 73.995, 74.009, 74.005, 74.004}, new double[] {73.998, 74, 73.99, 74.007, 73.995}, new double[] {73.994, 73.998, 73.994, 73.995, 73.99}, new double[] {74.004, 74, 74.007, 74, 73.996}, new double[] {73.983, 74.002, 73.998, 73.997, 74.012}, new double[] {74.006, 73.967, 73.994, 74, 73.984}, new double[] {74.012, 74.014, 73.998, 73.999, 74.007}, new double[] {74, 73.984, 74.005, 73.998, 73.996}, new double[] {73.994, 74.012, 73.986, 74.005, 74.007}, new double[] {74.006, 74.01, 74.018, 74.003, 74}, new double[] {73.984, 74.002, 74.003, 74.005, 73.997}, new double[] {74, 74.01, 74.013, 74.02, 74.003}, new double[] {73.982, 74.001, 74.015, 74.005, 73.996}, new double[] {74.004, 73.999, 73.99, 74.006, 74.009}, new double[] {74.01, 73.989, 73.99, 74.009, 74.014}, new double[] {74.015, 74.008, 73.993, 74, 74.01}, new double[] {73.982, 73.984, 73.995, 74.017, 74.013} }; public SampleXbarR() { Chart chart = this.Chart; AxisXY axis = new AxisXY(chart); XbarR xbarr = new XbarR(axis, diameter); xbarr.UpperControlLimit.SetTitle("ucl = {0:0.0000}"); axis.AxisX.AxisTitle.SetTitle("Sample Number"); axis.AxisX.AxisLabel.TextFormat = "0"; axis.AxisY.AxisTitle.SetTitle("Piston Ring Diameter"); axis.AxisY.AutoscaleInput = Axis.AUTOSCALE_OFF; axis.AxisY.SetWindow(73.985, 74.015); } public static void Main(string[] argv) { System.Windows.Forms.Application.Run(new SampleXbarR()); } }

Chapter 3: Quality Control and Improvement Charts IMSL C# Chart Programmer’s User Guide • 81
XbarRCombo Example This example combines the XbarR chart with the corresponding RChart into a single chart. This is done by adjusting the Viewport attribute values for the two subcharts (Montgomery 215).
(Download Code)
using Imsl.Chart2D; using Imsl.Chart2D.QC; public class SampleXbarRCombo : FrameChart { static double[][] diameter = { new double[] {74.03, 74.002, 74.019, 73.992, 74.008}, new double[] {73.995, 73.992, 74.001, 74.011, 74.004}, new double[] {73.988, 74.024, 74.021, 74.005, 74.002}, new double[] {74.002, 73.996, 73.993, 74.015, 74.009}, new double[] {73.992, 74.007, 74.015, 73.989, 74.014}, new double[] {74.009, 73.994, 73.997, 73.985, 73.993}, new double[] {73.995, 74.006, 73.994, 74, 74.005}, new double[] {73.985, 74.003, 73.993, 74.015, 73.988}, new double[] {74.008, 73.995, 74.009, 74.005, 74.004},

82 • IMSL C# Chart Programmer’s User Guide Chapter 3: Quality Control and Improvement Charts
new double[] {73.998, 74, 73.99, 74.007, 73.995}, new double[] {73.994, 73.998, 73.994, 73.995, 73.99}, new double[] {74.004, 74, 74.007, 74, 73.996}, new double[] {73.983, 74.002, 73.998, 73.997, 74.012}, new double[] {74.006, 73.967, 73.994, 74, 73.984}, new double[] {74.012, 74.014, 73.998, 73.999, 74.007}, new double[] {74, 73.984, 74.005, 73.998, 73.996}, new double[] {73.994, 74.012, 73.986, 74.005, 74.007}, new double[] {74.006, 74.01, 74.018, 74.003, 74}, new double[] {73.984, 74.002, 74.003, 74.005, 73.997}, new double[] {74, 74.01, 74.013, 74.02, 74.003}, new double[] {73.982, 74.001, 74.015, 74.005, 73.996}, new double[] {74.004, 73.999, 73.99, 74.006, 74.009}, new double[] {74.01, 73.989, 73.99, 74.009, 74.014}, new double[] {74.015, 74.008, 73.993, 74, 74.01}, new double[] {73.982, 73.984, 73.995, 74.017, 74.013} }; public SampleXbarRCombo() { Chart chart = this.Chart; ShewhartControlChart[] charts = XbarR.CreateCharts(chart, diameter); AxisXY axis = (AxisXY)(charts[0].Axis); axis.AxisY.AutoscaleInput = Axis.AUTOSCALE_OFF; axis.AxisY.SetWindow(73.985, 74.015); } public static void Main(string[] argv) { System.Windows.Forms.Application.Run(new SampleXbarRCombo()); } }
XmR XmR is a moving range chart. It is used when only samples of size one are available. The moving range statistic is
1i i iMR x x −= −
The control limits are computed using
2,23 MRUCL x
d= +
Centerline x=

Chapter 3: Quality Control and Improvement Charts IMSL C# Chart Programmer’s User Guide • 83
2,23 MRLCL x
d= −
Where x is the mean of the observations, MR is the mean of the moving ranges and is 2,nd is the mean of the distribution of the ranges of n samples from the normal distribution with mean zero and standard deviation one.
XmR Example The viscosity of aircraft primer paint was measured. Since the paint is produced in batches, only single samples are available (Montgomery 251).
(Download Code)
using Imsl.Chart2D; using Imsl.Chart2D.QC; public class SampleXmR : FrameChart { static double[] viscosity = {

84 • IMSL C# Chart Programmer’s User Guide Chapter 3: Quality Control and Improvement Charts
33.75, 33.05, 34.00, 33.81, 33.46, 34.02, 33.68, 33.27, 33.49, 33.20, 33.62, 33.00, 33.54, 33.12, 33.84 }; public SampleXmR() { Chart chart = this.Chart; AxisXY axis = new AxisXY(chart); XmR xmr = new XmR(axis, viscosity); } public static void Main(string[] argv) { System.Windows.Forms.Application.Run(new SampleXmR()); } }
PChart The PChart plots the proportion or fraction of defective products.
The production process is assumed to be stable and successive units are assumed independent. So each unit produced is a realization of a Bernoulli random variable with parameter p, the proportion defective. The control limits are at
( )13
p pUCL p
n−
= +
Centerline p=
( )13
p pLCL p
n−
= −
By default, p is the proportion of defects observed in the data. To use a known p, set the attribute Center to p.
PChart Example Defects in the manufacturing of orange juice cans are measured. The number of defects in samples of 50 cans is counted (Montgomery 290).
The y-axis labels and the title on the control limits have been changed to use a percentage format.

Chapter 3: Quality Control and Improvement Charts IMSL C# Chart Programmer’s User Guide • 85
(Download Code)
using Imsl.Chart2D; using Imsl.Chart2D.QC; public class SamplePChart : FrameChart { static int sampleSize = 50; static int[] numberDefects = { 12, 15, 8, 10, 4, 7, 16, 9, 14, 10, 5, 6, 17, 12, 22, 8, 10, 5, 13, 11, 20, 18, 24, 15, 9, 12, 7, 13, 9, 6 }; public SamplePChart() { Chart chart = this.Chart; AxisXY axis = new AxisXY(chart); PChart pchart = new PChart(axis, sampleSize, numberDefects); pchart.LowerControlLimit.SetTitle("lcl = {0:0.00%}"); pchart.CenterLine.SetTitle("center = {0:0.00%}"); pchart.UpperControlLimit.SetTitle("ucl = {0:0.00%}"); axis.AxisX.AxisTitle.SetTitle("Sample Number");

86 • IMSL C# Chart Programmer’s User Guide Chapter 3: Quality Control and Improvement Charts
axis.AxisX.AxisLabel.TextFormat = "0"; axis.AxisY.AxisTitle.SetTitle("Percent Defective"); axis.AxisY.AxisLabel.TextFormat = "P0"; } public static void Main(string[] argv) { System.Windows.Forms.Application.Run(new SamplePChart()); } }
PChartUnequal Example In this example a PChart is computed with unequal sample sizes. The upper and lower control limits are now stair-step lines (Montgomery 300).
The y-axis labels and the title on the center line have been changed to use a percentage format.
(Download Code)
using Imsl.Chart2D; using Imsl.Chart2D.QC;
Chapter 3: Quality Control and Improvement Charts IMSL C# Chart Programmer’s User Guide • 87
public class SamplePChartUnequal : FrameChart { static int[] sampleSize = { 100, 80, 80, 100, 110, 110, 100, 100, 90, 90, 110, 120, 120, 120, 110, 80, 80, 80, 90, 100, 100, 100, 100, 90, 90 }; static int[] numberDefects = { 12, 8, 6, 9, 10, 12, 11, 16, 10, 6, 20, 15, 9, 8, 6, 8, 10, 7, 5, 8, 5, 8, 10, 6, 9 }; public SamplePChartUnequal() { Chart chart = this.Chart; AxisXY axis = new AxisXY(chart); PChart pchart = new PChart(axis, sampleSize, numberDefects); pchart.CenterLine.SetTitle("center = {0:0.00%}"); axis.AxisX.AxisTitle.SetTitle("Sample Number"); axis.AxisX.AxisLabel.TextFormat = "0"; axis.AxisY.AxisTitle.SetTitle("Percent Defective"); axis.AxisY.AxisLabel.TextFormat = "P0"; axis.AxisY.SetWindow(0.0, 0.2); axis.AxisY.AutoscaleInput = 0; } public static void Main(string[] argv) { System.Windows.Forms.Application.Run( new SamplePChartUnequal()); } }
NpChart NpChart is similar to PChart, except that the number of defects per sample is plotted, not the sample rate. The position of the control limits are given by
( )3 1UCL np np p= + −
Centerline np=
( )3 1LCL np np p= − −
where n is the number of items and p is the proportion of defective items.

88 • IMSL C# Chart Programmer’s User Guide Chapter 3: Quality Control and Improvement Charts
NpChart Example This example uses the orange juice can manufacturing data used earlier in the PChart example. In this example, the number of defects, rather than the defect rate is plotted.
(Download Code)
using Imsl.Chart2D; using Imsl.Chart2D.QC; public class SampleNpChart : FrameChart { static int sampleSize = 50; static int[] numberDefects = { 12, 15, 8, 10, 4, 7, 16, 9, 14, 10, 5, 6, 17, 12, 22, 8, 10, 5, 13, 11, 20, 18, 24, 15, 9, 12, 7, 13, 9, 6 }; public SampleNpChart() { Chart chart = this.Chart; AxisXY axis = new AxisXY(chart); NpChart npchart = new NpChart(axis, sampleSize, numberDefects); axis.AxisX.AxisTitle.SetTitle("Sample Number"); axis.AxisX.AxisLabel.TextFormat = "0";

Chapter 3: Quality Control and Improvement Charts IMSL C# Chart Programmer’s User Guide • 89
axis.AxisY.AxisTitle.SetTitle("Number Defective"); } public static void Main(string[] argv) { System.Windows.Forms.Application.Run(new SampleNpChart()); } }
CChart CChart plots the number of defects or nonconformities.
UCL c k c= +
Centerline c=
LCL c k c= −
Where c is the mean number of defects per sample and k is the value of the ControlLimit attribute for the line.
CChart Example The number of defects in samples of 100 printed circuit boards was measured (Montgomery 321).

90 • IMSL C# Chart Programmer’s User Guide Chapter 3: Quality Control and Improvement Charts
(Download Code)
using Imsl.Chart2D; using Imsl.Chart2D.QC; public class SampleCChart : FrameChart { static int[] numberDefects = { 21, 24, 16, 12, 15, 5, 28, 20, 31, 25, 20, 24, 16, 19, 10, 17, 13, 22, 18, 39, 30, 24, 16, 19, 17, 15 }; public SampleCChart() { Chart chart = this.Chart; AxisXY axis = new AxisXY(chart); CChart cchart = new CChart(axis, numberDefects); axis.AxisX.AxisTitle.SetTitle("Sample Number"); axis.AxisX.AxisLabel.TextFormat = "0"; axis.AxisY.AxisTitle.SetTitle("Number of Defects"); } public static void Main(string[] argv) { System.Windows.Forms.Application.Run(new SampleCChart());

Chapter 3: Quality Control and Improvement Charts IMSL C# Chart Programmer’s User Guide • 91
} }
CChartOmit Example This is similar to the previous chart, but two points are omitted from the statistical computations.
To do this, first the censored chart is created with the bad points omitted. The positions of the control limits in this chart are saved. This censored chart is then removed from the chart.
The second step is to create a chart using later data points, but with the position of the control limit limits set to the values computed using the censored data.
(Download Code)
using Imsl.Chart2D; using Imsl.Chart2D.QC; public class SampleCChartOmit : FrameChart { static int[] numberDefects = { 21, 24, 16, 12, 15, 5, 28, 20, 31, 25, 20, 24, 16, 19, 10, 17, 13, 22, 18, 39, 30, 24, 16, 19, 17, 15 };

92 • IMSL C# Chart Programmer’s User Guide Chapter 3: Quality Control and Improvement Charts
static int[] censoredNumberDefects = { 21, 24, 16, 12, 15, /*5,*/ 28, 20, 31, 25, 20, 24, 16, 19, 10, 17, 13, 22, 18, /*39,*/ 30, 24, 16, 19, 17, 15 }; static int[] furtherNumberDefects = { 16, 18, 12, 15, 24, 21, 28, 20, 25, 19, 18, 21, 16, 22, 19, 12, 14, 9, 16, 21 }; public SampleCChartOmit() { Chart chart = this.Chart; AxisXY axis = new AxisXY(chart); CChart censoredCChart = new CChart(axis, censoredNumberDefects); double lcl = censoredCChart.LowerControlLimit.GetValue()[0]; double center = censoredCChart.Center; double ucl = censoredCChart.UpperControlLimit.GetValue()[0]; censoredCChart.Remove(); double[] x = new double[furtherNumberDefects.Length]; for (int i = 0; i < x.Length; i++) { x[i] = numberDefects.Length + i; } CChart fullCChart = new CChart(axis, furtherNumberDefects); fullCChart.ControlData.SetX(x); fullCChart.LowerControlLimit.SetValue(lcl); fullCChart.CenterLine.SetValue(center); fullCChart.UpperControlLimit.SetValue(ucl); axis.AxisX.AxisTitle.SetTitle("Sample Number"); axis.AxisX.AxisLabel.TextFormat = "0"; axis.AxisY.AxisTitle.SetTitle("Number Defective"); } public static void Main(string[] argv) { System.Windows.Forms.Application.Run(new SampleCChartOmit()); } }
UChart UChart is a chart for monitoring the defect rate when defects are rare.
3 uUCL un
= +
Centerline u=
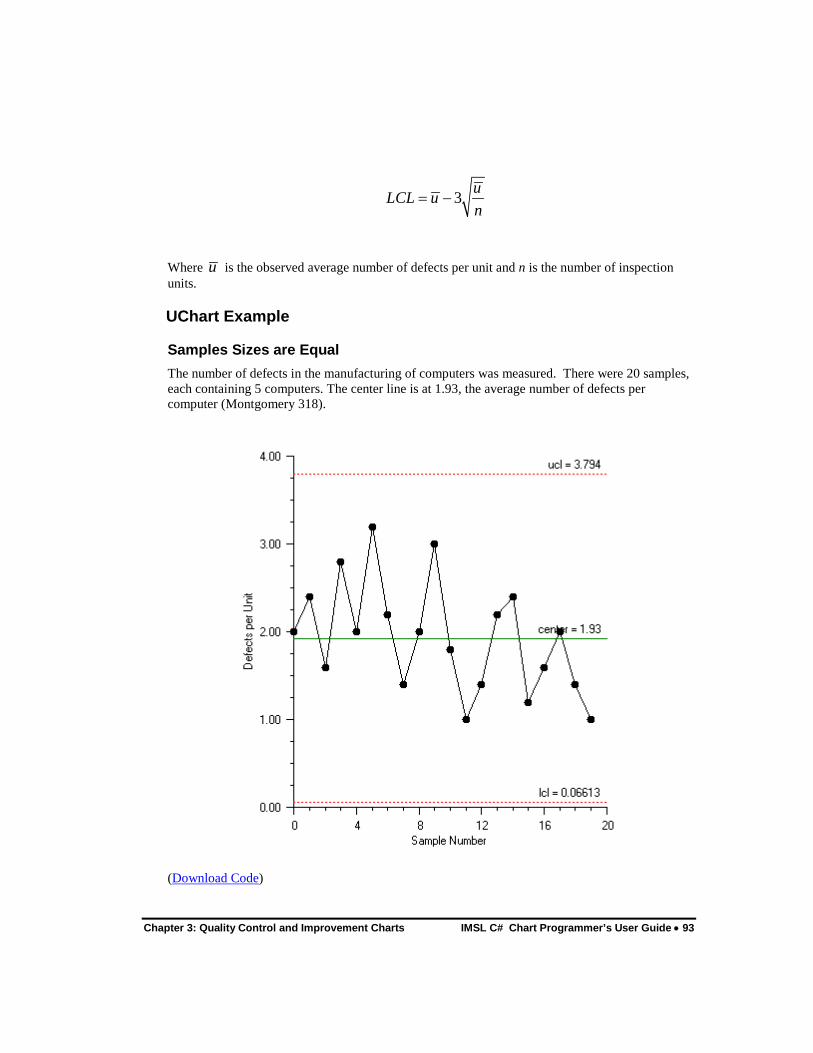
Chapter 3: Quality Control and Improvement Charts IMSL C# Chart Programmer’s User Guide • 93
3 uLCL un
= −
Where u is the observed average number of defects per unit and n is the number of inspection units.
UChart Example
Samples Sizes are Equal The number of defects in the manufacturing of computers was measured. There were 20 samples, each containing 5 computers. The center line is at 1.93, the average number of defects per computer (Montgomery 318).
(Download Code)
94 • IMSL C# Chart Programmer’s User Guide Chapter 3: Quality Control and Improvement Charts
using Imsl.Chart2D; using Imsl.Chart2D.QC; public class SampleUChart : FrameChart { static int sampleSize = 5; static int[] numberDefects = { 10, 12, 8, 14, 10, 16, 11, 7, 10, 15, 9, 5, 7, 11, 12, 6, 8, 10, 7, 5 }; public SampleUChart() { Chart chart = this.Chart; AxisXY axis = new AxisXY(chart); UChart uchart = new UChart(axis, sampleSize, numberDefects); axis.AxisX.AxisTitle.SetTitle("Sample Number"); axis.AxisX.AxisLabel.TextFormat = "0"; axis.AxisY.AxisTitle.SetTitle("Defects per Unit"); } public static void Main(string[] argv) { System.Windows.Forms.Application.Run(new SampleUChart()); } }
UChartUnequal Example
Unequal Sample Sizes Defects in dying rolls of cloth were measured. The number of defects per 50 square meters was counted. Since the sizes of the rolls differed, the number of inspection units per roll varied. The center line is at 1.423, the average number of defects per 50 square meters (Montgomery, 321).

Chapter 3: Quality Control and Improvement Charts IMSL C# Chart Programmer’s User Guide • 95
(Download Code)
using Imsl.Chart2D; using Imsl.Chart2D.QC; public class SampleUChartUnequal : FrameChart { static double[] inspectionUnitsPerRoll = { 10, 8, 13, 10, 9.5, 10, 12, 10.5, 12, 12.5 }; static int[] numberDefects = { 14, 12, 20, 11, 7, 10, 21, 16, 19, 23 }; public SampleUChartUnequal() { Chart chart = this.Chart; AxisXY axis = new AxisXY(chart); UChart uchart = new UChart(axis, inspectionUnitsPerRoll, numberDefects); axis.AxisX.AxisTitle.SetTitle("Sample Number"); axis.AxisX.AxisLabel.TextFormat = "0"; axis.AxisY.AxisTitle.SetTitle("Defects per Unit");

96 • IMSL C# Chart Programmer’s User Guide Chapter 3: Quality Control and Improvement Charts
} public static void Main(string[] argv) { System.Windows.Forms.Application.Run(new SampleUChartUnequal()); } }
EWMA EWMA is the exponentially weighted moving average control chart. It is very effective in detecting small process shifts, but is slower than Shewhart charts at detecting large process shifts.
The exponentially weighted moving average is defined to be
( ) 11i i iz x zλ λ −= + −
where 0 1λ< ≤ is a constant and the starting value is 0µ , the expected mean.
The control limits in EWMA are defined by the equations:
( )20 3 1 1
2iUCL λµ σ λ
λ = + − − −
0Centerline µ=
( )20 3 [1 1 ]
2iLCL λµ σ λ
λ= − − −
−
Where 0µ is the historical mean, σ is the historical standard deviation, and i is the sample number. Because of the presence of i the control limits are stair-steps, not constants.
EWMA Example The expected mean is 10., the expected standard deviation is 1.0 and λ is 0.10. Also, the control limit values are 2.7, not the default value of 3 (Montgomery 428).
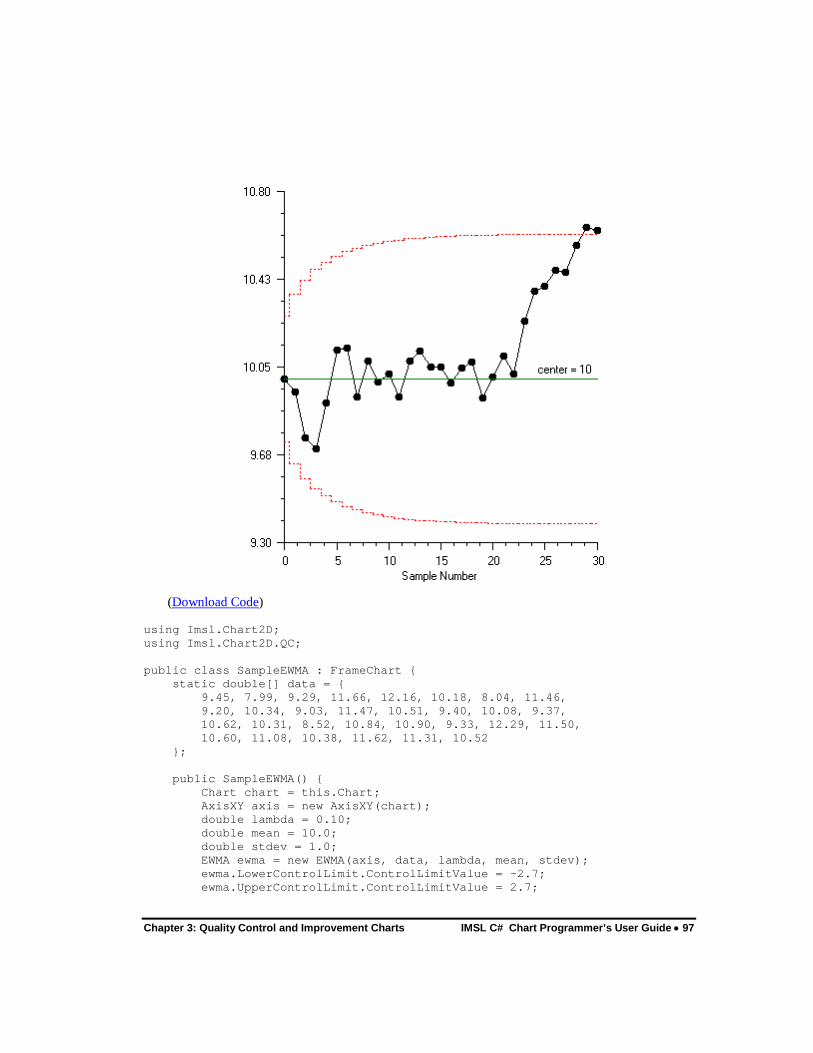
Chapter 3: Quality Control and Improvement Charts IMSL C# Chart Programmer’s User Guide • 97
(Download Code)
using Imsl.Chart2D; using Imsl.Chart2D.QC; public class SampleEWMA : FrameChart { static double[] data = { 9.45, 7.99, 9.29, 11.66, 12.16, 10.18, 8.04, 11.46, 9.20, 10.34, 9.03, 11.47, 10.51, 9.40, 10.08, 9.37, 10.62, 10.31, 8.52, 10.84, 10.90, 9.33, 12.29, 11.50, 10.60, 11.08, 10.38, 11.62, 11.31, 10.52 }; public SampleEWMA() { Chart chart = this.Chart; AxisXY axis = new AxisXY(chart); double lambda = 0.10; double mean = 10.0; double stdev = 1.0; EWMA ewma = new EWMA(axis, data, lambda, mean, stdev); ewma.LowerControlLimit.ControlLimitValue = -2.7; ewma.UpperControlLimit.ControlLimitValue = 2.7;

98 • IMSL C# Chart Programmer’s User Guide Chapter 3: Quality Control and Improvement Charts
axis.AxisX.AxisTitle.SetTitle("Sample Number"); axis.AxisX.AxisLabel.TextFormat = "0"; axis.AxisY.SetWindow(9.3, 10.8); axis.AxisY.AutoscaleInput = 0; } public static void Main(string[] argv) { System.Windows.Forms.Application.Run(new SampleEWMA()); } }
CuSum CuSum is the cumulative sum control chart. It plots the cumulative sum of the deviations of the expected value. If 0µ is the expected mean for a process and ix are the sample means then the cumulative sum is
( )1 0i i iC C x µ−= + −
CuSum Example The data used is the same as for the EWMA example.
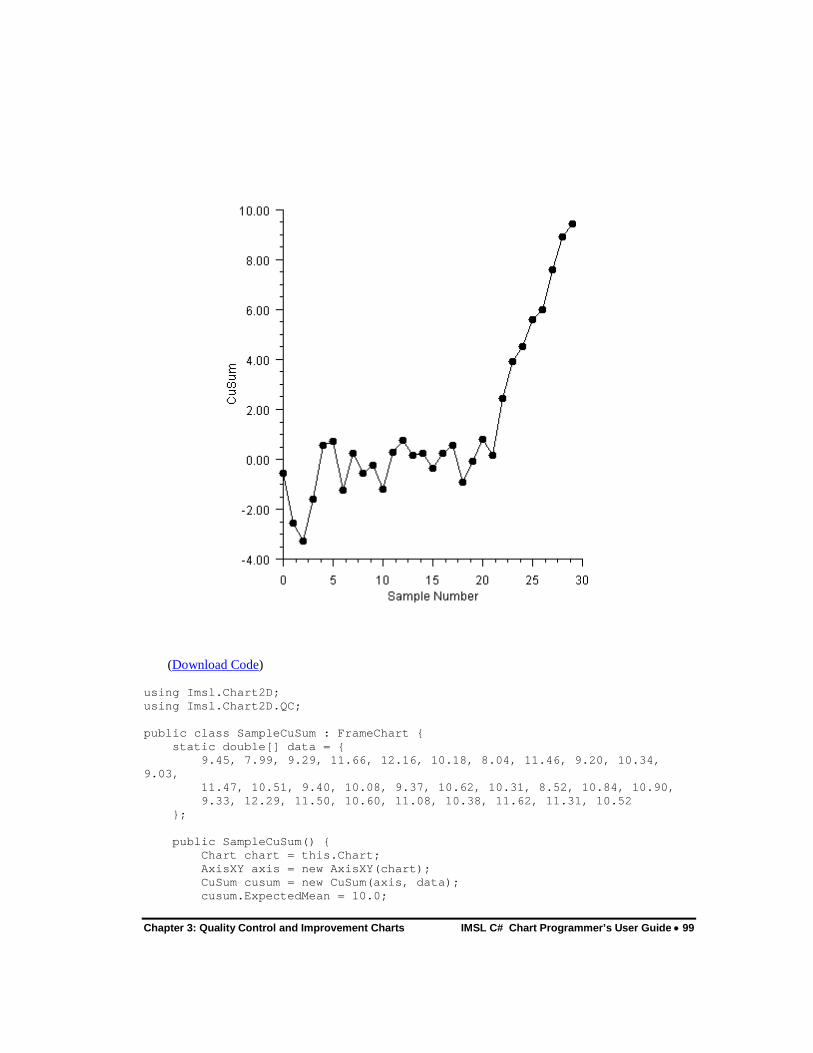
Chapter 3: Quality Control and Improvement Charts IMSL C# Chart Programmer’s User Guide • 99
(Download Code)
using Imsl.Chart2D; using Imsl.Chart2D.QC; public class SampleCuSum : FrameChart { static double[] data = { 9.45, 7.99, 9.29, 11.66, 12.16, 10.18, 8.04, 11.46, 9.20, 10.34, 9.03, 11.47, 10.51, 9.40, 10.08, 9.37, 10.62, 10.31, 8.52, 10.84, 10.90, 9.33, 12.29, 11.50, 10.60, 11.08, 10.38, 11.62, 11.31, 10.52 }; public SampleCuSum() { Chart chart = this.Chart; AxisXY axis = new AxisXY(chart); CuSum cusum = new CuSum(axis, data); cusum.ExpectedMean = 10.0;

100 • IMSL C# Chart Programmer’s User Guide Chapter 3: Quality Control and Improvement Charts
axis.AxisX.AxisTitle.SetTitle("Sample Number"); axis.AxisX.AxisLabel.TextFormat = "0"; axis.AxisY.AxisTitle.SetTitle("CuSum"); } public static void Main(string[] argv) { System.Windows.Forms.Application.Run(new SampleCuSum()); } }
CuSumStatus CuSumStatus is a tabular or status CuSum chart. The tabular CuSum statistics are
( )( )10max 0,i iiC x K Cµ
−+ += − + +
( )( )10max 0,i iiC K x Cµ
−− −= + − +
By default, both statistics have initial value zero. The parameter K is the slack value (or allowance or reference value) and 0µ is the expected mean.
The CuSumStatus chart contains two bar charts: a bar chart of i
C+ above the x-axis and a bar
chart of i
C− below the x-axis. There are also control limits at plus and minus H. The value of H
can be set either as an absolute value or as a relative value h. They are related by H hσ= , where σ is the standard deviation. By default, bars which are out-of-control are filled red while in-control bars are green. The data is also plotted on the chart.
The CuSumStatus has a Print method to print the i
C+ and i
C− values as well as i
N + and i
N −
, where i
N + is the number of consecutive periods since i
C+ rose above zero.
CuSumStatus Example This example uses the same data as used for the CuSum and EWMA examples. In this example
4H σ= .
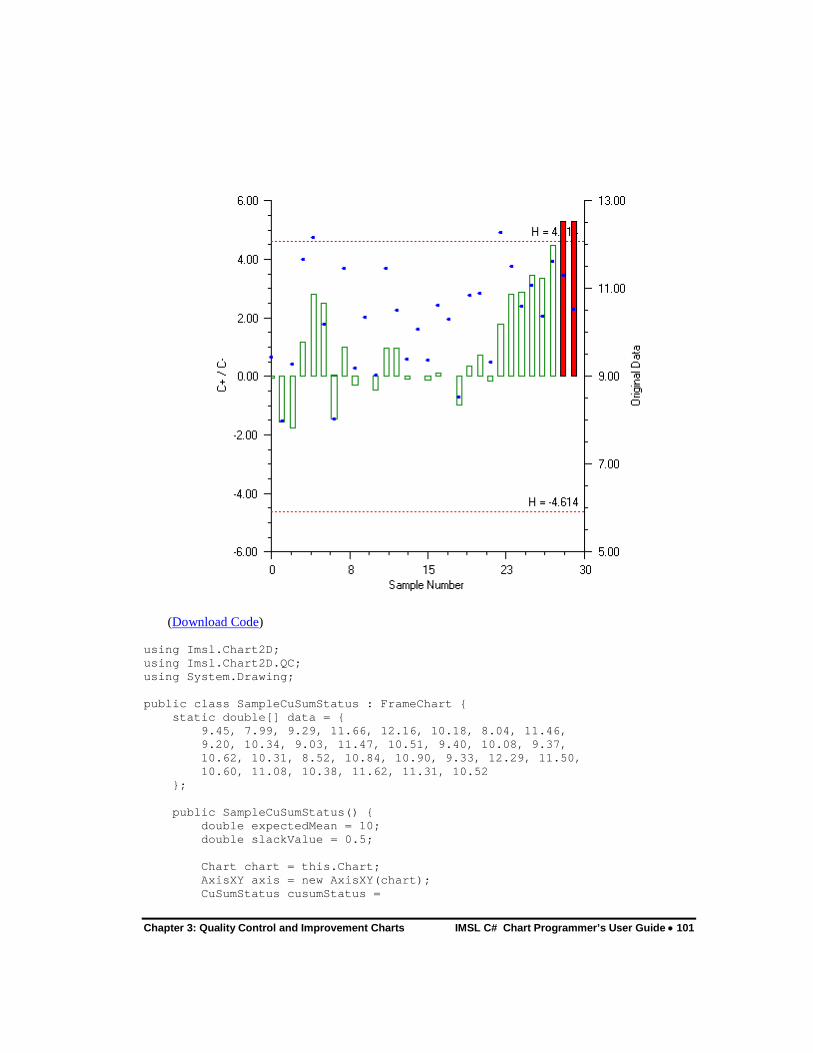
Chapter 3: Quality Control and Improvement Charts IMSL C# Chart Programmer’s User Guide • 101
(Download Code)
using Imsl.Chart2D; using Imsl.Chart2D.QC; using System.Drawing; public class SampleCuSumStatus : FrameChart { static double[] data = { 9.45, 7.99, 9.29, 11.66, 12.16, 10.18, 8.04, 11.46, 9.20, 10.34, 9.03, 11.47, 10.51, 9.40, 10.08, 9.37, 10.62, 10.31, 8.52, 10.84, 10.90, 9.33, 12.29, 11.50, 10.60, 11.08, 10.38, 11.62, 11.31, 10.52 }; public SampleCuSumStatus() { double expectedMean = 10; double slackValue = 0.5; Chart chart = this.Chart; AxisXY axis = new AxisXY(chart); CuSumStatus cusumStatus =
102 • IMSL C# Chart Programmer’s User Guide Chapter 3: Quality Control and Improvement Charts
new CuSumStatus(axis, data, expectedMean, slackValue); cusumStatus.RelativeH = 4; cusumStatus.Print(); axis.AxisX.AxisTitle.SetTitle("Sample Number"); axis.AxisX.AxisLabel.TextFormat = "0"; axis.AxisY.AxisTitle.SetTitle("C+ / C-"); axis.AxisX.SetWindow(0, 30); axis.AxisX.AutoscaleInput = 0; cusumStatus.AddDataMarkers(); cusumStatus.DataMarkers.MarkerSize = 0.5; cusumStatus.DataMarkers.MarkerColor = Color.Blue; cusumStatus.DataMarkersAxis.AxisY.AxisTitle.SetTitle( "Original Data"); cusumStatus.BarPlus.GetBarSet(0,0).FillType = Data.FILL_TYPE_NONE; cusumStatus.BarMinus.GetBarSet(0,0).FillType = Data.FILL_TYPE_NONE; cusumStatus.BarPlus.GetBarSet(0,0).FillOutlineColor = Color.Green; cusumStatus.BarMinus.GetBarSet(0,0).FillOutlineColor = Color.Green; } public static void Main(string[] argv) { System.Windows.Forms.Application.Run(new SampleCuSumStatus()); } }
Pareto Chart A ParetoChart is a frequency distribution of attribute data. The bars are ordered by the number of defects, with the attribute category having the largest number of defects appearing first.
There is an option to add a cumulative percentage line to the chart. This is the percent of defects accounted for by the current item and all items to its left. If the cumulative percentage line is added, a second axis is created on the right representing the cumulative percentage from 0% to 100%. The units of the original axis, which always appear on the left, represent the number of defects, 36.
ParetoChart Example The number of defects attributable to 1 of 19 of a variety of causes was collected (Montgomery 179). In this example, the “Incorrect dimensions” defect category has the largest number of defects, 36.

Chapter 3: Quality Control and Improvement Charts IMSL C# Chart Programmer’s User Guide • 103
(Download Code)
using Imsl.Chart2D; using Imsl.Chart2D.QC; public class SampleParetoChart : FrameChart { static string[] labels = { "Parts damaged", "Machining problems", "Supplied parts rusted", "Masking insufficient", "Misaligned weld", "Processing out of order", "Wrong part issued", "Unfinished fairing", "Adhesive failure", "Powdery alodine", "Paint out of limits", "Paint damaged by etching", "Film on parts",
104 • IMSL C# Chart Programmer’s User Guide Chapter 3: Quality Control and Improvement Charts
"Primer cans damaged", "Voids in casting", "Delaminated composite", "Incorrect dimensions", "Improper test procedure", "Salt-spray failure" }; static int[] numberDefects = { 34, 29, 13, 17, 2, 4, 3, 3, 6, 1, 2, 1, 5, 1, 2, 2, 36, 1, 4 }; public SampleParetoChart() { Chart chart = this.Chart; AxisXY axis = new AxisXY(chart); ParetoChart pareto = new ParetoChart(axis, labels, numberDefects); Data cumulativeLine = pareto.AddCumulativeLine(); cumulativeLine.MarkerType = Data.MARKER_TYPE_FILLED_CIRCLE; pareto.LabelType = ParetoChart.LABEL_TYPE_Y; pareto.TextFormat = "0"; pareto.FillColor = System.Drawing.Color.Blue; axis.AxisX.AxisLabel.TextAngle = 90; double[] vp = axis.GetViewport(); vp[0] = 0.1; vp[3] = 0.7; axis.SetViewport(vp); cumulativeLine.Axis.SetViewport(vp); } public static void Main(string[] argv) { System.Windows.Forms.Application.Run(new SampleParetoChart()); } }
Cumulative Probability If the defect rate is very small there will be long runs when the number of defects is zero. In this situation the CChart and UChart are ineffective. An alternative to defect counts is to measure the time between defects.
If the distribution of defect occurrences is Poisson, then the distribution of times between defects is exponential. Unfortunately the exponential distribution is highly skewed. Nelson suggested transforming to Weibull random variables using the transformation 1/ 3 6.x y= .
CumulativeProbability Example The number of hours between failures is measured. A normal probability plot is constructed from the transformed data. A linear regression to the transformed data is also computed. To fit a

Chapter 3: Quality Control and Improvement Charts IMSL C# Chart Programmer’s User Guide • 105
regression with the normal probability axis, the regression variable needs to be transformed using the inverse normal cumulative distribution function (Montgomery, Example 6-21, 327).
(Download Code)
using Imsl.Chart2D; using Imsl.Chart2D.QC; using Imsl.Stat; public class SampleCumulativeProbability : FrameChart { static double[] timeBetweenFailures = { 286, 948, 536, 124, 816, 729, 4, 143, 431, 8, 2837, 596, 81, 227, 603, 492, 1199, 1214, 2831, 96 }; static double[] ticks = { 0.001, 0.005, 0.01, 0.02, 0.05, 0.10, 0.20, 0.30, 0.40, 0.50, 0.60, 0.70, 0.80, 0.90, 0.95, 0.98, 0.99, 0.995, 0.999 };
106 • IMSL C# Chart Programmer’s User Guide Chapter 3: Quality Control and Improvement Charts
public SampleCumulativeProbability() { Chart chart = this.Chart; AxisXY axis = new AxisXY(chart); double a = ticks[0]; double b = ticks[ticks.Length-1]; chart.ChartTitle.SetTitle("Normal Probability Plot"); axis.AxisX.AxisTitle.SetTitle( "Transformed Time between failures"); axis.AxisY.AxisTitle.SetTitle("Cummulative Probability"); axis.AxisY.Transform = Axis.TRANSFORM_CUSTOM; Transform transform = new NormalTransform(); axis.AxisY.CustomTransform = transform; axis.AxisY.AutoscaleInput = Axis.AUTOSCALE_OFF; axis.AxisY.SetWindow(a, b); axis.AxisY.TextFormat = "P1"; axis.AxisY.SetTicks(ticks); axis.AxisY.MinorTick.IsVisible = false; int n = timeBetweenFailures.Length; double[] x = new double[n]; double[] y = new double[n]; for (int i = 0; i < x.Length; i++) { x[i] = System.Math.Pow(timeBetweenFailures[i], 1.0/3.6); } Sort.Ascending(x); for (int i = 0; i < x.Length; i++) { y[i] = (double)(i+0.5) / (double)n; } Data data = new Data(axis, x, y); data.DataType = Data.DATA_TYPE_MARKER; data.MarkerType = Data.MARKER_TYPE_FILLED_CIRCLE; // Compute an plot a regresssion line LinearRegression lr = new LinearRegression(1, true); for (int i = 0; i < n; i++) { lr.Update(new double[]{x[i]}, InvCdf.Normal(y[i])); } double[] coef = lr.GetCoefficients(); double[] lry = new double[x.Length]; for (int i = 0; i < x.Length; i++) { lry[i] = Cdf.Normal(coef[0]+coef[1]*x[i]); } Data lrData = new Data(axis, x, lry); lrData.DataType = Data.DATA_TYPE_LINE; lrData.LineColor = System.Drawing.Color.Blue; } public static void Main(string[] argv) { System.Windows.Forms.Application.Run( new SampleCumulativeProbability()); } } class NormalTransform : Transform {

Chapter 3: Quality Control and Improvement Charts IMSL C# Chart Programmer’s User Guide • 107
private double scaleA, scaleB; // Initializes the mappings between user and coordinate space. public void SetupMapping(Axis1D axis1d) { double[] w = axis1d.GetWindow(); double t = InvCdf.Normal(w[0]); scaleB = 1.0 / (InvCdf.Normal(w[1]) - t); scaleA = -scaleB * t; } // Maps a point in [0,1] to a probability. public double MapUnitToUser(double unit) { return Cdf.Normal((unit - scaleA) / scaleB); } // Maps a probablity to the interval [0,1]. public double MapUserToUnit(double p) { return scaleA + scaleB * InvCdf.Normal(p); } }
108 • IMSL C# Chart Programmer’s User Guide Chapter 4: Drawing Elements
Chapter 4: Drawing Elements
Chart 2D Drawing Elements This chapter discusses these IMSL C# Numerical Library drawing elements:
This chapter discusses these IMSL C# Numerical Library Chart 2D drawing elements: IMSL C# Numerical Library
• “Line Attributes” on page 108
• “Marker Attributes” on page 109
• “Fill Area Attributes” on page 111
• “Text Attributes” on page 114
• “Labels” on page 117
• “AxisXY” on page 121
• “Background” on page 142
• “Legend” on page 146
• “Colormaps” on page 150
• “Tool Tips” on page 151
Line Attributes All lines, except for those used to draw markers or outline filled regions, are affected by the attributes described in this section. These include axis lines and lines drawn when a Data node is rendered with its DataType attribute having its DATA_TYPE_LINE bit set.
Attribute LineColor LineColor is a Color-valued attribute that determines the color of the line. Its default value is Color.Black. IMSL charting is largely made up of classes that inherit from ChartNode. Therefore AbstractChartNode.LineColor should be used to set the line color.
Attribute LineWidth LineWidth is a double-valued attribute that determines the thickness of the lines. Its default value is 1.0. IMSL charting is largely made up of classes that inherit from ChartNode. Therefore

Chapter 4: Drawing Elements IMSL C# Chart Programmer’s User Guide • 109
AbstractChartNode.LineWidth should be used to set the line width and ChartNode.SetLineDashPattern should be used to set the line dash pattern.
Attribute LineDashPattern LineDashPattern is a double-array-valued attribute that determines the line pattern used to draw the line. It defaults to a solid line. Alternate entries in the array represent the lengths of the opaque and transparent segments of the dashes. IMSL charting is largely made up of classes that inherit from ChartNode. Therefore ChartNode.SetLineDashPattern should be used to set the line dash pattern.
Some dash patterns are defined. They are DASH_PATTERN_DOT, DASH_PATTERN_DASH and DASH_PATTERN_DASH_DOT.
Samples
Marker Attributes Markers are drawn when a Data node is rendered with its DataType attribute having its DATA_TYPE_MARKER bit set. Drawing of markers is affected by the attributes described in this section. Note that even though some markers are drawn using lines, the line attributes do not apply to markers.
An alternative to markers are images, which can be used to draw arbitrary symbols instead of markers.
Attribute MarkerType MarkerType is an integer-valued attribute that determines which marker will be drawn. There are constants defined in ChartNode for the marker types. IMSL charting is largely made up of classes that inherit from ChartNode. Therefore ChartNode.MarkerType should be used to set the line dash pattern. The default value is MARKER_TYPE_PLUS. The following are all of the defined marker types. For clarity, these are drawn larger than normal.
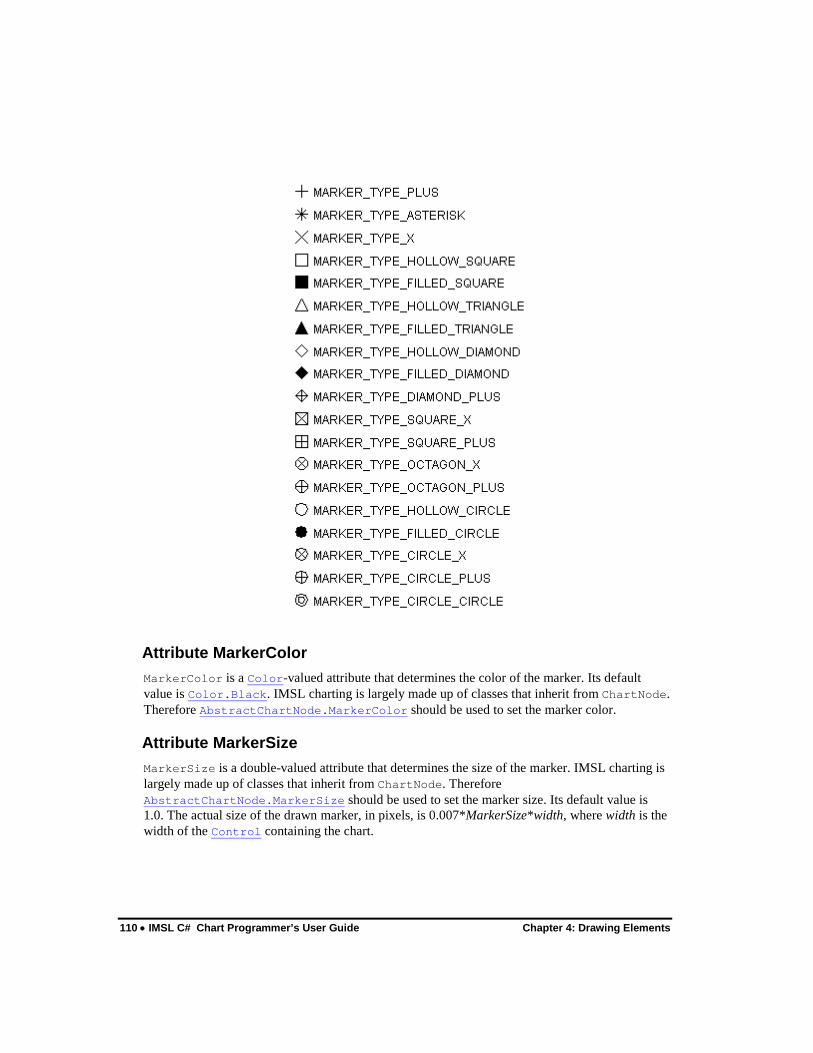
110 • IMSL C# Chart Programmer’s User Guide Chapter 4: Drawing Elements
Attribute MarkerColor MarkerColor is a Color-valued attribute that determines the color of the marker. Its default value is Color.Black. IMSL charting is largely made up of classes that inherit from ChartNode. Therefore AbstractChartNode.MarkerColor should be used to set the marker color.
Attribute MarkerSize MarkerSize is a double-valued attribute that determines the size of the marker. IMSL charting is largely made up of classes that inherit from ChartNode. Therefore AbstractChartNode.MarkerSize should be used to set the marker size. Its default value is 1.0. The actual size of the drawn marker, in pixels, is 0.007*MarkerSize*width, where width is the width of the Control containing the chart.

Chapter 4: Drawing Elements IMSL C# Chart Programmer’s User Guide • 111
Attribute MarkerThickness MarkerThickness is a double-valued attribute that determines the thickness of the lines used to draw the marker. Its default value is 1.0. IMSL charting is largely made up of classes that inherit from ChartNode. Therefore ChartNode.MarkerThickness should be used to set the marker thickness.
Attribute MarkerDashPattern MarkerDashPattern is a double-array-valued attribute that determines the line pattern used to draw the marker. IMSL charting is largely made up of classes that inherit from ChartNode. Therefore ChartNode.SetMarkerDashPattern should be used to set the marker dash pattern. It defaults to a solid line. Alternate entries in the array represent the lengths of the opaque and transparent segments of the dashes.
Some dash patterns are defined. They are DASH_PATTERN_DOT, DASH_PATTERN_DASH and DASH_PATTERN_DASH_DOT.
NOTE: MarkerDashPattern is a double-array-valued attribute that determines the line pattern used to draw the marker. It defaults to a solid line. Alternate entries in the array represent the lengths of the opaque and transparent segments of the dashes. These patterns will be more recognizable with larger marker sizes.
Samples
Fill Area Attributes FillOutlineType FillOutlineType is an integer-value attribute that turns on or off the drawing of an outline around filled areas. IMSL charting is largely made up of classes that inherit from ChartNode. Therefore ChartNode.FillOutlineType should be used to set the fill outline type. Its value

112 • IMSL C# Chart Programmer’s User Guide Chapter 4: Drawing Elements
should be FILL_TYPE_NONE (for outline off) or FILL_TYPE_SOLID (for outline on). The default is to draw solid lines.
FillOutlineColor FillOutlineColor is a Color-valued attribute that determines the color used to outline the filled regions. IMSL charting is largely made up of classes that inherit from ChartNode. Therefore ChartNode.FillOutlineColor should be used to set the fill outline color. The outline is drawn only if the attribute FillOutlineType has the value FILL_TYPE_SOLID. Its default value is Color.Black.
FillType FillType is an integer-value attribute that turns on or off the drawing of the interior of filled areas. IMSL charting is largely made up of classes that inherit from ChartNode. Therefore ChartNode.FillType should be used to set the fill outline color. Its value should be
• FILL_TYPE_NONE for fill off.
• FILL_TYPE_SOLID for fill by a single, solid color. This is the default.
• FILL_TYPE_GRADIENT for fill by a color gradient.
• FILL_TYPE_PAINT for fill by a Brush object. This is usually a TextureBrush.
FillColor FillColor is a Color-valued attribute that determines the color used to fill a region with a solid color. Its default value is Color.Black. IMSL charting is largely made up of classes that inherit from ChartNode. Therefore AbstractChartNode.FillColor should be used to set the fill color.
Gradient Gradient is a Color array-valued attribute that fills a region with a gradient color. It does not have a default value. IMSL charting is largely made up of classes that inherit from ChartNode. Therefore ChartNode.SetGradient should be used to set the gradient.
The value of Gradient should be an array of four colors. These are the colors at the four corners of a square. In order they are: lower-left, lower-right, upper-right and upper-left.
• If the lower-side colors are equal (color[0] equals color[1]) and the upper-side colors are equal (color[2] equals color[3]), then a vertical gradient is drawn.
• If the left-side colors are equal (color[0] equals color[3]) and the right-side colors are equal (color[1] equals color[2]), then a horizontal gradient is drawn.

Chapter 4: Drawing Elements IMSL C# Chart Programmer’s User Guide • 113
• If the lower-right and upper-left colors (color[1] and color[3]) are null, then a diagonal gradient is drawn using the lower-left (color[0]) and upper-right (color[2]) colors.
• If the lower-left and upper-right colors (color[0] and color[2]) are null, then a diagonal gradient is drawn using the lower-right (color[1]) and upper-left (color[3]) colors.
If none of the above patterns exist, then no gradient is drawn.
Vertical
SetGradient(Color.Yellow, Color.Yellow, Color.Red, Color.Red)
Horizontal
SetGradient(Color.Yellow, ColorRed, Color.Red, Color.Yellow)
Diagonal
SetGradient(Color.Yellow, null, Color.Red, null)
Diagonal
SetGradient(null, Color.Yellow, null, Color.Red)
FillPaint FillPaint is a Brush-valued attribute that fills a region with a tiled pattern. It does not have a default value. The method ChartNode.SetFillPaint is used to specify the FillPaint object. The class FillPaint contains utilities to define some useful paint patterns.

114 • IMSL C# Chart Programmer’s User Guide Chapter 4: Drawing Elements
Some Examples of FillPaint
FillPaint.VerticalStripe(10, 5, Color.Yellow,Color.Blue)
FillPaint.HorizontalStripe(10, 5, Color.Yellow,Color.Blue)
FillPaint.Diamond(36, 5, Color.Blue,Color.Yellow)
FillPaint.Checkerboard(24, Color.Red,Color.Yellow)
The FillPaint attribute can also be set using an Image, which is used to tile filled regions.
Text Attributes Attribute Font Text is drawn using Font objects constructed using the FontName, FontSize and FontStyle attributes. The ChartNode.Font property does not save the Font object, but sets these three attributes.
This arrangement allows one to specify font size and style at lower nodes and change the font face at the root node.
Multiline text strings are allowed. They are created by newline characters in the string that creates the text item.
Attribute FontName FontName is a string-valued attribute that specifies the logical font name or a font face name. IMSL charting is largely made up of classes that inherit from ChartNode. Therefore AbstractChartNode.FontName should be used to set the font name.

Chapter 4: Drawing Elements IMSL C# Chart Programmer’s User Guide • 115
Attribute FontSize FontSize is an integer-valued attribute that specifies the point size of the font. Its default value is 12. IMSL charting is largely made up of classes that inherit from ChartNode. Therefore AbstractChartNode.FontSize should be used to set the font size.
Attribute FontStyle FontStyle is a System.Drawing. FontStyle-valued attribute that specifies the font style. This can be a bitwise combination of any of the standard types in the FontStyle enumeration. Its default value is FontStyle.Regular. IMSL charting is largely made up of classes that inherit from ChartNode. Therefore AbstractChartNode.FontStyle should be used to set the font style.
Attribute TextAngle TextAngle is an integer-valued attribute that specifies the angle, in degrees, at which text is drawn. IMSL charting is largely made up of classes that inherit from ChartNode. Therefore ChartNode.TextAngle should be used to set the text angle. The angle is measured counterclockwise. Its default value is 0.
Attribute TextColor TextColor is a Color-valued attribute that specifies the color in which the text is drawn. Its default value is Color.Black. IMSL charting is largely made up of classes that inherit from ChartNode. Therefore AbstractChartNode.TextColor should be used to set the text color.
Attribute TextFormat TextFormat is a Format-valued or a String-valued attribute that specifies how to format string objects. IMSL charting is largely made up of classes that inherit from ChartNode. Therefore AbstractChartNode.TextFormat should be used to set the text format.The .NET Framework provides a wide variety of formatting options and convenient standard format specifiers.
For numeric values, specifiers like “C” for Currency, ‘E” for scientific exponential, and “P” for Percentage are available. DateTime objects can use “d” for a Short date pattern or “D” for a Long date pattern and many others. Custom Numeric Format Strings can be created using “0” for a zero placeholder, "#" for a digit placeholder and others. The default value is “0.00”
Attribute TextFormatProvider TextFormatProvider is an IFormatProvider-valued attribute that supplies culture-specific formatting information. IMSL charting is largely made up of classes that inherit from ChartNode. Therefore AbstractChartNode.TextFormatProvider should be used to set the text format provider. The default value is null so the default Culture-Info, DateTimeFormatInfo and NumberFormatInfo are utilized.
Attribute Title Title is a Text-valued that contains the title for a node. IMSL charting is largely made up of classes that inherit from ChartNode. Therefore, most chart classes will set a title using method
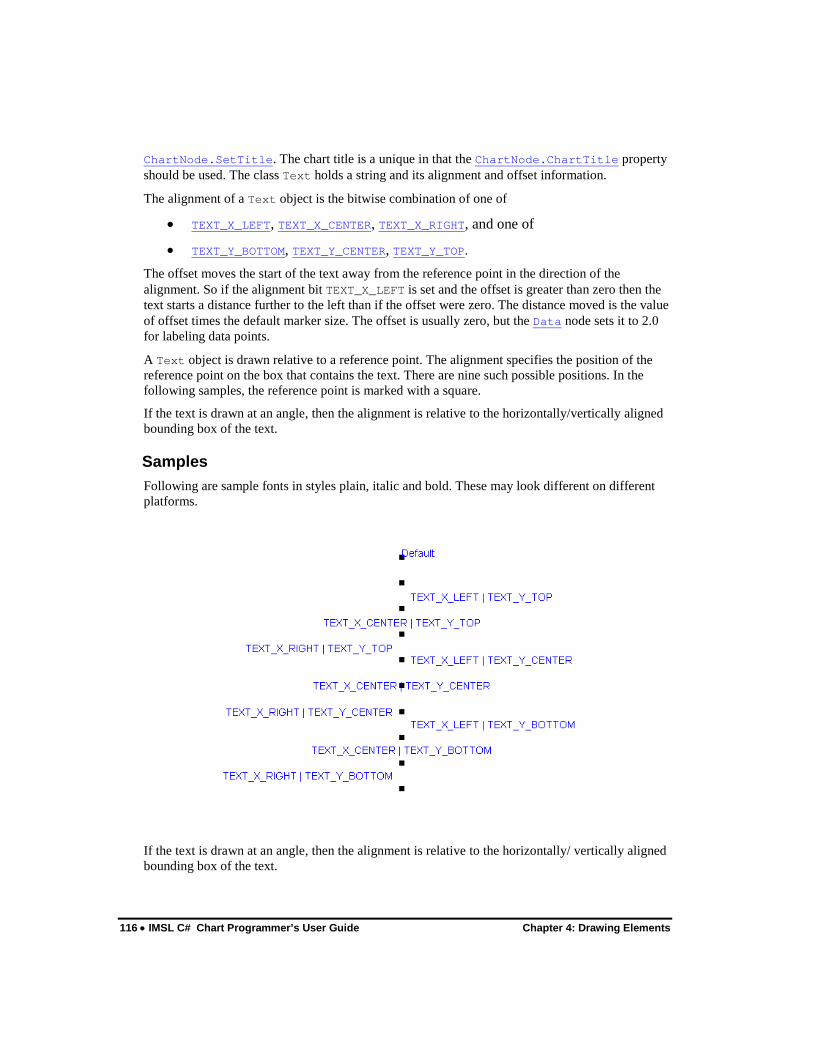
116 • IMSL C# Chart Programmer’s User Guide Chapter 4: Drawing Elements
ChartNode.SetTitle. The chart title is a unique in that the ChartNode.ChartTitle property should be used. The class Text holds a string and its alignment and offset information.
The alignment of a Text object is the bitwise combination of one of
• TEXT_X_LEFT, TEXT_X_CENTER, TEXT_X_RIGHT, and one of
• TEXT_Y_BOTTOM, TEXT_Y_CENTER, TEXT_Y_TOP. The offset moves the start of the text away from the reference point in the direction of the alignment. So if the alignment bit TEXT_X_LEFT is set and the offset is greater than zero then the text starts a distance further to the left than if the offset were zero. The distance moved is the value of offset times the default marker size. The offset is usually zero, but the Data node sets it to 2.0 for labeling data points.
A Text object is drawn relative to a reference point. The alignment specifies the position of the reference point on the box that contains the text. There are nine such possible positions. In the following samples, the reference point is marked with a square.
If the text is drawn at an angle, then the alignment is relative to the horizontally/vertically aligned bounding box of the text.
Samples Following are sample fonts in styles plain, italic and bold. These may look different on different platforms.
If the text is drawn at an angle, then the alignment is relative to the horizontally/ vertically aligned bounding box of the text.

Chapter 4: Drawing Elements IMSL C# Chart Programmer’s User Guide • 117
Labels Labels annotate data points or pie slices. As a degenerate case they can be used to place text on a chart without drawing a point. Labels are controlled by the value of the attribute LabelType in a Data node.
Multiline labels are allowed. They are created by newline characters in the string that creates the label.
Attribute LabelType The attribute LabelType takes on one of the values listed below. IMSL charting is largely made up of classes that inherit from ChartNode. Therefore AbstractChartNode.LabelType should be used to set the label type.
• LABEL_TYPE_NONE for no label. This is the default.
• LABEL_TYPE_X label with the value of the x-coordinate.
• LABEL_TYPE_Y label with the value of the y-coordinate.
• LABEL_TYPE_TITLE label with the value of the Title attribute.
• LABEL_TYPE_PERCENT label with the percentage value. This applies only to PieSlice objects.
Data Point Labeling Example This example shows three data sets, each labeled in a different fashion.
The first data set is blue and the points are labeled by the value of their x-coordinates.
The second data set is pink and the points are labeled by the value of their y-coordinates. The data set is drawn with both markers and lines.
The third data set is red and the points are labeled with the Data node’s Title attribute.
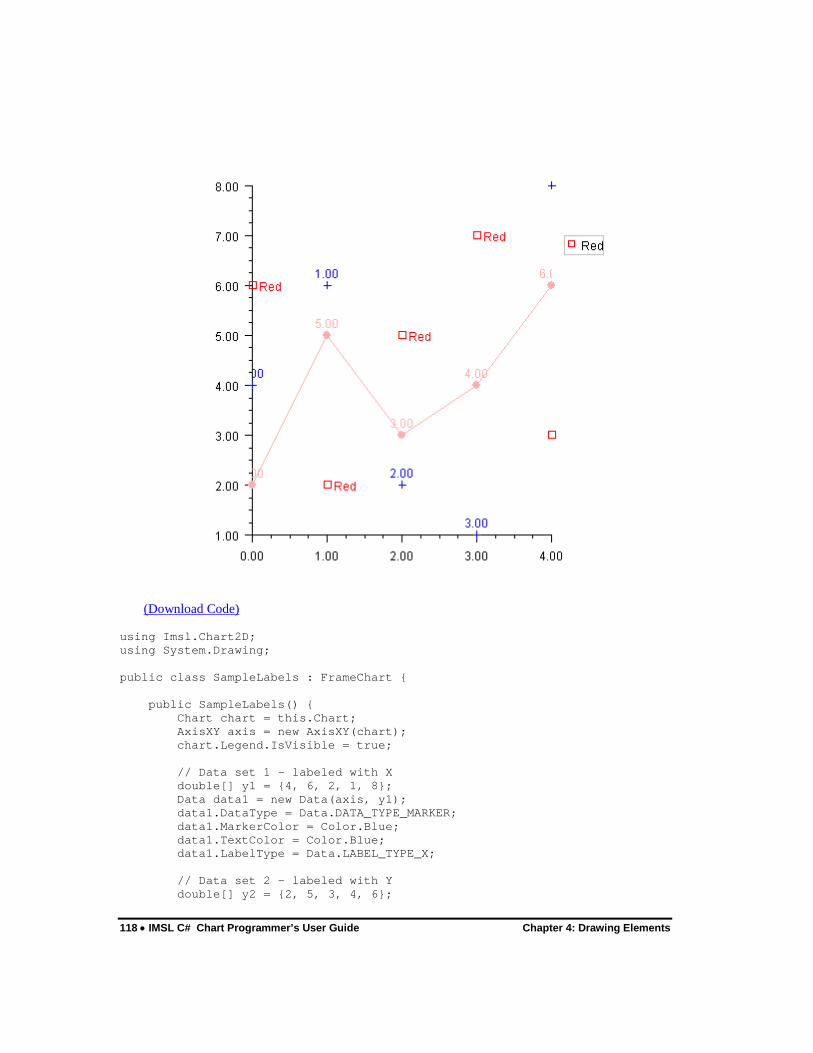
118 • IMSL C# Chart Programmer’s User Guide Chapter 4: Drawing Elements
(Download Code)
using Imsl.Chart2D; using System.Drawing; public class SampleLabels : FrameChart { public SampleLabels() { Chart chart = this.Chart; AxisXY axis = new AxisXY(chart); chart.Legend.IsVisible = true; // Data set 1 - labeled with X double[] y1 = {4, 6, 2, 1, 8}; Data data1 = new Data(axis, y1); data1.DataType = Data.DATA_TYPE_MARKER; data1.MarkerColor = Color.Blue; data1.TextColor = Color.Blue; data1.LabelType = Data.LABEL_TYPE_X; // Data set 2 - labeled with Y double[] y2 = {2, 5, 3, 4, 6};

Chapter 4: Drawing Elements IMSL C# Chart Programmer’s User Guide • 119
Data data2 = new Data(axis, y2); data2.DataType = Data.DATA_TYPE_MARKER | Data.DATA_TYPE_LINE; data2.MarkerColor = Color.Pink; data2.MarkerType = Data.MARKER_TYPE_FILLED_CIRCLE; data2.LineColor = Color.Pink; data2.TextColor = Color.Pink; data2.LabelType = Data.LABEL_TYPE_Y; // Data set 3 - labeled with Title double[] y3 = {6, 2, 5, 7, 3}; Data data3 = new Data(axis, y3); data3.DataType = Data.DATA_TYPE_MARKER; data3.MarkerColor = Color.Red; data3.MarkerType = Data.MARKER_TYPE_HOLLOW_SQUARE; data3.LineColor = Color.Red; data3.TextColor = Color.Red; data3.LabelType = Data.LABEL_TYPE_TITLE; data3.SetTitle("Red"); data3.GetTitle().Alignment = Data.TEXT_X_LEFT | Data.TEXT_Y_CENTER; } public static void Main(string[] argv) { System.Windows.Forms.Application.Run(new SampleLabels()); } }
Annotation The Annotation class can be used to place text on a chart. In this example a text message is drawn at (1,7) as its bottom left corner.
Note that it is a two line message. Newlines in the string are reflected in the chart.
The text alignment is set to TEXT_X_LEFT| TEXT_Y_BOTTOM, so (1,7) is the lower left corner of the text’s bounding box (see “Attribute Title” on page 115).

120 • IMSL C# Chart Programmer’s User Guide Chapter 4: Drawing Elements
(Download Code)
using Imsl.Chart2D; using System.Drawing; public class SampleLabelMessage : FrameChart { public SampleLabelMessage() { Chart chart = this.Chart; AxisXY axis = new AxisXY(chart); double[] y = {4, 6, 2, 1, 8}; Data data = new Data(axis, y); data.DataType = Data.DATA_TYPE_LINE; data.LineColor = Color.Pink; Text message = new Text("This is a\nsample message."); message.Alignment = Data.TEXT_X_LEFT | Data.TEXT_Y_BOTTOM;

Chapter 4: Drawing Elements IMSL C# Chart Programmer’s User Guide • 121
Annotation messageAnnotation = new Annotation(axis, message, 1.0, 7.0); messageAnnotation.TextColor = Color.Blue; } public static void Main(string[] argv) { System.Windows.Forms.Application.Run(new SampleLabelMessage()); } }
AxisXY The AxisXY node is the basis of many chart types, including scatter, line, area and error bar. Its parent node must be the root Chart node.
When an AxisXY node is created, it creates two Axis1D nodes. They can be obtained by using the methods AxisXY.AxisX and AxisXY.AxisY. Each of the Axis1D nodes in turn creates additional child nodes, as seen in the diagram below.
Properties can be chained together, so the x-axis line can be retrieved using axis.AxisX.AxisLine
The code to set the x-axis line to blue is axis.AxisX. AxisLine.LineColor = Color.Blue;

122 • IMSL C# Chart Programmer’s User Guide Chapter 4: Drawing Elements
Axis Layout The layout of an AxisXY chart, such as the one below, is controlled by the attributes Window, Density, and Number.
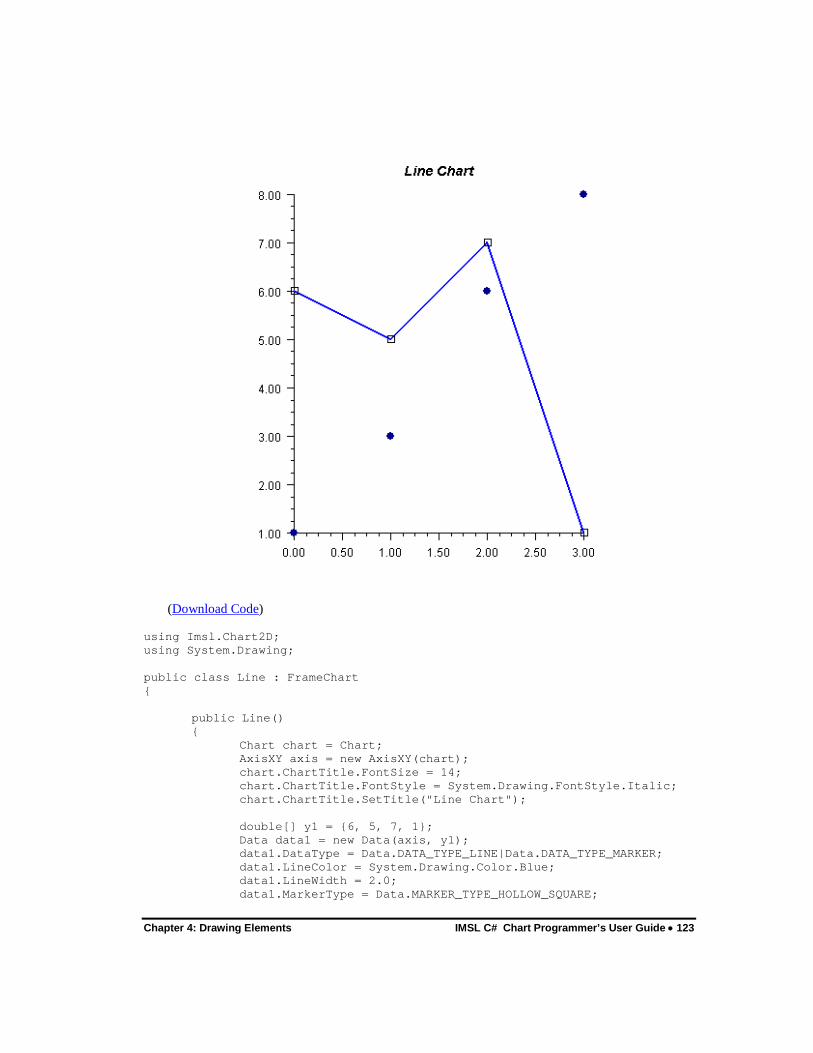
Chapter 4: Drawing Elements IMSL C# Chart Programmer’s User Guide • 123
(Download Code)
using Imsl.Chart2D; using System.Drawing; public class Line : FrameChart { public Line() { Chart chart = Chart; AxisXY axis = new AxisXY(chart); chart.ChartTitle.FontSize = 14; chart.ChartTitle.FontStyle = System.Drawing.FontStyle.Italic; chart.ChartTitle.SetTitle("Line Chart"); double[] y1 = {6, 5, 7, 1}; Data data1 = new Data(axis, y1); data1.DataType = Data.DATA_TYPE_LINE|Data.DATA_TYPE_MARKER; data1.LineColor = System.Drawing.Color.Blue; data1.LineWidth = 2.0; data1.MarkerType = Data.MARKER_TYPE_HOLLOW_SQUARE;

124 • IMSL C# Chart Programmer’s User Guide Chapter 4: Drawing Elements
data1.SetTitle("Blue Line"); double[] y2 = {1, 3, 6, 8}; Data data2 = new Data(axis, y2); data2.DataType = Data.DATA_TYPE_MARKER; data2.MarkerColor = System.Drawing.Color.DarkBlue; data2.MarkerType = Data.MARKER_TYPE_FILLED_CIRCLE; data2.SetTitle("Markers"); } public static void Main(string[] argv) { System.Windows.Forms.Application.Run(new Line()); } }
Window Window is a double-array-valued attribute that contains the axis limits. Its value is {min, max}. The AxisXY.SetWindow should be used to set the window . For the above chart, the value of the Window attribute for the x-axis is [0, 3] and for the y-axis is [1, 8].
Number Number is an integer-valued attribute that contains the number of major tick marks along an axis. IMSL charting is largely made up of classes that inherit from ChartNode. Therefore AbstractChartNode.Number should be used to set the number of ticks. In an Axis1D node its default value is 5, which is also the value in the above example.
Density Density is the number of minor tick marks per major tick mark. IMSL charting is largely made up of classes that inherit from ChartNode. Therefore AbstractChartNode.Density should be used to set the Density. Its default value is 4, which is also the value in the example.
Transform The x- and y-axes may be linear, logarithmic, or customized, as specified by the Transform attribute. IMSL charting is largely made up of classes that inherit from ChartNode. Therefore AbstractChartNode.Transform should be used to set the transform. This attribute can have the values:
• TRANSFORM_LINEAR indicating a linear axis. This is the default.
• TRANSFORM_LOG indicating a logarithmic axis.
• TRANSFORM_CUSTOM indicating a custom transformation. The transformation specified by the CustomTransform attribute is used.
Chapter 4: Drawing Elements IMSL C# Chart Programmer’s User Guide • 125
CustomTransform A customized transformation is used when the Transform attribute has the value TRANSFORM_CUSTOM. IMSL charting is largely made up of classes that inherit from ChartNode. Therefore AbstractChartNode.CustomTransform should be used to set the CustomTransform. A custom transform is an object implementing the Transform interface. It defines a mapping from the interval specified by the Window attribute to and from the interval [0,1]. See “Custom Transform” on page 135 for more information.
The class TransformDate implements the Transform interface. It maps from a regular calendar to one without weekends, which is useful for charting stock prices that are defined only on weekdays.
Autoscale Autoscaling is used to automatically determine the attribute Window (the range of numbers along an axis) and the attribute Number (the number of major tick marks). The goal is to adjust the attributes so that the data fits on the axes and the axes have “nice” numbers as labels.
Autoscaling is done in two phases. In the first (“input”) phase the actual range is determined. In the second (“output”) phase chart attributes are updated.
Attribute AutoscaleInput The action of the input phase is controlled by the value of attribute AUTOSCALE_INPUT in the axis node. IMSL charting is largely made up of classes that inherit from ChartNode. Therefore AbstractChartNode.AutoscaleInput should be used to indicate how auto scaling is to be done. It can have one of three values.
• AUTOSCALE_OFF turns off autoscaling.
• AUTOSCALE_DATA scans the values in the Data nodes that are attached to the axis to determine the data range. This is the default value.
• AUTOSCALE_WINDOW uses the value of the Window attribute to determine the data range.
Attribute AutoscaleOutput The value of the AUTOSCALE_OUTPUT attribute can be the bitwise combination of the following values.
• AUTOSCALE_OFF no attributes updated.
• AUTOSCALE_NUMBER updates the value of the Number attribute. This is the number of major tick marks along the axis.
• AUTOSCALE_WINDOW updates the value of the Window attribute. This is the range of numbers displayed along the axis.
IMSL charting is largely made up of classes that inherit from ChartNode. Therefore AbstractChartNode.AutoscaleOutput should be used to indicate how auto scaling is to be done. The default is AUTOSCALE_NUMBER |AUTOSCALE_WINDOW; both the attributes Number and Window are adjusted.

126 • IMSL C# Chart Programmer’s User Guide Chapter 4: Drawing Elements
Axis Label The AxisLabel node controls the labeling of an axis. Axis1D.AxisLabel should be used to set the AxisLabel attributes. The drawing of this node is controlled by the “Text Attributes” on page 114.
Scientific Notation If the values along an axis are large, scientific notation is more readable than a decimal format with many zeros. In this example the y-axis is labeled with scientific notation where each number has exactly two fractional digits displayed. Use axis.AxisY.AxisLabel.TextFormat and for-mat pattern, "0.00E0". See Formatting Types in the .Net Framework Developer’s Guide for details on number formatting pattern.
Date Labels If the TextFormat attribute for an axis is set to a date format, then the axis is scaled and labeled as a date/time axis instead of as a real axis.
Date information passed to the Data constructor must be a double or long, usually obtained from the Ticks property of a DateTime instance.
Skipping Weekends An additional feature of Date axes is the ability to skip weekends. This feature is often needed for charting stock price data.
To skip weekends it is necessary to adjust the autoscaling for weekdays-only. This is done by setting the attribute SkipWeekends to true. It is also necessary to set a custom transformation, TransformDate, on the axis. This is shown in the following example, which is a modification of the example in the previous section.
Skipping weekends is intended only for data sets where no weekend data exists. It will not give the expected results if the data set contains weekend data.
String Labels Any array of strings can be used to label the tick marks using the SetLabels(String[]) method. The SetLabels(String[]) method sets the Number attribute to the number of strings.
Axis Title The AxisTitle node controls the titling of an axis. The drawing of this node is controlled by the “Text Attributes” on page 114.
Axes are titled with the value of the Title attribute in the AxisTitle node. By default, the title is empty.

Chapter 4: Drawing Elements IMSL C# Chart Programmer’s User Guide • 127
Setting the Title To set an axis title, set the Title attribute in the AxisTitle node. In this example both the x-axis and y-axis titles are set.
(Download Code)
using Imsl.Chart2D; public class SampleAxisTitle : FrameChart { public SampleAxisTitle() { Chart chart = this.Chart; AxisXY axis = new AxisXY(chart); double[] y = {4, 2, 3, 9}; Data data = new Data(axis, y); axis.AxisX.AxisTitle.SetTitle("The X Axis"); axis.AxisY.AxisTitle.SetTitle("The Y Axis"); }

128 • IMSL C# Chart Programmer’s User Guide Chapter 4: Drawing Elements
public static void Main(string[] argv) { System.Windows.Forms.Application.Run(new SampleAxisTitle()); } }
More Formatting An axis title, like any other text string, can have further formatting applied.
The FontName attribute is set to “Serif” in the axis node. This value is then inherited by all of its ancestor nodes.
The TextColor attribute is set differently in the x-axis and y-axis nodes. Note that this setting is inherited by both the AxisTitle and nodes within the same axis.
The y-axis title node has its FontSize attribute set to 20, so it is larger. Also, its TextAngle attribute is set to -90. By default, the y-axis title is drawn at a 90 degree angle, so the -90 degree setting flips the title from its usual position.
(Download Code)
using Imsl.Chart2D;

Chapter 4: Drawing Elements IMSL C# Chart Programmer’s User Guide • 129
using System.Drawing; public class SampleAxisTitleFormatted : FrameChart { public SampleAxisTitleFormatted() { Chart chart = this.Chart; AxisXY axis = new AxisXY(chart); double[] y = {4, 2, 3, 9}; Data data = new Data(axis, y); axis.FontName = "Serif"; axis.AxisX.TextColor = Color.Blue; axis.AxisX.AxisTitle.SetTitle("The X Axis"); axis.AxisY.TextColor = Color.DarkGray; axis.AxisY.AxisTitle.SetTitle("The Y Axis"); axis.AxisY.AxisTitle.TextAngle = -90; axis.AxisY.AxisTitle.FontSize = 20; } public static void Main(string[] argv) { System.Windows.Forms.Application.Run( new SampleAxisTitleFormatted()); } }
Axis Unit The AxisUnit node controls the placing of a unit tag on an axis. The tag is the value of the Title attribute in the node. By default, it is empty.
The axis unit is used for labeling only; it has no other effect on the chart.
Setting the Axis Unit In this example, the axis unit for the x-axis is set to “hours” and the axis unit for the y-axis is set to “meters”. While not required, the axis titles are also set.
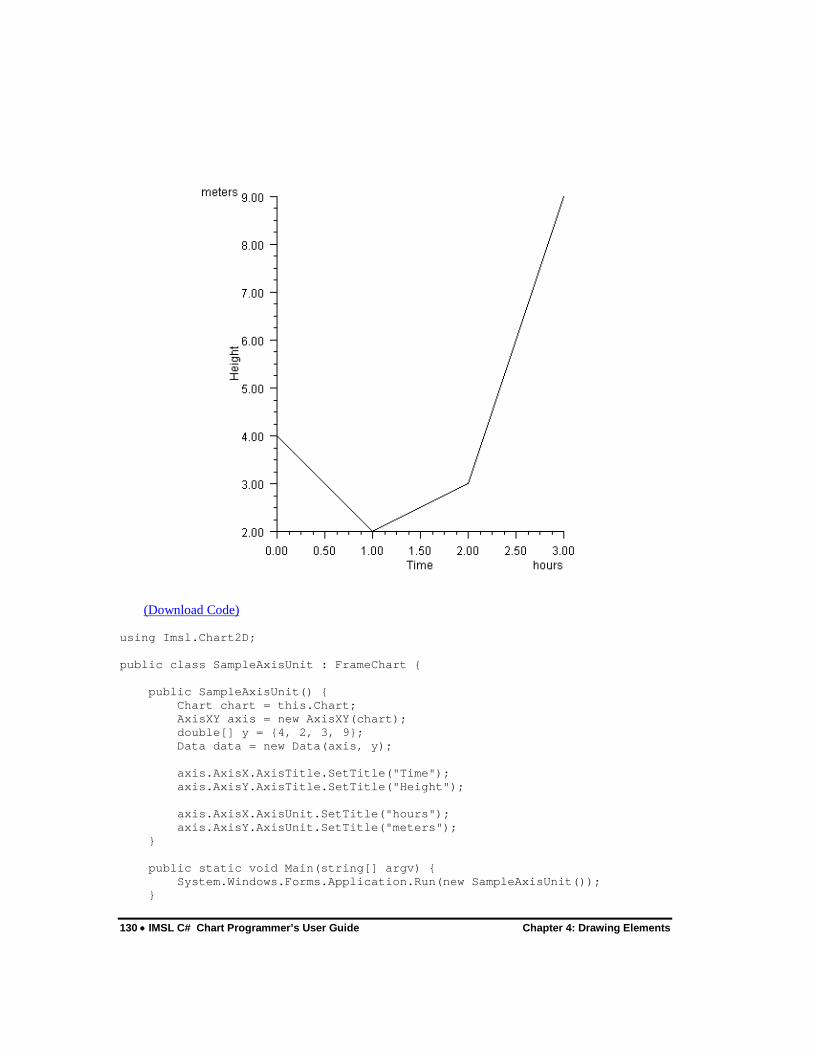
130 • IMSL C# Chart Programmer’s User Guide Chapter 4: Drawing Elements
(Download Code)
using Imsl.Chart2D; public class SampleAxisUnit : FrameChart { public SampleAxisUnit() { Chart chart = this.Chart; AxisXY axis = new AxisXY(chart); double[] y = {4, 2, 3, 9}; Data data = new Data(axis, y); axis.AxisX.AxisTitle.SetTitle("Time"); axis.AxisY.AxisTitle.SetTitle("Height"); axis.AxisX.AxisUnit.SetTitle("hours"); axis.AxisY.AxisUnit.SetTitle("meters"); } public static void Main(string[] argv) { System.Windows.Forms.Application.Run(new SampleAxisUnit()); }

Chapter 4: Drawing Elements IMSL C# Chart Programmer’s User Guide • 131
}
Major and Minor Tick Marks The nodes MajorTick and MinorTick control the drawing of tick marks on an AxisXY.
The location of the major tick marks can be set explicitly, using the Axis1D.SetTicks method. However, it is usually easier to allow autoscaling to automatically set the tick locations (see “Autoscale” on page 125).
Attribute TickLength The length of the tick marks is proportional to the screen size. They can be made relatively longer or shorter by setting the attribute TickLength. IMSL charting is largely made up of classes that inherit from ChartNode. Therefore AbstractChartNode.TickLength should be used to set the tick length. Its default value is 1.0. If its value is negative, the tick marks are drawn in the opposite direction: i.e., into the center of the plot region rather than away from it.
Attribute Number Number is the number of major tick marks along an axis. IMSL charting is largely made up of classes that inherit from ChartNode. Therefore AbstractChartNode.Number should be used to set the number of ticks.
Attribute Density
Density is the number of minor tick marks in each interval between major tick marks. The minor ticks are equally spaced in user coordinates. If the Transform attribute in not TRANSFORM_LINEAR, then they will not be equally spaced on the screen. IMSL charting is largely made up of classes that inherit from ChartNode. Therefore AbstractChartNode.Density should be used to set the Density.
Attribute FirstTick The FirstTick attribute, in an Axis1D node, is the position of the first major tick mark. Axis1D.FirstTick should be used to set the location of the first tick mark. The default value is the 0-th element of the Windows attribute.
Attribute TickInterval The TickInterval attribute, in an Axis1D node, is the interval between tick marks in the user coordinates. “Axis1D.TickInterval should be used to set the tick interval. If this attribute is not explicitly set, its value is computed from the attributes Number, Window and Transform.

132 • IMSL C# Chart Programmer’s User Guide Chapter 4: Drawing Elements
Attribute Ticks The Ticks attribute, in an Axis1D node, contains the position of the major tick marks. Axis1D.SetTicks should be used to set the ticks. If this attribute is not explicitly set, its value is computed from the attributes FirstTick, TickInterval, Number, Window and Transform.
Example This example shows the effects of the tick mark attributes. Note that autoscaling is turned off so that the attribute values are not overridden (see “Autoscale” on page 125).
On the x-axis, there are four major tick marks (Number), starting with 0.5 (FirstTick) at an interval of 1.5 (TickInterval). There are three minor tick intervals (Density) between each major tick mark. The tick marks are twice as long and are drawn in the opposite direction as normal (TickLength).
On the y-axis, the tick mark locations are set explicitly by the attribute Ticks. This automatically sets the attribute Number. The TickLength is set to -1, so the tick marks are drawn inward (to the right) instead of outward (to the left).

Chapter 4: Drawing Elements IMSL C# Chart Programmer’s User Guide • 133
(Download Code)
using Imsl.Chart2D; using System.Drawing; public class SampleTicks : FrameChart { public SampleTicks() { Chart chart = this.Chart; AxisXY axis = new AxisXY(chart); axis.AutoscaleOutput = Axis.AUTOSCALE_OFF; axis.AxisX.SetWindow(0.0, 6.0); axis.AxisX.Density = 3; axis.AxisX.Number = 4; axis.AxisX.FirstTick = 0.5; axis.AxisX.TickInterval = 1.5; axis.AxisX.TickLength = -2; axis.AxisY.SetWindow(0.0, 10.0); double[] ticksY = {0.5, 2.0, 3.0, 6.0, 10.0}; axis.AxisY.SetTicks(ticksY); axis.AxisY.TickLength = -1; double[] y = {4, 6, 2, 1, 8}; Data data = new Data(axis, y); data.DataType = Data.DATA_TYPE_LINE; data.LineColor = Color.Blue; } public static void Main(string[] argv) { System.Windows.Forms.Application.Run(new SampleTicks()); } }
Grid The Grid node controls the drawing of grid lines on a chart. The Grid is created by Axis1D as its child. It can be retrieved using the property Axis1D.Grid.
By default, Grid nodes are not drawn. To enable them, set their IsVisible property to true. Grid nodes control the drawing of the grid lines perpendicular to their parent axis. So the x-axis Grid node controls the drawing of the vertical grid lines.
Example In this example, the x-axis grid lines are painted light gray and the y-axis grid lines are pink.

134 • IMSL C# Chart Programmer’s User Guide Chapter 4: Drawing Elements
(Download Code) using Imsl.Chart2D; using System.Drawing; public class SampleGrid : FrameChart { public SampleGrid() { Chart chart = this.Chart; AxisXY axis = new AxisXY(chart); axis.AxisX.Grid.IsVisible = true; axis.AxisY.Grid.IsVisible = true; axis.AxisX.Grid.LineColor = Color.LightGray; axis.AxisY.Grid.LineColor = Color.Pink; double[] y = {4, 6, 2, 1, 8}; Data data = new Data(axis, y); data.DataType = Data.DATA_TYPE_LINE; data.LineColor = Color.Blue; }

Chapter 4: Drawing Elements IMSL C# Chart Programmer’s User Guide • 135
public static void Main(string[] argv) { System.Windows.Forms.Application.Run(new SampleGrid()); } }
Custom Transform A custom transformation allows a user-defined mapping of data to an axis. A custom transform is used when the Transform attribute has the value TRANSFORM_CUSTOM. The custom transform is the value of the CustomTransform attribute set with AbstractChartNode.CustomTransform.
A custom transform implements the Transform interface. This interface has three methods. One, SetupMapping, is called first to allow the transformation to initialize itself. The other two, MapUserToUnit and MapUnitToUser, specify a mapping from the window interval onto [0,1]. These methods must each be the inverse of the other.
Example: Normal Probability Plot A normal probability plot maps normally distributed data into a straight line, just as a semilog plot maps exponential data into a straight line.
In this example, 400 normally distributed random numbers are grouped into 20 bins. The bin counts are normalized by dividing by the number of samples (400). Cumulative probabilities are computed by summing the probabilities in all of the bins to the left of the current bin.
The custom transformation is the normal cumulative distribution function, Cdf.Normal, and its inverse, InvCdf.Normal, scaled to map the probability range [0.001,0.999] onto [0,1].
Autoscaling is turned off on the probability (y) axis and a fixed set of probability tick marks are specified.
The plot is of the bin centered on the x-axis versus the cumulative probabilities on the y-axis. The points are not in an exactly straight line because with only a finite number of samples, the distribution does not exactly match the normal distribution.
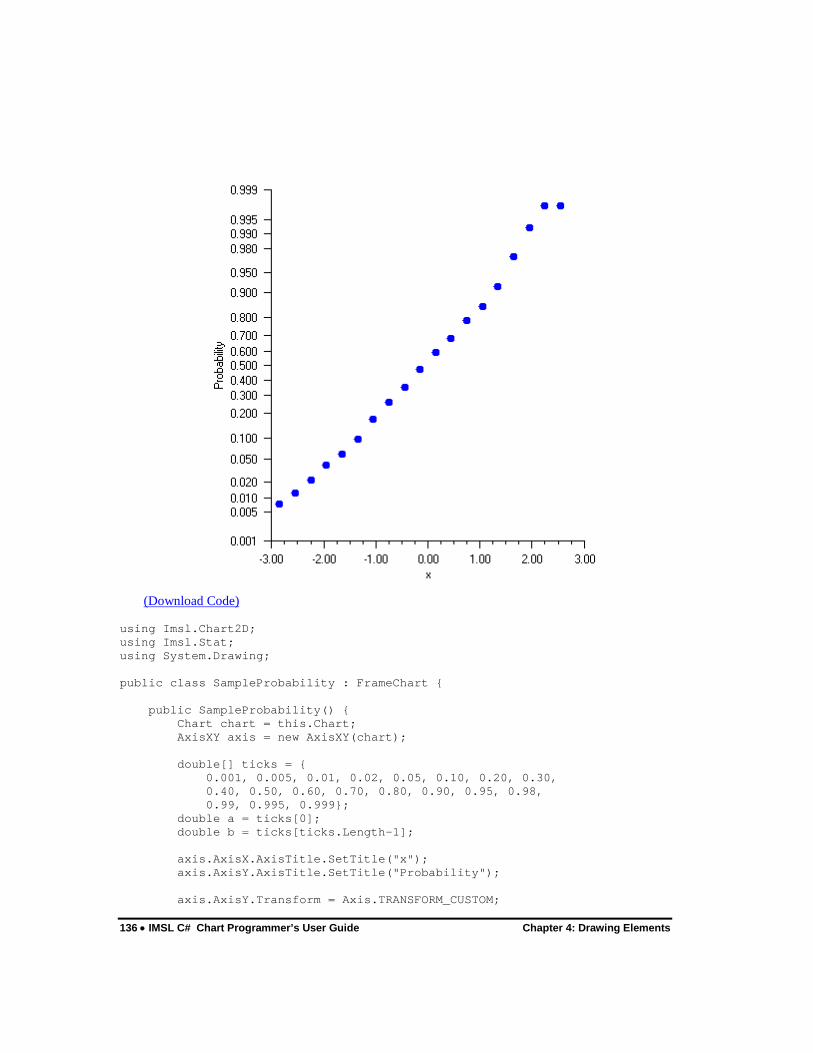
136 • IMSL C# Chart Programmer’s User Guide Chapter 4: Drawing Elements
(Download Code)
using Imsl.Chart2D; using Imsl.Stat; using System.Drawing; public class SampleProbability : FrameChart { public SampleProbability() { Chart chart = this.Chart; AxisXY axis = new AxisXY(chart); double[] ticks = { 0.001, 0.005, 0.01, 0.02, 0.05, 0.10, 0.20, 0.30, 0.40, 0.50, 0.60, 0.70, 0.80, 0.90, 0.95, 0.98, 0.99, 0.995, 0.999}; double a = ticks[0]; double b = ticks[ticks.Length-1]; axis.AxisX.AxisTitle.SetTitle("x"); axis.AxisY.AxisTitle.SetTitle("Probability"); axis.AxisY.Transform = Axis.TRANSFORM_CUSTOM;

Chapter 4: Drawing Elements IMSL C# Chart Programmer’s User Guide • 137
axis.AxisY.CustomTransform = new NormalTransform(); axis.AxisY.AutoscaleInput = Axis.AUTOSCALE_OFF; axis.AxisY.SetWindow(a, b); axis.AxisY.TextFormat = "0.000"; axis.AxisY.SetTicks(ticks); axis.AxisY.MinorTick.IsVisible = false; int nSamples = 400; int nBins = 20; // Setup the bins double[] bins = new double[nBins]; double dx = 6.0/nBins; double[] x = new double[nBins]; for (int k = 0; k < x.Length; k++) { x[k] = -3.0 + (k+0.5)*dx; } // Generate random normal deviates and sort into bins Random r = new Random(123457); for (int k = 0; k < nSamples; k++) { double t = r.NextNormal(); int j = (int)System.Math.Round((t+3.0-0.5*dx)/dx); if (j <= 0) { bins[0]++; } else if (j >= nBins-1) { bins[nBins-1]++; } else { bins[j]++; } } // Compute the cumulative distribution // y[k] is the sum of bins[j] for j=0,...,k divided by the nSamples. double[] y = new double[nBins]; y[0] = bins[0]/nSamples; for (int k = 1; k < nBins; k++) { y[k] = y[k-1] + bins[k]/nSamples; } // Plot the data using markers Data data = new Data(axis, x, y); data.DataType = Data.DATA_TYPE_MARKER; data.MarkerType = Data.MARKER_TYPE_FILLED_CIRCLE; data.MarkerColor = Color.Blue; } public static void Main(string[] argv) { System.Windows.Forms.Application.Run(new SampleProbability()); } } class NormalTransform : Transform {

138 • IMSL C# Chart Programmer’s User Guide Chapter 4: Drawing Elements
private double scaleA, scaleB; // Initializes the mappings between user and coordinate space. public void SetupMapping(Axis1D axis1d) { double[] w = axis1d.GetWindow(); double t = InvCdf.Normal(w[0]); scaleB = 1.0 / (InvCdf.Normal(w[1]) - t); scaleA = -scaleB * t; } // Maps a point in [0,1] to a probability. public double MapUnitToUser(double unit) { return Cdf.Normal((unit - scaleA) / scaleB); } // Maps a probablity to the interval [0,1]. public double MapUserToUnit(double p) { return scaleA + scaleB * InvCdf.Normal(p); } }
Multiple Axes An IMSL C# Numerical Library chart can contain any number of axes. Each axis has its own mapping from the user coordinates to the device (screen) coordinates. Normally, the x-axis is at the bottom of the chart and the y-axis is to the left. The attribute Type can be changed to move the x-axis to the top of the chart and/or the y-axis to the right of the chart.
Axis can be moved from the chart edge, either away from the chart or into the middle of the chart data area, by setting the attribute Cross.
Attribute Type The attribute Type specifies the position of an x or y-axis. Axis1D.Type should be used to set the axis type. Applied to the x-axis it can have the values AXIS_X (the default) or AXIS_X_TOP. Applied to the y-axis, it can have the value AXIS_Y (the default) or AXIS_Y_RIGHT.
Attribute Cross The Cross attribute specifies the coordinates of the intersection of the x-axis and y-axis. AxisXY.SetCross should be used to set the coordinates. This can be inside or outside of the chart body. Cross can be used to place multiple y-axes to the left of the chart or multiple x-axes below the chart.
Example Two data sets are plotted, each on its own axis. The first (blue) axis is left in the default position with the y-axis on the left. The second (pink) axis has its y-axis moved to the left.
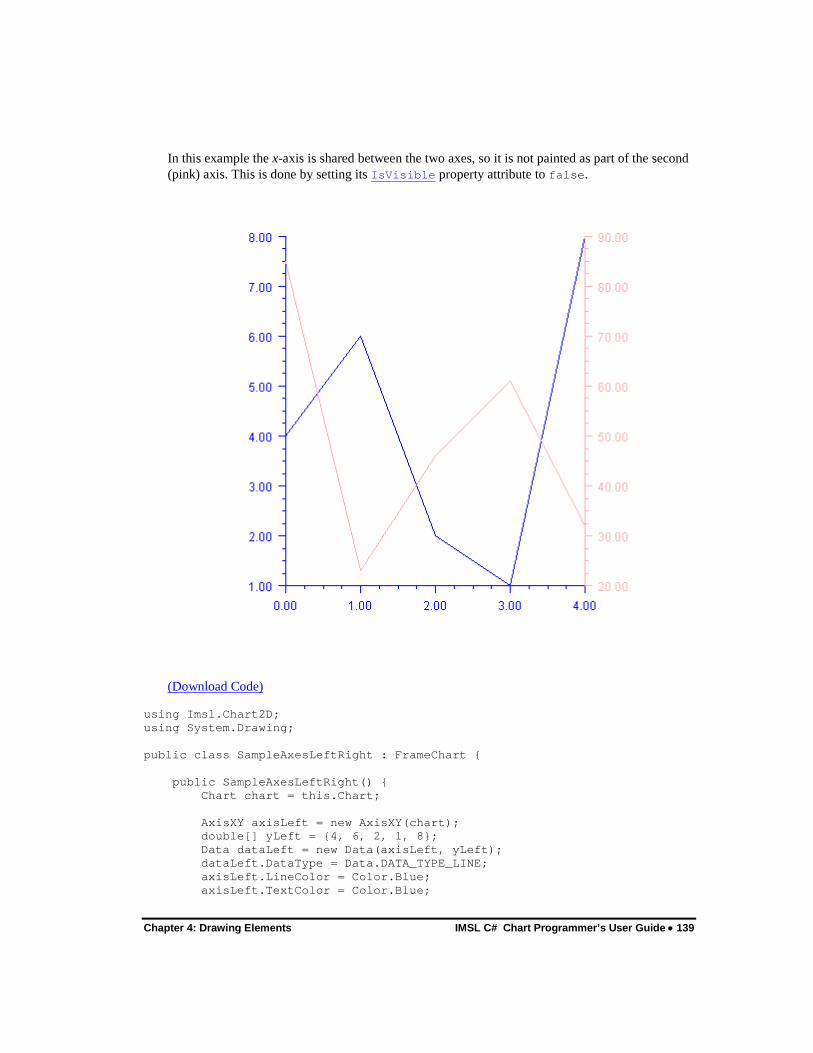
Chapter 4: Drawing Elements IMSL C# Chart Programmer’s User Guide • 139
In this example the x-axis is shared between the two axes, so it is not painted as part of the second (pink) axis. This is done by setting its IsVisible property attribute to false.
(Download Code)
using Imsl.Chart2D; using System.Drawing; public class SampleAxesLeftRight : FrameChart { public SampleAxesLeftRight() { Chart chart = this.Chart; AxisXY axisLeft = new AxisXY(chart); double[] yLeft = {4, 6, 2, 1, 8}; Data dataLeft = new Data(axisLeft, yLeft); dataLeft.DataType = Data.DATA_TYPE_LINE; axisLeft.LineColor = Color.Blue; axisLeft.TextColor = Color.Blue;

140 • IMSL C# Chart Programmer’s User Guide Chapter 4: Drawing Elements
AxisXY axisRight = new AxisXY(chart); axisRight.AxisX.IsVisible = false; axisRight.AxisY.Type = Axis1D.AXIS_Y_RIGHT; double[] yRight = {85, 23, 46, 61, 32}; Data dataRight = new Data(axisRight, yRight); dataRight.DataType = Data.DATA_TYPE_LINE; axisRight.LineColor = Color.Pink; axisRight.TextColor = Color.Pink; } public static void Main(string[] argv) { System.Windows.Forms.Application.Run( new SampleAxesLeftRight()); } }
Cross Example Multiple x and y-axes are shown.
The Cross attribute is used to specify that the second (pink) axes intersect at (-8,10), in the pink-axis coordinate system.
The Viewport attribute is changed in both sets of axes to shrink the size of the chart body and leave more room to the left and below the chart for the pink axes.

Chapter 4: Drawing Elements IMSL C# Chart Programmer’s User Guide • 141
(Download Code) using Imsl.Chart2D; using System.Drawing; public class SampleAxesCross : FrameChart { public SampleAxesCross() { Chart chart = this.Chart; AxisXY axisLeft = new AxisXY(chart); double[] yLeft = {4, 6, 2, 1, 8}; Data dataLeft = new Data(axisLeft, yLeft); dataLeft.DataType = Data.DATA_TYPE_LINE; axisLeft.LineColor = Color.Blue; axisLeft.TextColor = Color.Blue; AxisXY axisRight = new AxisXY(chart); axisRight.SetCross(-8, 10); double[] xRight = {0, 10, 20, 30, 40}; double[] yRight = {85, 23, 46, 61, 32}; Data dataRight = new Data(axisRight, xRight, yRight);
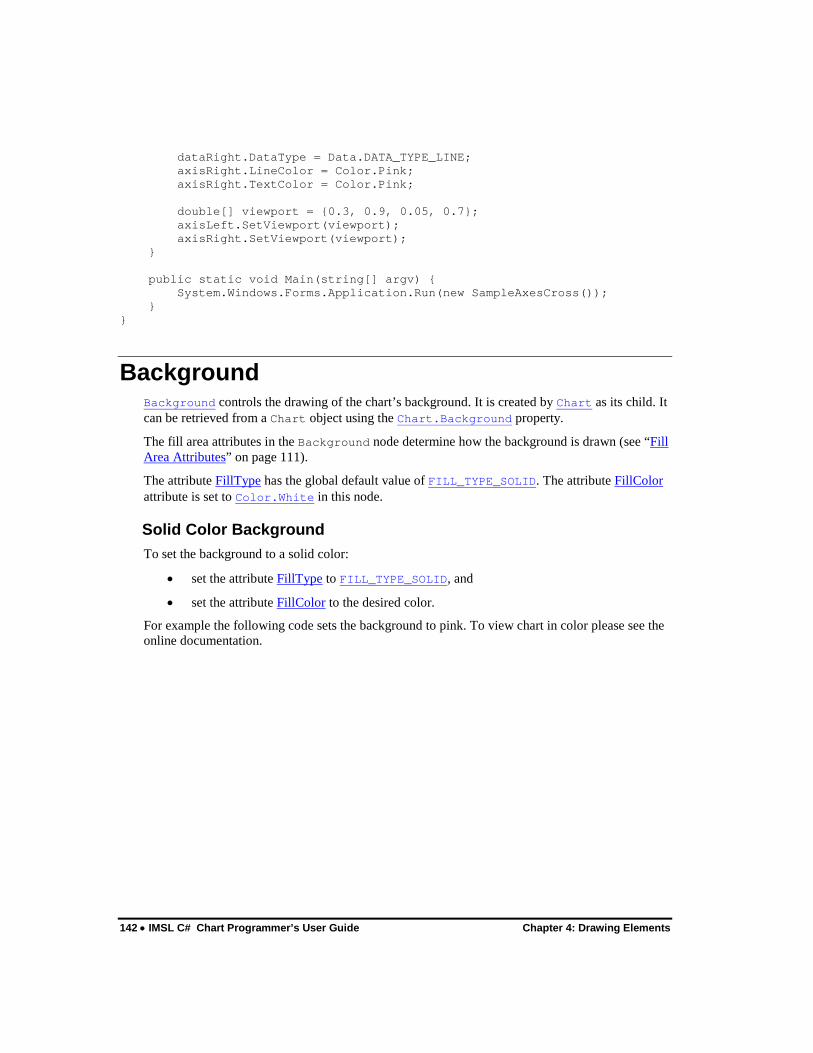
142 • IMSL C# Chart Programmer’s User Guide Chapter 4: Drawing Elements
dataRight.DataType = Data.DATA_TYPE_LINE; axisRight.LineColor = Color.Pink; axisRight.TextColor = Color.Pink; double[] viewport = {0.3, 0.9, 0.05, 0.7}; axisLeft.SetViewport(viewport); axisRight.SetViewport(viewport); } public static void Main(string[] argv) { System.Windows.Forms.Application.Run(new SampleAxesCross()); } }
Background Background controls the drawing of the chart’s background. It is created by Chart as its child. It can be retrieved from a Chart object using the Chart.Background property.
The fill area attributes in the Background node determine how the background is drawn (see “Fill Area Attributes” on page 111).
The attribute FillType has the global default value of FILL_TYPE_SOLID. The attribute FillColor attribute is set to Color.White in this node.
Solid Color Background To set the background to a solid color:
• set the attribute FillType to FILL_TYPE_SOLID, and
• set the attribute FillColor to the desired color.
For example the following code sets the background to pink. To view chart in color please see the online documentation.
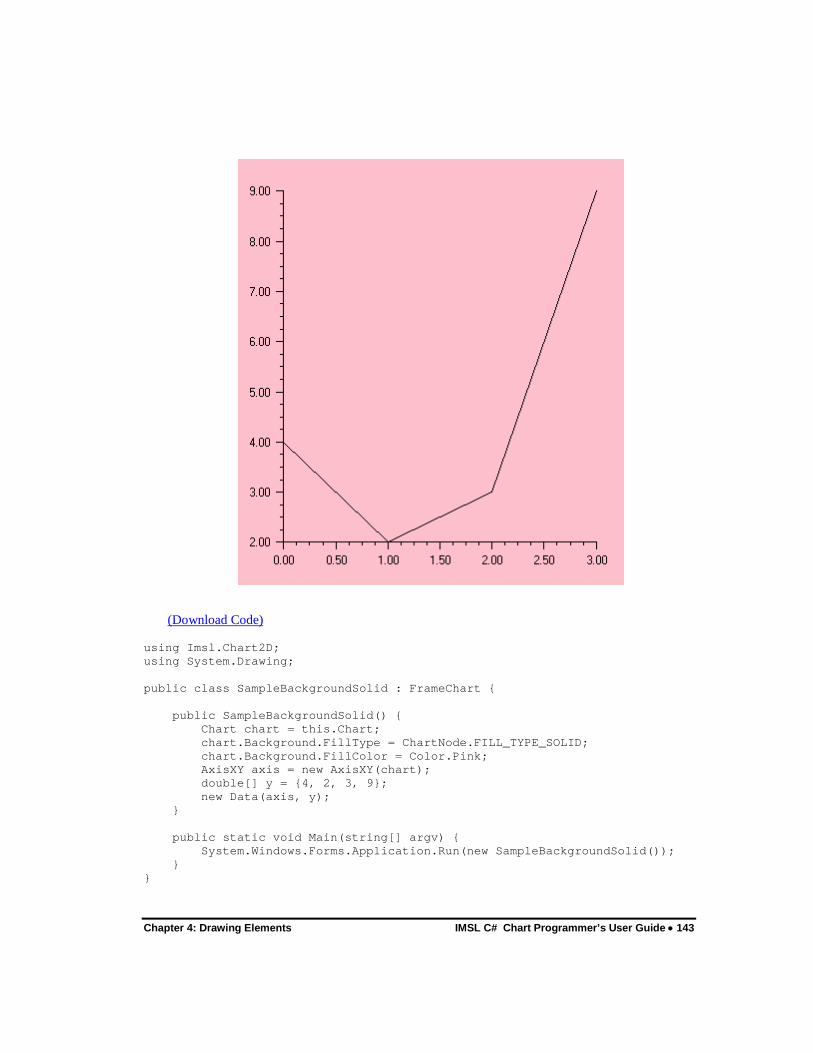
Chapter 4: Drawing Elements IMSL C# Chart Programmer’s User Guide • 143
(Download Code) using Imsl.Chart2D; using System.Drawing; public class SampleBackgroundSolid : FrameChart { public SampleBackgroundSolid() { Chart chart = this.Chart; chart.Background.FillType = ChartNode.FILL_TYPE_SOLID; chart.Background.FillColor = Color.Pink; AxisXY axis = new AxisXY(chart); double[] y = {4, 2, 3, 9}; new Data(axis, y); } public static void Main(string[] argv) { System.Windows.Forms.Application.Run(new SampleBackgroundSolid()); } }

144 • IMSL C# Chart Programmer’s User Guide Chapter 4: Drawing Elements
Gradient Color Background To set the background to a color gradient:
• set the attribute FillType to FILL_TYPE_GRADIENT, and
• set the attribute Gradient to the desired color gradient specification.
For example the following code uses a yellow-to-red vertical gradient for the background setting. See “Fill Area Attributes” on page 111 for more information on gradients.
(Download Code) using Imsl.Chart2D; using System.Drawing; public class SampleBackgroundGradient : FrameChart { public SampleBackgroundGradient() { Chart chart = this.Chart; chart.Background.FillType = ChartNode.FILL_TYPE_GRADIENT;
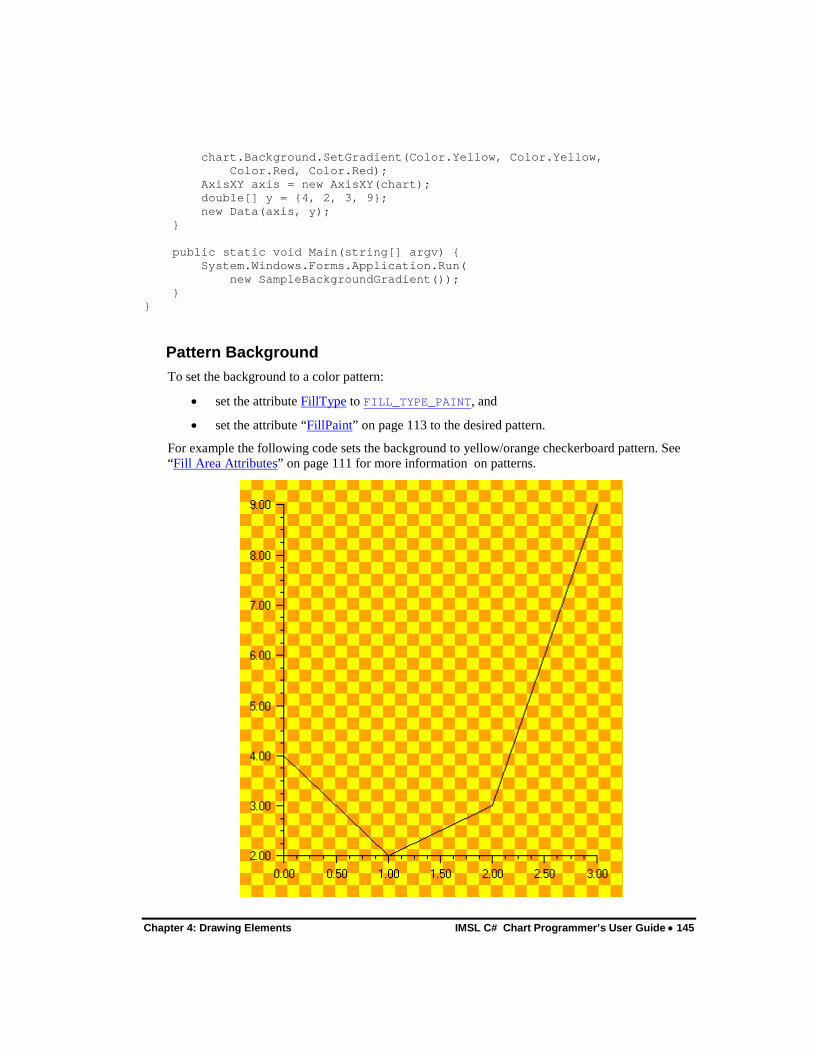
Chapter 4: Drawing Elements IMSL C# Chart Programmer’s User Guide • 145
chart.Background.SetGradient(Color.Yellow, Color.Yellow, Color.Red, Color.Red); AxisXY axis = new AxisXY(chart); double[] y = {4, 2, 3, 9}; new Data(axis, y); } public static void Main(string[] argv) { System.Windows.Forms.Application.Run( new SampleBackgroundGradient()); } }
Pattern Background To set the background to a color pattern:
• set the attribute FillType to FILL_TYPE_PAINT, and
• set the attribute “FillPaint” on page 113 to the desired pattern.
For example the following code sets the background to yellow/orange checkerboard pattern. See “Fill Area Attributes” on page 111 for more information on patterns.

146 • IMSL C# Chart Programmer’s User Guide Chapter 4: Drawing Elements
(Download Code) using Imsl.Chart2D; using System.Drawing; public class SampleBackgroundPaint : FrameChart { public SampleBackgroundPaint() { Chart chart = this.Chart; chart.Background.FillType = ChartNode.FILL_TYPE_PAINT; Brush brush = FillPaint.Checkerboard( 24, Color.Yellow, Color.Orange); chart.Background.SetFillPaint(brush); AxisXY axis = new AxisXY(chart); double[] y = {4, 2, 3, 9}; new Data(axis, y); } public static void Main(string[] argv) { System.Windows.Forms.Application.Run( new SampleBackgroundPaint()); } }
Legend The legend is used to identify data sets. Data nodes that have their Title attribute defined are automatically included in the legend box.
The Legend node is automatically created by the Chart node as its child. By default, the Legend is not drawn because its IsVisible property is set to false.
Simple Legend Example At a minimum, adding a legend to a chart requires setting the legend’s IsVisible property to true and setting the Title attribute in the Data nodes that are to appear in the legend box. This example shows such a minimal legend.

Chapter 4: Drawing Elements IMSL C# Chart Programmer’s User Guide • 147
(Download Code) using Imsl.Chart2D; using System.Drawing; public class SampleSimpleLegend : FrameChart { public SampleSimpleLegend() { Chart chart = this.Chart; AxisXY axis = new AxisXY(chart); chart.Legend.IsVisible = true; double[] y1 = new double[] {4, 6, 2, 1, 8}; Data data1 = new Data(axis, y1); data1.DataType = Data.DATA_TYPE_LINE; data1.LineColor = Color.Red; data1.SetTitle("Line"); double[] y2 = new double[] {7, 3, 4, 5, 2}; Data data2 = new Data(axis, y2);

148 • IMSL C# Chart Programmer’s User Guide Chapter 4: Drawing Elements
data2.DataType = Data.DATA_TYPE_MARKER; data2.MarkerColor = Color.Blue; data2.SetTitle("Marker"); } public static void Main(string[] argv) { System.Windows.Forms.Application.Run(new SampleSimpleLegend()); } }
Legend Example This example shows more of the attributes that affect a legend. If the legend’s Title attribute is set, then it is used as a header in the legend box.
The text properties for all of the text strings in the legend box are obtained from the Legend node, not from the associated Data nodes (see “Text Attributes” on page 114). Here the TextColor is set to white.
The background of the legend box can be set by changing the fill attributes (see “Fill Area Attributes” on page 111). By default in the Legend node, FillType is set to FILL_TYPE_NONE and FillColor is set to Color.LightGray.
The position of the legend box is controlled by its Viewport attribute. The viewport is the region of the Control, in which the chart is being drawn, that the legend box occupies. The upper left corner is (0,0) and the lower right corner is (1,1). The default value of the legend viewport is [0.83, 0.0] by [0.2, 0.2]. The default value of the legend viewport is [0.83, 0.0] by [0.2, 0.2]. The position of the legend can be controlled by the xmin and ymin parameters of method SetViewport (note that the xmax and ymax parameters do not affect the legend viewport).

Chapter 4: Drawing Elements IMSL C# Chart Programmer’s User Guide • 149
(Download Code)
using Imsl.Chart2D; using System.Drawing; public class SampleLegend : FrameChart { public SampleLegend() { Chart chart = this.Chart; AxisXY axis = new AxisXY(chart); Legend legend = chart.Legend; legend.IsVisible = true;; legend.SetTitle("Legend"); legend.TextColor = Color.White; legend.FillType = Legend.FILL_TYPE_SOLID; legend.SetViewport(0.3, 0.4, 0.1, 0.4); double[] y1 = new double[] {4, 6, 2, 1, 8}; Data data1 = new Data(axis, y1); data1.DataType = Data.DATA_TYPE_LINE; data1.LineColor = Color.Red;

150 • IMSL C# Chart Programmer’s User Guide Chapter 4: Drawing Elements
data1.SetTitle("Line"); double[] y2 = new double[] {7, 3, 4, 5, 2}; Data data2 = new Data(axis, y2); data2.DataType = Data.DATA_TYPE_MARKER; data2.MarkerColor = Color.Blue; data2.SetTitle("Marker"); } public static void Main(string[] argv) { System.Windows.Forms.Application.Run(new SampleLegend()); } }
Colormaps Colormaps are mappings from [0,1] to colors. They are a one-dimensional parameterized path through the color cube. For an example of their use, see Heatmap.
A number of colormaps are predefined in the Colormap class. It is also possible to create new custom colormaps.
The predefined colormaps are listed in the table below.
RED Light red to dark red GREEN Light green to dark green BLUE Light blue to dark blue BW_LINEAR Black and white linear BLUE_WHITE Blue/White GREEN_RED_BLUE_WHITE Green/Red/Blue/White RED_TEMPERATURE Red Temperature BLUE_GREEN_RED_YELLOW Blue/Green/Red/Yellow STANDARD_GAMMA Standard Gamma PRISM Prism RED_PURPLE Red/Purple GREEN_WHITE_LINEAR Green/White Linear GREEN_WHITE_EXPONENTIAL Green/White Exponential GREEN_PINK Green/Pink BLUE_RED Blue/Red SPECTRAL Spectral WB_LINEAR White/Black Linear

Chapter 4: Drawing Elements IMSL C# Chart Programmer’s User Guide • 151
Tool Tips Windows.Forms supports tool tips, small help boxes that pop up when the mouse hovers over some element. The ToolTip node allows tool tips to be associated with chart elements. The text displayed in the tool tip is the Title attribute of the ToolTip’s parent node.
Example In this example two Data nodes are created. Each Data node has a Title defined and a ToolTip node added as a child. Note that the ToolTip node just has to be created, no methods using it are normally required.
(Download Code)
using Imsl.Chart2D; using System.Drawing; public class SampleToolTip : FrameChart { public SampleToolTip() { Chart chart = this.Chart; AxisXY axis = new AxisXY(chart);

152 • IMSL C# Chart Programmer’s User Guide Chapter 4: Drawing Elements
double[] y1 = new double[] {4, 6, 2, 1, 8}; Data data1 = new Data(axis, y1); data1.DataType = Data.DATA_TYPE_MARKER; data1.MarkerColor = Color.Red; data1.MarkerType = Data.MARKER_TYPE_FILLED_CIRCLE; data1.SetTitle("Set A"); new ToolTip(data1); double[] y2 = new double[] {7, 3, 4, 5, 2}; Data data2 = new Data(axis, y2); data2.DataType = Data.DATA_TYPE_MARKER; data2.MarkerColor = Color.Blue; data2.MarkerType = Data.MARKER_TYPE_FILLED_SQUARE; data2.SetTitle("Set B"); new ToolTip(data2); } public static void Main(string[] argv) { System.Windows.Forms.Application.Run(new SampleToolTip()); } }


154 • IMSL C# Chart Programmer’s User Guide Chapter 5: Actions
Chapter 5: Actions
IMSL C# Numerical Libraries IMSL C# Numerical Libraries supports the following actions:
• “Picking” on page 154
• “Zoom” on page 156
• “Printing” on page 161
Picking The pick mechanism allows MouseEvents to be associated with chart nodes. The pick mechanism follows the .NET delegate pattern.
A PickEventHandler is added to a ChartNode, using the node’s PickPerformed method and the delegate += syntax to define the method to be called when the event occurs.
A pick is fired by calling the method Chart.Pick in the top-level ChartNode. Normally this is done in response to a mouse click. Mouse clicks can be detected by adding a MouseEventHandler to the MouseDown property of the chart’s container.
Example In this example, when a bar is clicked it toggles its color between blue and red.
A MouseEventHandler is added to the Panel, which calls method Chart.Pick. The pick delegate is added to the chart node bar. This means that it is active for that node and its children but is not active for the axes and other nodes.
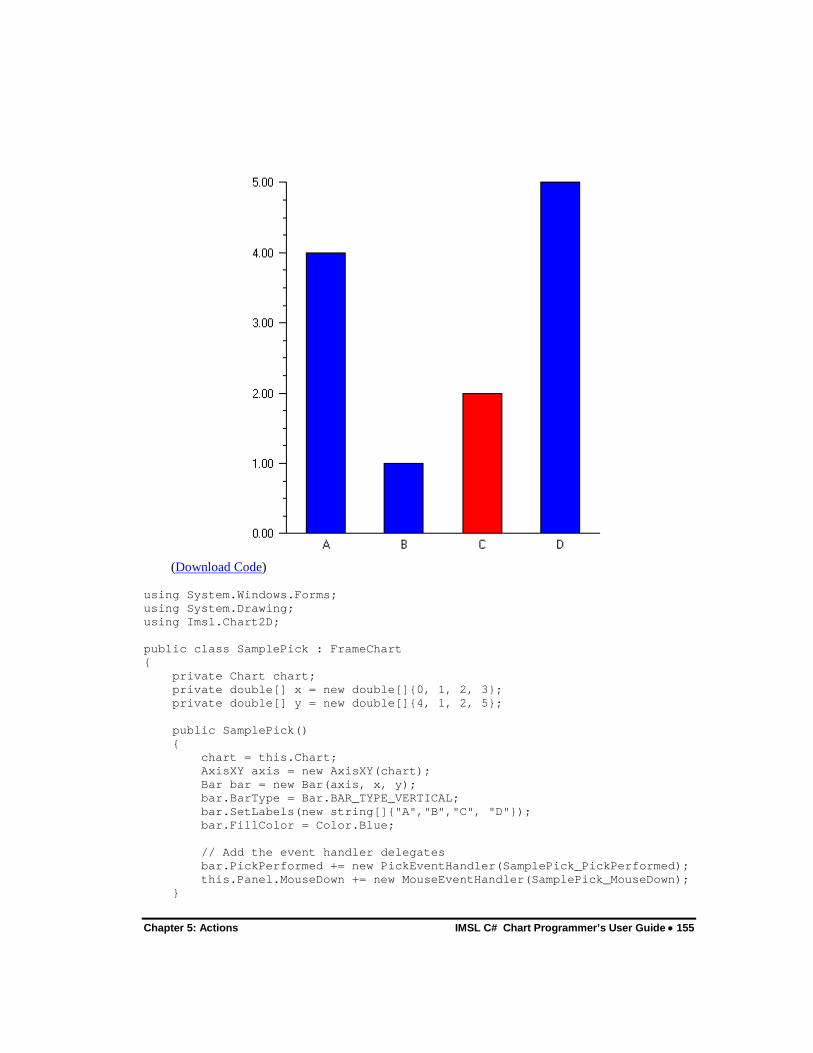
Chapter 5: Actions IMSL C# Chart Programmer’s User Guide • 155
(Download Code)
using System.Windows.Forms; using System.Drawing; using Imsl.Chart2D; public class SamplePick : FrameChart { private Chart chart; private double[] x = new double[]{0, 1, 2, 3}; private double[] y = new double[]{4, 1, 2, 5}; public SamplePick() { chart = this.Chart; AxisXY axis = new AxisXY(chart); Bar bar = new Bar(axis, x, y); bar.BarType = Bar.BAR_TYPE_VERTICAL; bar.SetLabels(new string[]{"A","B","C", "D"}); bar.FillColor = Color.Blue; // Add the event handler delegates bar.PickPerformed += new PickEventHandler(SamplePick_PickPerformed); this.Panel.MouseDown += new MouseEventHandler(SamplePick_MouseDown); }
156 • IMSL C# Chart Programmer’s User Guide Chapter 5: Actions
private void SamplePick_MouseDown(object sender, MouseEventArgs e) { chart.Pick(e); } private void SamplePick_PickPerformed(PickEventArgs param) { ChartNode node = param.Node; int count = node.GetIntegerAttribute("pick.count", 0); count++; node.SetAttribute("pick.count", (System.Object) (count)); // Change the bar's color depending on the number of times // it has been picked. Color color = ((count % 2 == 0) ? Color.Blue : Color.Red); node.FillColor = color; Refresh(); } public static void Main(string[] argv) { System.Windows.Forms.Application.Run(new SamplePick()); } }
Zoom IMSL C# Numerical Libraries provides the functionality to implement a variety of zoom policies instead of implementing a single specific zoom policy. The following example shows how to build a zoom policy that draws a rubber-band box in a scatter plot and zooms both the x-axis and y-axis to correspond to the region selected. Zoom out is also implemented.
This code can be used as the basis of an implementation of other zoom policies. For example, with a function plot one might want to only change the x-axis in response to a zoom and leave the y-axis alone. In other situations it may be desirable to zoom in or out a fixed amount around the location of a mouse click.
Example In the constructor:
• A scatter plot is created,
• Zoom items are added to the main menu,
• A MouseEventHandler is added to the panel. A FrameChart contains a number of components, including a Panel in which the chart is drawn. It is important that the MouseEventHandler be added to the component in which the chart is drawn, so that the MouseEventArgs coordinates are the same as the device coordinates of the chart.
Chapter 5: Actions IMSL C# Chart Programmer’s User Guide • 157
A mouse press event starts the zoom. In response to the event a MouseEventHandler is added to the panel to listen for mouse drag events. The location of this initial event is also recorded.
A mouse drag event resizes the area of the zoom. In response, the old rubber-band box is erased and a new box is drawn. The new box has the initial mouse press location as one corner and this drag event location as the opposite corner. The location of this event is stored in (xLast,yLast).
A mouse release event completes the zoom. In response,
• The MouseEventHandler for MouseMove is removed from the panel,
• The existing Window attributes for the x-axis and y-axis are saved on a stack. They may be used later to zoom out.
• The new Window is computed. The Window is the range, in user coordinates, along an axis. The method Axis.MapUserToDevice is used to map the device (pixel) coordinates to the user coordinate space. The new windows are constrained to be inside of the existing window.
• Autoscaling is turned off, so that the new Window values will be used without further modification.
• The chart is redrawn with the new windows.
The menu items, added by the constructor to the main menu, can be used to zoom out. The added menu items add an EventHandler with the menuItem_Click delegate as the method called when these menu items are selected. The menuItem_Click method implements “Out” by popping previous Window attribute values off a stack. It implements “Restore’ by re-enabling autoscaling.
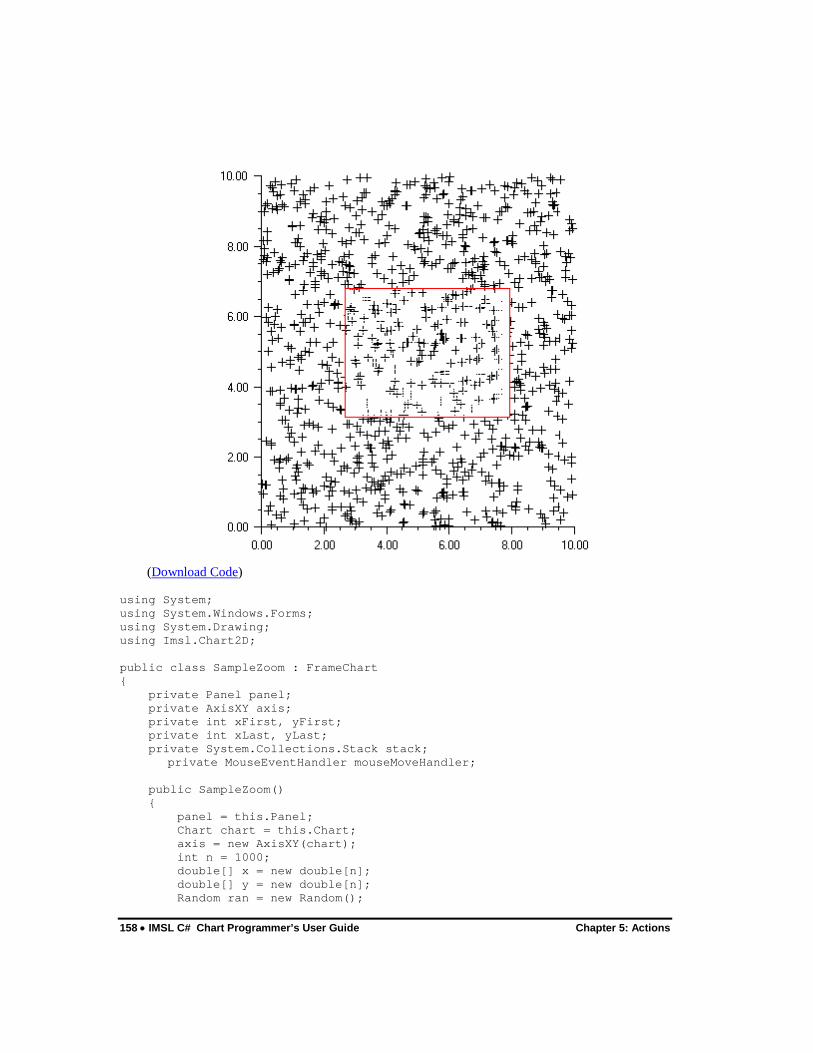
158 • IMSL C# Chart Programmer’s User Guide Chapter 5: Actions
(Download Code)
using System; using System.Windows.Forms; using System.Drawing; using Imsl.Chart2D; public class SampleZoom : FrameChart { private Panel panel; private AxisXY axis; private int xFirst, yFirst; private int xLast, yLast; private System.Collections.Stack stack; private MouseEventHandler mouseMoveHandler; public SampleZoom() { panel = this.Panel; Chart chart = this.Chart; axis = new AxisXY(chart); int n = 1000; double[] x = new double[n]; double[] y = new double[n]; Random ran = new Random();

Chapter 5: Actions IMSL C# Chart Programmer’s User Guide • 159
for (int k = 0; k < n; k++) { x[k] = 10.0 * ran.NextDouble(); y[k] = 10.0 * ran.NextDouble(); } Data data = new Data(axis, x, y); data.DataType = Data.DATA_TYPE_MARKER; // add menu "Zoom" menu MenuItem menuZoom = new MenuItem(); menuZoom.Text = "&Zoom"; menuZoom.Shortcut = Shortcut.CtrlZ; AddMenuItem(menuZoom, "Out", Shortcut.CtrlO); AddMenuItem(menuZoom, "Restore", Shortcut.CtrlR); this.Menu.MenuItems.Add(menuZoom); // save x-axis and y-axis Window attributes on this stack. // they are used to zoom out one level. stack = new System.Collections.Stack(); // listen for mouse press events panel.MouseDown += new MouseEventHandler(Panel_MouseDown); panel.MouseUp += new MouseEventHandler(Panel_MouseUp); mouseMoveHandler = new MouseEventHandler(panel_MouseMove); } // Add a menu item private void AddMenuItem(MenuItem menuZoom, string title, Shortcut sc) { MenuItem menuItem = new MenuItem(title); menuItem.Text = title; menuItem.Shortcut = sc; menuZoom.MenuItems.Add(menuItem); menuItem.Click += new EventHandler(menuItem_Click); } // A mouse press starts the zoom // Record location of this point and listen for drag (motion) events. void Panel_MouseDown(object sender, MouseEventArgs e) { xFirst = xLast = e.X; yFirst = yLast = e.Y; panel.MouseMove += mouseMoveHandler; } // Releasing the mouse button ends the zoom // Stop listening for move events and update the Window attributes void Panel_MouseUp(object sender, MouseEventArgs e) { panel.MouseMove -= mouseMoveHandler; // ignore degenerate zooms if (xFirst == xLast || yFirst == yLast) {

160 • IMSL C# Chart Programmer’s User Guide Chapter 5: Actions
Refresh(); return; } // get window and convert to user coordinates double[] windowX = (double[])axis.AxisX.GetWindow(); double[] windowY = (double[])axis.AxisY.GetWindow(); // save the windows on the stack (for zoom out option) stack.Push(windowX); stack.Push(windowY); // get user coordinate of left-upper corner of the box // limit it to stay inside current window double[] boxLU = new double[2]; int x = Math.Min(xFirst, xLast); int y = Math.Min(yFirst, yLast); axis.MapDeviceToUser(x, y, boxLU); // get user coordinate of right-lower corner of the box // limit it to stay inside current window double[] boxRL = new double[2]; x = Math.Max(xFirst, xLast); y = Math.Max(yFirst, yLast); axis.MapDeviceToUser(x, y, boxRL); // set axis window to range of rubber-band box // and disable autoscale to force use of window settings axis.AutoscaleInput = ChartNode.AUTOSCALE_OFF; double xa = Math.Max(windowX[0], boxLU[0]); double xb = Math.Min(windowX[1], boxRL[0]); double ya = Math.Max(windowY[0], boxRL[1]); double yb = Math.Min(windowY[1], boxLU[1]); axis.AxisX.SetWindow(xa, xb); axis.AxisY.SetWindow(ya, yb); // force redraw of the chart Refresh(); } // Moving the mouse after a click continues the zoom. // Erase the old rubber band box and draw a new one // Also keep track of the location of this event void panel_MouseMove(object sender, MouseEventArgs e) { // erase previous rectangle Graphics g = panel.CreateGraphics(); DrawBox(g, Color.White); // draw new rectangle xLast = e.X; yLast = e.Y; DrawBox(g, Color.Red); }

Chapter 5: Actions IMSL C# Chart Programmer’s User Guide • 161
// Draw a box with (xFirst, yFirst) and (xLast, yLast) as its corners private void DrawBox(Graphics g, Color color) { int x = Math.Min(xFirst, xLast); int y = Math.Min(yFirst, yLast); int w = Math.Abs(xLast - xFirst); int h = Math.Abs(yLast - yFirst); g.DrawRectangle(new Pen(color), x, y, w, h); } void menuItem_Click(object sender, EventArgs e) { string cmd = ((MenuItem)sender).Text; if (cmd.Equals("Out")) { try { // zoom out by restoring window settings from the stack axis.AxisY.SetWindow((double[])stack.Pop()); axis.AxisX.SetWindow((double[])stack.Pop()); } catch (System.InvalidOperationException) { // no more levels to zoom out // restore original setting by turning on autoscale axis.AutoscaleInput = ChartNode.AUTOSCALE_DATA; } } else if (cmd.Equals("Restore")) { // restore original setting by turning on autoscale an // empty stack axis.AutoscaleInput = ChartNode.AUTOSCALE_DATA; stack.Clear(); } // force redraw of the chart Refresh(); } public static void Main(string[] argv) { System.Windows.Forms.Application.Run(new SampleZoom()); } }
Printing Printing from FrameChart The FrameChart class, used to build most of the examples in this manual, includes a print option under the file menu. This option prints the chart as large as possible, without distortion, and centered on the page.

162 • IMSL C# Chart Programmer’s User Guide Chapter 5: Actions
Printable Interface Class Chart implements the .NET PrintPage interface, which is used to print a single page. It is implemented by the class Chart. The following code fragment shows how to print a chart using its PrintDocument class and its PrintPage event.
public void Print() { PrintDocument printJob = new PrintDocument(); printJob.PrintPage += new PrintPageEventHandler(Chart.PrintGraphics); PrintDialog printDialog = new PrintDialog(); if (printDialog.ShowDialog() == DialogResult.OK) { printJob.Print() } }


164 • IMSL C# Chart Programmer’s User Guide Appendix A: Web Server Application
Appendix A: Web Server Application
An IMSL C# Numerical Libraries chart can be integrated into an ASP.NET application through the WebChart component. The WebChart class extends System.Web.UI.WebCon-trols.Panel and can be added to an ASP.NET application like any other web control.
There are two sides to an ASP.NET application - the user interface and the code-behind class file. The user interface is often created visually with Visual Studio with the HTML code generated automatically. The code-behind class file is compiled into an assembly that is deployed with the web pages. The following example was generated using Visual Studio 2005. The method applies to other versions of Visual Studio though the code may be different in the details. The code-behind class file is written in C# like the other examples in this document.
The following code was automatically generated by Visual Studio by dragging a WebChart onto the page from the Toolbox containing web controls. The WebChart control can be added to the Toolbox by using the Add Items... dialog and browsing to the IMSL C# Numerical Libraries assembly, ImslCS.dll. Notice the reference to a WebChart object. This is the object that will be referenced from the code-behind class file.
<%@ Page Language="C#" AutoEventWireup="true" CodeBehind="Default.aspx.cs" Inherits="WebApplication1._Default" %> <%@ Register assembly="ImslCS" namespace="Imsl.Chart2D" tagprefix="cc1" %> <!DOCTYPE html PUBLIC "-//W3C//DTD XHTML 1.0 Transitional//EN" "http://www.w3.org/TR/xhtml1/DTD/xhtml1-transitional.dtd"> <html xmlns="http://www.w3.org/1999/xhtml" > <head runat="server"> <title>Untitled Page</title> </head> <body> <form id="form1" runat="server"> <div> <cc1:WebChart ID="WebChart1" runat="server" Height="240px" Width="240px"> </cc1:WebChart> </div> </form> </body>

Appendix A: Web Server Application IMSL C# Chart Programmer’s User Guide • 165
</html>
For this basic example, the chart is created in the Page_Load method. The Chart object is obtained from the WebChart and the chart is configured in a manner similar to the desktop form examples. All chart types and most functionality of the IMSL C# Numerical Libraries is available through the WebChart control.
(Download Code)
using System; using System.Data; using System.Configuration; using System.Web; using System.Web.Security; using System.Web.UI; using System.Web.UI.WebControls; using System.Web.UI.WebControls.WebParts; using System.Web.UI.HtmlControls; using Imsl.Chart2D; public partial class _Default : System.Web.UI.Page { protected void Page_Load(object sender, EventArgs e) { Chart chart = WebChart1.Chart; AxisXY axis = new AxisXY(chart); Data data = new Data(axis, new double[] {5,7,4,1,8}); data.DataType = ChartNode.DATA_TYPE_LINE | ChartNode.DATA_TYPE_MARKER; data.MarkerType = ChartNode.MARKER_TYPE_FILLED_SQUARE; data.MarkerColor = System.Drawing.Color.Red; data.LineColor = System.Drawing.Color.Green; } }
166 • IMSL C# Chart Programmer’s User Guide Appendix B: Writing a Chart as a Bitmap Image
Appendix B: Writing a Chart as a Bitmap Image
Using the ImageIO class An IMSL C# Numerical Libraries chart can be saved as an image file using the .NET Image class.
The chart tree is constructed in the usual manner. Here a method called CreateChart is used to create a simple chart, with the null-argument Chart constructor. The chart is written to a file without being displayed using the Chart.WritePNG method. This method does not require a desktop GUI application using Windows.Forms, but can be run in a “headless” mode.
If a chart is being displayed, a Bitmap object can be created using the Chart.PaintImage method. This object can then be used like any other .NET Image, including calling its Save method as in this example. For the Image returned by PaintImage not to be null, the chart must have been rendered to the screen. Therefore, this method is not suitable for headless applications.

Appendix B: Writing a Chart as a Bitmap Image IMSL C# Chart Programmer’s User Guide • 167
(Download Code) using System; using System.Drawing; using System.IO; using Imsl.Chart2D; public class SampleImageIO : FrameChart { public SampleImageIO() { this.Chart = CreateChart(); // Create an image file from the chart's image once displayed Bitmap bmap = new Bitmap(this.Chart.PaintImage()); bmap.Save("SampleImageIO2.png", System.Drawing.Imaging.ImageFormat.Png); } static Chart CreateChart() { Chart chart = new Chart(); AxisXY axis = new AxisXY(chart);

168 • IMSL C# Chart Programmer’s User Guide Appendix B: Writing a Chart as a Bitmap Image
int npoints = 20; double dx = .5 * Math.PI/(npoints-1); double[] x = new double[npoints]; double[] y = new double[npoints]; // Generate some data for (int i = 0; i < x.Length; i++) { x[i] = i * dx; y[i] = Math.Sin(x[i]); } new Data(axis, x, y); return chart; } public static void Main(string[] argv) { // Create an image file using WritePNG without a display Chart chart = CreateChart(); chart.ScreenSize = new Size(500, 500); FileStream fs = new FileStream("SampleImageIO.png", FileMode.OpenOrCreate); chart.WritePNG(fs, 500, 500); System.Windows.Forms.Application.Run(new SampleImageIO()); } }

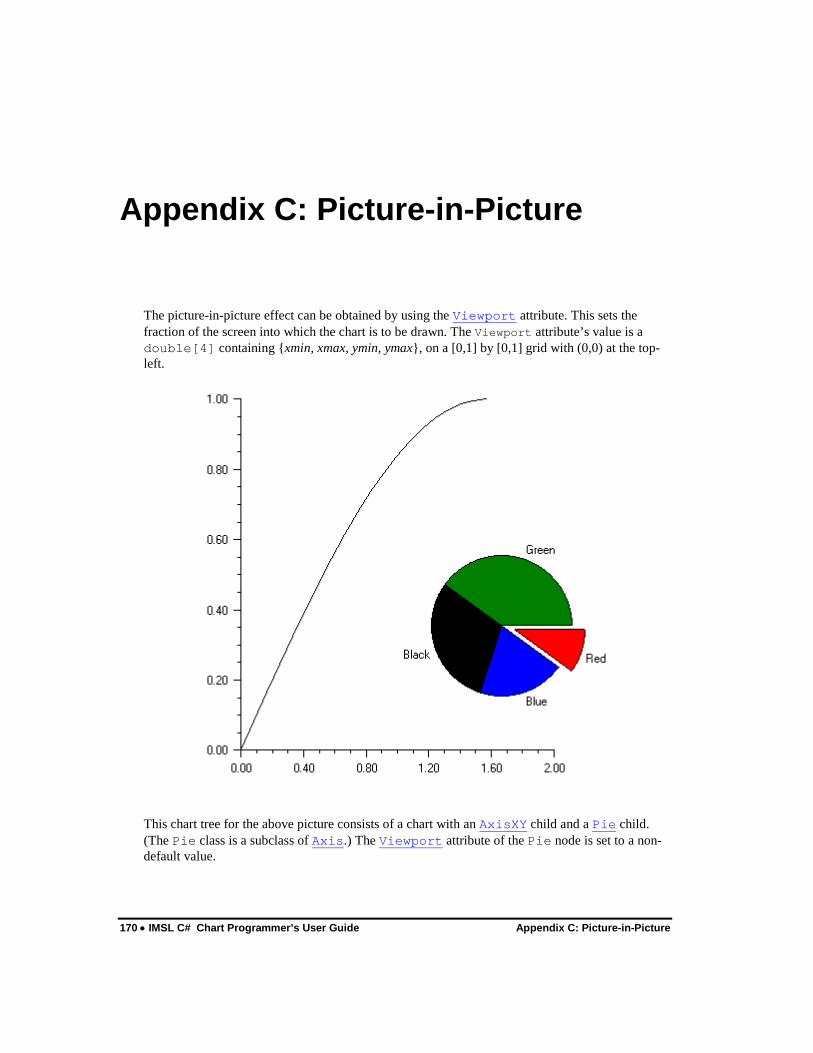
170 • IMSL C# Chart Programmer’s User Guide Appendix C: Picture-in-Picture
Appendix C: Picture-in-Picture
The picture-in-picture effect can be obtained by using the Viewport attribute. This sets the fraction of the screen into which the chart is to be drawn. The Viewport attribute’s value is a double[4] containing {xmin, xmax, ymin, ymax}, on a [0,1] by [0,1] grid with (0,0) at the top-left.
This chart tree for the above picture consists of a chart with an AxisXY child and a Pie child. (The Pie class is a subclass of Axis.) The Viewport attribute of the Pie node is set to a non-default value.
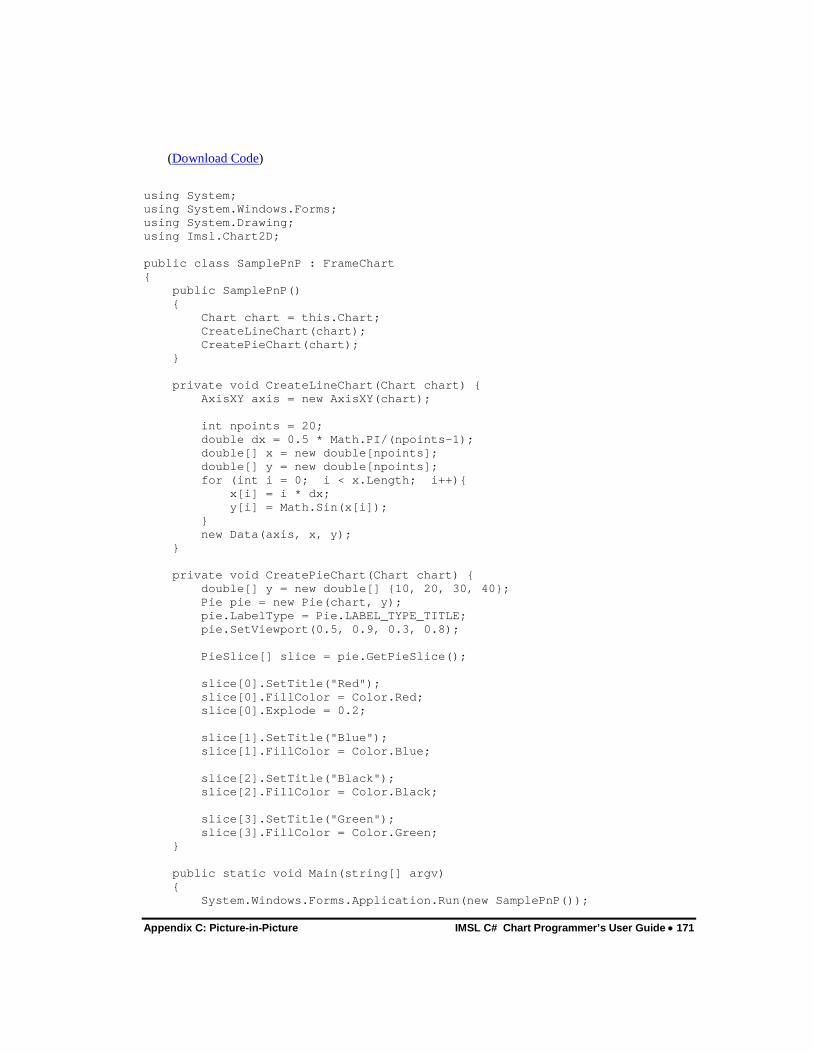
Appendix C: Picture-in-Picture IMSL C# Chart Programmer’s User Guide • 171
(Download Code)
using System; using System.Windows.Forms; using System.Drawing; using Imsl.Chart2D; public class SamplePnP : FrameChart { public SamplePnP() { Chart chart = this.Chart; CreateLineChart(chart); CreatePieChart(chart); } private void CreateLineChart(Chart chart) { AxisXY axis = new AxisXY(chart); int npoints = 20; double dx = 0.5 * Math.PI/(npoints-1); double[] x = new double[npoints]; double[] y = new double[npoints]; for (int i = 0; i < x.Length; i++){ x[i] = i * dx; y[i] = Math.Sin(x[i]); } new Data(axis, x, y); } private void CreatePieChart(Chart chart) { double[] y = new double[] {10, 20, 30, 40}; Pie pie = new Pie(chart, y); pie.LabelType = Pie.LABEL_TYPE_TITLE; pie.SetViewport(0.5, 0.9, 0.3, 0.8); PieSlice[] slice = pie.GetPieSlice(); slice[0].SetTitle("Red"); slice[0].FillColor = Color.Red; slice[0].Explode = 0.2; slice[1].SetTitle("Blue"); slice[1].FillColor = Color.Blue; slice[2].SetTitle("Black"); slice[2].FillColor = Color.Black; slice[3].SetTitle("Green"); slice[3].FillColor = Color.Green; } public static void Main(string[] argv) { System.Windows.Forms.Application.Run(new SamplePnP());

172 • IMSL C# Chart Programmer’s User Guide Appendix C: Picture-in-Picture
} }

Appendix C: Picture-in-Picture IMSL C# Chart Programmer’s User Guide • 173

Index IMSL C# Chart Programmer’s User Guide • 175
Index
A
annotation 119 applications, adding charts to 9 Attribute Control Chart CChart 67, 89 NpChart 67, 87 PChart 67, 84 UChart 67, 92
axis crossed 140 layout 122 limits 124 setting 121 tick marks 124 titles 126 custom tranformation of
axes 135 units 129
tick marks tick marks 131
axis3d labels
for axes 126 labels 126
B
background color 142
gradient background color gradient
gradient 144 bar
charts stacked and grouped
bar stacked and grouped 45
bar charts spacing bars
bar spacing 44
width of bars in
bar width 44
legends legends for
legends for 47
C
candlestick charts plots
candlestick candlestick 34
CChart 89 charts
bar simple
simple 42 bar 42 grouped bar;grouped bar charts
grouped 44 CuSum 67 pie 37
contour contour 48
heatmap heatmap 50
histograms histogram 54
labels labels for
labels for 117 background
background 142 colormaps 150 Control Chart Attribute Control Chart
CChart 89 NpChart 87 PChart 84 UChart 92
Variables Control Chart ControlLimit 68 EWMA 67, 96 Shewhart Control Charts 67 XbarR 78 XbarS 70 XmR 82
Cumulative Probability 104 CuSum 98
cumulative sum chart 98 CuSumStatus 100

176 • IMSL C# Chart Programmer’s User Guide Index
D
data point labels 117
E
error bar plots plots
error bar 27 EWMA 96
F
fills 111, 144, 145 colored 112 tiled
patterned fills 113
gradient 112 images for 114 outline colors for 112 outlines for 111 types of 112
G
graphs spline 23
H
popups;tool tips 151
I implicit nodes 6 Individuals Control Charts
XmR 82
L
labels string 126
labels3d dates in 126
legends 146 line
color 108 width 108
grid lines grid 133
M
marker color 110 patterns 111 size 110 thickness 111 type 109
chaining method calls 7 mixed error bar plots
plots mixer error bar 30
picking 154 multiple axes 138
N
normal distribution histograms 54 Normal Probability Plot 104, 135 NpChart 87
P
ParetoChart 102 pattern
background pattern 145
PChart 84 plots
line and marker;line and marker plots;marker plots
marker 17 function plot
function function 21
plots log
semilog;semilog plot 24 plots
loglog 26 horizontal error bar plots
horizontal error bar 29 plots
high-low-close;high-low-close plots
high-low-close 32 plots
box 40 plots
polar 56 dendrogram charts
dendrogram 59 printing 161 Probability Plot 104
Index IMSL C# Chart Programmer’s User Guide • 177
R
random values 14 RChart 78 reference lines 21 MS.NET Framework SDK 4
S
scaling automatic 125, 131 input values 125 output values 125
SChart 70 Shewhart Control Charts
ControlLimit 68 ShewhartControlChart 67 XbarR 78 XbarS 70
T
text 114 fonts 114 size 115 style 115 typeface 114
density, of tick marks 124 titles
axis titles 126
plot titles for
titles for 119
U
UChart 92 image files;bitmaps;using for image
files; 109, 166
V
Variables Control Chart EWMA 96 Shewhart Control Charts
ControlChartLimit 68 ShewhartControlChart 67 XbarR 78 XbarS 70 XmR 82
vertical error bar plots plots
vertical error bar 27
viewport attribute 170
W
WECO 67 weekends
skipping weekends 126
X
XbarR 78 XbarS 70 XmR 82
Z
zooming 156