california economic development recovery...
TRANSCRIPT
California Economic
Development
Recovery Strategy
Draft for Public Review
(March 12, 2009)
This initial draft of the California Economic Development
Recovery Strategy has been developed by the Chairman of the
Assembly Committee on Jobs, Economic Development, and the
Economy to assist Members of the Assembly and the public in
developing a meaningful dialogue about California's future.
Assembly Committee on Jobs, Economic
Development and the Economy
V. Manuel Pérez, Chair
Dan Logue, Vice Chair
Assembly Committee on
Jobs, Economic Development, and the Economy
V. Manuel Pérez, Chair
Dan Logue, Vice Chair
Jim Beall
Bill Berryhill
Marty Block
Alyson Huber
Mary Salas
Committee Staff:
Toni Symonds, Chief Consultant
Mercedes Flores, Consultant
Ruben Sierra, Intern
Meilin Xiang, Intern
Assembly Republican Caucus, Office of Policy:
Julia King, Principal Consultant
i
Table of Contents
Executive Summary....................................................................................... iv
Introduction
Establishing a Renewed Vision for California's Future ....................................... 2
Key Strategy Provisions .................................................................................. 2
Organization of the Strategy ........................................................................... 4
Part I – 24-Month Blueprint
Section 1 – Setting the Successful Path Forward
Structure of the CA Economic Recovery Strategy ............................................. 6
Monitoring and Oversight ............................................................................... 8
Goal 1 – Improving Business Access to Capital................................................. 9
Goal 2 – Target Infrastructure Projects that Link to
Economic Development ........................................................................... 13
Goal 3 – Expedite Workforce Services and Training Opportunities ................... 15
Goal 4 – Enhance Local and Regional Community Development Capacity ....... 17
Goal 5 – Ensure that the State's Recovery Strategy is a Plan
for all Californian .................................................................................. 19
Finalizing the Strategy.................................................................................... 21
Part II – Background on Recommended Actions
Section 2 - The California Economy
Overview of the California Economy............................................................... 24
California's Regional Economies..................................................................... 27
ii
Significance of Trade and Foreign Investment in the
California Economy.................................................................................. 34
The Role of Small Business in the California Economy...................................... 35
The Role of Manufacturing in the California Economy....................................... 36
Changing Demographics in the Workplace....................................................... 37
California Competitiveness.............................................................................. 39
California's Economic Policies.......................................................................... 40
Summary of the Economic Challenges Facing California Communities................ 41
Section 3 – California's Emerging Green Economy
Defining California's Green Economy............................................................... 44
Major Industries in California's Green Economy................................................ 47
Capital Flows in the Emerging Green Economy................................................. 48
R&D and Commercialization of New Products and Processes............................. 48
Growing Green Collar Jobs.............................................................................. 49
Summary of Challenges in Growing the Green Economy.................................... 50
Section 4 – Public Economic and Workforce Development Resources
Geographically-Targeted Economic Development Activities................................ 52
Other State and Federal Economic Development Resources............................... 55
Workforce Development in California............................................................... 57
Federal Stimulus Dollars................................................................................. 60
Section 5 – Private Economic and Workforce Development Resources
Partners in Improving Business Access to Capital.............................................. 65
Partners in Targeting Infrastructure Projects that Link to
Economic Development.............................................................................. 67
Partners in Expediting Workforce Services and Training Opportunities................ 68
iii
Partners in Enhancing Local and Regional Community Development Capacity...... 68
Partners in Ensuring all Californians Participate in the State's
Recovery Efforts.......................................................................................... 69
Appendices
Appendix A: Fast Facts on California's Economy............................................... i
Appendix B: California's Economic Strategy Panel Regions.............................. iv
Appendix C: Programmatic Changes Necessary to Implement the Strategy....... v
Appendix D: Summary of Selected State Economic and Workforce
Investment Programs........................................................ vii
Appendix E: Summary of Selected Federal Economic and Workforce
Investment Programs....................................................... xiv
Appendix F: Foreign Free Trade Zones in California..................................... xxiii
Appendix G: Enterprise Zones and Other Geographically-Targeted
Economic Development Areas................................................................ xxvi
Appendix H: California's Redevelopment Agencies and Project Areas............ xxx
Appendix I: Map of California Recycling Market Development Zones ........... xxxv
Appendix J: Summary of Key Provisions of the American Recovery and
Reinvestment Act........................................................... xxxvi
Appendix K: California Unemployment Rates by County................................ xlvii
Appendix L: Background on the Unemployment Fund Economic Crisis ........... xlviii
Glossary of Terms ........................................................................................ liv
Bibliography ................................................................................................. lv
iv
California Economic Development Recovery Strategy
Executive Summary
The federal government is in the initial stages of implementing a $787 billion economic recovery
plan to provide new funding to states, local governments, schools, businesses, and working
families in an effort to turn the tide in the current economic crisis. The state must seize this
opportunity by putting forth a comprehensive blueprint to guide the state's economic and
workforce development actions.
While monetary policy is set in Washington D.C., the state can play an important role in facilitating
the smooth and efficient use of federal and state programs to best serve the immediate needs of
the businesses, workers, and other individuals affected by the recession. If done well, these
monies can serve as a catalyst for the state's long-term economic future.
In short, the California Economic Development Recovery Strategy serves as a blueprint for state
economic and workforce development actions over the next 24 months. This is an initial draft of
the Strategy and it has been put forth as a document to help engage the Legislature and the
public in the important discussion of the future of our communities. The foundational principles of
the strategy are to:
• Design a Strategy that leads to a renewed vision of California's future; • Leverage California's innovation leadership; • Weigh actions of today against impacts on tomorrow; • Manage toward defined outcomes; and • Focus on local and regional delivery strategies.
The five goals of the Strategy are to:
• Improve business access to capital; • Target infrastructure projects that link to economic development; • Expedite workforce services, educational services, and training opportunities; • Enhance local and regional community development capacity; and • Ensure that the state's recovery strategy is a plan for all Californians.
Examples of recommended economic and workforce development activities include, but are not
limited to:
• Ensure Oversight of Recovery Efforts: Establish a state economic recovery board, similar to
the federal board to oversee the implementation of the Strategy and effective use of state and
federal resources.
• Cut Government Red Tape: Introduce legislation to reduce the impact of state regulations on
small and medium-size businesses, while retaining stated policy objectives.
• Provide Small Business Gap Financing: Introduce legislation to expand the state Small
Business Guarantee Program to offer direct loans to small businesses that receive a federal
guarantee from the federal Small Business Administration.
v
• Establish Green Innovation Zones: Introduce legislation to enhance the incentives within
Enterprise Zones that could be beneficial to cleantech R&D, manufacturing, and distribution.
• Funding of Green Infrastructure Projects: Introduce legislation to prioritize state funding
toward green infrastructure projects that meet certain criteria including being "shovel ready,"
having the ability to create long-term jobs, and providing a "green dividend."
• Expand Green Training Opportunities: Introduce legislation to appropriate supplemental
federal funds to Community Colleges for green training opportunities.
• Learn By Building: Introduce legislation to integrate training components into large and small-
scale infrastructure projects where they do not currently exist.
This draft report on the CA Economic Recovery Strategy consists of the following five parts
including:
1. The structural framework for moving forward. California's Strategy includes goals, objectives,
action items, timelines, funding sources, oversight, and monitoring provisions. The state must
facilitate public and private investment activities by connecting government programs and
funding with local communities. A series of immediate, mid-term and long-term actions are
recommended to grow California's economy.
2. An assessment of the California economy. California is one of the largest and most diversified
economies in the world, ranking 8th in economic productions behind only the U.S., Japan,
Germany, China, United Kingdom, France, and Italy. Driving the state's $1.8 trillion economy
are the businesses and workers in the state's nine economic regions. This section includes
details on major industries, and employment and growth patterns.
3. A focus on California's green economy. Innovation has long been the one of the common
denominator of the California economy. In this section an expanded analysis is provided of
business and workforce opportunities of the emerging green economy.
4. Local, state, and federal resources available to implement the Strategy. This section provides a
list of the types of local, state, and federal resources that are available to move the California
economy forward and help mitigate the current impact of the crisis on local workers and
businesses.
5. State and regional organizations available to implement the Strategy. The private sector, often
overlooked when developing a state strategy, can play an important role in the implementation
of this comprehensive community and economic development strategy. This section will
identify a broad range of organizations that can serve in this pivotal role.
The success of the Strategy will be measured by its ability to engage a broad spectrum of
Californians, and by an increase in jobs and private capital to sustain existing and establish new
businesses.
California Economic Development Recovery Strategy
Introduction
California workers and businesses are currently facing some of the harshest economic conditions
since the Great Depression. Unemployment in California has reached 10.1% and is projected to rise
to at least 11% before the current recession is over. Some areas of the state, however, are already
experiencing unemployment rates of nearly 27%. Almost every industry sector is experiencing a loss
of jobs and will likely continue to experience losses as the global economy progressively deteriorates.
In summary, credit markets are frozen, unemployment is rising, and production is stalled.
Unlike the recoveries from the last six recessions where gains in consumer spending helped lead the
nation out of the recession, many economists believe that consumer spending will continue to lag due
to a lack of access to credit and increasing unemployment. Without demand to stabilize prices, prices
will theoretically continue to drop and could, in some sectors, drop costs below the level necessary to
support production. This has led the President, in his economic stimulus efforts, to propose a major
demand-side push using federal spending to partially offset the dramatic drop in private sector
consumption. For California, this means billions in new revenues in the areas of infrastructure,
housing, business assistance, and science and technology.
In an effort to maximize the impact of the monies, the Chairman of the Assembly Committee on Jobs,
Economic Development and the Economy called for the development of a comprehensive set of
economic and workforce development actions to guide the state's activities over the next 24 months.
This initial draft of the California Economic Development Recovery Strategy (CA Economic Recovery
Strategy) has been specially designed to assist Assemblymembers and the public in developing a
meaningful dialogue about how to best leverage federal funds and its own resources for the purpose
of moving the state toward a more economically vital and sustainable future.
As an initial draft, this strategy will require further development and review by a broad range of
stakeholders, using both traditional and innovative means for obtaining consultation, including
legislative hearings, interactive websites, distribution through non-profit organizations, and
Assemblymember-hosted community meetings. During this round of expanded engagement there
are a number of important areas that need to be addressed including, but not limited to:
• Appropriate oversight and coordination of the state's actions to help leverage federal dollars;
• Scope of the Strategy;
• Identification of responsible parties;
• Measurement of success;
2
• Connectivity of the separate elements of the Strategy; and
• Identification of federal and state impediments to best utilize public and private resources.
In its final form, the CA Economic Recovery Strategy will simply consist of a clear set of guiding
principles, goals, tasks and measurable outcomes to assist the state in successfully navigating
through the challenging economic times.
Establishing a Renewed Vision for California's Future
As Californians move forward from these difficult economic times, it is more important than ever to have a unified vision that can support the state's long-term growth. Beyond theory, this vision must be sufficiently bright and grounded in reality as to break through old and ill-fitting models for business development, finance, along with education and workforce development. In this initial draft, the Strategy seeks to outline and operationalize a renewed vision for a green
economy. The term "green economy," however, is not limited to only those businesses and jobs
directly related to renewable energy and clean air and water. Rather, the term is used as an emblem
of a broader, more sustainable economy encompassing all industry sectors that more rationally
addresses the needs of today, while preserving the economic, social, and environmental opportunities
of future generations.
Californians deserve a renewed economy that is not burdened by the historic fights between labor and business, and between business and the environment. An economy that, for the first time, recognizes the interconnections between workers, businesses, and resources. And, from this recognition, an economy that seizes the opportunity to again lead the world in innovation, technology, and quality of life.
Key Strategy Provisions
The federal government is in the initial stages of implementing $787 billion in new funding to assist
states, local governments, businesses, and workers in turning the tide in the current economic crisis.
The recently proposed federal budget also sets new federal funding priorities and programmatic
reforms.
California proposes, through the implementation of this Strategy, the use of the broadest set of
community, economic, and workforce development tools to link these new federal resources with the
people and organizations they are designed to serve. In order to accomplish this important task, the
strategy includes both key actions that will enable the state to become better prepared to draw down
federal dollars, as well as actions to allocate its own resources to shore-up and fill funding and
technical assistance gaps.
The foundational principles of the CA Economic Recovery Strategy are designed to quickly access
supplemental federal dollars and to also strengthen the long-term economies of our communities with
the intention of improving the quality of life for all Californians. There is an important distinction
between these two purposes. While the federal stimulus dollars are essential to the state's economic
recovery, federal funds are also temporary and should therefore only be viewed as a possible catalyst
and not as a permanent crutch to support the state's long-term economic development. As currently
3
envisioned, the CA Economic Recovery Strategy is an action blueprint for the next 24-months. Its
foundational principles include:
• Design a Strategy that leads to a renewed vision of California's future;
• Leverage California's innovation leadership;
• Weigh actions of today against impacts on tomorrow;
• Manage toward defined outcomes; and
• Focus on local and regional delivery strategies.
The recommended actions in the CA Economic Recovery Strategy are organized around five
community development goals. These goals build on the state’s current strengths while exploring
new policy areas reflective of the state's current position within the global marketplace. The five
goals of the CA Economic Recovery Strategy are to:
• Goal 1 – Improve business access to business capital
• Goal 2 – Target infrastructure projects that link to economic development
• Goal 3 - Expedite workforce services and training opportunities
• Goal 4 – Enhance local and regional community development capacity
• Goal 5 – Ensure that the state's recovery strategy is a plan for all Californians.
In later sections of this document, each of these goals is detailed and specific action items are put
forth, including actions that should start immediately, to actions proposed in the next six-to-12
months and, finally, those actions which will help to fortify the economy as the state begins to move
out of the recession in the next 12-to-18 months.
This Strategy sets new ground in defining the state as a facilitator and supporter of local economic,
workforce, and other community development activities. Based on best community development
practices, the Strategy links federal, state, and local public and private resources for the purposes of
supporting local communities in addressing their most immediate needs and, over the longer term,
creating the conditions of increased economic and social prosperity for the whole community. The
Strategy is designed to support and enhance each community's individual initiative to design and
implement policies and programs which best its their needs.
Success of the CA Economic Recovery Strategy will be defined by its ability to engage a broad
spectrum of Californians, increase jobs, and lead to increased availability of private capital to
businesses within our communities.
4
Organization of the Strategy
This initial draft of the Strategy has been specially prepared to assist community leaders and
Members of the Assembly in discussing how to best address the current economic crisis. Therefore,
the Strategy:
1. Succinctly lays out a list of actions the state can pursue in the next 24 months to address the
immediate and longer-term economic needs of the state; and
2. Provides details about the overall makeup of the state economy and the public and private
resources that are available to address the current economic crisis.
More specifically, the CA Economic Recovery Strategy is divided into 2 parts with extensive appendices. Part I includes Section 1 and it presents the structured framework for moving forward including goals, objectives, actions items, timelines, funding sources, oversight, and monitoring provisions. Part II has four sections (Sections 2 through 5) that provide key background information that support the recommendations in Part I. The second section provides a brief overview of the California economy prior to the current economic situation, as well as forecasts on the future economy. The third section includes a more in depth look at California's cleantech industries and identifies regional advantages in this emerging green economy. The fourth section includes a discussion of the local, state, and federal resources available to
implement the CA Economic Recovery Strategy. The fifth section includes a survey of California’s
community development network, which, once joined with the state, will form an integrated delivery
system for drawing down federal dollars and implementation of the CA Economic Recovery Strategy.
In addition to these sections, the strategy includes a number of appendices, a glossary of terms, and a bibliography of materials used in preparing the document. Resources found in the appendices include: • Appendix A provides a fact sheet on the California economy. • Appendix B has a map of California and its nine economic regions. • Appendix C includes a list of programmatic changes at the state and federal levels that are
necessary to implement the Strategy. • Appendix D includes brief descriptions of California's current economic and workforce investment
programs. • Appendix E provides descriptions of key federal economic and workforce investment programs. • Appendix F includes a list of foreign trade zones in California. • Appendix G has a map of California's Enterprise Zones and other geographically targeted
economic development areas.
5
• Appendix H provides a brief discussion on the economic impact of California's Community Redevelopment Agencies and Project Areas.
• Appendix I includes a map of California Recycling Promotion Zones. • Appendix J has an outline of the American Recovery and Reinvestment Act. • Appendix K includes a map with information on unemployment rates in each county. • Appendix L includes an extended discussion unemployment insurance fund crisis. • Appendix M provides a full glossary of key terms used in the strategy.
6
Part I – The 24-Month Blueprint of Actions
The initial draft of the Strategy includes two parts. Part I of the Strategy sets forth the specific
actions to be undertaken in the next 24 months in order to best leverage federal funding to meet the
immediate and longer-term needs of the state. In Part II, the Strategy includes detailed background
information on the California economy, public and private resources available to implement the
strategy, and an expanded focus on the emerging green economy.
Section 1. Setting the Successful Path Forward
There are no silver bullets to solving the nation's current economic challenges. States, however, can
play an important role in facilitating public and private investment activities. While only the federal
government has the ability to print money and control many of our key regulatory controls, without
help, the federal government is not as effective in targeting resources to local communities. In a
similar way, nonprofits and local governments can need assistance in connecting with state and
federal programs that would enhance their activities.
California’s long-term economic success will not be evaluated by how much money or services were
made available. Rather, California's success will be dependent on the state's ability to stabilize its
local economies, retain its quality workforce, and attract new private sector investment. Put simply,
success will be achieved when more Californians have jobs and have gained a greater faith in the
state's bright future.
By taking an active and strategic approach to assessing needs, prioritizing actions, filling gaps, and
facilitating streamlined program and service delivery, a state can add great value to federal, local, and
regional economic development efforts. It is currently estimated that, collectively, California will
receive more than $20 billion in assistance through a federal economic stimulus package. The CA
Economic Recovery Strategy is designed to serve as a blueprint for leveraging these new federal
dollars and serving to move the state toward a more sustainable future.
Design a Strategy that leads to a renewed vision of California's future. California stands at a
key turning point. The economic failures of the past leave no reasonable option to return to a
business as usual scenario. California must aggressively and strategically move forward toward a new
model for growth of its communities and its economy. As in response to past economic crises,
California's future lives in its ability to once again gather its human and capital resources and reinvent
itself.
Structure of the CA Economic Recovery Strategy
The CA Economic Recovery Strategy is a 24-month list of actions, founded in community development
principles and driven by its goals, objectives, and individual action items. The final design and
7
ultimate implementation of the Strategy is dependent on the active participation of local communities,
workers, businesses, and nonprofits. The Strategy's five foundational principles are to:
• Design a Strategy that leads to a renewed vision of California's future. California stands
at a key turning point. The economic failures of the past leave no reasonable option to return to
a business-as-usual scenario. California must aggressively and strategically move forward toward
a new model for growth of its communities and its economy. As in response to past economic
crisis, California's future lives in its ability to once again gather its human and capital resources
and reinvent itself.
• Leverage California's innovation leadership: At its core, California is a world leader in
innovation, especially in the areas of technology and design. Maintaining and expanding this
dominant role requires conscious stewardship as the state advances from this economic crisis.
• Weigh actions today against impacts tomorrow: The state will take a balanced
approach in reducing expenditures and increasing revenues in order to meet its
constitutional fiscal mandates. Each proposed cut or revenue enhancement will be
measured against its potential impact on the state’s foundational strategy of long-term
economic growth.
• Manage toward defined outcomes: Implementation of the CA Economic Recovery
Strategy will include the use of defined goals, timelines, and ongoing monitoring to allow
for quick and effective adjustments. Solid planning principles will be used, good data will
be employed, best practices will be encouraged, and expenditures will be weighed to
ensure careful alignment with the state’s foundational strategy for long-term economic
growth.
• Focus on local and regional delivery strategies: The state will maximize the use of local and
regional community and economic development organizations in order to more rapidly move
federal and state funding, efficiently implement programs, and successfully monitor the progress
of the CA Economic Recovery Strategy. In general, monies are designed to flow through existing
programs and/or successful pilot projects.
These foundational principles are driven by five comprehensive economic development goals. Each
goal is implemented through a set of objectives and specific actions, which are discussed in detail
later in this section. The goals of the CA Economic Recovery Strategy are as follows:
• Goal 1 – Improve Business Access to Capital
• Goal 2 – Target Infrastructure Projects that Link to Economic Development
• Goal 3 - Expedite Workforce Services and Training Opportunities
• Goal 4 – Enhance Local and Regional Community Development Capacity
• Goal 5 – Ensure that the State's Recovery Strategy is a Plan for all Californians.
8
Each goal is also accompanied by a list of one or more funding sources. As the federal stimulus
package evolves, these lists will be updated to ensure California is maximizing its ability to leverage
federal dollars to meet the immediate and longer term needs of its workers, businesses, and
communities. Appendix J includes a summary of the federal stimulus package.
Monitoring and Oversight Mechanism
It is envisioned that the CA Economic Recovery Strategy will play a central role in setting state
guidance and expenditure priorities related to community, economic, and workforce development
activities for fiscal years 2008-09, 2009-10 and 2010-11 (February 2009 to February 2011). As a
long-term management document it must, therefore, include an effective and efficient monitoring and
oversight mechanism. Legislation must be implemented quickly, funds must be allocated judiciously
and corrections and program modifications must be made promptly to ensure the overall principles,
goals and objectives are achieved.
It is therefore recommended that the state establish a limited-term oversight board, the California
Economic Recovery Accountability and Transparency Board (CA Economic Recovery Board). As
initially conceived, the CA Economic Recovery Board would serve as the official monitor of the
implementation of the CA Economic Recovery Strategy and oversee the delivery and implementation
of federal stimulus funding.
As detailed previously, California’s recovery is dependent on the success of the private sector to
create and retain quality jobs and, thereby increase state revenues and strengthen local economies.
The state currently has an unorganized variety of programs and services designed to assist in
community, economic, and workforce development activities. Without a single entity responsible for
ongoing monitoring, it is not reasonable to assume that agencies, departments, boards, commissions,
and other government entities will behave differently than in the past. Further, this strategy is based
on strong participation by local and regional players who cannot meet their objectives without the
state first “getting its act together.”
In addition, investors need to be reassured that California is rationally addressing its budgetary
problems. Due to the very progressive nature of the California tax system, revenues cannot
meaningfully increase until the economy improves. Demonstrating the implementation of a strong
economic recovery strategy should calm investors' concerns and help the state and municipalities sell
debt instruments into the private market.
The establishment of a monitoring board can take a variety of forms and structures and does not
necessarily mean that the responsibility for the implementation of specific state programs and
services need to be shifted. Under one model, the CA Economic Recovery Board could simply serve
as a single overarching entity that oversees, assesses, comprehensively reports, and provides early
warnings to the Administration and Legislature on the progress of the numerous initiatives that
comprise the strategy and distribution of the federal stimulus dollars. Key activities of the Board
could include, but are not limited to:
• Establishing and implementing an effective web-based tracking system that is transparent to
the public, as well as to local, state, and federal governments. This system should be
9
designed to give potential applicants maximum notice for applying for and leveraging federal
and state dollars.
• Facilitating the review of current federal funding formulas and regulations to determine how
those formulas or regulations affect California. To the extent that formulas or regulations
would undercompensate or serve real needs in the state, the Board could be responsible for
advocating for modifications at the federal level. Appendices D and E includes the beginning
of a list of potential state and federal program modifications.
• Reviewing local, regional, and federal programs to see where the state can be a better
community development partner. Appendix J includes a summary of the federal stimulus
package.
• Facilitating local and regional collaboration in developing infrastructure, economic, and
workforce development projects that will help retain jobs and lead to more quality jobs.
• Advocating at the federal level for program changes that enhance California’s ability to assist
small businesses and create jobs.
As proposed, the configuration of a state oversight board is consistent with how the federal
government is organizing its oversight activities. Under the federal stimulus plan, Congress has
proposed the establishment of a “Recovery Act Accountability and Transparency Board” to monitor
the expenditure of federal program dollars. Further, governors and program managers responsible
for making federal awards and expenditure decisions will be required to personally certify that all
expenditures are appropriate based on federal guidelines.
California must be prepared to meet this new level of federal oversight. It would be very unfortunate
for the state to be unable to draw down all of the available federal dollars, or worse, have to return
federal program dollars, due to inadequate management practices. A single point of contact could
improve program efficiencies, allow for program redundancies to be more quickly identified, and
provide the level of transparency and accountability the public deserves.
The following subsections provide more detail on how each of the goals of the CA Economic Recovery
Strategy will be implemented.
Goal 1- Improve Business Access to Capital
Attracting private capital is essential to the state's long-term economic recovery. No government,
acting alone, can truly revitalize local communities. In its initial stages, the CA Recovery Strategy
proposes short-term government intervention to help small businesses stay afloat while the broader
credit markets thaw. In the longer term, establishing California as a preferred partner and secure
location for private investment is an essential component of the state's extended growth strategy.
Objectives:
• To help small and medium-size businesses meet short-term capital needs;
10
• To enhance the state's network of financial and community intermediaries;
• To support entrepreneurs’ success by enhancing their ability to access private capital; and
• To expand funding opportunities for green technologies.
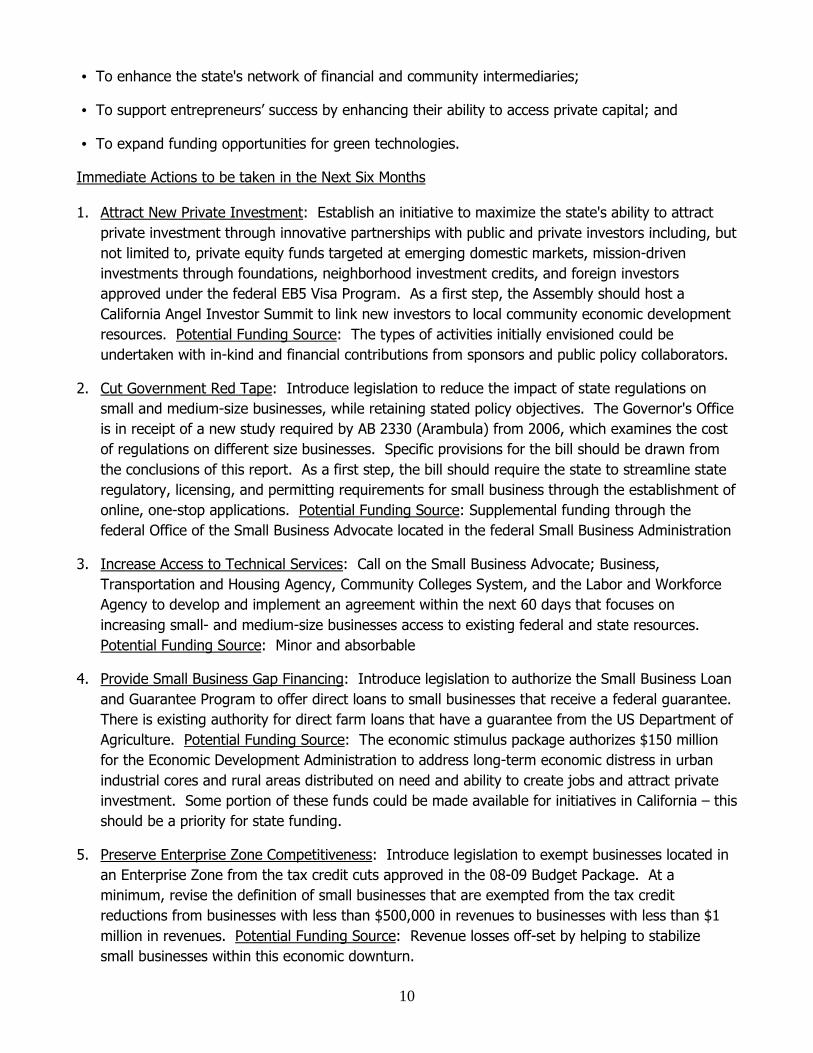
Immediate Actions to be taken in the Next Six Months 1. Attract New Private Investment: Establish an initiative to maximize the state's ability to attract
private investment through innovative partnerships with public and private investors including, but
not limited to, private equity funds targeted at emerging domestic markets, mission-driven
investments through foundations, neighborhood investment credits, and foreign investors
approved under the federal EB5 Visa Program. As a first step, the Assembly should host a
California Angel Investor Summit to link new investors to local community economic development
resources. Potential Funding Source: The types of activities initially envisioned could be
undertaken with in-kind and financial contributions from sponsors and public policy collaborators.
2. Cut Government Red Tape: Introduce legislation to reduce the impact of state regulations on
small and medium-size businesses, while retaining stated policy objectives. The Governor's Office
is in receipt of a new study required by AB 2330 (Arambula) from 2006, which examines the cost
of regulations on different size businesses. Specific provisions for the bill should be drawn from
the conclusions of this report. As a first step, the bill should require the state to streamline state
regulatory, licensing, and permitting requirements for small business through the establishment of
online, one-stop applications. Potential Funding Source: Supplemental funding through the
federal Office of the Small Business Advocate located in the federal Small Business Administration
3. Increase Access to Technical Services: Call on the Small Business Advocate; Business,
Transportation and Housing Agency, Community Colleges System, and the Labor and Workforce
Agency to develop and implement an agreement within the next 60 days that focuses on
increasing small- and medium-size businesses access to existing federal and state resources.
Potential Funding Source: Minor and absorbable
4. Provide Small Business Gap Financing: Introduce legislation to authorize the Small Business Loan
and Guarantee Program to offer direct loans to small businesses that receive a federal guarantee.
There is existing authority for direct farm loans that have a guarantee from the US Department of
Agriculture. Potential Funding Source: The economic stimulus package authorizes $150 million
for the Economic Development Administration to address long-term economic distress in urban
industrial cores and rural areas distributed on need and ability to create jobs and attract private
investment. Some portion of these funds could be made available for initiatives in California – this
should be a priority for state funding.
5. Preserve Enterprise Zone Competitiveness: Introduce legislation to exempt businesses located in
an Enterprise Zone from the tax credit cuts approved in the 08-09 Budget Package. At a
minimum, revise the definition of small businesses that are exempted from the tax credit
reductions from businesses with less than $500,000 in revenues to businesses with less than $1
million in revenues. Potential Funding Source: Revenue losses off-set by helping to stabilize
small businesses within this economic downturn.

11
6. Establish Green Innovation Zones: Introduce legislation to enhance the incentives within
Enterprise Zones which could be beneficial to cleantech R&D, manufacturing, and distribution. As
a requirement for these enhanced incentives, require that the Enterprise Zones establish strategic
partnerships with federal research facilities and other key innovation partners in their region.
Potential Funding Source: The potential increased costs could be offset by additional state and
local tax revenues.
7. Protect Municipal Bond Market: Introduce legislation to eliminate or reduce the $250 million claw-
back on local community redevelopment tax increment monies authorized in the 2008-09 budget.
At a minimum, adopt strong statutory limitations on taking any monies which are already
committed toward repayment of bonds or implementation of redevelopment plans. Authorize
agencies to extend the term of their redevelopment plan should uncommitted monies be taken
through legislative action and those monies would have been needed to complete the plan.
Potential Funding Source: The potential loss of revenues to the General Fund would be offset by
additional local infrastructure financing, which results in a variety of increased state tax revenues.
8. Expand Funding for Green Technologies: Call on the California Energy Commission to undertake a
study on how best to draw down federal energy and other green technology dollars, especially as
these monies can be used to fund the commercialization of projects through the "Valley of Death."
Legislation may later be needed to harmonize and make more competitive in leveraging certain
state technology development programs including, but not limited to, the:
• Energy Innovation Small Grant Program, which offer low interest loans and is administered
through the California Energy Commission;
• Direct loan program administered through the Recycling Market Development Zones Loan
Program; and
• Innovative Clean Air Technology Program, which offers grants and is administered through the
California Air Resources Board.
Potential Funding Source: Appropriate $150,000 from the PIER Program in order to access
significant portions of the $16 billion for loan guarantees to renewable energy power generation
and transmission projects; $6.3 billion energy block grants to state and local governments; and
$3.4 billion in carbon capture and sequestration research.
9. Stop increasing costs to businesses through new interpretation of regulations: Call on the Board
of Equalization (BOE) to discontinue its administrative action to redefine "destination management
companies" as a "reseller" rather than a "consumer" for the purpose of sales tax assessment.
Potential funding source: None needed. This proposal stops an internal action by the BOE. This
funding was not calculated within the state budget framework.
Undertake Midterm Actions in the Next Six-to-12 Months 10. Develop FDI Strategy: Call on the Business, Transportation and Housing Agency to develop and
implement a Foreign Investment Strategy that maximizes the leverage of funds and programs
available through the US, the World Bank, International Monetary Fund, and regional export
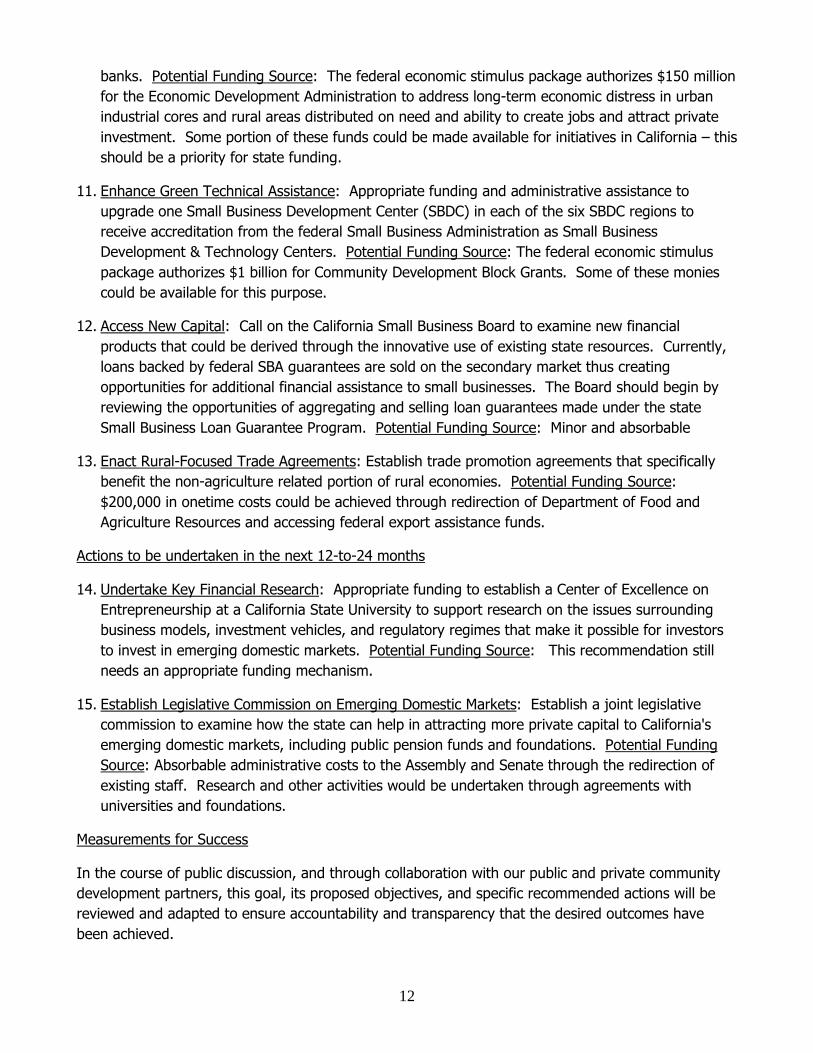
12
banks. Potential Funding Source: The federal economic stimulus package authorizes $150 million
for the Economic Development Administration to address long-term economic distress in urban
industrial cores and rural areas distributed on need and ability to create jobs and attract private
investment. Some portion of these funds could be made available for initiatives in California – this
should be a priority for state funding.
11. Enhance Green Technical Assistance: Appropriate funding and administrative assistance to
upgrade one Small Business Development Center (SBDC) in each of the six SBDC regions to
receive accreditation from the federal Small Business Administration as Small Business
Development & Technology Centers. Potential Funding Source: The federal economic stimulus
package authorizes $1 billion for Community Development Block Grants. Some of these monies
could be available for this purpose.
12. Access New Capital: Call on the California Small Business Board to examine new financial
products that could be derived through the innovative use of existing state resources. Currently,
loans backed by federal SBA guarantees are sold on the secondary market thus creating
opportunities for additional financial assistance to small businesses. The Board should begin by
reviewing the opportunities of aggregating and selling loan guarantees made under the state
Small Business Loan Guarantee Program. Potential Funding Source: Minor and absorbable
13. Enact Rural-Focused Trade Agreements: Establish trade promotion agreements that specifically
benefit the non-agriculture related portion of rural economies. Potential Funding Source:
$200,000 in onetime costs could be achieved through redirection of Department of Food and
Agriculture Resources and accessing federal export assistance funds.
Actions to be undertaken in the next 12-to-24 months
14. Undertake Key Financial Research: Appropriate funding to establish a Center of Excellence on
Entrepreneurship at a California State University to support research on the issues surrounding
business models, investment vehicles, and regulatory regimes that make it possible for investors
to invest in emerging domestic markets. Potential Funding Source: This recommendation still
needs an appropriate funding mechanism.
15. Establish Legislative Commission on Emerging Domestic Markets: Establish a joint legislative
commission to examine how the state can help in attracting more private capital to California's
emerging domestic markets, including public pension funds and foundations. Potential Funding
Source: Absorbable administrative costs to the Assembly and Senate through the redirection of
existing staff. Research and other activities would be undertaken through agreements with
universities and foundations.
Measurements for Success
In the course of public discussion, and through collaboration with our public and private community
development partners, this goal, its proposed objectives, and specific recommended actions will be
reviewed and adapted to ensure accountability and transparency that the desired outcomes have
been achieved.

13
Goal 2 – Target Infrastructure Projects that Link to Economic Development
The challenges facing the California economy are both the result of the current financial crisis and
systemic neglect of the state's human and physical infrastructure. In moving forward, the CA
Economic Recovery Strategy proposes to leverage the potential supplemental federal funding to meet
the state's long-term sustainable economic development objectives. Properly applied, these new
federal dollars combined with the state's previously approved infrastructure, could result in new
training opportunities and emerging business subcontractors, as well as improved infrastructure.
Objectives:
• To increase business participation rates of emerging and disabled veteran-owned business
enterprises;
• To provide infrastructure to support the state’s long-term economic growth; and
• To prioritize energy efficiency, reuse, and recycling in state infrastructure development.
Immediate Actions to be taken in the Next Six Months
1. Funding of Green Infrastructure Projects: Introduce legislation to fund green infrastructure
projects which meet certain specified criteria including being "shovel ready"; having the ability to
create long-term jobs, and providing a "green dividend." Infrastructure should be viewed in the
broadest sense including infrastructure related to drinking and waste water, public transit, local
road, brownfields clean-up, flood protection, parks, sewer and water supply, state buildings,
museums, and wetlands restoration. Potential Funding Source: State infrastructure bond money,
the Public Transportation Modernization, Improvement and Service Enhancement Account, and
the Local Streets and Road Improvement Account among others.
2. Facilitate Local Infrastructure Needs: Call on the Governor's Office of Planning and Research to
undertake, in consultation with communities, a comprehensive assessment of local and regional
infrastructure needs including, water, sewer, roads, and telecommunication. The assessment
should include identification of currently available public and private funding, identification of local
financing gaps, and a list of pending infrastructure projects that would help to meet the identified
needs. The assessment should also include a strategy for maximizing California communities
receiving their fair share of federal infrastructure funding. Potential Funding Source: A small
portion of the supplemental monies from the $1 billion in Community Development Block Grant
funding in the federal economic stimulus package.
3. Mandate Small Business and DVBE Participation: Introduce legislation to set a statutory target of
25% of all infrastructure contracts awarded by a state agency, regardless of funding source, be
awarded to small and emerging contractors. This currently only applies to contracts when state
infrastructure bond monies are being used. Potential Funding Source: No cost, potential for
bringing more money to California small businesses.
4. Expand Regional Funding Fairs: Call on the State Infrastructure Bank to coordinate a second full
round of infrastructure finance fairs in 2009 and 2010. At these funding fairs, local governments
have the opportunity to meet with federal and state agencies to discuss grant and loan
14
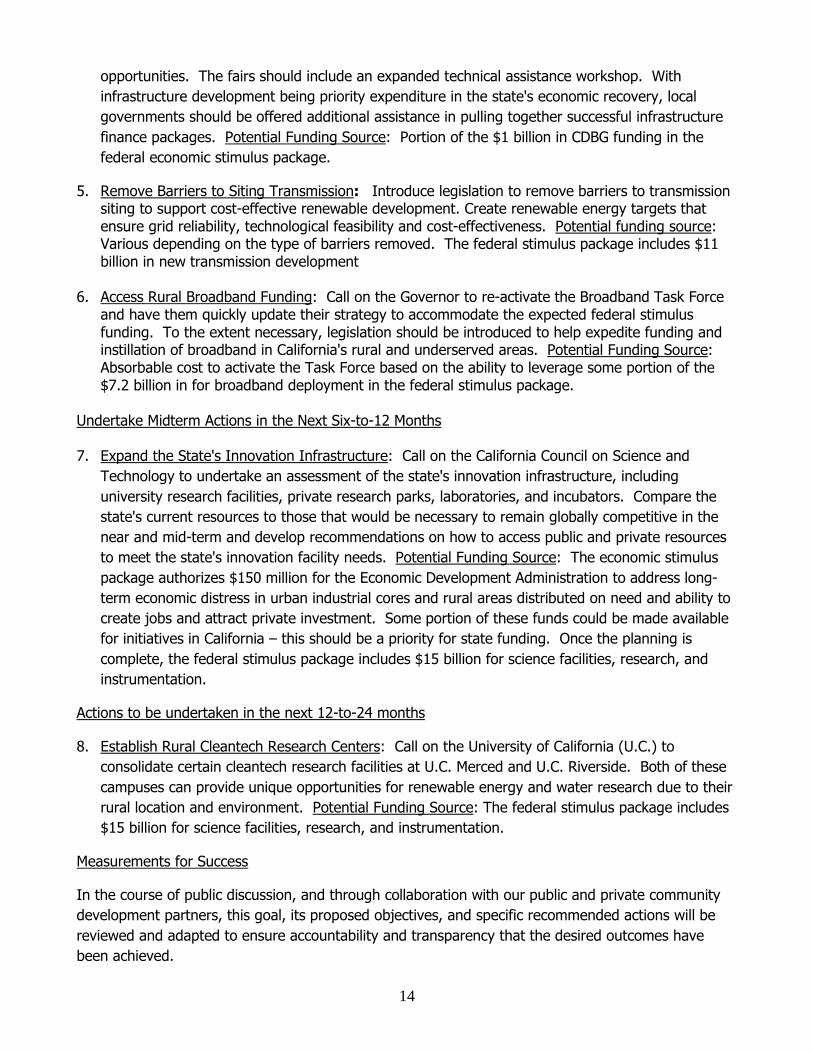
opportunities. The fairs should include an expanded technical assistance workshop. With
infrastructure development being priority expenditure in the state's economic recovery, local
governments should be offered additional assistance in pulling together successful infrastructure
finance packages. Potential Funding Source: Portion of the $1 billion in CDBG funding in the
federal economic stimulus package.
5. Remove Barriers to Siting Transmission: Introduce legislation to remove barriers to transmission siting to support cost-effective renewable development. Create renewable energy targets that ensure grid reliability, technological feasibility and cost-effectiveness. Potential funding source: Various depending on the type of barriers removed. The federal stimulus package includes $11 billion in new transmission development
6. Access Rural Broadband Funding: Call on the Governor to re-activate the Broadband Task Force
and have them quickly update their strategy to accommodate the expected federal stimulus funding. To the extent necessary, legislation should be introduced to help expedite funding and instillation of broadband in California's rural and underserved areas. Potential Funding Source: Absorbable cost to activate the Task Force based on the ability to leverage some portion of the $7.2 billion in for broadband deployment in the federal stimulus package.
Undertake Midterm Actions in the Next Six-to-12 Months 7. Expand the State's Innovation Infrastructure: Call on the California Council on Science and
Technology to undertake an assessment of the state's innovation infrastructure, including
university research facilities, private research parks, laboratories, and incubators. Compare the
state's current resources to those that would be necessary to remain globally competitive in the
near and mid-term and develop recommendations on how to access public and private resources
to meet the state's innovation facility needs. Potential Funding Source: The economic stimulus
package authorizes $150 million for the Economic Development Administration to address long-
term economic distress in urban industrial cores and rural areas distributed on need and ability to
create jobs and attract private investment. Some portion of these funds could be made available
for initiatives in California – this should be a priority for state funding. Once the planning is
complete, the federal stimulus package includes $15 billion for science facilities, research, and
instrumentation.
Actions to be undertaken in the next 12-to-24 months
8. Establish Rural Cleantech Research Centers: Call on the University of California (U.C.) to
consolidate certain cleantech research facilities at U.C. Merced and U.C. Riverside. Both of these
campuses can provide unique opportunities for renewable energy and water research due to their
rural location and environment. Potential Funding Source: The federal stimulus package includes
$15 billion for science facilities, research, and instrumentation.
Measurements for Success
In the course of public discussion, and through collaboration with our public and private community
development partners, this goal, its proposed objectives, and specific recommended actions will be
reviewed and adapted to ensure accountability and transparency that the desired outcomes have
been achieved.
15
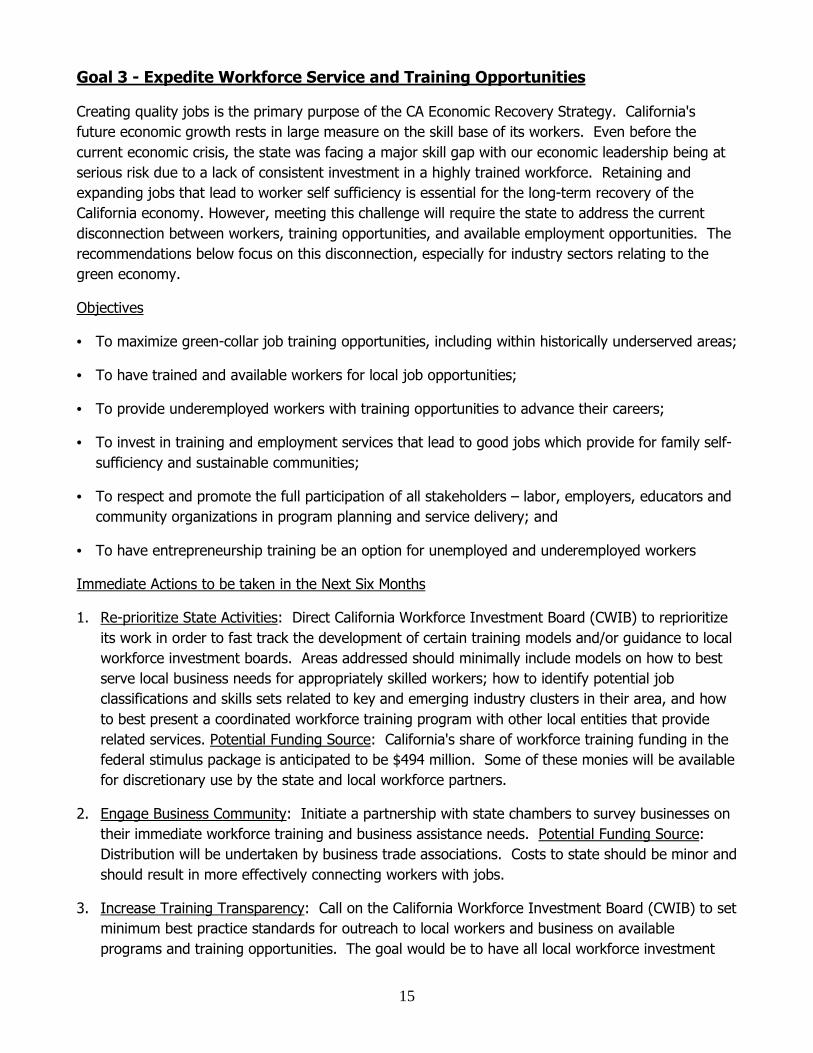
Goal 3 - Expedite Workforce Service and Training Opportunities
Creating quality jobs is the primary purpose of the CA Economic Recovery Strategy. California's
future economic growth rests in large measure on the skill base of its workers. Even before the
current economic crisis, the state was facing a major skill gap with our economic leadership being at
serious risk due to a lack of consistent investment in a highly trained workforce. Retaining and
expanding jobs that lead to worker self sufficiency is essential for the long-term recovery of the
California economy. However, meeting this challenge will require the state to address the current
disconnection between workers, training opportunities, and available employment opportunities. The
recommendations below focus on this disconnection, especially for industry sectors relating to the
green economy.
Objectives
• To maximize green-collar job training opportunities, including within historically underserved areas;
• To have trained and available workers for local job opportunities;
• To provide underemployed workers with training opportunities to advance their careers;
• To invest in training and employment services that lead to good jobs which provide for family self-
sufficiency and sustainable communities;
• To respect and promote the full participation of all stakeholders – labor, employers, educators and
community organizations in program planning and service delivery; and
• To have entrepreneurship training be an option for unemployed and underemployed workers
Immediate Actions to be taken in the Next Six Months
1. Re-prioritize State Activities: Direct California Workforce Investment Board (CWIB) to reprioritize
its work in order to fast track the development of certain training models and/or guidance to local
workforce investment boards. Areas addressed should minimally include models on how to best
serve local business needs for appropriately skilled workers; how to identify potential job
classifications and skills sets related to key and emerging industry clusters in their area, and how
to best present a coordinated workforce training program with other local entities that provide
related services. Potential Funding Source: California's share of workforce training funding in the
federal stimulus package is anticipated to be $494 million. Some of these monies will be available
for discretionary use by the state and local workforce partners.
2. Engage Business Community: Initiate a partnership with state chambers to survey businesses on
their immediate workforce training and business assistance needs. Potential Funding Source:
Distribution will be undertaken by business trade associations. Costs to state should be minor and
should result in more effectively connecting workers with jobs.
3. Increase Training Transparency: Call on the California Workforce Investment Board (CWIB) to set
minimum best practice standards for outreach to local workers and business on available
programs and training opportunities. The goal would be to have all local workforce investment

16
boards prominently displaying or directly linking to key training and service information on the
front page of their website within 45 days. Potential Funding Source: Minor and absorbable cost
to the state. Local workforce investment boards will be receiving a significant additional share of
Workforce Investment Act funding.
4. Establish Owner-Employee Training Accounts: Introduce legislation to authorize the
establishment of tax free life-long workforce training accounts that are supported by professional
career counseling. Expanding a workers' skill benefits the employer, the worker and the economy
at-large. These accounts would hold monies contributed by the worker and the employer.
Potential Funding Source: Minor and absorbable cost to the state. Pilots could be established by
local workforce investment boards who will be receiving a significant additional share of
Workforce Investment Act funding.
5. Expand Green Training Opportunities: Introduce legislation to appropriate supplemental federal
funds to Community Colleges for green training opportunities. Priorities for training would be set
by local Community College District Boards, in cooperation with the local workforce investment
boards and analysis of regionally significant or emerging green economy or cleantech clusters.
Potential Funding Source: California's share of workforce training funding in the federal stimulus
package is anticipated to be $494 million. Some of these monies will be available for discretionary
use by the state and local workforce partners.
6. Learn By Building: Introduce legislation to integrate training components into large and small-
scale infrastructure projects where they do not currently exist. Working in partnership with the
building and construction trades certificate apprentice programs, Community Colleges, and other
training resources, offer certificate and/or apprenticeship opportunities as part of the project.
Potential Funding Source: Supplemental federal funding, state infrastructure bond money, the
Public Transportation Modernization, Improvement and Service Enhancement Account, the Local
Streets and Road Improvement Account among others. This would be an appropriate use of a
portion of California's share of those funds.
7. Fix the Unemployment Insurance Fund: Call on the Governor and the Legislature to expedite
discussions on how to resolve the projected shortfall of the California's Unemployment Fund (UI
Fund). The UI Fund is projected to have a negative balance of $2.4 billion by the end
of this year and a negative balance of $4.9 billion by the end of 2010. While the current
economic crisis and rising unemployment have contributed to this problem, the underlying
mechanism for funding the Fund is broken and needs to be changed to bring long-term solvency
to the Fund. California employers pay taxes only on the first $7,000 of each employee's wages -
a figure that is the minimum allowed by federal law and that has not been increased since 1983.
In addition, California employers are taxed at a maximum tax rate of 5.4% - again, the lowest
maximum allowed by federal law. California can borrow from the federal government in the
short-term, but a long-term solution to address the Fund's solvency will require adjusting these
two funding mechanisms. Potential Funding Source: The federal stimulus package includes
increased funding for state unemployment insurance programs, including $7 billion for states that
modernize their programs. If California wants to draw down its share of this funding ($844
million) it only needs to make one change to the current system - utilizing an "alternative base
period" that looks at more recent worker earnings in determining benefits. Pending state
17
legislation (AB 3X 23) makes this change to state law and allows California to draw down this
federal money.
8. Target Individual Business Needs: Introduce legislation that requires a minimum portion of
supplemental monies be appropriated to community college training activities be used to training
models that allow prospective businesses to identify the types of job skills that employers need.
Establish clean and measurable objectives for new monies and include "claw back" provisions for
instances where state objectives are not met. Potential Funding Source: No additional fiscal
impact.
Undertake Midterm Actions in the Next Six-to-12 Months 9. Connect Workforce Development with Public Education System: Call on the California Post
Secondary Education Commission and the CWIB to establish an initiative to improve the local
workforce development systems' coordination and collaboration with the state's education
systems, including K-12 through community colleges, state colleges, University of California
institutions, vocational education programs, and apprenticeships. These activities will provide the
higher education connection between the K-14 efforts under the Career-Technical Education
Economic Development Initiative. This new initiative should focus on establishing new and
stronger relationships for improving coordination, resource sharing, and common strategic
planning. Potential Funding Source: California's share of workforce training funding in the federal
stimulus package is anticipated to be $494 million. Some of these monies will be available for
discretionary use by the state and local workforce partners.
Measurements for Success
In the course of public discussion, and through collaboration with our public and private community
development partners, this goal, its proposed objectives, and specific recommended actions will be
reviewed and adapted to ensure accountability and transparency that the desired outcomes have
been achieved.
Goal 4 – Enhance Local and Regional Community Development Capacity
As stated previously, the success of the CA Economic Recovery Strategy will be evaluated on whether
lives of individual Californians have improved. Local and regional public and private entities play an
essential part in the strategy's success because they are in the best position to ensure that programs
and services are properly delivered and to make recommendations on how to modify initiatives in
order to have them be more effective. However, for these local and regional actors to fully embrace
this role they will need help in enhancing their capacity to undertake community development
activities.
Objectives
• To support local and regional comprehensive planning efforts; and
• To bring state and federal financial resources to local communities.
Immediate Actions to be taken in the Next Six Months
18
1. Reestablish Circuit Rider Technical Assistance Program: Introduce legislation to earmark a portion
of the state's Community Development Block Grant (CDBG) funding for re-establishing the
technical assistance circuit rider program. Local communities need hands-on assistance to
maximize their ability to draw down federal dollars and leverage private investments. Potential
Funding Source: The House version of the economic stimulus package includes $1 billion in
supplemental CDBG funding. This would be an appropriate use of a portion of California's share
of those funds.
2. Initiate California Media Campaign: Call on the Business, Transportation, and Housing Agency
(BT&H) to facilitate the establishment of a national and statewide media campaign touting
positive stories and initiatives. Include Team California, Chambers of Commerce, and local
economic development organizations. Potential Funding Source: Consolidate individual state
agency media budgets for one fiscal year in order to fund the state's portion of a collaborative
effort between business and trade organizations, tourism, local governments, and the state.
3. Authorize New Local Funding: Introduce legislation to allow local governments to place a modest
sales tax increase of 1/8 of a cent on a local ballot to fund local economic development activities.
Similar authority is currently authorized for libraries. Communities would need to pass a sales tax
increase with a 2/3 vote as already required by law. Potential Funding Source: No funding need
as this is a discretionary act by a local government.
4. Establish Neighborhood Investment Credit: Introduce legislation to provide a 20% tax credit to
individual taxpayers for investing in a private equity fund managed by a community development
financial development corporation (CDFI). Require the credit to be used after 2011. Cap the total
value of the credit to limit state's fiscal exposure. Potential Funding Cost and Source: No
immediate impact of state revenues, credit would be used after the CDFI would have invested the
money into the local economy.
Undertake Midterm Actions in the Next Six-to-12 Months 5. Train Locals on Combining ED Resources: Call on BT&H to facilitate regional training
opportunities for local governments and community development organizations on how to
effectively combine resources to provide comprehensive local economic and community
development programs. Trainings should address, among other issues, how to use geographically
targeted economic development programs, such as enterprise zones, to locally facilitate business
retention and growth. Potential Funding Source: The federal economic stimulus package
authorizes $1 billion for CDBG. Some of these monies could be available for this purpose.
6. Support Regional Green Innovation Models: Call on The Governor's Office of Planning and
Research and the Assistant Secretary for Economic Development to provide technical assistance to
local governments on updating local development strategies to place green innovation at their
core. Innovation-based strategies focus on strengthening inventor-financier business networks
and increasing the ability of communities to uptake new business models and technologies that
help businesses be competitive in global markets. Potential Funding Source: The federal
economic stimulus package authorizes $1 billion for CDBG. Some of these monies could be
available for this purpose.
19
Measurements for Success
In the course of public discussion, and through collaboration with our public and private community
development partners, this goal, its proposed objectives, and specific recommended actions will be
reviewed and adapted to ensure accountability and transparency that the desired outcomes have
been achieved.
Goal 5 – Ensure that the State's Strategy is a Plan for all Californians
In a state as large and diverse as California, it is important to monitor the use of programs and
services. Without a conscientious effort to ensure an equitable distribution of programs and services,
some areas of the state and groups of people can be overlooked, often resulting in a deepening of
the problem that the program was supposed to address. The objectives and actions recommended
under Goal 5 are key to the long-term economic recovery and success of the state.
Objectives
• To have a final Strategy that reflects the broad array of interests of the people of California;
• To deliver worker-centered services in an environment that respects the rights, dignity, and
privacy of those who seek help;
• To use traditional and innovative means for providing technical assistance and outreach in all areas
of the state including rural and inner city areas; and
• To design and implement an efficient system for tracking the implementation of the strategy that
allows for the identification and response to impediments to its successful outcome.
Immediate Actions to be taken in the Next Six Months
1. Establish Oversight and Accountability Board: Call on the Governor to immediately establish the
CA Economic Recovery Board, as described above, to oversee the implementation of the federal
stimulus dollars, as well as related monies authored or to be authorized in the federal and state
budgets. One of the key activities of the Board could include, but is not limited to, creating and
maintaining a web-based tracking system so that the public can easily determine what monies are
available and when and where to apply. Potential Funding Cost and Source: Redirection of
existing and eligible federal funds from the Labor and Workforce Development Agency and
supplemental federal monies.
2. Finalize a State Economic Development Plan: Call on the California Economic Strategy Panel to
prepare the already mandated state Economic Development Strategic Plan by July 1, 2009, that
builds on the recommendations of the CA Economic Recovery Strategy. As required by existing
law, the state Economic Development Strategic Plan should identify proposals for legislation,
regulations, and administrative reforms necessary to improve the business climate and economy
of the state; an evaluation of the effectiveness of the state's economic development programs to
deal with the current economic crisis; and strategies to foster job growth and economic
development covering all state agencies, offices, boards, and commissions that have economic
development responsibilities. Potential Funding Cost and Source: Redirection of existing and

20
eligible federal funds from the Labor and Workforce Development Agency and supplemental
federal monies, including but not limited to block grant monies from the Economic Development
Administration and the Department of Housing and Urban Development.
3. Advocate for Greater Small Business Participation in Federal Contracts: Call on the Department of
Treasury and other federal agencies to maximize the use of small and emerging contractors in
implementing 2008 and 2009 federal stimulus programs. Potential Funding Source: No cost,
potential for bringing more money to California small businesses.
4. Identify Rural Economic and Workforce Development Liaison: Call on the Governor to name a
rural economic development specialist within the Business, Transportation, and Housing Agency
and a rural workforce development specialist within the Labor and Workforce Development
Agency. Potential Funding Source: Absorbable costs to agencies that already have a mandate to
serve all Californians. Rural areas are experiencing the highest levels of unemployment and need
existing staff to develop and target actions appropriate to rural areas.
5. Expand Outreach to Veterans and Families of Members of the Armed Services: Introduce
legislation to establish a targeted workforce training assessment and referral program for veterans
through the Department of Veterans Affairs in consultation with the California Workforce
Investment Board and the Employment Training Panel. Special attention should be paid to
idenitifing and enhancing skills that service men and woman acquired while serving in the military
and converting those skills for civilian work. Potential Funding Source: The federal stimulus
package includes $494 million in supplemental workforce training monies. This would be an
appropriate use for some of these monies.
6. Enforce Small Business and Disabled Veteran-Owned Business Enterprises (DVBE) Participation in
Infrastructure: Aggressively enforce emerging contractor and DVBE policies in awarding
infrastructure contracts. Potential Funding Source: Use eligible portions of bond monies to fully
fund these existing laws and policies.
Undertake Midterm Actions in the Next Six-to-12 Months 7. Share Green Training Opportunities: Introduce legislation to ensure that supplemental federal
workforce training funds are equitably distributed throughout the state. Mechanisms should be
included within contracts to ensure this goal is met, including claw-back provisions for those who
fail to meet the requirements. Outreach and technical assistance should also be included as a
minimum component of any training program. Potential Funding Source: California's share of
workforce training funding in the House economic stimulus bill is anticipated to be $141 million for
dislocated workers and $73 million for training under the Workforce Investment Act.
Actions to be undertaken in the next 12-to-24 Months
8. Provide a Formal Voice for Rural California: Introduce legislation to reestablish a Rural Policy Task
Force for the purpose of providing a voice for the unique issues and concerns of rural
communities. Ensure that the broad range of rural stakeholders has an opportunity to become
engaged. Potential Funding Source: Federal rural development monies. In the past, USDA Rural
Development funded this activity.
21
Measurements for Success
In the course of public discussion, and through collaboration with our public and private community
development partners, this goal, its proposed objectives, and specific recommended actions will be
reviewed and adapted to ensure accountability and transparency that the desired outcomes have
been achieved.
Finalizing the Recovery Strategy
The CA Economic Recovery Strategy is being developed to assist Members of the Assembly and the
public in having a meaningful dialogue about how to best leverage new federal funding and other
federal and state resources for local community needs. Through these actions, the Strategy also
moves the local communities toward a more economically vital and sustainable future.
The Strategy includes a set of specific actions designed to be undertaken over the next 24 months. It
does not propose new programs, except in cases where gaps can cost effectively be addressed. The
Strategy places the state in the position of facilitator and "dot connector." Implementation of
individual programs and the overall strategy is contingent upon the ability of the state to bring
forward a heightened level of collaboration between federal, state, and local governments.
The initial draft of the CA Economic Recovery Strategy was developed based on economic stimulus
recommendations submitted to the Obama Transition Team by over a dozen important community
development organizations including the California Association for Local Economic Development. The
JEDE Committee also engaged other stakeholders and reviewed key reports published by reputable
economic development entities, such as the California Economic Strategy Panel, the California
Economic Development Commission, and the Business, Transportation, and Housing Agency.
Engaging Additional Stakeholders
As an initial draft, this Strategy will require further review and development by many more
stakeholders. It will need to be widely distributed through traditional and innovative means including
sharing with the public, governmental institutions, private nonprofit groups, associations, businesses,
labor organizations, interactive websites, community roundtables meetings, and legislative hearings.
There are a number of important areas that need to be addressed during this next round of
engagements including, but not limited to:
• Oversight: What is the best structure for the state to provide oversight for the allocation and use
of federal stimulus dollars, as well as implementation of the Strategy?
• Scope: Does the Strategy address the key economic and workforce challenges facing the state?
• Responsibility: Are responsible parties sufficiently clear as to assure proper accountability?
• Measurement: Can the measurements be reasonably monitored?
• Connectivity: Has the Strategy properly linked all existing resources in order to reduce
duplication and gain economies of scale?
22
• Impediments: Are their federal or state programmatic impediments to accessing federal
stimulus funding? These issues can be tracked in Appendix C.
• Networks: Are key community development partners identified and engaged in this effort?
The Schedule of Public Engagement
The Strategy is hosted on the California State Assembly website where interested parties will be able
to review the document. In the future, the public may even be able to submit recommendations on
how to best leverage federal dollars for local community development needs. Ultimately, the website
will also allow people to find out about events that are being scheduled in their own town so that they
can join others in discussing strategies that address their local challenges.
This document has been specially prepared to facilitate public comment. Not only does it have a list
of specific recommendations to undertake in the next 24 months, the Strategy also provides a basic
review of the state economy and descriptions of the public and private resources that are available, or
could be made available, to help communities address the impacts of the current economic crisis.
The very final appendix includes a glossary of terms to assist readers in the alphabet soup of
government funding.
Prior to its official publication, this Strategy was shared with the Governor's Office and the leadership
in the Assembly from the Democratic and Republican parties. At its foundation, economic
development is not a partisan issue, nor is it an issue that should divide urban, suburban, and rural
communities. Job creation is a social policy that everyone can support. While the specific
recommendations in the Strategy currently reflect the analytical work of the Assembly Committee on
Jobs, Economic Development, and the Economy, every effort has been made and will continue to be
made to put forward a united and sustainable community development vision for the people of
California.
On February 19, 2009, the Strategy was presented at the State Economic Stimulus Summit hosted by
Caled. Caled is the statewide association for local economic development professionals from the
public and private sectors. At the Summit, there was an opportunity for broad discussion among
local, state, and federal stakeholders.
During March and April, economic development roundtables are being planned by Assemblymembers
in different areas of the state. One purpose of these roundtables and other local events is to help the
state fully leverage all available federal stimulus dollars, remove barriers to good community
development practices, and generally learn how it can best support local economic development
activities.
Economic, business, and workforce development organizations are also being encouraged to post the
Strategy, host their own events, and expand the network of engaged community development
professionals on this important topic.
A legislative hearing is planned for March 17, 2009, which will include an in-depth discussion of the
federal stimulus package and case studies on how some communities and regions are already
preparing for new federal stimulus dollars. Some legislative recommendations were also prepared for
23
introduction in order to meet the February 27, 2009, deadline for introducing bills. Changes will be
made in these bills as they move through the legislative process to reflect new information and
economic conditions. A follow-up legislative hearing is scheduled for early May to receive information
from the public outreach. A final Strategy is expected by mid May.
The development of this Strategy must be a collaborative effort. The Assembly JEDE Committee has
put this Strategy forward to begin an intensive dialogue between the Administration, the public, and
the federal government on how best to serve the people of California. The strength of this Strategy
should be judged by its ability to engage a broad spectrum of Californians, enhance the conditions
whereby jobs can be retained in local communities, and to facilitate a renewed vision for California's
future.
24
Part II – Background on Recommended Actions
As Assemblymembers and the public begin to consider a list of actions to best leverage federal
dollars, it may be useful to have basic background information on the state economy, key state and
federal programs, and private sector partners available to join the state in addressing the economic
challenges of the day. In addition to the information contained in Sections 2 through 5, the
document includes extensive hyperlinks and appendices on economic, workforce, and community
development programs and services.
Section 2. The California Economy
This section provides an overview of the California economy. Areas addressed in this section include
core elements of the state and regional economies, the role that small businesses play within our
economy, and challenges that California faced prior to this current economic crisis. While additional
federal monies will be helpful, California still must address how to bring forth an educated workforce,
effective ways to compete with other states for new and expanding businesses, and how to create
the infrastructure necessary to support innovative and emerging technologies.
In preparing this document, the most current data available have been used. However, ongoing
changes in the national and global economy have materially affected the state's economy in ways
that have not yet been captured in traditional data collection methods.
Overview of the California Economy
California is the one of the largest and most diversified economies in the world with a state gross
domestic product (GDP) of over $1.8 trillion in 2007. For comparison, global GDP was $53.3 trillion,
with the U.S. ($13.8 trillion) having the highest GDP of any individual nation, followed by Japan ($4.3
trillion), Germany ($3.3 trillion), China ($3.2 trillion), the United Kingdom ($2.7 trillion), France ($2.5
trillion), Italy ($2.1 trillion), Spain ($1.4 trillion), Canada ($1.3 trillion), and Brazil ($1.3 trillion).
Based on these figures from the International Monetary Fund, if California were an independent
nation it would rank as the eighth largest economy in the world.
The state's significance in the global marketplace results from a variety of factors, including: its
strategic west coast location that provides direct access to the growing markets in Asia; its
economically diverse regional economies; its large, ethnically diverse population, representing both a
ready workforce and significant consumer base; its access to a wide variety of venture and other
private capital; its broad base of small- and medium-sized businesses; and its culture of innovation
and entrepreneurship, particularly in the area of high technology.
As the largest state in the U.S., California is home to 12.1% of the nation's population and 11.6% of
all jobs. Overall job growth in the state from 2001 to 2006 was 6.1%. Growth in California GSP
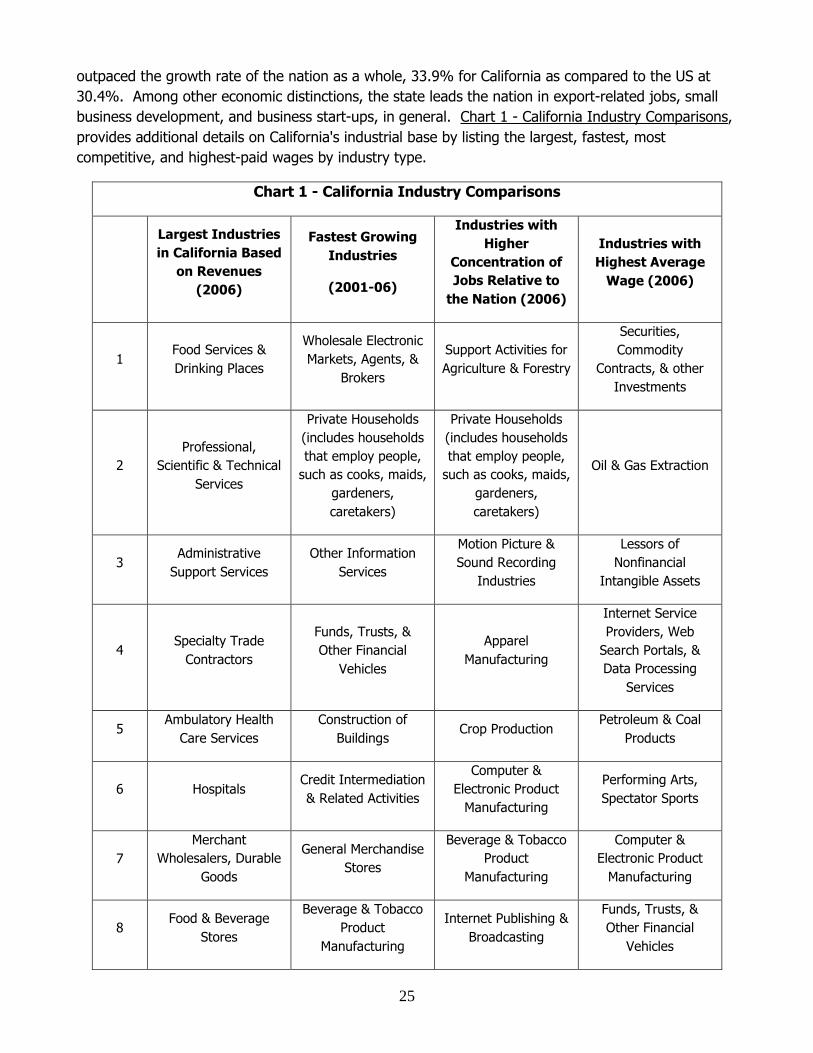
25
outpaced the growth rate of the nation as a whole, 33.9% for California as compared to the US at
30.4%. Among other economic distinctions, the state leads the nation in export-related jobs, small
business development, and business start-ups, in general. Chart 1 - California Industry Comparisons,
provides additional details on California's industrial base by listing the largest, fastest, most
competitive, and highest-paid wages by industry type.
Chart 1 - California Industry Comparisons
Largest Industries
in California Based
on Revenues
(2006)
Fastest Growing
Industries
(2001-06)
Industries with
Higher
Concentration of
Jobs Relative to
the Nation (2006)
Industries with
Highest Average
Wage (2006)
1 Food Services &
Drinking Places
Wholesale Electronic
Markets, Agents, &
Brokers
Support Activities for
Agriculture & Forestry
Securities,
Commodity
Contracts, & other
Investments
2
Professional,
Scientific & Technical
Services
Private Households
(includes households
that employ people,
such as cooks, maids,
gardeners,
caretakers)
Private Households
(includes households
that employ people,
such as cooks, maids,
gardeners,
caretakers)
Oil & Gas Extraction
3 Administrative
Support Services
Other Information
Services
Motion Picture &
Sound Recording
Industries
Lessors of
Nonfinancial
Intangible Assets
4 Specialty Trade
Contractors
Funds, Trusts, &
Other Financial
Vehicles
Apparel
Manufacturing
Internet Service
Providers, Web
Search Portals, &
Data Processing
Services
5 Ambulatory Health
Care Services
Construction of
Buildings Crop Production
Petroleum & Coal
Products
6 Hospitals Credit Intermediation
& Related Activities
Computer &
Electronic Product
Manufacturing
Performing Arts,
Spectator Sports
7
Merchant
Wholesalers, Durable
Goods
General Merchandise
Stores
Beverage & Tobacco
Product
Manufacturing
Computer &
Electronic Product
Manufacturing
8 Food & Beverage
Stores
Beverage & Tobacco
Product
Manufacturing
Internet Publishing &
Broadcasting
Funds, Trusts, &
Other Financial
Vehicles
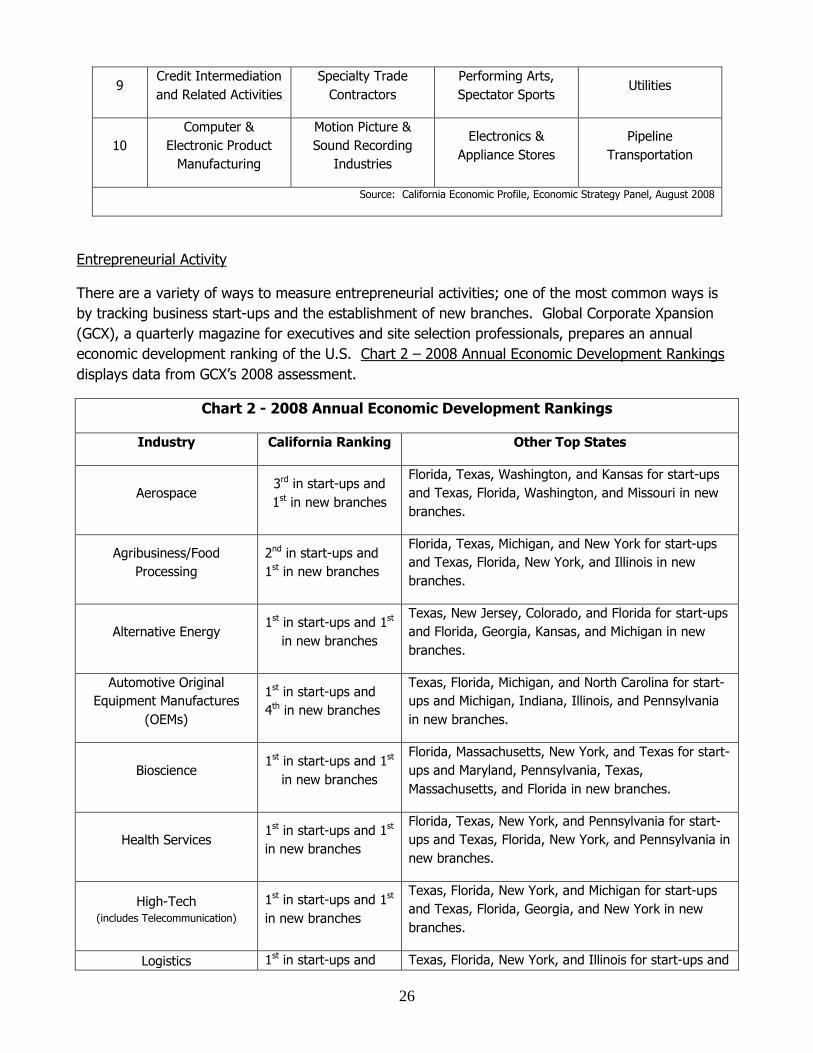
26
9 Credit Intermediation
and Related Activities
Specialty Trade
Contractors
Performing Arts,
Spectator Sports Utilities
10
Computer &
Electronic Product
Manufacturing
Motion Picture &
Sound Recording
Industries
Electronics &
Appliance Stores
Pipeline
Transportation
Source: California Economic Profile, Economic Strategy Panel, August 2008
Entrepreneurial Activity
There are a variety of ways to measure entrepreneurial activities; one of the most common ways is
by tracking business start-ups and the establishment of new branches. Global Corporate Xpansion
(GCX), a quarterly magazine for executives and site selection professionals, prepares an annual
economic development ranking of the U.S. Chart 2 – 2008 Annual Economic Development Rankings
displays data from GCX’s 2008 assessment.
Chart 2 - 2008 Annual Economic Development Rankings
Industry California Ranking Other Top States
Aerospace 3rd in start-ups and
1st in new branches
Florida, Texas, Washington, and Kansas for start-ups
and Texas, Florida, Washington, and Missouri in new
branches.
Agribusiness/Food
Processing
2nd in start-ups and
1st in new branches
Florida, Texas, Michigan, and New York for start-ups
and Texas, Florida, New York, and Illinois in new
branches.
Alternative Energy 1st in start-ups and 1st
in new branches
Texas, New Jersey, Colorado, and Florida for start-ups
and Florida, Georgia, Kansas, and Michigan in new
branches.
Automotive Original
Equipment Manufactures
(OEMs)
1st in start-ups and
4th in new branches
Texas, Florida, Michigan, and North Carolina for start-
ups and Michigan, Indiana, Illinois, and Pennsylvania
in new branches.
Bioscience 1st in start-ups and 1st
in new branches
Florida, Massachusetts, New York, and Texas for start-
ups and Maryland, Pennsylvania, Texas,
Massachusetts, and Florida in new branches.
Health Services 1st in start-ups and 1st
in new branches
Florida, Texas, New York, and Pennsylvania for start-
ups and Texas, Florida, New York, and Pennsylvania in
new branches.
High-Tech (includes Telecommunication)
1st in start-ups and 1st
in new branches
Texas, Florida, New York, and Michigan for start-ups
and Texas, Florida, Georgia, and New York in new
branches.
Logistics 1st in start-ups and Texas, Florida, New York, and Illinois for start-ups and

27
(includes Transportation) 2nd in new branches Texas, Florida, Illinois, and New York in new branches.
Manufacturing 1st in start-ups and 1st
in new branches
Texas, Florida, New York, and Michigan for start-ups
and Texas, Florida, New York, and Ohio in new
branches.
Medical Device
Manufacturing
1st in start-ups and 1st
in new branches
Florida, Texas, New York, and Michigan for start-ups
and Texas, Pennsylvania, Florida, New Jersey and
Illinois in new branches.
Pharmaceuticals 1st in start-ups and
2nd in new branches
Florida, Texas, New Jersey, and Pennsylvania for start-
ups and New Jersey, Pennsylvania, Texas, and Illinois
in new branches.
Source: Global Corporate Xpansion, 2008
As Chart 1 and Chart 2 illustrate, the state's economy is not dominated by a single industry, rather it
is comprised of a variety of industries throughout the state. In the following subsection, economic
and business development data are provided at the regional level including information on the most
dominant industries, biggest job growth, and related employment data.
California's Regional Economies
California is not only one of the largest economies in the world, but it is also one of the most
economically diverse. The state's economy is comprised of a variety of industry clusters. While many
of these clusters are linked through extended economic value chains across the state, in general,
industry clusters operate within their own regional micro-economies.
To gain a better understanding of the state's multifaceted economy, the California Economic Strategy
Panel (ESP), working in collaboration with the Employment Development Department, established the
California Regional Economies Project (Regional Economies Project) in 2003. As a first step, the
Regional Economies Project undertook an
analysis to determine the state's primary
economic regions and related trends in
workforce and business development.
From this analysis, ESP prepared regional
economic profiles, which have become a basic
building block for many groups undertaking
their own community development activities.
As an example, the California Partnership for
the San Joaquin Valley, a group established by
the Governor's executive order in 2005, used
its regional profile as a foundation for the
development of its economic and community development action plan. Policymakers also use these
profiles for developing and analyzing legislation, initiatives, and other community development
activities.
REGIONAL JOB GROWTH RANKING (2001-06) 1. San Joaquin Valley Region 9.9% 2. Greater Sacramento Region 9.4% 3. Southern Border Region 7.7% 4. Southern California Region 6.5% 5. No. Sacramento Valley Region 6.4% California as-a-whole 6.1% 6. Central Sierra Region 5.9% 7. Central Coast Region 3.6% 8. Northern California Region 1.3% 9. Bay Area Region -5.8%
Source: Regional Economies Project

28
Later in this subsection is a listing of the state's nine economic regions with basic information from
the Regional Economies Project. Appendix B includes a map of the state's nine economic
development regions.
In addition to identifying the top industries per region, information is also displayed on the top five
growth industries based on the most detailed analysis available on industry classification. While
basing too much emphasis on the fastest growing industries can be misleading relative to the overall
regional economy, observing these trends can give insights into industry shifts. In turn, these
insights accompanied by other appropriate indicators can signal new and truly emerging industry
clusters.
The highest and lowest unemployment figures are also provided by region. Appendix K includes a
map indicating each counties individual unemployment rate. As a baseline for the unemployment
figures below, the state unemployment rate, not seasonally adjusted was 10.6% in January 2009 (up
from 6.4% a year prior).
Northern California Region
The Northern California region consists of 11 counties along the north coast, Oregon border, and
northeastern Sierra Nevada including Del Norte, Humboldt, Lake, Lassen, Mendocino, Modoc, Nevada,
Plumas, Sierra, Siskiyou, and Trinity. These counties are heavily dependent on natural resources,
with the majority of the land consisting of public and privately owned forest and grazing lands. The
region as a whole is sparsely populated and underdeveloped.
In 2006, the region accounted for 1.1% of all California jobs and 1.2% of its population. The region
ranked eight out of nine in job growth from 2001 to 2006, experiencing an increase in jobs of 1.3%.
Businesses with fewer than 50 employees comprised 98% of total employers and employed 68.5% of
workers in the region.
Top industries in the region include government (27%), retail trade (13%), and health care and social assistance (11%). The fastest growing industries in the Northern California Region include exam preparation & tutoring, postal service, residential siding contractors, professional employer organizations, and wine and distilled alcoholic beverage wholesalers. Additional information on the Northern California Region can be found at: http://www.labor.ca.gov/panel/pdf/2008_Northern_C
alifornia_Economic_Profile.pdf
NORTHERN CALIFORNIA REGIONAL BUSINESS SUMMARY
Job Growth (2001-2006) 1.3% Establishment Growth (2001-2006) 4.7% Average Wage (2006, Private Industry) $ 28,946 Wage Growth (2001-2006) 21.5% Firms with < 100 employees (2006) 99.4% Firms with < 50 employees (2006) 98.0% Self-employed, not incorporated (2006)* 15.9% Per Capita Income (2006) $ 30,466 Bachelor’s Degree or higher (2006) 16.6% to 29.1% Families Living in Poverty (2006)* 9.0% * Data available for four of the eleven counties; Humboldt, Lake, Mendocino and Nevada.
Source: Regional Economies Project
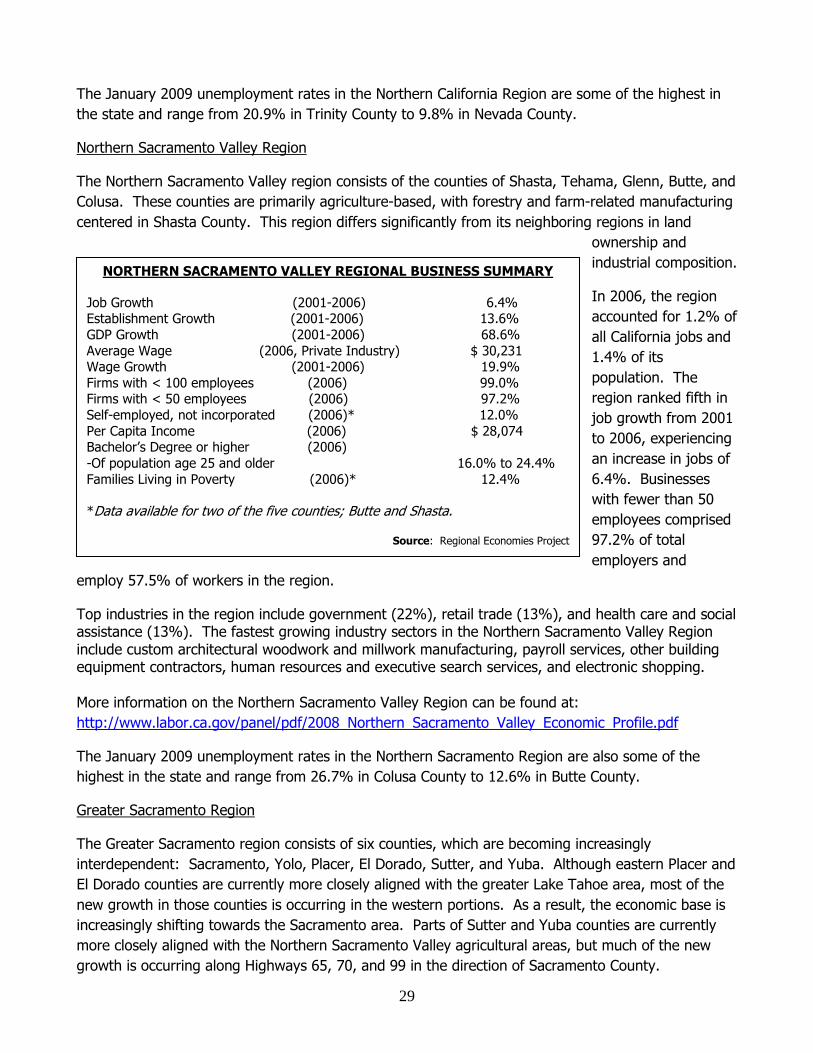
29
The January 2009 unemployment rates in the Northern California Region are some of the highest in
the state and range from 20.9% in Trinity County to 9.8% in Nevada County.
Northern Sacramento Valley Region
The Northern Sacramento Valley region consists of the counties of Shasta, Tehama, Glenn, Butte, and
Colusa. These counties are primarily agriculture-based, with forestry and farm-related manufacturing
centered in Shasta County. This region differs significantly from its neighboring regions in land
ownership and
industrial composition.
In 2006, the region
accounted for 1.2% of
all California jobs and
1.4% of its
population. The
region ranked fifth in
job growth from 2001
to 2006, experiencing
an increase in jobs of
6.4%. Businesses
with fewer than 50
employees comprised
97.2% of total
employers and
employ 57.5% of workers in the region.
Top industries in the region include government (22%), retail trade (13%), and health care and social assistance (13%). The fastest growing industry sectors in the Northern Sacramento Valley Region include custom architectural woodwork and millwork manufacturing, payroll services, other building equipment contractors, human resources and executive search services, and electronic shopping. More information on the Northern Sacramento Valley Region can be found at:
http://www.labor.ca.gov/panel/pdf/2008_Northern_Sacramento_Valley_Economic_Profile.pdf
The January 2009 unemployment rates in the Northern Sacramento Region are also some of the
highest in the state and range from 26.7% in Colusa County to 12.6% in Butte County.
Greater Sacramento Region
The Greater Sacramento region consists of six counties, which are becoming increasingly
interdependent: Sacramento, Yolo, Placer, El Dorado, Sutter, and Yuba. Although eastern Placer and
El Dorado counties are currently more closely aligned with the greater Lake Tahoe area, most of the
new growth in those counties is occurring in the western portions. As a result, the economic base is
increasingly shifting towards the Sacramento area. Parts of Sutter and Yuba counties are currently
more closely aligned with the Northern Sacramento Valley agricultural areas, but much of the new
growth is occurring along Highways 65, 70, and 99 in the direction of Sacramento County.
NORTHERN SACRAMENTO VALLEY REGIONAL BUSINESS SUMMARY Job Growth (2001-2006) 6.4% Establishment Growth (2001-2006) 13.6% GDP Growth (2001-2006) 68.6% Average Wage (2006, Private Industry) $ 30,231 Wage Growth (2001-2006) 19.9% Firms with < 100 employees (2006) 99.0% Firms with < 50 employees (2006) 97.2% Self-employed, not incorporated (2006)* 12.0% Per Capita Income (2006) $ 28,074 Bachelor’s Degree or higher (2006) -Of population age 25 and older 16.0% to 24.4% Families Living in Poverty (2006)* 12.4%
*Data available for two of the five counties; Butte and Shasta.
Source: Regional Economies Project
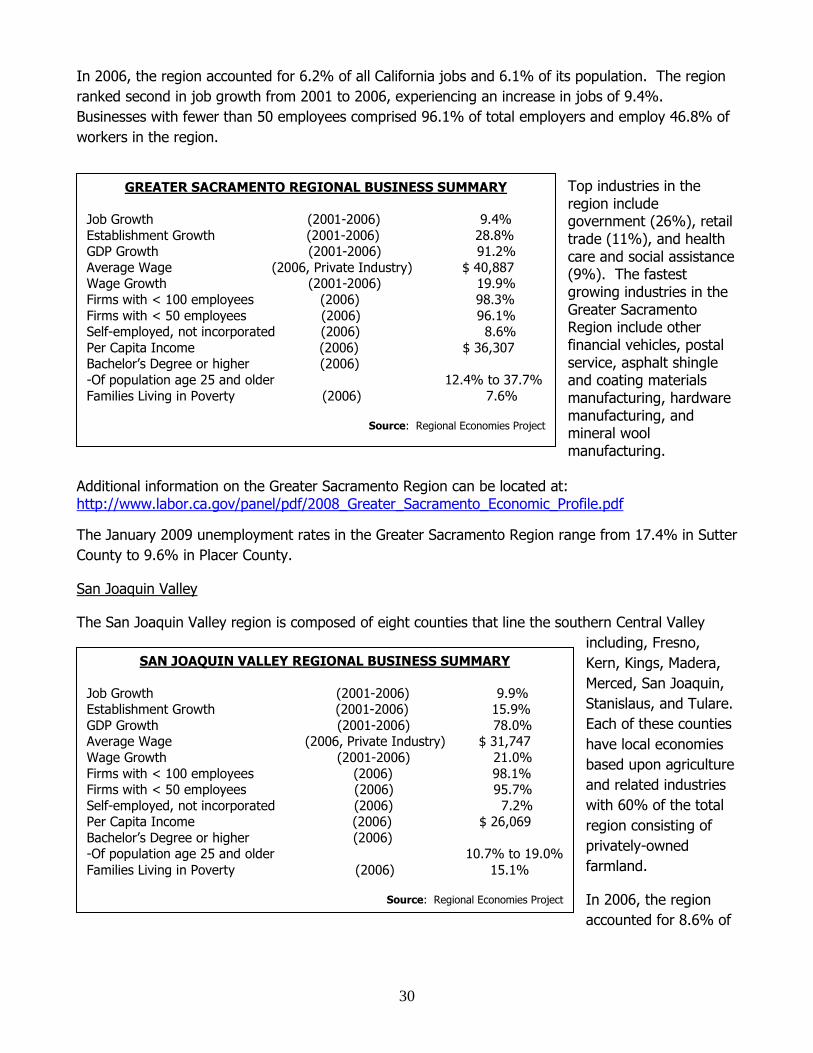
30
In 2006, the region accounted for 6.2% of all California jobs and 6.1% of its population. The region
ranked second in job growth from 2001 to 2006, experiencing an increase in jobs of 9.4%.
Businesses with fewer than 50 employees comprised 96.1% of total employers and employ 46.8% of
workers in the region.
Top industries in the region include government (26%), retail trade (11%), and health care and social assistance (9%). The fastest growing industries in the Greater Sacramento Region include other financial vehicles, postal service, asphalt shingle and coating materials manufacturing, hardware manufacturing, and mineral wool manufacturing.
Additional information on the Greater Sacramento Region can be located at: http://www.labor.ca.gov/panel/pdf/2008_Greater_Sacramento_Economic_Profile.pdf
The January 2009 unemployment rates in the Greater Sacramento Region range from 17.4% in Sutter
County to 9.6% in Placer County.
San Joaquin Valley
The San Joaquin Valley region is composed of eight counties that line the southern Central Valley
including, Fresno,
Kern, Kings, Madera,
Merced, San Joaquin,
Stanislaus, and Tulare.
Each of these counties
have local economies
based upon agriculture
and related industries
with 60% of the total
region consisting of
privately-owned
farmland.
In 2006, the region
accounted for 8.6% of
GREATER SACRAMENTO REGIONAL BUSINESS SUMMARY
Job Growth (2001-2006) 9.4% Establishment Growth (2001-2006) 28.8% GDP Growth (2001-2006) 91.2% Average Wage (2006, Private Industry) $ 40,887 Wage Growth (2001-2006) 19.9% Firms with < 100 employees (2006) 98.3% Firms with < 50 employees (2006) 96.1% Self-employed, not incorporated (2006) 8.6% Per Capita Income (2006) $ 36,307 Bachelor’s Degree or higher (2006) -Of population age 25 and older 12.4% to 37.7% Families Living in Poverty (2006) 7.6%
Source: Regional Economies Project
SAN JOAQUIN VALLEY REGIONAL BUSINESS SUMMARY
Job Growth (2001-2006) 9.9% Establishment Growth (2001-2006) 15.9% GDP Growth (2001-2006) 78.0% Average Wage (2006, Private Industry) $ 31,747 Wage Growth (2001-2006) 21.0% Firms with < 100 employees (2006) 98.1% Firms with < 50 employees (2006) 95.7% Self-employed, not incorporated (2006) 7.2% Per Capita Income (2006) $ 26,069 Bachelor’s Degree or higher (2006) -Of population age 25 and older 10.7% to 19.0% Families Living in Poverty (2006) 15.1%
Source: Regional Economies Project
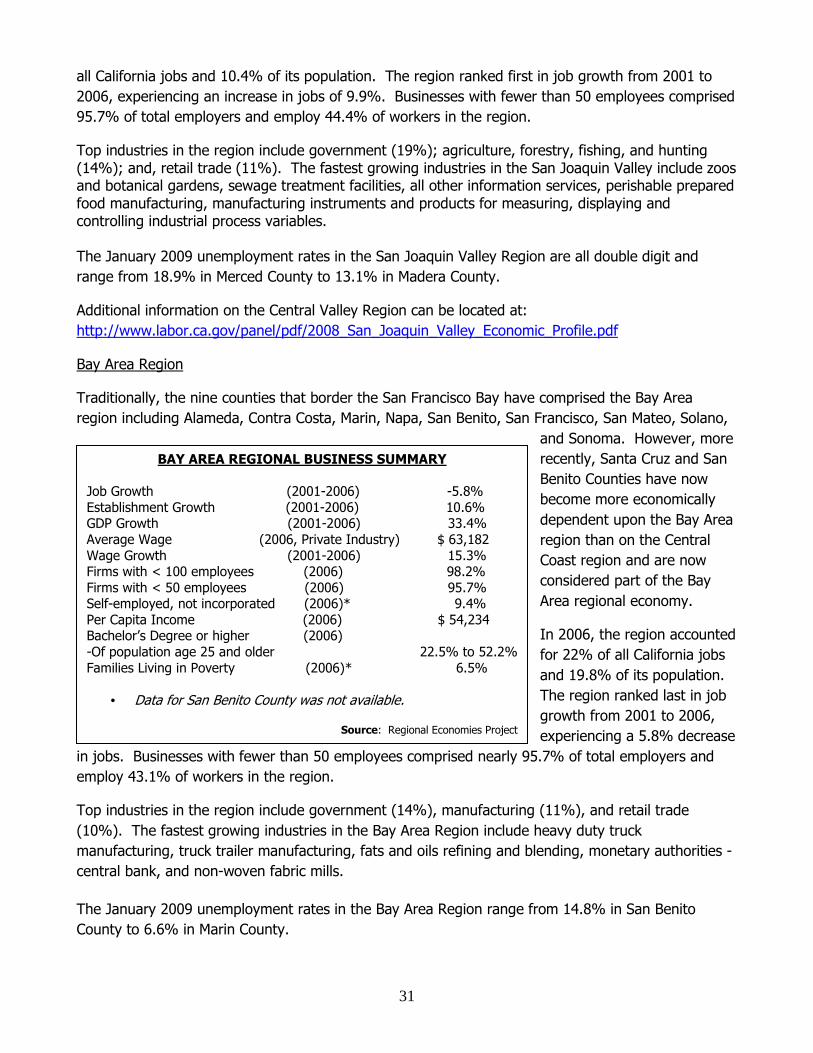
31
all California jobs and 10.4% of its population. The region ranked first in job growth from 2001 to
2006, experiencing an increase in jobs of 9.9%. Businesses with fewer than 50 employees comprised
95.7% of total employers and employ 44.4% of workers in the region.
Top industries in the region include government (19%); agriculture, forestry, fishing, and hunting (14%); and, retail trade (11%). The fastest growing industries in the San Joaquin Valley include zoos and botanical gardens, sewage treatment facilities, all other information services, perishable prepared food manufacturing, manufacturing instruments and products for measuring, displaying and controlling industrial process variables. The January 2009 unemployment rates in the San Joaquin Valley Region are all double digit and
range from 18.9% in Merced County to 13.1% in Madera County.
Additional information on the Central Valley Region can be located at:
http://www.labor.ca.gov/panel/pdf/2008_San_Joaquin_Valley_Economic_Profile.pdf
Bay Area Region
Traditionally, the nine counties that border the San Francisco Bay have comprised the Bay Area
region including Alameda, Contra Costa, Marin, Napa, San Benito, San Francisco, San Mateo, Solano,
and Sonoma. However, more
recently, Santa Cruz and San
Benito Counties have now
become more economically
dependent upon the Bay Area
region than on the Central
Coast region and are now
considered part of the Bay
Area regional economy.
In 2006, the region accounted
for 22% of all California jobs
and 19.8% of its population.
The region ranked last in job
growth from 2001 to 2006,
experiencing a 5.8% decrease
in jobs. Businesses with fewer than 50 employees comprised nearly 95.7% of total employers and
employ 43.1% of workers in the region.
Top industries in the region include government (14%), manufacturing (11%), and retail trade
(10%). The fastest growing industries in the Bay Area Region include heavy duty truck
manufacturing, truck trailer manufacturing, fats and oils refining and blending, monetary authorities -
central bank, and non-woven fabric mills.
The January 2009 unemployment rates in the Bay Area Region range from 14.8% in San Benito
County to 6.6% in Marin County.
BAY AREA REGIONAL BUSINESS SUMMARY Job Growth (2001-2006) -5.8% Establishment Growth (2001-2006) 10.6% GDP Growth (2001-2006) 33.4% Average Wage (2006, Private Industry) $ 63,182 Wage Growth (2001-2006) 15.3% Firms with < 100 employees (2006) 98.2% Firms with < 50 employees (2006) 95.7% Self-employed, not incorporated (2006)* 9.4% Per Capita Income (2006) $ 54,234 Bachelor’s Degree or higher (2006) -Of population age 25 and older 22.5% to 52.2% Families Living in Poverty (2006)* 6.5%
• Data for San Benito County was not available.
Source: Regional Economies Project
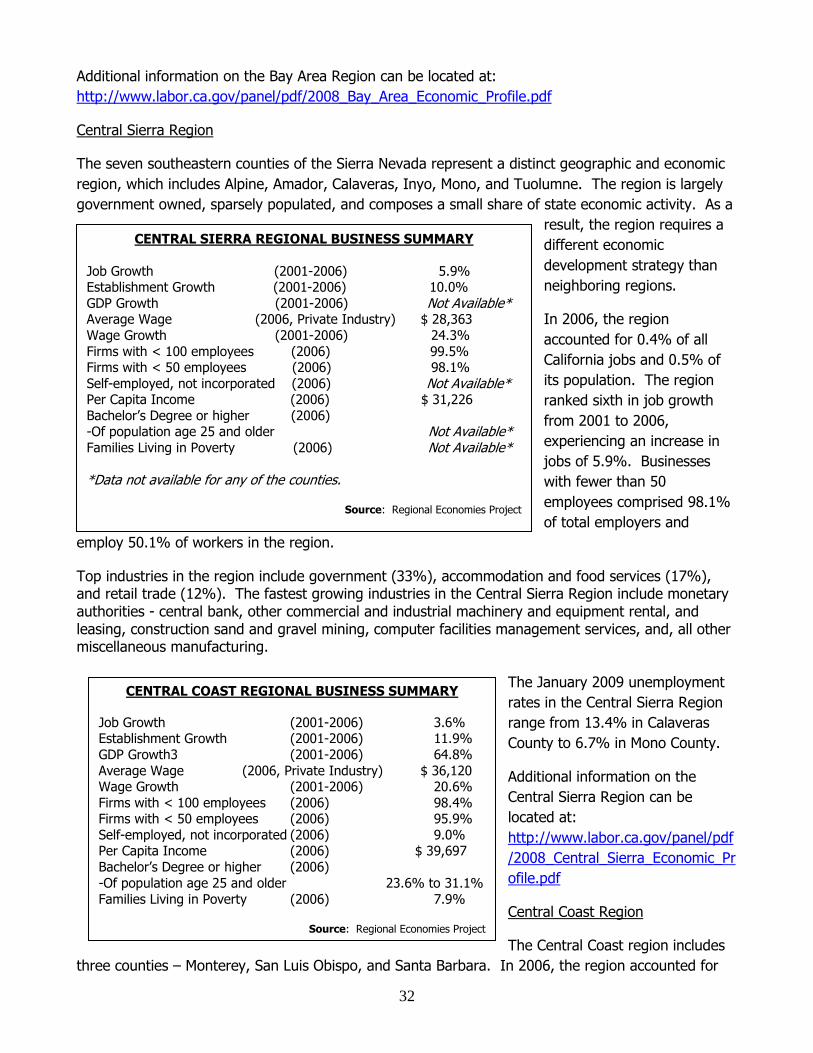
32
Additional information on the Bay Area Region can be located at:
http://www.labor.ca.gov/panel/pdf/2008_Bay_Area_Economic_Profile.pdf
Central Sierra Region
The seven southeastern counties of the Sierra Nevada represent a distinct geographic and economic
region, which includes Alpine, Amador, Calaveras, Inyo, Mono, and Tuolumne. The region is largely
government owned, sparsely populated, and composes a small share of state economic activity. As a
result, the region requires a
different economic
development strategy than
neighboring regions.
In 2006, the region
accounted for 0.4% of all
California jobs and 0.5% of
its population. The region
ranked sixth in job growth
from 2001 to 2006,
experiencing an increase in
jobs of 5.9%. Businesses
with fewer than 50
employees comprised 98.1%
of total employers and
employ 50.1% of workers in the region.
Top industries in the region include government (33%), accommodation and food services (17%), and retail trade (12%). The fastest growing industries in the Central Sierra Region include monetary authorities - central bank, other commercial and industrial machinery and equipment rental, and leasing, construction sand and gravel mining, computer facilities management services, and, all other miscellaneous manufacturing.
The January 2009 unemployment
rates in the Central Sierra Region
range from 13.4% in Calaveras
County to 6.7% in Mono County.
Additional information on the
Central Sierra Region can be
located at:
http://www.labor.ca.gov/panel/pdf
/2008_Central_Sierra_Economic_Pr
ofile.pdf
Central Coast Region
The Central Coast region includes
three counties – Monterey, San Luis Obispo, and Santa Barbara. In 2006, the region accounted for
CENTRAL SIERRA REGIONAL BUSINESS SUMMARY
Job Growth (2001-2006) 5.9% Establishment Growth (2001-2006) 10.0% GDP Growth (2001-2006) Not Available* Average Wage (2006, Private Industry) $ 28,363 Wage Growth (2001-2006) 24.3% Firms with < 100 employees (2006) 99.5% Firms with < 50 employees (2006) 98.1% Self-employed, not incorporated (2006) Not Available* Per Capita Income (2006) $ 31,226 Bachelor’s Degree or higher (2006) -Of population age 25 and older Not Available* Families Living in Poverty (2006) Not Available* *Data not available for any of the counties.
Source: Regional Economies Project
CENTRAL COAST REGIONAL BUSINESS SUMMARY Job Growth (2001-2006) 3.6% Establishment Growth (2001-2006) 11.9% GDP Growth3 (2001-2006) 64.8% Average Wage (2006, Private Industry) $ 36,120 Wage Growth (2001-2006) 20.6% Firms with < 100 employees (2006) 98.4% Firms with < 50 employees (2006) 95.9% Self-employed, not incorporated (2006) 9.0% Per Capita Income (2006) $ 39,697 Bachelor’s Degree or higher (2006) -Of population age 25 and older 23.6% to 31.1% Families Living in Poverty (2006) 7.9%
Source: Regional Economies Project
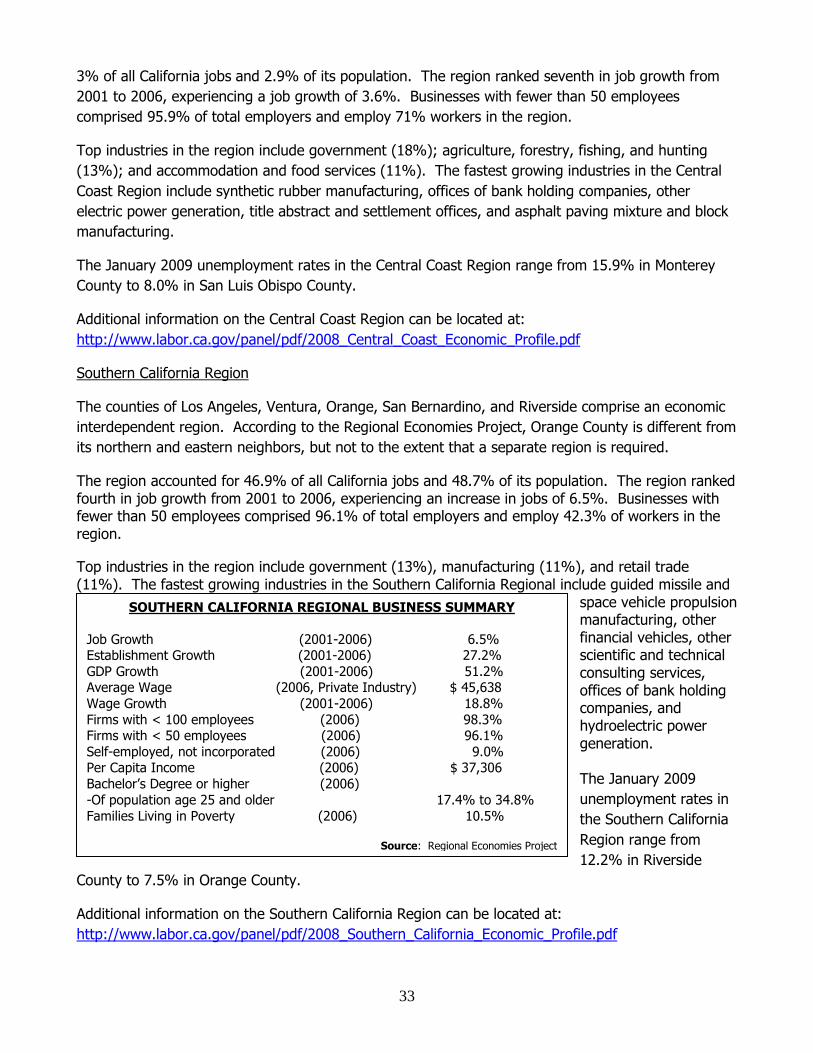
33
3% of all California jobs and 2.9% of its population. The region ranked seventh in job growth from
2001 to 2006, experiencing a job growth of 3.6%. Businesses with fewer than 50 employees
comprised 95.9% of total employers and employ 71% workers in the region.
Top industries in the region include government (18%); agriculture, forestry, fishing, and hunting
(13%); and accommodation and food services (11%). The fastest growing industries in the Central
Coast Region include synthetic rubber manufacturing, offices of bank holding companies, other
electric power generation, title abstract and settlement offices, and asphalt paving mixture and block
manufacturing.
The January 2009 unemployment rates in the Central Coast Region range from 15.9% in Monterey
County to 8.0% in San Luis Obispo County.
Additional information on the Central Coast Region can be located at:
http://www.labor.ca.gov/panel/pdf/2008_Central_Coast_Economic_Profile.pdf
Southern California Region
The counties of Los Angeles, Ventura, Orange, San Bernardino, and Riverside comprise an economic
interdependent region. According to the Regional Economies Project, Orange County is different from
its northern and eastern neighbors, but not to the extent that a separate region is required.
The region accounted for 46.9% of all California jobs and 48.7% of its population. The region ranked fourth in job growth from 2001 to 2006, experiencing an increase in jobs of 6.5%. Businesses with fewer than 50 employees comprised 96.1% of total employers and employ 42.3% of workers in the region. Top industries in the region include government (13%), manufacturing (11%), and retail trade (11%). The fastest growing industries in the Southern California Regional include guided missile and
space vehicle propulsion manufacturing, other financial vehicles, other scientific and technical consulting services, offices of bank holding companies, and hydroelectric power generation. The January 2009
unemployment rates in
the Southern California
Region range from
12.2% in Riverside
County to 7.5% in Orange County.
Additional information on the Southern California Region can be located at:
http://www.labor.ca.gov/panel/pdf/2008_Southern_California_Economic_Profile.pdf
SOUTHERN CALIFORNIA REGIONAL BUSINESS SUMMARY
Job Growth (2001-2006) 6.5% Establishment Growth (2001-2006) 27.2% GDP Growth (2001-2006) 51.2% Average Wage (2006, Private Industry) $ 45,638 Wage Growth (2001-2006) 18.8% Firms with < 100 employees (2006) 98.3% Firms with < 50 employees (2006) 96.1% Self-employed, not incorporated (2006) 9.0% Per Capita Income (2006) $ 37,306 Bachelor’s Degree or higher (2006) -Of population age 25 and older 17.4% to 34.8% Families Living in Poverty (2006) 10.5%
Source: Regional Economies Project
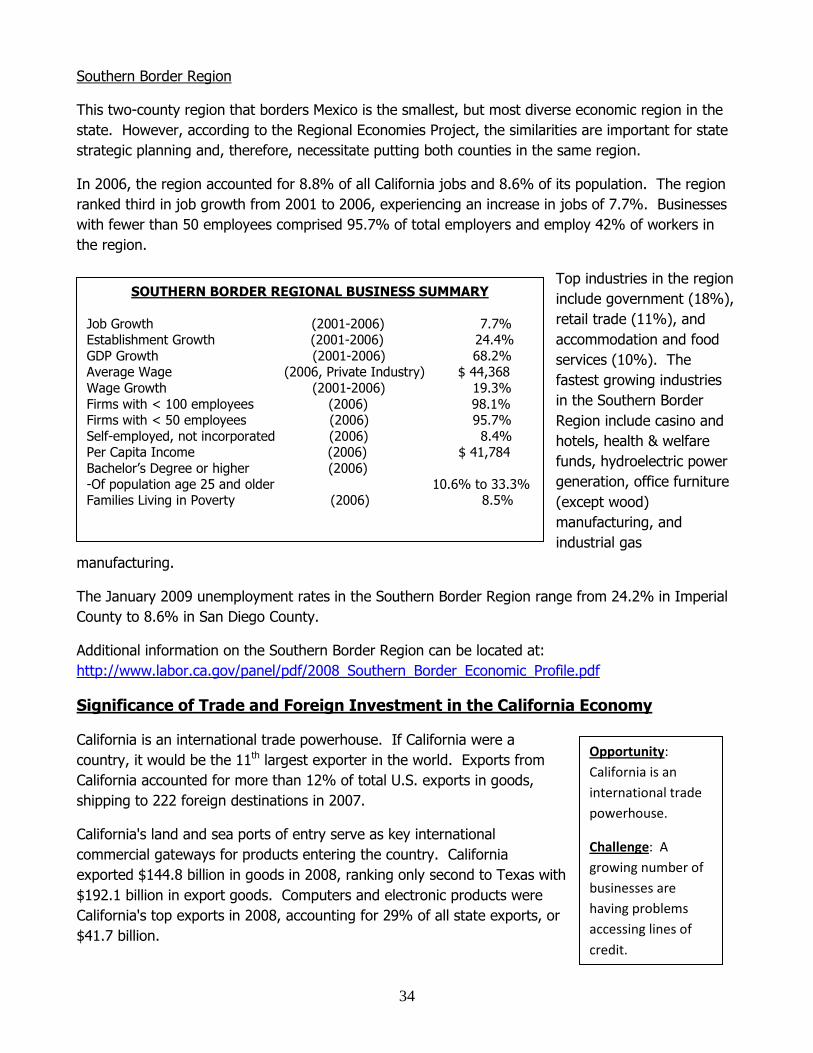
34
Southern Border Region
This two-county region that borders Mexico is the smallest, but most diverse economic region in the
state. However, according to the Regional Economies Project, the similarities are important for state
strategic planning and, therefore, necessitate putting both counties in the same region.
In 2006, the region accounted for 8.8% of all California jobs and 8.6% of its population. The region
ranked third in job growth from 2001 to 2006, experiencing an increase in jobs of 7.7%. Businesses
with fewer than 50 employees comprised 95.7% of total employers and employ 42% of workers in
the region.
Top industries in the region
include government (18%),
retail trade (11%), and
accommodation and food
services (10%). The
fastest growing industries
in the Southern Border
Region include casino and
hotels, health & welfare
funds, hydroelectric power
generation, office furniture
(except wood)
manufacturing, and
industrial gas
manufacturing.
The January 2009 unemployment rates in the Southern Border Region range from 24.2% in Imperial
County to 8.6% in San Diego County.
Additional information on the Southern Border Region can be located at:
http://www.labor.ca.gov/panel/pdf/2008_Southern_Border_Economic_Profile.pdf
Significance of Trade and Foreign Investment in the California Economy
California is an international trade powerhouse. If California were a
country, it would be the 11th largest exporter in the world. Exports from
California accounted for more than 12% of total U.S. exports in goods,
shipping to 222 foreign destinations in 2007.
California's land and sea ports of entry serve as key international
commercial gateways for products entering the country. California
exported $144.8 billion in goods in 2008, ranking only second to Texas with
$192.1 billion in export goods. Computers and electronic products were
California's top exports in 2008, accounting for 29% of all state exports, or
$41.7 billion.
SOUTHERN BORDER REGIONAL BUSINESS SUMMARY Job Growth (2001-2006) 7.7% Establishment Growth (2001-2006) 24.4% GDP Growth (2001-2006) 68.2% Average Wage (2006, Private Industry) $ 44,368 Wage Growth (2001-2006) 19.3% Firms with < 100 employees (2006) 98.1% Firms with < 50 employees (2006) 95.7% Self-employed, not incorporated (2006) 8.4% Per Capita Income (2006) $ 41,784 Bachelor’s Degree or higher (2006) -Of population age 25 and older 10.6% to 33.3% Families Living in Poverty (2006) 8.5%
Opportunity:
California is an
international trade
powerhouse.
Challenge: A
growing number of
businesses are
having problems
accessing lines of
credit.
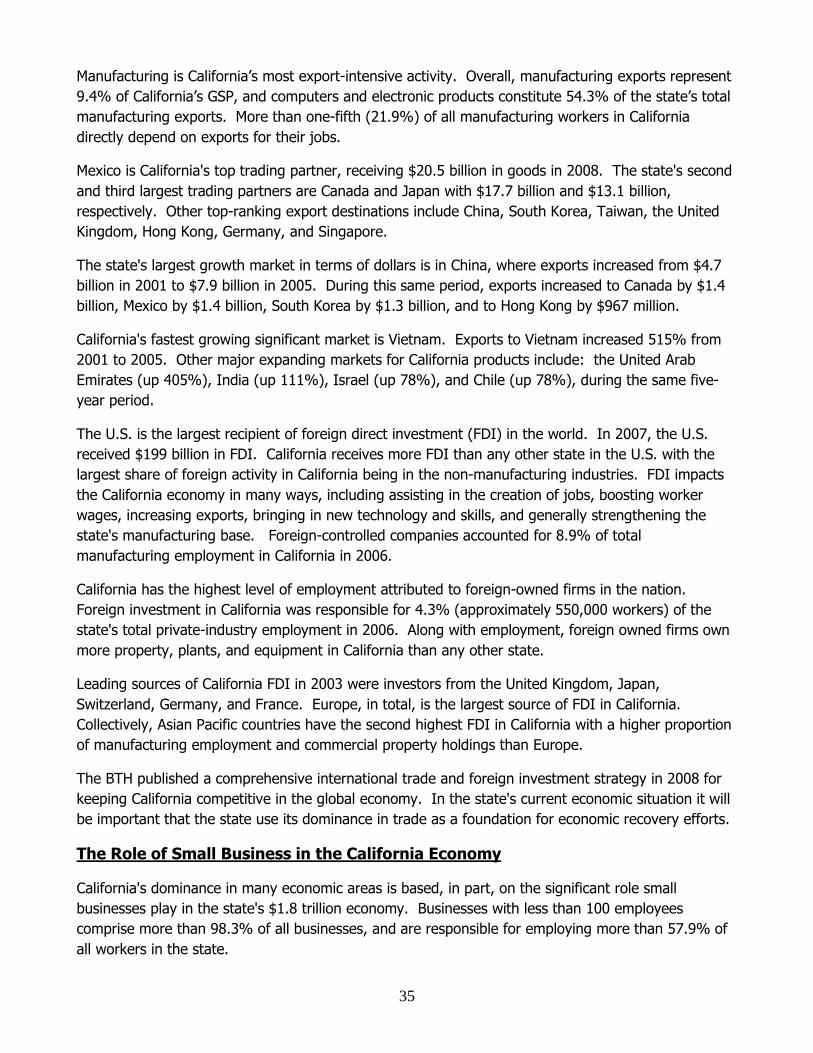
35
Manufacturing is California’s most export-intensive activity. Overall, manufacturing exports represent
9.4% of California’s GSP, and computers and electronic products constitute 54.3% of the state’s total
manufacturing exports. More than one-fifth (21.9%) of all manufacturing workers in California
directly depend on exports for their jobs.
Mexico is California's top trading partner, receiving $20.5 billion in goods in 2008. The state's second
and third largest trading partners are Canada and Japan with $17.7 billion and $13.1 billion,
respectively. Other top-ranking export destinations include China, South Korea, Taiwan, the United
Kingdom, Hong Kong, Germany, and Singapore.
The state's largest growth market in terms of dollars is in China, where exports increased from $4.7
billion in 2001 to $7.9 billion in 2005. During this same period, exports increased to Canada by $1.4
billion, Mexico by $1.4 billion, South Korea by $1.3 billion, and to Hong Kong by $967 million.
California's fastest growing significant market is Vietnam. Exports to Vietnam increased 515% from
2001 to 2005. Other major expanding markets for California products include: the United Arab
Emirates (up 405%), India (up 111%), Israel (up 78%), and Chile (up 78%), during the same five-
year period.
The U.S. is the largest recipient of foreign direct investment (FDI) in the world. In 2007, the U.S.
received $199 billion in FDI. California receives more FDI than any other state in the U.S. with the
largest share of foreign activity in California being in the non-manufacturing industries. FDI impacts
the California economy in many ways, including assisting in the creation of jobs, boosting worker
wages, increasing exports, bringing in new technology and skills, and generally strengthening the
state's manufacturing base. Foreign-controlled companies accounted for 8.9% of total
manufacturing employment in California in 2006.
California has the highest level of employment attributed to foreign-owned firms in the nation.
Foreign investment in California was responsible for 4.3% (approximately 550,000 workers) of the
state's total private-industry employment in 2006. Along with employment, foreign owned firms own
more property, plants, and equipment in California than any other state.
Leading sources of California FDI in 2003 were investors from the United Kingdom, Japan,
Switzerland, Germany, and France. Europe, in total, is the largest source of FDI in California.
Collectively, Asian Pacific countries have the second highest FDI in California with a higher proportion
of manufacturing employment and commercial property holdings than Europe.
The BTH published a comprehensive international trade and foreign investment strategy in 2008 for
keeping California competitive in the global economy. In the state's current economic situation it will
be important that the state use its dominance in trade as a foundation for economic recovery efforts.
The Role of Small Business in the California Economy
California's dominance in many economic areas is based, in part, on the significant role small
businesses play in the state's $1.8 trillion economy. Businesses with less than 100 employees
comprise more than 98.3% of all businesses, and are responsible for employing more than 57.9% of
all workers in the state.
36
Small- and medium-sized businesses are crucial to the state's international competitiveness and an
important means for dispersing the positive economic impacts of trade within the California economy.
Of the over 52,000 companies that exported goods from California in 2006, 95% were small- and
medium-sized enterprises (SME) with fewer than 500 employees. These SMEs generated nearly half
(44%) of California's exports in 2006. Nationally, SMEs represented only 29% of total exports.
Again, these numbers include the export of only goods and not services.
Small businesses function as economic engines, especially in challenging economic times. During the
nation's economic downturn from 1999 to 2003, microenterprises (businesses with less than five
employees) created 318,183 new jobs or 77% of all employment growth, while
larger businesses with more than 50 employees lost over 444,000 jobs. From
2000 to 2001, microenterprises created 62,731 jobs in the state, accounting for
nearly 64% of all new employment growth. Common types of
microenterprises include engineering, computer system design, housekeeping,
construction, landscaping, and personnel services.
Given small businesses' important role in the California economy, it is
unfortunate that their needs are often overlooked when developing statewide
policies and programs. This has most recently been a challenge during the
state policy debates on health care, tax policy, and workforce development.
However, it is important to note that some state agencies have begun to raise
the importance of this issue, including the California Workforce Investment
Board (CWIB). The CWIB states in its biennial strategic plan that while small
businesses are critical to all areas of the state, they play a particularly key role
in rural areas where there are a limited number of large employers. The CWIB
further states that small businesses continue to have difficulty learning about and accessing public
workforce development systems and that it is important to give specific attention to the needs of
small businesses.
The Committee is currently working with Small Business California and the CWIB to survey local
workforce investment boards to better understand their business service strategies, use of industry
clusters to target training, and how they are measuring the return on investment of public and private
dollars. The results of the survey are expected in late April.
The Role of Manufacturing in the California Economy
Manufacturing is a key driver of the California economy, responsible for employing 1.5 million workers
and contributing $179 billion to the state's $1.8 trillion GDP in 2007.
The top ten manufacturing sectors include computers and electronics, chemicals, food products,
fabricated metals, transportation equipment, machinery, petroleum and coal, plastics and rubber, and
apparel. Manufacturing is California’s most export-intensive activity with more than one-fourth of all
manufacturing workers in California directly depending on exports for their jobs.
Manufacturing in California, however, faces many challenges maintaining global and domestic
competitiveness, including providing a skilled workforce to support the changing needs of
Opportunity: Small
business has
historically served as
economic engines
during economic
downturns.
Challenge: A
growing number of
small businesses are
having problems
accessing credit and
assisting workers in
upgrading skill.
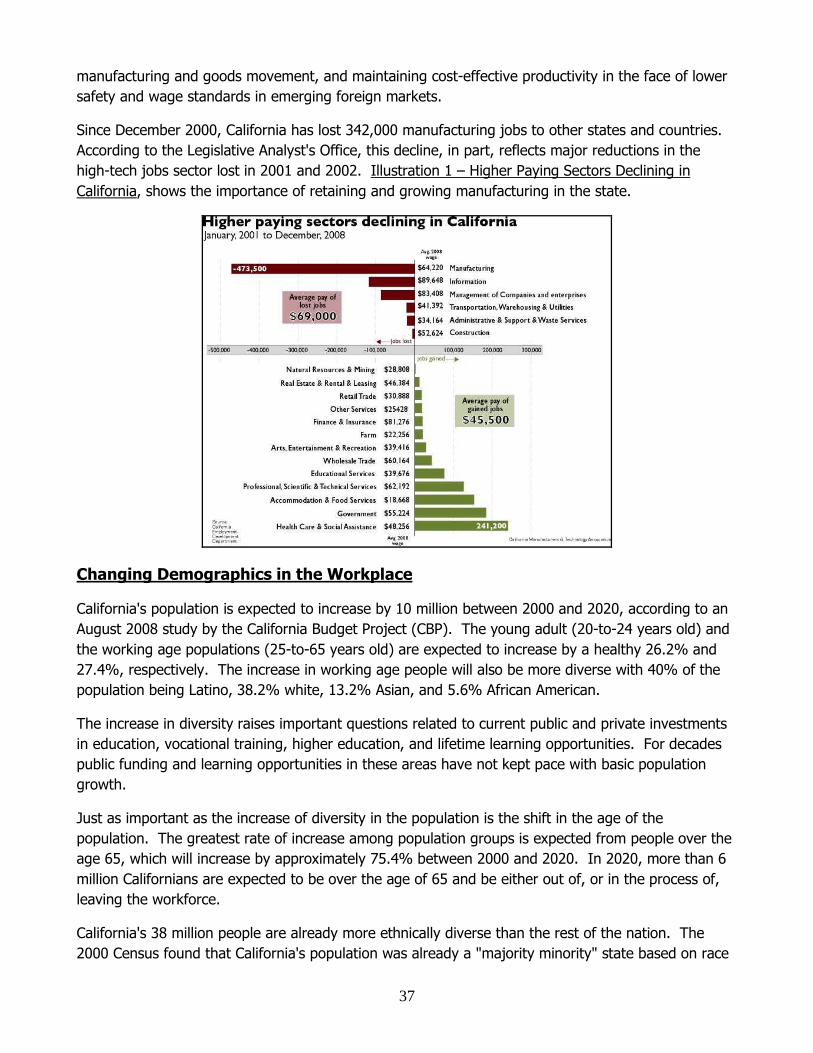
37
manufacturing and goods movement, and maintaining cost-effective productivity in the face of lower
safety and wage standards in emerging foreign markets.
Since December 2000, California has lost 342,000 manufacturing jobs to other states and countries.
According to the Legislative Analyst's Office, this decline, in part, reflects major reductions in the
high-tech jobs sector lost in 2001 and 2002. Illustration 1 – Higher Paying Sectors Declining in
California, shows the importance of retaining and growing manufacturing in the state.
Changing Demographics in the Workplace
California's population is expected to increase by 10 million between 2000 and 2020, according to an
August 2008 study by the California Budget Project (CBP). The young adult (20-to-24 years old) and
the working age populations (25-to-65 years old) are expected to increase by a healthy 26.2% and
27.4%, respectively. The increase in working age people will also be more diverse with 40% of the
population being Latino, 38.2% white, 13.2% Asian, and 5.6% African American.
The increase in diversity raises important questions related to current public and private investments
in education, vocational training, higher education, and lifetime learning opportunities. For decades
public funding and learning opportunities in these areas have not kept pace with basic population
growth.
Just as important as the increase of diversity in the population is the shift in the age of the
population. The greatest rate of increase among population groups is expected from people over the
age 65, which will increase by approximately 75.4% between 2000 and 2020. In 2020, more than 6
million Californians are expected to be over the age of 65 and be either out of, or in the process of,
leaving the workforce.
California's 38 million people are already more ethnically diverse than the rest of the nation. The
2000 Census found that California's population was already a "majority minority" state based on race
38
and ethnicity. In 2006, whites accounted for approximately 42.8% of California's population as
compared to 69.4% in the rest of the nation. Latinos represented approximately 35.9% of
California's population as compared to 11.9% in the rest of the nation; Asians represent 12.1% as
compared to 3.2% in the rest of the nation; and African Americans represent 6% of the state's
population as compared to 13% in the rest of the nation.
These statistically significant surges in the diversity of California's working-age population are a trend
that is quickly moving across the country and will result in profound impacts on the U.S. economy. It
is estimated that 85% of the growth in the U.S. population will come from non-white ethnic groups
during the next 40 years. This demographic shift is expected to measurably increase the comparative
value of minority purchasing power. The current size of the U.S. Hispanic and African American
consumer market is already larger than the GDP of all but nine countries in the world.
In a related change, there has also been a significant increase in the number of minority-owned firms.
The Milken Institute first identified this trend in 2000 and reported that the growth of minority-owned
firms were surpassing the growth of all U.S. businesses, growing at a rate of 17% per year, six times
the growth rate of all other firms. Further, revenues attributed to minority firms are growing 34%
per year—more than twice the rate of all other firms.
Women-owned firms, particularly among ethnic women, increased at a rate five times greater than all
firms. The rate of African American women-owned firms increased by 12% annually, as compared to
2% for all firms and just fewer than 4% for all women-owned firms. The Internal Revenue Service
has predicted that Latinos will soon own 1-in-10 businesses.
Despite their increase in numbers, the ability of minority and women-
owned businesses to grow is constrained by their access to capital.
Even after accounting for a variety of factors (education, experience,
industry, and location) minority-owned firms receive less capital on
less advantageous terms. Latinos and African Americans are turned
down for business loans at 3 times the rate of whites with equivalent
credit characteristics.
Further, minority-owned firms tend to start their businesses with
lower levels of personal wealth and face barriers when tapping
traditional financing sources, contributing to lower rates of overall
success and growth. Access to capital is not just limited to debt
equity; the Milken Institute's report, among others, also found that of the estimated $95 billion in the
private equity market in 1999 (nationwide), only $2 billion is managed by companies whose focus is
supplying capital to entrepreneurs from traditionally underserved markets. Despite advances in
venture capital, mezzanine debt, and asset-backed securitization, the vast majority of minority firms
do not have access to the types of financing available to larger companies.
In 2006, $130 billion was raised by private equity venture funds, and approximately $25.5 billion was
invested in 3,416 deals. Although women own approximately 40% of all businesses in the U.S., they
receive less than 5% of all venture capital. Minority owners comprise 8% of all owner firms, with
Hispanics owning close to 4%. However, minority-owned firms receive less than 2% of venture
Opportunity: Significant
demographic shifts are
resulting in new business
opportunities for emerging
domestic markets.
Challenge: Despite their
potential market
opportunities, emerging
domestic markets often lack
access to capital, particularly
in rural areas and inner
cities.
39
capital. Rural entrepreneurs account for 10% of all businesses but receive less than 2% of all
venture capital.
The Committee has made the examination of the challenges facing small businesses, including minority
and women-owned businesses, a policy priority for the past two years. For the purposes of analysis,
the Committee uses the term "emerging domestic market" (EDM) to refer to these significant
demographic shifts in communities that may have historically been overlooked for private investment,
but now may be or could become private investment ready.
The term, EDM, was originally developed by the Milken Institute, and they use it to refer to people,
places, or business enterprises with growth potential that face capital constraints due to systemic
undervaluation as a result of imperfect market information. These markets include ethnic- and
women-owned firms, urban and rural communities, companies that serve low- to moderate-income
populations, and other small- and medium-sized businesses.
California Competitiveness
Innovation has long been the cornerstone of California's competitive edge. Innovation, by its very
nature, requires constant reassessment and, very often, reinvestment of public resources to maintain
and enhance a creative environment where businesses and financial partnerships can constantly
evolve.
In March 2008, JEDE undertook a survey of California's business climate. Overall, JEDE found that
the state's businesses experience higher costs than in many other areas of the nation, consistently
ranking in the top 10 highest cost states. However, the survey also found that even with those costs
certain regions of the state remain highly competitive within the national and global marketplace. A
copy of the California business climate survey is available through the JEDE Committee website
www.assembly.ca.gov
As an example, a 2007 index developed by the Milken Institute and Greenstreet Partners found
California metro areas hold four of the top 25 slots for areas that are best to create and sustain
innovation-based jobs. Top California locations include Riverside-San Bernardino (3rd), Bakersfield
(17th), Vallejo-Fairfield (22nd), and Sacramento–Arden-Arcade–Roseville (25th).
California has also consistently been a leader in attracting venture capital, although research shows
that other states and regions in the world are beginning to close the gap. A 2007 report, "Venture
Impact: The Economic Importance of Venture Capital Backed Companies in the U.S. Economy," had
the following to report on California's venture position relative to the rest of the nation:
• Impact of Venture Capital: Nationally, venture-backed companies contributed to 10 million jobs
and $2.3 trillion in revenues in 2006. California was the leader in revenues tied to venture-backed
companies with $566 billion, followed by Texas ($293 billion), Washington ($144 billion),
Massachusetts ($131 billion), and Pennsylvania ($121 billion).
• The states with the highest employment attributable to venture-backed companies were California
(2.3 million jobs), Texas (1.1 million jobs), Pennsylvania (697,400 jobs), Massachusetts (674,300
jobs), and Georgia (604,500 jobs) in 2006.

40
• Growth Rate of Venture-Backed Companies: California had the 7th highest growth in revenues
attributed to venture-backed companies among 50 states during 2003-2006, growing 12.6%.
Other states with high growth rates for revenues include Minnesota (16.2%), Tennessee (15.7%),
Virginia (14.7%), New Jersey (14.1%), Washington (12.8%), and Massachusetts (12.8%).
• Highest Venture Capital Investments by Region: In 2008, California had 4 of the top 18 regions in
the nation for venture capital investments, including Silicon Valley (38.8%), San Diego (4.3%), Los
Angeles/Orange County (7.05%), and Sacramento (0.26%). Other
top performing regions include New England (11.5%) and New
York Metro (6.64%).
Another clear California strength is the state's academic-based
research capacity. In a 2006 survey, the University of California
ranked 2nd with Caltech 3rd and Stanford 4th among all universities
for biotechnology transfer. MIT was ranked 1st and the University of
Florida ranked 5th. California also ranks 1st among 50 states for
patents issued in 2006, when 25,043 total patents were granted.
Other top performing states include Texas (6,717 patents), New York
(6,407 patents), Massachusetts (4,369 patents), and Michigan (4,179
patents).
However, the indexes reviewed by JEDE also identified areas of weakness that threaten California's
long-term economic strength. In particular, the JEDE survey found that the state will need to make
long-term investments in infrastructure, K-12 education, and workforce development. If the state
does not regain competitiveness in these areas, California's advantages in entrepreneurship, finance,
and technology will erode.
The February 2008 California Global Competitiveness Study by the Business, Transportation, and
Housing Agency (BT&H) made similar findings, especially as they relate to the need to make
improvements to infrastructure and workforce development. More specifically, the Study found that
any area where the state "cannot supply high-quality workers – at the right quantity – will tend to
encourage industry to outsource, offshore, or move out of state." The BT&H Study also
recommended that the state would benefit from improved infrastructure investments including
investments in broadband coverage, water infrastructure, energy generation and delivery, as well as
road, rail, and port infrastructure.
California's Economic Policies
California's community and economic development policy is driven by a number of statutory
mandates, the first of which is the Environmental Goals and Policy Report (EGPR). The EGPR is the
state's 20-year growth and economic development strategy. Prepared every four years, it serves as a
guide for individual department plans and overall state expenditures.
The EGPR analyzes the current context of the state's environmental, economic and social setting; the
driving forces behind growth and development; and the outside influences that affect many of the
state's actions, policies, and programs. Based on this analysis of existing conditions and influences,
Opportunity: California has
been a world leader in
innovation, particularly in
the development of new
technologies such as
cleantech.
Challenge: The state's
failure to adequately invest
in infrastructure, K-12
education and workforce
development threatens the
state's competitive edge.
41
the EGPR proposes cross-cutting and integrated goals and policies for the state that will allow it to
achieve the overarching mission of sustainable development.
In proposing an implementation strategy for the 2003 update to the EGPR, fundamental changes
were recommended in the way that state government conducts itself. The 2003 EGPR Update made
a distinction between things that should continue to grow or develop—such as jobs, productivity,
wages, capital, savings, profits, information, healthcare, education, knowledge, environmental quality
and social equity—and things that should not, such as pollution, waste, poverty, and dependence on
non-renewable resources. Unfortunately, the policy recommendations in the 2003 EGPR Update were
not specifically pursued and the 2007 deadline for updating the EGPR was not met.
Another important state economic planning document is the state Economic Development Strategic
Plan, which sets state economic goals and recommends the actions necessary to improve the
business climate and economy of the state. The Plan also evaluates the effectiveness of the state's
economic development programs and identifies strategies to foster job growth and economic
development covering all state agencies, offices, boards, and commissions that have economic
development responsibilities. The state Economic Development Strategic Plan is required to be
prepared every two years, it has not, however, been prepared since 2002.
Given the drastic nature of the state's current economic situation, it is unfortunate that California
does not have a current and complete set of these economic development assessments to help guide
the state's activities. Redressing this issue is a top priority of the CA Economic Recovery Strategy.
Summary of Economic Challenges Facing California Communities
In December 2008, the National Bureau of Economic Research officially declared that the U.S. was
indeed in a recession, which had begun in December of the previous year and dramatically moved
into a full blown economic crisis by the close of September 2008.
The California Labor Market Review reports that 79,300 jobs were lost in California during January
following an 84,400 job loss in December and 74,900 job loss in November. The current amount of
total California jobs is estimated at 14.6 million in nonfarm industries.
January’s seasonally adjusted unemployment rate was 10.1%, up 1.4% from the previous month and
4.0% from a year ago. By comparison, the US seasonally adjusted unemployment rate was 8.1% in
February 2009, up 3.3% from the prior year. While California's overall unemployment rate is higher
than the US, jobs losses in California are growing at a slower pace than the nation as a whole.
Marin's 6.6% unemployment rate is the lowest rate among California counties for January. Other
counties with rates below 7.5% included Mono, San Mateo and Orange. In total, four counties had
rates below 8.0%. Colusa County’s 26.7% unemployment rate was the highest in the state with
Imperial County following with 24.2%. In total, 40 of the state's 58 counties had unemployment rates
above 10%.
In January 2009, the Information sector experienced the biggest loss of jobs in California’s economy.
During January, 27,700 jobs were lost in the information sector; followed by professional and
business services (21,900); manufacturing (14,400); construction (10,200); Trade, Transportation,
42
and Utilities (7,100); financial activities (3,900); and other services (1,500). Four sectors experienced
month-over jobs gains: the Educational and Health Services sector gained 3,900 jobs; Leisure and
Hospitality – 2,200; Government – 1,100; and Natural Resources and Mining – 200, adding a total of
7,400 jobs.
Small businesses have been especially hard hit during the current economic crisis. A recent study by
the National Small Business Association found that over a third of business owners expressed the
most significant concern over access credit. Additionally, in the most recent American Express OPEN
Economic Pulse Report, 63% of small businesses reported being impacted by tightening credit
conditions. This is up from 50% just two months earlier. Until credit conditions rebound, it will be
difficult for small businesses, the state's historic economic engines, to start expanding and creating
jobs. Appendix A and Appendix K includes a more detailed information on the California economy
and current county unemployment rates.
In looking forward, some of California's top university forecasters are estimating statewide
unemployment will reach or exceed the 1982 post-war record of 11% in 2010. By comparison,
unemployment peaked at 9.9% in the early 1990s recession and at 11% in the recession of the
1980s.
Currently, the most pessimistic January forecast comes from the University of California, Santa
Barbara, which says that California is expected to have the greatest increase in unemployment in the
second quarter of 2009 and the overall unemployment rate to reach 11% in the first quarter in 2010.
Growth and private investment are also expected to remain negative well into the final quarters of
2010.
California purchasing managers seem to agree with these forecasts, according to a quarterly survey
released January 28, 2009. The survey found that purchasing managers believe the manufacturing
sector will contract further in the first quarter of 2009. Production and new orders, however, will
increase slightly. Commodity prices are expected to fall and employment in manufacturing will
decrease at a fast rate. The survey also found that durable goods industries (excluding high tech)
are expected to severely contract. While high tech industries are also expected to contract,
employment in high-tech is not expected to decrease as much as in other manufacturing industry
groups.
Chapman University's January forecast stated:
• Short-term interest rates are expected to remain near their present level throughout 2009.
• Access to capital will continue to stagnate until late 2009, at the earliest.
• There will continue to be declines in real GDB, estimated at 1.4%, for all of 2009.
The University of the Pacific (UOP) predicts that GSP will decline by nearly 3% annualized rate
through the first half of 2009 with the job market remaining weak through most of 2010. The UOP
forecast also states:
43
• Housing starts hit bottom in late 2008 (1/5 of its peak levels) and are expected to stay at this low
level through all of 2009. In 2010 housing starts are expected to begin to slowly increase reaching
about 100,000 by year end.
• Retail sales will continue to decline reaching $30 billion by the end of next year.
• Current slow growth trends in the Health Care, Private Education, and Other Services sector are
expected to continue and not contract in 2009.
In analyzing the recoveries that followed the last six recessions, Chapman notes that above-average
gains in consumer spending accounted for 70% of the increase in real GDP in the first quarter of the
recovery. This time around, Chapman forecasts that prospects for an increase in consumer spending
are "bleak." Further, any recovery in investment spending will be constrained by high office vacancy
rates and structural problems in the housing industry.
44
Section 3. California's Emerging Green Economy
California is not only one of the largest economies in the world; it is also one of the most
economically diverse. The state's economy is comprised of a variety of industry clusters. While many
of these clusters are linked through extended economic value chains across the state, in general,
industry clusters operate within their own regional micro-economies.
In Section 2 – The California Economy, information was provided on a wide range of industries
including those that are the largest, the fastest growing, and those that have the greatest job
concentration with the highest wages. In this section, the strategy examines business development
and job creation opportunities in the cleantech and renewable energy sectors, the so called new
green economy.
Defining California's Green Economy
The new and emerging green economy can play an important role in California's economic recovery,
as a whole, and in lower income rural areas, in particular. The green economy is not one industry
sector, but rather it encompasses a broad range of products and services, from alternative energy
generation, to wastewater treatment, to the creation of environmentally-friendly consumer products.
Some of these products and services are new while others are simply adaptations produced by
California's traditional manufacturing and service industries.
The growth of the green economy is the result of two disparate factors converging to create a new
market. First, recent advances in new technologies, research methods, manufacturing, and
communications have lowered the cost of environmentally sensitive technologies. Second, an
increasing number of consumers and businesses are looking for ways to reduce energy costs,
increase access to clean water, and meet new environmental regulatory requirements at the local,
state, and global levels.
The California Economic Strategy Panel describes California's green economy as a value network that
includes different activities along a product value chain. Illustration 2, The California Green Economy
Value Network, below, provides a useful diagram of the various interrelated components of the green
economy value network.
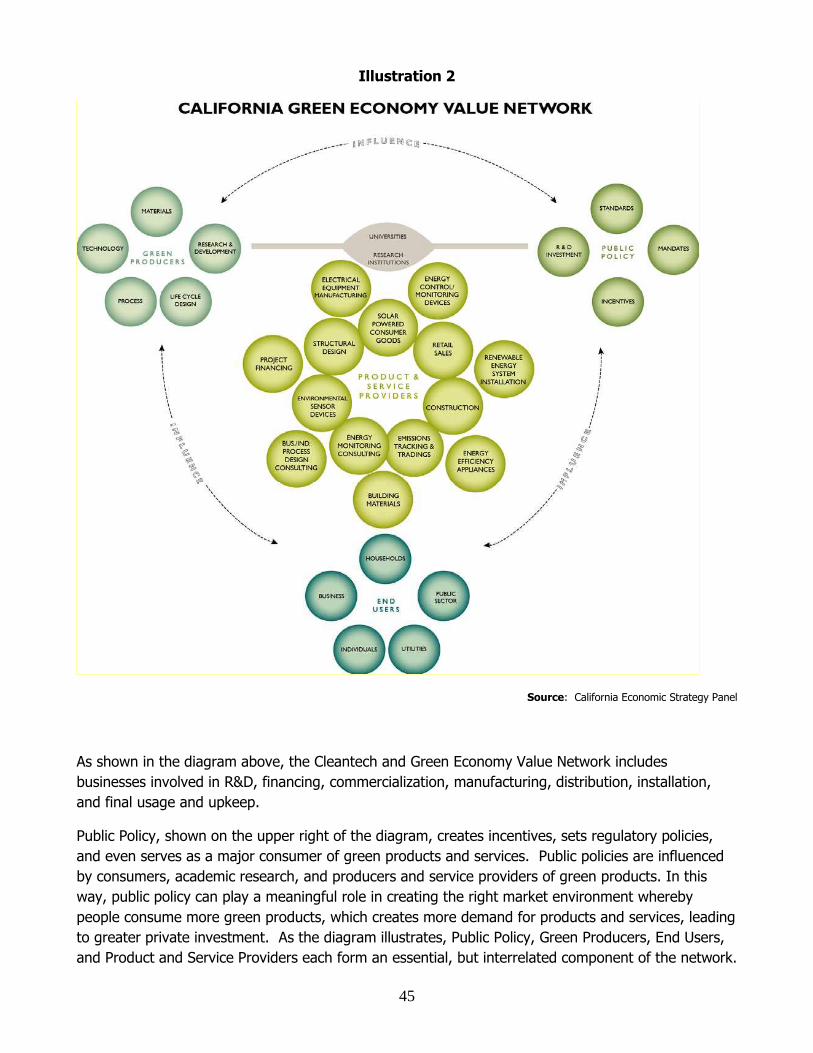
45
Illustration 2
Source: California Economic Strategy Panel
As shown in the diagram above, the Cleantech and Green Economy Value Network includes
businesses involved in R&D, financing, commercialization, manufacturing, distribution, installation,
and final usage and upkeep.
Public Policy, shown on the upper right of the diagram, creates incentives, sets regulatory policies,
and even serves as a major consumer of green products and services. Public policies are influenced
by consumers, academic research, and producers and service providers of green products. In this
way, public policy can play a meaningful role in creating the right market environment whereby
people consume more green products, which creates more demand for products and services, leading
to greater private investment. As the diagram illustrates, Public Policy, Green Producers, End Users,
and Product and Service Providers each form an essential, but interrelated component of the network.

46
Other layers within the green economy value network are associated with the different industry
sectors that produce clean, green, and more resource efficient goods and services. As Chart 3 –
Cleantech Industries illustrates, cleantech is not one single industry, rather it is comprised of elements
of a wide number of industries.
Chart 3 - Cleantech Industries
Agriculture Bio-based materials; farm efficiency technologies; micro-irrigation systems; bio-
remediation; and non-toxic cleaners and natural pesticides.
Air &
Environment
Air purification products and air filtration systems; energy efficient HVAC; universal gas
detectors; multi-pollutant controls; and fuel additives to increase efficiency and reduce
toxic emissions.
Materials Biodegradable materials derived from seed proteins; micro-fluidics technology for
conducting biochemical reactions; nano-materials; composite materials; thermal
regulating fibers and fabrics; environmentally-friendly solvents; nano-technology
components for electronics, sensor applications and energy storage; electro-chromic
glass; and thermoelectric materials.
Energy Energy Efficiency: Energy management systems; systems that improve output of power
generating plants; intelligent metering; solid state micro refrigeration; control technology
for HVAC systems; and automated energy conservation networks.
Energy Generation: Distributed and renewable energy and conversion, including wind,
solar/photovoltaic (PV), hydro/marine, biofuels, fuel cells, gasification technologies for
biomass, and flywheel power systems.
Energy Infrastructure: Wireless networks to utilities for advanced metering; power
quality monitoring and outage management; integrated electronic systems for the
management of distributed power; and demand response and energy management
software.
Energy Storage: Batteries, e.g. thin film and rechargeable; power quality regulation;
flywheels; and electro-textiles.
Manufacturing
and Industrial
Advanced packaging; natural chemistry; sensors; smart construction materials; business
process and data flow mapping tools; precision manufacturing instruments & fault
detectors; and chemical management services.
Recycling &
Waste
Recycling technologies; waste treatment; internet marketplace for materials; hazardous
waste remediation; and bio-mimetic technology for advance metals separation and
extraction.
Transportation Hybrid vehicle technology; lighter materials for cars; smart logistics software; car-
sharing; and temperature pressure sensors to improve transportation fuel efficiency;
telecommuting.
Water &
Wastewater
Water recycling and ultra-filtration systems (e.g. UV membrane & ion exchange
systems); sensors and automation systems; and water utility sub-metering technology;
desalination equipment.
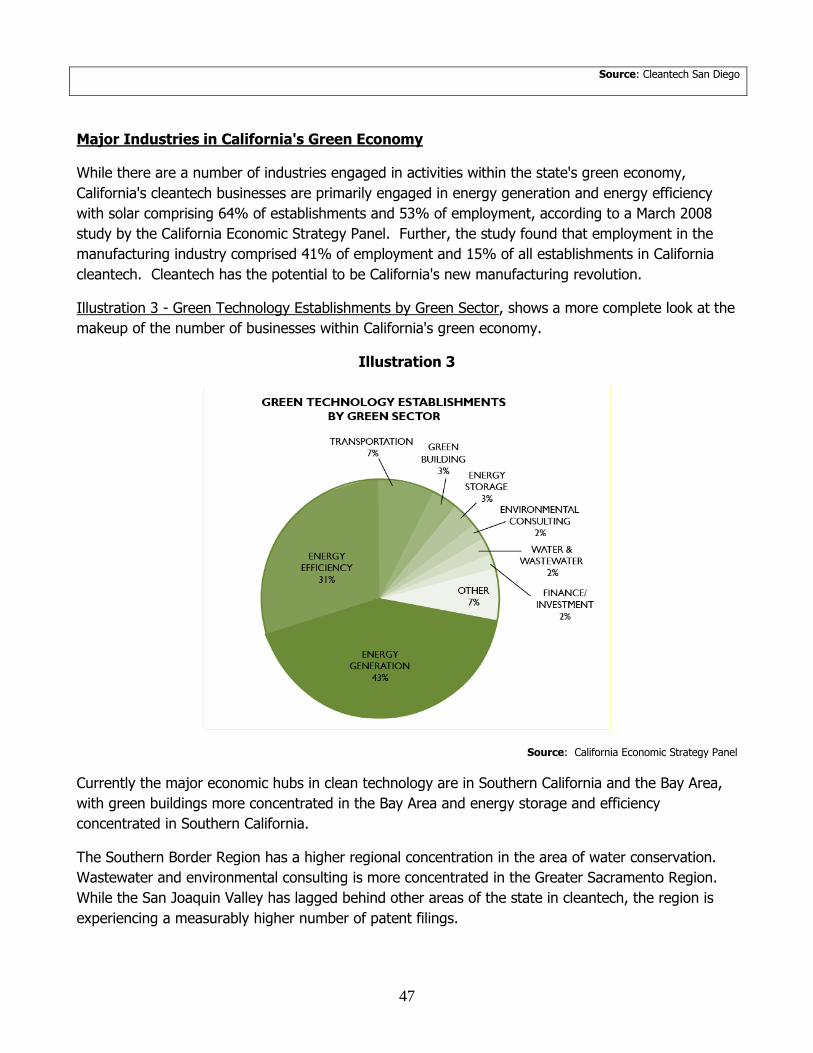
47
Source: Cleantech San Diego
Major Industries in California's Green Economy
While there are a number of industries engaged in activities within the state's green economy,
California's cleantech businesses are primarily engaged in energy generation and energy efficiency
with solar comprising 64% of establishments and 53% of employment, according to a March 2008
study by the California Economic Strategy Panel. Further, the study found that employment in the
manufacturing industry comprised 41% of employment and 15% of all establishments in California
cleantech. Cleantech has the potential to be California's new manufacturing revolution.
Illustration 3 - Green Technology Establishments by Green Sector, shows a more complete look at the
makeup of the number of businesses within California's green economy.
Illustration 3
Source: California Economic Strategy Panel
Currently the major economic hubs in clean technology are in Southern California and the Bay Area,
with green buildings more concentrated in the Bay Area and energy storage and efficiency
concentrated in Southern California.
The Southern Border Region has a higher regional concentration in the area of water conservation.
Wastewater and environmental consulting is more concentrated in the Greater Sacramento Region.
While the San Joaquin Valley has lagged behind other areas of the state in cleantech, the region is
experiencing a measurably higher number of patent filings.
48
Ranked by the number of total businesses, the Bay Area has a slight lead over Southern California,
followed by the Southern Border Region, the Greater Sacramento, the San Joaquin Valley, Northern
California, the Central Coast, the Northern Sacramento Valley, and the Central Sierra. Regions ranked
by employment follow the same pattern.
Capital Flows in the Emerging Green Economy
As the market for clean technologies matures, clean technology will continue to become cost-
competitive with traditional energy counterparts. Leading investment researchers, such as Clean
Edge, suggest that cleantech will represent a $156 billion market within the next 10 years.
The National Venture Capital Association estimates that each $100 million in venture capital funding
helps create 2,700 jobs, $500 million in annual revenues for two decades and many indirect jobs.
Between 2005 and 2007, the top five cleantech regions experienced higher levels of venture capital
activity. Not surprising, the Bay Area, which includes the Silicon Valley, had the highest level of new
investment attracting $1.1 billion in 2007. Companies in the Los Angeles region received the second
highest amount estimated at $361 million in 2007. While the highest concentration of venture money
remains in energy generation, venture capital funds are beginning to shift toward other areas
including transportation.
R&D and Commercialization of New Products and Processes
Of the seven Department of Energy-funded national laboratories, the University of California (UC)
manages three, including the Lawrence Berkley, Lawrence Livermore, and Los Alamos National
Laboratories. These key foundational resources coupled with local private venture capitalists have
helped California become a truly dominant global innovator in a variety of technology areas.
As the cleantech industries mature, the state has looked for selective opportunities to attract and
develop major technology projects. One example is the Helios project, a renewable energy initiative
being carried out at the UC Lawrence Berkley Laboratory. In order to support the Solar Energy
Research Center (SERC) and the Energy Bioscience Institute (EBI), the Legislature and Governor
approved $30 million and $40 million respectively, in lease revenue bonds as part of the California
2008-09 Budget package.
Based on the quality of the research partners and the state's investment in alternative energy, British
Petroleum committed $500 million in the EBI over the next 10 years. The EBI is also funded through
the Joint Bioenergy Institute (JBEI) in Emeryville, California. The JBEI is one of only three Bioenergy
Research Centers established by the U.S. Department of Energy and is a partnership between the
Lawrence Berkley, Lawrence Livermore, and Sandia National Laboratories, and several universities
(UC Berkeley and University of Illinois).
However, even given the successful R&D models commercialization is still a challenge. Dr. Steven
Chu, when he first came to the Lawrence Berkley Laboratory made inroads in strengthening the link
between R&D activities in universities and potential markets and seed funding. However, outside of
Stanford, UC Berkley and UC San Diego there are not strong investor groups linked to the
49
universities. Further, technology transfer policies vary widely across the UC system, which has too
often led investors to avoid working with university based research.
In mid-2008, Caled, the statewide association for local economic development, and the UC President's
office began a dialogue on how to improve technology transfer among the state's 10 campuses.
Some issues being discussed include how to establish seed funding for longer term and risky
investments that link to California based jobs and manufacturing.
Perhaps the most controversial driver of research and commercialization involves the use of the
state's regulatory powers to set new standards and define technologies. As an example, the state
called for the development of cleaner operating vehicles and enacted AB 1493 (Pavley), Chapter 200,
Statutes of 2002, which directed the California Air Resources Board (CARB) to adopt vehicle standards
that lowered greenhouse gas (GHG) emissions to the maximum extent that is technologically feasible,
beginning with the 2009 model year.
Since the enactment of this legislation, the auto industry has strongly opposed this policy and
pursued various means to challenge California's authority to regulate GHG emissions including
litigation and advocacy before the Bush Administration’s Environmental Protection Agency (EPA). In
February 2009, the Obama Administration agreed to promptly reconsider California's request for a
waiver under the California Clean Air Act, which had been denied by the Bush Administration.
Growing Green Collar Jobs
According to the CARB scoping plan, required by the California Global Warming Solutions Act,
California will create over 100,000 green collar jobs by 2020. A recent study by U.C. Berkeley’s Energy
and Resources Group and Goldman School of Public Policy found that investments in green
technologies produce jobs at a higher rate than investments in comparable conventional technologies.
The Assembly has authored several policies to strengthen California's green collar workforce and the
state's green economy. Last year Governor Schwarzenegger signed into law "The Green Collar Jobs
Act," AB 3018 (Núñez), Chapter 312, Statutes of 2008. AB 3018 establishes a green collar jobs
council under the California Workforce Investment Board to address the growing workforce demand
in the green and clean economy.
AB 2855 (Hancock) Chapter 685, Statutes of 2008, was also signed into law establishing Green
Technology Partnership Academies and Goods Movement Partnership Academies as two new
categories of partnership academies through the California Community College System. In 2007 the
Governor also signed into law AB 118 (Núñez) Chapter 750, Statues 2007, which provides grants for
workforce training initiatives related to transportation technology designed to reduce air pollution or
greenhouse gas emissions.
Authorizing new programs will not, in and of itself, prepare our workforce for green collar jobs.
Partnerships must be formed with community organizations, foundations, and government agencies,
at all levels. One successful model used in California by the California Public Utility Commission (PUC)
is organized through the insertion of a new workforce development section in California’s Long Term
Energy Efficiency Strategic Plan. Inclusion of workforce development within this important energy
50
efficiency planning document allows the PUC to lay out an integrated approach to achieving
California’s energy efficiency workforce needs by 2020.
Along with the PUC, the Employment Training Panel's (EPT) strategic plan for 2008-09 includes Clean
and Green as one of their key industries and as a priority industry in itself. Just recently EPT awarded
$600,000 to California-based Bloom Energy Corporation, which manufactures solid oxide fuel cells
used for on-site power generation. The award will be used to increase the technical skills of
employees and expand the company’s manufacturing operation, and provide improved customer
service. In the current budget year, $2 million of the Governor's Workforce Investment Act
discretionary funds was set aside for new green workforce training opportunities.
While policy and funding opportunities have advanced, California still struggles with including all areas
of the state, all race and ethnicities, and women in the green economy revolution. Without social and
economic equity, a true economic transition is improbable. Challenges to all three issues begin with
inadequate K-12 education systems where children are still formally and informally placed in no-skill,
low-skill, and college preparatory educational class sequences. Basic math skills and equitable access
to vocational education opportunities are not necessarily available across all areas of the state, nor
are they systematically encouraged equally for male and female students. With manufacturing being
such a dominant component of the current green economy, workers must have solid math and
reading skills in order to enter and advance in the 21st Century workforce.
Challenges continue for prospective green-collar workers after high school as certificated training
programs are primarily limited to certain renewable energy resources, such as solar, and are not
offered in all areas of the state. Further, to the extent that retraining programs are targeted to
workers in certain industries that have historical imbalances between men and women workers, such
as construction, inequities will continue. The new green economy must develop in such a way that all
Californians can participate. As California continues to grow and mature in the green economy
market place, it will need to a more targeted, integrated, and holistic system of educating its
workforce.
Summary of Challenges in Growing the Green Economy
In general, California should be well positioned to take advantage of the new cleantech market with
our thriving technology base, existing entrepreneurial and management talent, access to a full range
of capital, and proactive environmental policies such as the passage of AB 32 (Nuñez), Chapter 488,
Statutes of 2006, which sets a state greenhouse gas emission reduction standard and SB 375
(Steinberg) Chapter 728, Statutes of 2008, which provides a process for allocating portions of those
reductions to local government regions.
However, other states and even foreign countries are also vying for domination of this new emerging
industry. In some technology areas, California receives more than 50% of all venture capital. This
trend has not applied to cleantech, however. In 2006, only 35% of venture capital investments went
to California which attracted $884 million.
Europe and Japan are also successfully building cleantech clusters. Germany and Japan have already
usurped California's once leading position in solar and wind energy through targeted policies and
initiatives. Beginning in 1998, inventors abroad have registered more patents in green technology
51
than inventors located in the U.S. as a whole, according to the Next 10 Green Innovation Index.
Tracking patents is important as they reflect initial discovery and registry of innovative ideas. Strong
patent activity usually reflects significant R&D taking place within the region.
In addition to the external challenges, California has yet to reach a reasonable accommodation on its
internal policy making process for how implementing regulations will be developed, reviewed, and
applied. The business community, as well as the Legislative Analyst, has expressed strong concerns
over the economic analysis of the impact of AB 32 and its short- and long-term effects on the ability
of existing businesses to remain solvent in light of the significant changes being proposed.
Further, attempts by legislators to provide incentives for businesses to acquire cleaner operating
equipment, encourage cleantech research, and streamline access to information on pending
regulations have all failed to pass the Legislature for a variety of reasons, including a lack of funding.
The environmental justice community has also expressed concerns that the AB 32 scoping plan does
not adequately address their issues. Taken together, these conditions are problematic as the state
needs the active involvement of both businesses and communities in determining which actions need
to be undertaken to stabilize the economy and reduce GHG emissions.
If California is to remain a dominant player in this emerging field, the state will need a more targeted
and integrated system of educating its workforce, financing research and commercialization, and
implementing successful community and business development models.

52
Section 4. Public Economic and Workforce Development
Resources
This section addresses federal, state, and local resources that are available to assist communities in
California to take actions that mitigate the impact of the current economic crisis and to help
communities move forward in establishing more diverse and sustainable local economies.
It is not likely that any specific program or service discussed in this section will, in and of itself,
trigger a national economic recovery. However, taken collectively, these programs can provide
important gap financing to small businesses while debt markets are frozen; offer training so
unemployed workers can fill job openings that still exist; and help communities obtain critical
infrastructure to support the health and safety, and economic development needs of struggling
neighborhoods.
While funding for many state programs have been cut back in recent years due to poor economic
times, numerous federal programs will be receiving additional funding through the federal stimulus
package and the newly proposed federal budget.
When reviewing the programs and services below, it is important to look at federal, state, and local
programs together, because few of the programs offer 100% financing of a single project and they
must, therefore, be combined with other public and private resources in order to complete the
project. So while federal funds may be flowing through one program, community leaders and
Assemblymembers should also carefully examine the condition of the other programs and/or services
which are commonly used in conjunction.
The information in this section is divided into economic development programs that are
geographically-based, and those that serve a more narrow purpose and are available statewide. The
information on workforce development programs includes a discussion of unemployment insurance
benefits due to its importance to the state's economic safety net. And, the final subsection includes
information on the federal stimulus package and state actions to better leverage those funds.
Appendices D, E and J have extended information on additional state and federal programs.
The Assembly Committee on Jobs, Economic Development, and the Economy has also produced a
catalog of state economic and workforce development programs that is available on the Committee's
website through the State Assembly website at www.assembly.ca.gov or through the Committee
office.
Geographically Targeted Economic Development Activities
The state and federal governments have established several important, geographically-based
economic development programs. These types of programs are founded on the principle that
targeting significant economic incentives to low-income communities allow these communities to
more effectively compete for new businesses and retain existing businesses, resulting in increased tax
revenues, less reliance on social services, and lower public safety costs. Residents and businesses
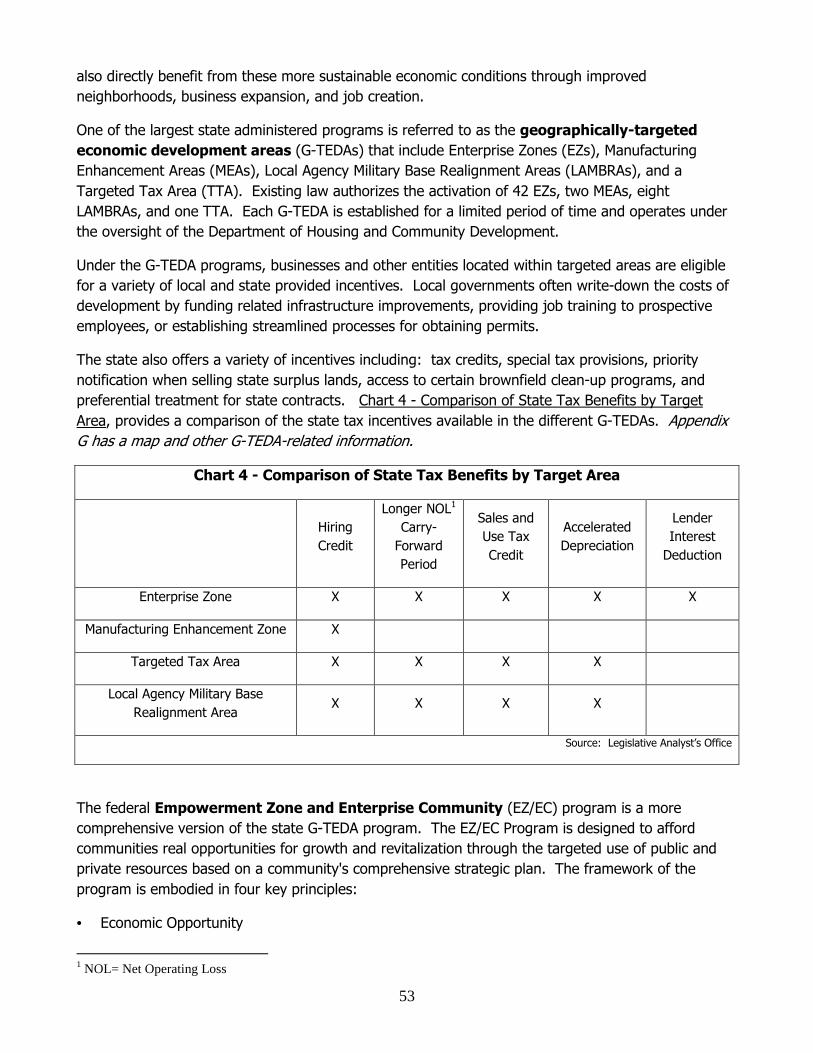
53
also directly benefit from these more sustainable economic conditions through improved
neighborhoods, business expansion, and job creation.
One of the largest state administered programs is referred to as the geographically-targeted
economic development areas (G-TEDAs) that include Enterprise Zones (EZs), Manufacturing
Enhancement Areas (MEAs), Local Agency Military Base Realignment Areas (LAMBRAs), and a
Targeted Tax Area (TTA). Existing law authorizes the activation of 42 EZs, two MEAs, eight
LAMBRAs, and one TTA. Each G-TEDA is established for a limited period of time and operates under
the oversight of the Department of Housing and Community Development.
Under the G-TEDA programs, businesses and other entities located within targeted areas are eligible
for a variety of local and state provided incentives. Local governments often write-down the costs of
development by funding related infrastructure improvements, providing job training to prospective
employees, or establishing streamlined processes for obtaining permits.
The state also offers a variety of incentives including: tax credits, special tax provisions, priority
notification when selling state surplus lands, access to certain brownfield clean-up programs, and
preferential treatment for state contracts. Chart 4 - Comparison of State Tax Benefits by Target
Area, provides a comparison of the state tax incentives available in the different G-TEDAs. Appendix
G has a map and other G-TEDA-related information.
Chart 4 - Comparison of State Tax Benefits by Target Area
Hiring
Credit
Longer NOL1
Carry-
Forward
Period
Sales and
Use Tax
Credit
Accelerated
Depreciation
Lender
Interest
Deduction
Enterprise Zone X X X X X
Manufacturing Enhancement Zone X
Targeted Tax Area X X X X
Local Agency Military Base
Realignment Area X X X X
Source: Legislative Analyst’s Office
The federal Empowerment Zone and Enterprise Community (EZ/EC) program is a more
comprehensive version of the state G-TEDA program. The EZ/EC Program is designed to afford
communities real opportunities for growth and revitalization through the targeted use of public and
private resources based on a community's comprehensive strategic plan. The framework of the
program is embodied in four key principles:
• Economic Opportunity
1 NOL= Net Operating Loss

54
• Sustainable Community Development • Community-based Partnerships • Strategic Vision for Change One of the strengths of the EZ/EC program are the separate, but related urban and a rural
components to the program. Each community in the Empowerment Zone and Enterprise Community
Program tailors its own strategic plan to meet the needs of the community. There are four
communities in California participating in the Empowerment Zone and Enterprise Community
Program: the City of Watsonville in Santa Cruz County; the County of Imperial; the Westside Tulare
region, including rural portions in Fresno and Tulare Counties; and the Desert Communities in
Riverside County.
Another significant program is the Community Redevelopment Project Area. The California
Constitution provides for the establishment of community redevelopment project areas and the
issuance of property tax increment bonds. Every city and county is authorized by law to activate a
community redevelopment agency (RDA) that has the official responsibility of selecting the project
area based on the ability of the local government to make a required finding that the included area is
both urbanized and blighted. There were currently 425 redevelopment agencies in 2006-07.
RDAs have special authorities and responsibilities within project areas for the purpose of eliminating
blight, increasing property values, and improving the community's quality of life. Once established,
prescribed portions of any increases in property taxes from within the project area are available to
the RDA to finance the implementation of the approved redevelopment plan. Appendix H has more
information on how redevelopment agencies can participate in community revitalization.
Another state program provides for the designation of a Recycling Market Development Zone
program for the purpose of offering assistance to support new businesses, expand existing ones,
create jobs, and divert waste from landfills. There are currently 33 Recycling Market Development
Zones in California roughly covering 71,790 square miles of the state from the Oregon border to San
Diego. Appendix I has a complete list of Recycling Market Development Zone communities.
Businesses located in a Recycling Market Development Zone that use materials in the waste stream to
manufacture their products have a variety of assistance available, including low interest loans,
technical assistance, and free product marketing.
Foreign Trade Zones are areas where goods may be imported without adhering to all U.S. Customs
rules or tariffs. The program is designed to promote U.S. trade while retaining domestic employment
that might otherwise go to foreign countries. Merchandise admitted into a zone may, among other
things, be stored, exhibited, repacked, assembled, graded, cleaned, processed, tested, labeled, and
mixed with foreign merchandise. There are two types of Foreign Trade Zones – General Purpose and
Subzone Purpose Zones. Subzones, sponsored by a General Purpose Zone, are generally located
within an industrial park or port complex whose facilities are also used by the general public. These
zones are established by the federal government with companion state statute authorization.
California has 17 general purpose FTZs out of 234 zones in the U.S. In the Southern San Joaquin
55
Valley, there is only one Foreign Trade Zone located in Merced, Madera, and Fresno Counties.
Appendix F includes a list of California's Foreign Trade Zones.
Another key geographically targeted program is the EB5 investment visa provisions administered
under the federal Immigration Act of 1990, which authorizes the issuance of 10,000 new green cards
a year based on a foreign investment in the U.S. Persons applying to this program must demonstrate
that they have invested a minimum of $1 million with the likely result of creating at least 10 direct
jobs, or investing $500,000 in certain targeted high unemployment areas and creating 10 direct or
indirect jobs. Based on 2007 state figures, 292 cities, 33 counties (21 rural), 11 metropolitan
statistical areas, and 1,567 census tracts have been identified as eligible target areas. Some states,
such as South Dakota, have specific programs that target foreign investment by people who want to
apply for visas under the investment provisions.
While the state has a broad array of geographically targeted economic development programs, the
state has taken limited actions to use these designated areas as comprehensive drivers of local
economic development. In general, these programs still operate independently. Given the current
economic downturn, addressing this deficiency is a primary facilitation objective for the state.
Other State and Federal Economic Development Resources
In addition to the geographically targeted economic development areas, California offers a variety of
programs and services to assist with business start-ups, retention, and expansion.
Since the demise of the Technology, Trade and Commerce Agency in 2003, economic developers
have struggled to establish a rational structure for helping the public find information on state
programs and resources. In 2006, the California Economic Strategy Panel launched the California
Business Portal, www.calbusiness.ca.gov .
Within its many links, the California Business Portal networks to other web-based business assistance
programs, such as the CalGOLD. Initially launched in 1997 by the California Environmental
Protection Agency, CalGOLD is an online electronic network of information on environmental
regulatory, licensure, and permitting requirements. The database can be searched by specific
businesses to individualize the information.
Beyond programs and services related to regulatory compliance, the state administers a number of
other programs that assist businesses that relate to infrastructure and workforce development. The
Infrastructure and Economic Development Bank (I-Bank) was created to promote economic
revitalization, enable future development, and encourage a healthy climate for jobs in California. The
I-Bank has the authority to issue tax-exempt and taxable revenue bonds. I-Bank administered
programs include: the Infrastructure State Revolving Fund Program, the Industrial Development
Revenue Bond Program, the Infrastructure & Community 501(c)(3) Revenue Bond Program, and the
Exempt Facility Revenue Bond Program.
The California Energy Commission administers a number of economic development-related
programs and services including help with commercializing new technologies; providing technical
assistance and financial incentives related to energy export opportunities; and providing permit
assistance for energy facility licensing. The Energy Commission's Research and Development Division
56
supports the research, technology development and demonstration of new technologies for the
generation of electricity, electricity demand-side management, and natural gas. The division's
activities include providing contracts and grants to academic institutions for research and
development of energy technologies and related scientific activities. Key programs include the:
• Public Interest Energy Research (PIER) Program: The PIER Program supports energy
research, development and demonstration (RD&D) projects that will help improve the quality of life
in California by bringing environmentally safe, affordable and reliable energy services and products
to the marketplace. The PIER Program annually awards up to $62 million to conduct the most
promising public interest energy research by partnering with RD&D organizations, including
individuals, businesses, utilities, and public or private research institutions.
• Public Interest Natural Gas Research Program: The research funded by this program
improves natural gas energy efficiency and environmental quality, develops renewable
technologies, and otherwise provides public benefits. This research program has an annual
allocation authority of up to $12 million.
• Energy Innovations Small Grant (EISG) Program: The EISG Program provides up to
$95,000 for hardware projects and $50,000 for modeling projects to small businesses, non-profits,
individuals and academic institutions to conduct research that establishes the feasibility of new,
innovative energy concepts. Research projects must target one of the six PIER program areas,
address a California energy problem, and provide a potential benefit to California electric and
natural gas ratepayers.
Contained within the California Labor and Workforce Development Agency, the California Business
Investment Service (CalBIS) serves employers, corporate real estate executives, and site location
consultants considering California for new business investment and expansion. Among its services,
CalBIS provides site selection services; information on international trade; workforce services; labor
market data; and guides for businesses, including “California Investment Guide: an Overview of
Advantages, Assistance, Taxes and Permits” and “Setting Up Business in California: a Guide for
Investors.”
There are several key federal agencies, which provide important economic and workforce
development programs and services, including the United States Department of Agriculture (USDA),
the federal Small Business Administration (SBA), the federal Economic Development Agency (EDA),
the U.S. Commercial Service, and the U.S. Treasury.
The USDA Rural Development program works to improve the economy and quality of life in rural
areas by helping individuals, communities, and businesses obtain the financial and technical
assistance needed to address their diverse and unique needs.
The USDA Rural Development's financial programs support essential public facilities and services such
as: water and sewer systems; housing; health clinics; emergency service facilities; and electric and
telephone services. The USDA Rural Development promotes economic development by supporting
loans to businesses through banks and community-managed lending pools. They provide technical
assistance and information to help agricultural and other cooperatives get started and improve the
57
effectiveness of their member services and help communities undertake community empowerment
programs.
Workforce Development in California
California's workforce development programs are administered through the Labor and Workforce
Development Agency (L&WD) and the California Community College System (CCS). Collectively,
these programs strive to improve access to employment and training programs, and to ensure that
California businesses and workers have a level playing field in which to compete and succeed.
Among the key workforce development departments, boards, and commissions, administered through
L&WD and the CCS, are the Employment Development Department (EDD), the Employment Training
Panel, the California Workforce Investment Board (CWIB), and the Career-Technical Education
Economic Development Initiative.
Among EDD's most important missions is to ensure that California's workforce has the skills that
employers need to manage their businesses. These services can generally be characterized as
"workforce investment." EDD's major workforce investment programs include the California One-Stop
Career Centers, the California Jobs Service Program (CalJOBS), Employment Training Panel, and the
Workforce Investment Program.
The One-Stop Career Center system is a statewide network of centers that provide employment,
education, and training services all in one location. The One-Stop Centers work with public and
private non-profit partners to provide their services. The One-Stop Centers include programs such as
Job Services, Unemployment Insurance, Vocational Education, and Vocational Rehabilitation. The
One-Stop Centers provide their services in English and Spanish, and are organized around a locally
determined set of priorities, which are designed to meet the unique employment needs in each
community. All but two of California's 58 counties have a One-Stop Center, with many counties
having multiple one-stop locations.
EDD's Job Services Program is California's component of the federal/state public employment
service system. Funded by an employer's payroll tax, under the Federal Unemployment Tax Act, the
Program connects employers with qualified workers, at no cost. The Jobs Services Program is one of
the largest employment services programs in the world. It offers assistance through more than 400
service locations, in over 200 communities, serving more than 900,000 employers in this state. The
Jobs Services Program also provides California's employers with a variety of services to meet
workforce needs, including:
• Re-employment services for dislocated workers;
• Labor market information for business expansion, relocation, and future hiring;
• Focused recruitment for new business ventures or facilities needing a large number of specialized
workers; and,
• Locally coordinated workforce preparation services.
The Internet based CalJOBS allows job seekers to enter their resume into a database that can be
accessed by employers. Job seekers can also use CalJOBS to search the job listing database. The
58
Re-employment Program is a specialized process that selects new UI claimants to ensure that
they understand and meet the UI work test requirements of being able and available for work, as well
as actively seeking employment.
The Unemployment Insurance Program provides compensation to workers who become
unemployed, due to no fault of their own, and meet a series of eligibility criteria. Unemployment
insurance promotes economic stability for unemployed workers and communities by maintaining the
workers' purchasing power. While federal law sets a basic structure for states to follow in
establishing their Unemployment Insurance Program, states have the authority to set benefit levels
and the tax collection structure. California is expecting a serious shortfall in its UI Fund and it is the
subject of extensive work by the Assembly Committees on Labor and Insurance and the Assembly
Budget Subcommittee on General Government. The most recent report estimates that the
Unemployment Insurance (UI) Fund will be in the red by $2.4 billion by the end of 2009, and face a
deficit of $4.9 billion by the end of 2010.
Another key component to the state's workforce development program is the Employment Training
Panel (EPT), a business- and labor-supported state agency that funds job skills training to provide
workers with jobs that have good pay potential and long-term usefulness. The EPT uses the
Employment Training Fund for their training programs. Monies in the Employment Training Fund are
provided by one tenth of 1% of unemployment insurance wages paid by every private, for-profit
employer in the state, as well as some non-profits amounting to no more than $7.00 per covered
employee per year.
ETP has paid more than $1 billion in training funds since its inception, and trained more than 660,000
California workers. In California, 60,000 businesses have been served, with 80% of companies
having been small businesses with fewer than 250 employees per firm. Research has shown that for
every $1.00 invested in the ETP Program, $5.00 is returned in economic benefits.
Implementation of the federal Workforce Investment Act (WIA) required significant reforms to
California's job training system. These reforms emphasized private sector involvement, improved
customer service, better alignment of public sector resources, and the integration of education,
workforce, and economic development programs in order to help both workers and employers
compete and succeed in the global economy. The California Workforce Investment Board was
established to work with local workforce development boards to “achieve sustainable economic
growth, meet the demands of global competition in the modern economy, and improve the quality of
life for all Californians.”
Resources used to carry out CWIB activities are derived from the Governor's 15% WIA Discretionary
funds. CWIB has a staff of 22 authorized positions, including an executive director who is an integral
part of the CWIB. The staff organization supports various committees on administration, high-
wage/high growth jobs, advancing workers, and statewide worker shortages.
A majority of WIA funds are allocated to the California Workforce Investment Board and local
workforce investment boards by federal formulas based on demographics and economic data such as
unemployment statistics. The Perkins Act, a component of the overall WIA program, offers incentive
grants to states based on the successful completion of workforce and education programs in prior
59
years. Further, the Wagner-Peyser Act funds flow through the Economic Development Department
and currently fund the one-stop centers. The Department of Labor funds other important workforce
training programs including a prison re-entry initiative administered in partnership with the state
Department of Corrections.
The Economic Development and Workforce Preparation Division of the Community College
Chancellor’s Office has a variety of responsibilities related to workforce and economic development,
including the implementation of the comprehensive California State Plan for Vocational and Technical
Education and the delivery of industry-focused technical assistance initiatives.
The Career-Technical Education Economic Development Initiative, SB 70 (Scott), Chapter 352,
Statutes of 2005, authorized the allocation of $20 million to expanded vocational and career technical
educational opportunities for middle school and high school students, and improved linkages between
the career and technical curricula of the public schools and community colleges. Several types of
other projects are eligible for funding including:
• "Quick Start" Partnerships, which will enhance linkages and pathways between secondary schools
and selected economic and workforce development initiatives in community colleges;
• Projects that will grow program capacity and infrastructure; and
• Projects that will strengthen Career and Technical Education sectors at secondary school.
Under the provisions of this new program, the California Community Colleges, in collaboration with
the California Department of Education, have prepared a strategy for high schools and community
colleges that seeks to support integrated four-year programs in order to improve articulation with
baccalaureate degree-granting programs, and that make recommendations on how to improve
career-technical opportunities for students.
The mission of the Economic Development Program at the CCS is to advance the state's economic
growth and global competitiveness through education, training, and services that contribute to
continuous workforce improvement, technology deployment and business development, consistent
with the state's regional economies. Under this program, the California Community Colleges work
with employers, advisory committees, and agency partners to identify, on a region-by-region basis,
workforce education and training needs, including the needs of small business. Key Economic
Development Program initiatives include:
• Advanced Transportation Technologies & Energy;
• Applied Biological Technologies; • Business & Workforce Performance
Improvement; • Environment, Health, Safety, and Homeland
Security;
• Regional Health Occupations Resource; • International Trade Development Centers; • Multimedia & Entertainment Initiative; • Small Business Development Centers; and • Workplace Learning.
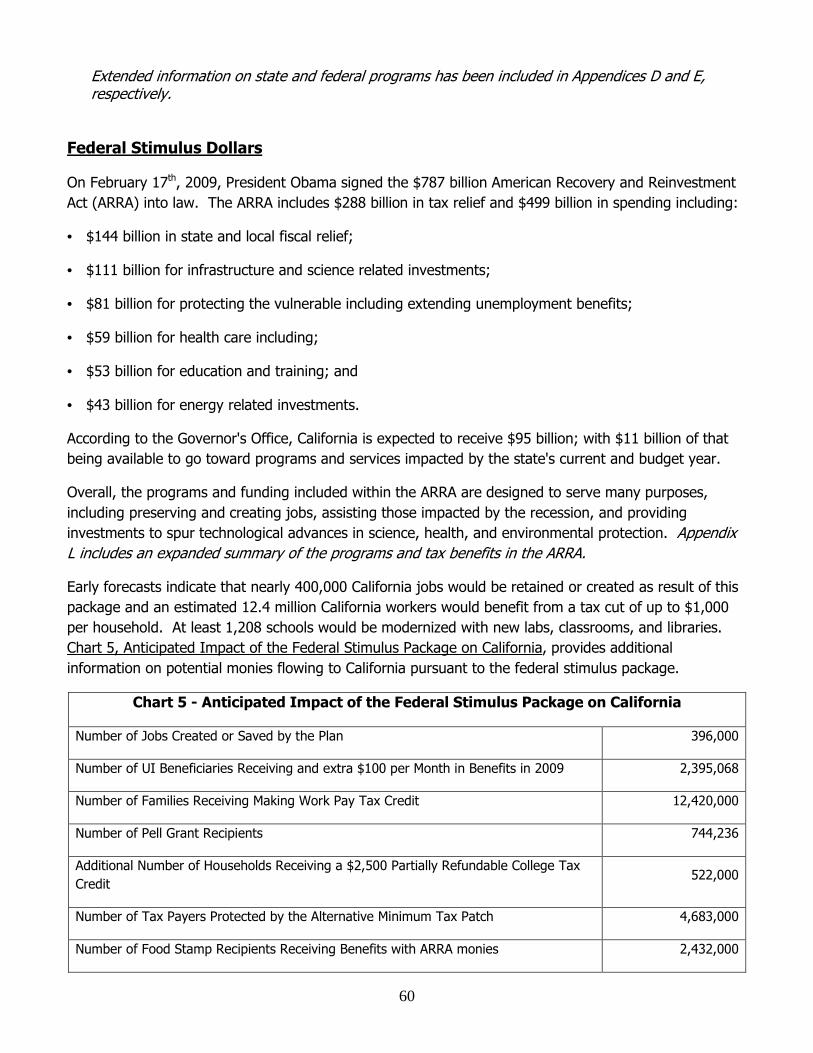
60
Extended information on state and federal programs has been included in Appendices D and E, respectively.
Federal Stimulus Dollars
On February 17th, 2009, President Obama signed the $787 billion American Recovery and Reinvestment
Act (ARRA) into law. The ARRA includes $288 billion in tax relief and $499 billion in spending including:
• $144 billion in state and local fiscal relief;
• $111 billion for infrastructure and science related investments;
• $81 billion for protecting the vulnerable including extending unemployment benefits;
• $59 billion for health care including;
• $53 billion for education and training; and
• $43 billion for energy related investments.
According to the Governor's Office, California is expected to receive $95 billion; with $11 billion of that
being available to go toward programs and services impacted by the state's current and budget year.
Overall, the programs and funding included within the ARRA are designed to serve many purposes,
including preserving and creating jobs, assisting those impacted by the recession, and providing
investments to spur technological advances in science, health, and environmental protection. Appendix
L includes an expanded summary of the programs and tax benefits in the ARRA.
Early forecasts indicate that nearly 400,000 California jobs would be retained or created as result of this
package and an estimated 12.4 million California workers would benefit from a tax cut of up to $1,000
per household. At least 1,208 schools would be modernized with new labs, classrooms, and libraries.
Chart 5, Anticipated Impact of the Federal Stimulus Package on California, provides additional
information on potential monies flowing to California pursuant to the federal stimulus package.
Chart 5 - Anticipated Impact of the Federal Stimulus Package on California
Number of Jobs Created or Saved by the Plan 396,000
Number of UI Beneficiaries Receiving and extra $100 per Month in Benefits in 2009 2,395,068
Number of Families Receiving Making Work Pay Tax Credit 12,420,000
Number of Pell Grant Recipients 744,236
Additional Number of Households Receiving a $2,500 Partially Refundable College Tax
Credit 522,000
Number of Tax Payers Protected by the Alternative Minimum Tax Patch 4,683,000
Number of Food Stamp Recipients Receiving Benefits with ARRA monies 2,432,000

61
Number of Children Eligible under Child Tax Credit 2,254,000
Total State Fiscal Stabilization Fund $4,850,845,144
Total Funding for Transportation Infrastructure $3,917,656,769
Total Medicaid Funding 1/09 to 1/11 $11,230,000,000
Total Law Enforcement Funding $229,263,500
Total Job Training Funding $494,426,343
Source: Office of Speaker Nancy Pelosi
The Legislative Analysts Office (LAO) released their analysis of the ARRA on Tuesday, March 10, 2009.
According to the LAO's analysis, of the approximately $330 billion expected to be available nationally to
states under the ARRA:
• Approximately $100 billion is expected to be available for expenditures that supplant or offset states'
General Fund spending;
• Approximately $130 billion is expected to be available to states to supplement or increase state
spending on certain specified programs; and
• Approximately, $100 billion is expected to be available to states on a competitive basis.
The LAO notes that all of these moneys are provided on a temporary basis and will be available, in
general, only for the next few years. Of this $330 billion available to states, the LAO estimates that
California's share will be approximately $31 billion. The state's health programs will be the largest
recipient of these federal funds receiving upwards of $9 billion, followed by $8 billion for education
related programs, $6 billion in labor and workforce development programs, and $3.5 billion for social
service programs.
The LAO recommends that the Legislature act quickly in a number of areas such as providing direction
on a preferred approach to distributing federal funds for transportation, and to take the next few months
to develop policies and strategies related to use of other federal program monies. The LAO also
recommends that the Legislature oversee individual agency's efforts in applying for competitive grants
and the use of supplemental federal funds and to assist local governments in their use of new federal
dollars. A copy of the LAO's analysis is available at www.lao.ca.gov.
Getting the Money Out
While the ARRA was signed on February 17, 2009, it still isn't clear how soon money will actually flow to
the states. Federal agencies are directed to allocate monies through five primary means:
• By formula. Examples include monies in the State Fiscal Stabilization Fund, the Highway Investment
Fund and Medicaid.
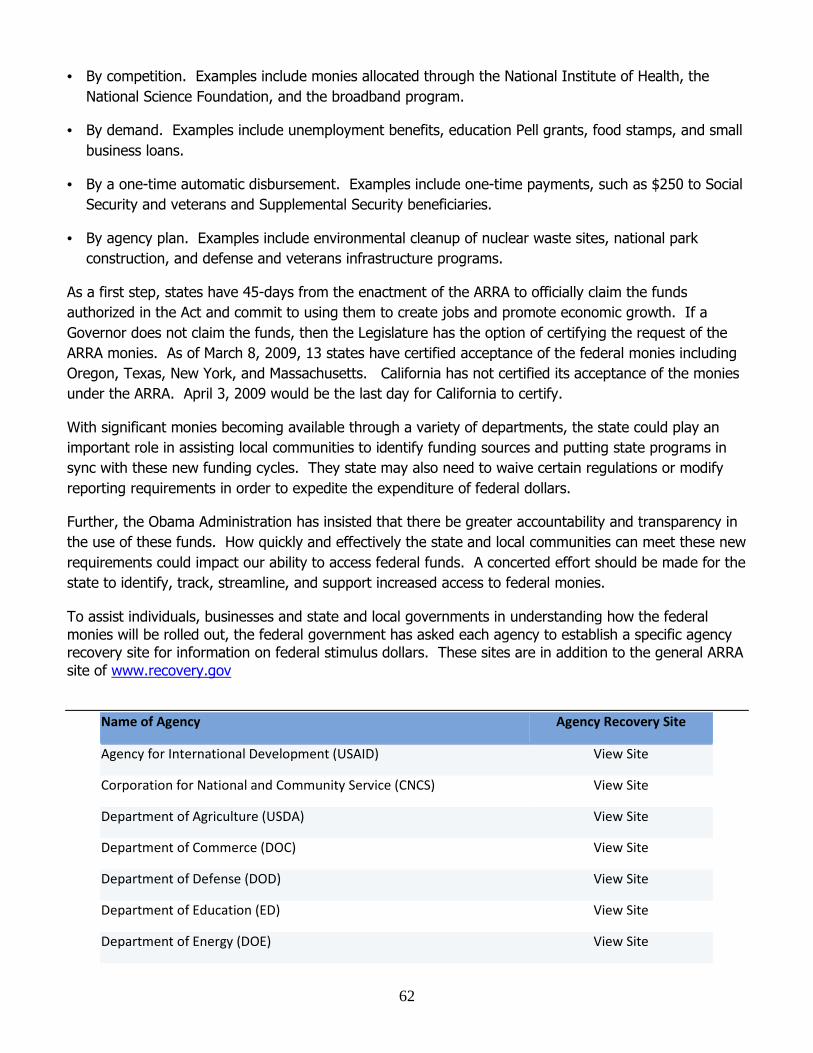
62
• By competition. Examples include monies allocated through the National Institute of Health, the
National Science Foundation, and the broadband program.
• By demand. Examples include unemployment benefits, education Pell grants, food stamps, and small
business loans.
• By a one-time automatic disbursement. Examples include one-time payments, such as $250 to Social
Security and veterans and Supplemental Security beneficiaries.
• By agency plan. Examples include environmental cleanup of nuclear waste sites, national park
construction, and defense and veterans infrastructure programs.
As a first step, states have 45-days from the enactment of the ARRA to officially claim the funds
authorized in the Act and commit to using them to create jobs and promote economic growth. If a
Governor does not claim the funds, then the Legislature has the option of certifying the request of the
ARRA monies. As of March 8, 2009, 13 states have certified acceptance of the federal monies including
Oregon, Texas, New York, and Massachusetts. California has not certified its acceptance of the monies
under the ARRA. April 3, 2009 would be the last day for California to certify.
With significant monies becoming available through a variety of departments, the state could play an
important role in assisting local communities to identify funding sources and putting state programs in
sync with these new funding cycles. They state may also need to waive certain regulations or modify
reporting requirements in order to expedite the expenditure of federal dollars.
Further, the Obama Administration has insisted that there be greater accountability and transparency in
the use of these funds. How quickly and effectively the state and local communities can meet these new
requirements could impact our ability to access federal funds. A concerted effort should be made for the
state to identify, track, streamline, and support increased access to federal monies.
To assist individuals, businesses and state and local governments in understanding how the federal monies will be rolled out, the federal government has asked each agency to establish a specific agency recovery site for information on federal stimulus dollars. These sites are in addition to the general ARRA site of www.recovery.gov
Name of Agency Agency Recovery Site
Agency for International Development (USAID) View Site
Corporation for National and Community Service (CNCS) View Site
Department of Agriculture (USDA) View Site
Department of Commerce (DOC) View Site
Department of Defense (DOD) View Site
Department of Education (ED) View Site
Department of Energy (DOE) View Site
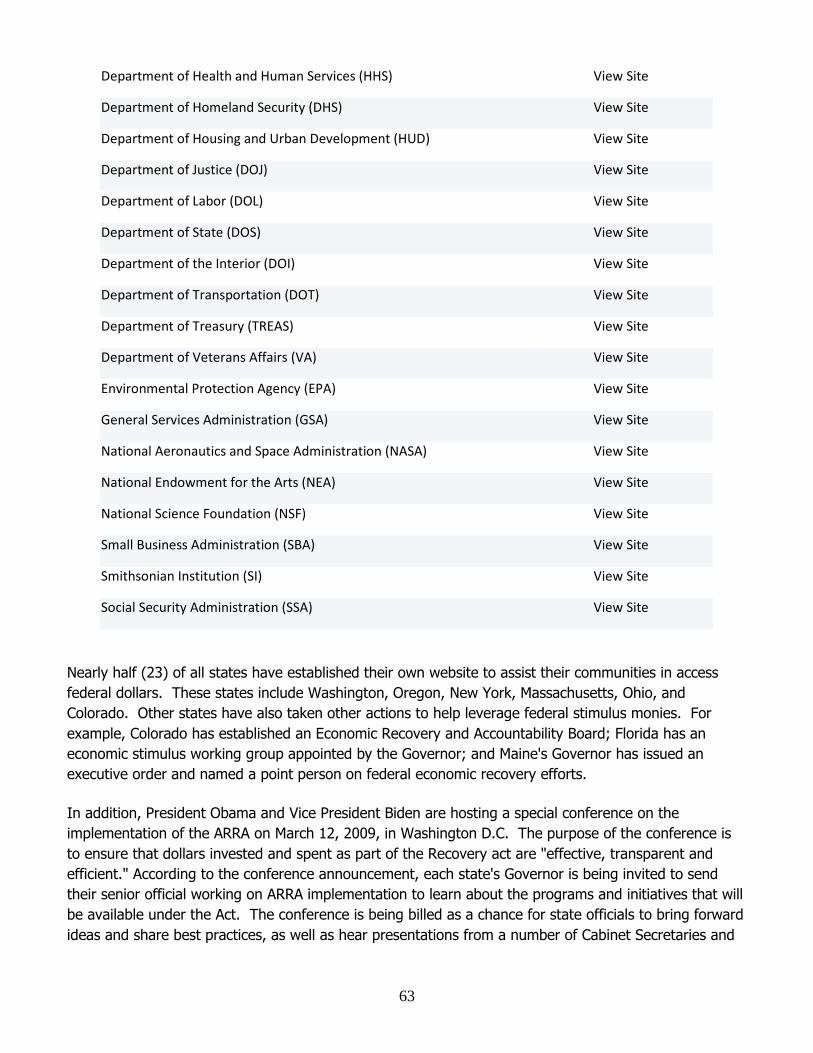
63
Department of Health and Human Services (HHS) View Site
Department of Homeland Security (DHS) View Site
Department of Housing and Urban Development (HUD) View Site
Department of Justice (DOJ) View Site
Department of Labor (DOL) View Site
Department of State (DOS) View Site
Department of the Interior (DOI) View Site
Department of Transportation (DOT) View Site
Department of Treasury (TREAS) View Site
Department of Veterans Affairs (VA) View Site
Environmental Protection Agency (EPA) View Site
General Services Administration (GSA) View Site
National Aeronautics and Space Administration (NASA) View Site
National Endowment for the Arts (NEA) View Site
National Science Foundation (NSF) View Site
Small Business Administration (SBA) View Site
Smithsonian Institution (SI) View Site
Social Security Administration (SSA) View Site
Nearly half (23) of all states have established their own website to assist their communities in access
federal dollars. These states include Washington, Oregon, New York, Massachusetts, Ohio, and
Colorado. Other states have also taken other actions to help leverage federal stimulus monies. For
example, Colorado has established an Economic Recovery and Accountability Board; Florida has an
economic stimulus working group appointed by the Governor; and Maine's Governor has issued an
executive order and named a point person on federal economic recovery efforts.
In addition, President Obama and Vice President Biden are hosting a special conference on the
implementation of the ARRA on March 12, 2009, in Washington D.C. The purpose of the conference is
to ensure that dollars invested and spent as part of the Recovery act are "effective, transparent and
efficient." According to the conference announcement, each state's Governor is being invited to send
their senior official working on ARRA implementation to learn about the programs and initiatives that will
be available under the Act. The conference is being billed as a chance for state officials to bring forward
ideas and share best practices, as well as hear presentations from a number of Cabinet Secretaries and
64
Administration officials, including Earl Devaney, Chairman of the Recovery Act Transparency and
Accountability Board.
"States have a huge responsibility in partnering with us to ensure that dollars spent as part of the
Recovery Act are spent wisely, with transparency and accountability," said Vice President Joe Biden.
"We're giving each state a chance to send a high-level representative to interact first-hand with top
officials here in Washington. Our hope for this conference is to meet face-to-face with the state officials
and streamline this implementation process so we can get our economy running again."
California's Efforts on Economic Recovery
As noted above, California has not certified its acceptance of federal dollars. The state does not have any unified website for tracking funding information. However, some state offices and departments have been active. The Office of the Small Business Advocate is hosting a bi-weekly teleconference with small businesses and advocates to share information on ARRA implementation. The federal Small Business Administration is a participant and continues to provide updates on how their agency will be rolling out the $730 million allocated to it in the ARRA.
At the California Green Jobs Council meeting on March 4, 2009, several state agencies presented orally on potential monies which could be available in the coming months. However, no related written materials were distributed.
The Business, Transportation, and Housing Agency has initiated the development of regional economic recovery strategies, based on Caltrans district boundaries. BT&H is providing technical assistance for developing a regional strategy, a guideline for preparing the regional strategy, and a sample format for the strategy. More information on the regional strategies can be found at: www.bth.ca.gov/pdf/bth_economic_recovery_work_plans.pdf
California communities could lose key opportunities to access federal dollars if the state does not take an active role in facilitating access to federal funding.

65
Section 5. Private Economic and Workforce Development
Resources
California is the home to some of the strongest and most innovative community development
organizations in the country. As international leaders in economic development best practices, to the
entrepreneurship revolution that launched Silicon Valley, to the foundation-based health care model,
Californians have defined and redefined best practices for community development best.
In designing a path forward, the state will again draw upon its public and private partners to maximize
funding, leverage new ideas, and deliver programs and services that meet the real needs of the people,
the businesses, and investors in the state.
This section identifies key partners for implementing the CA Economic Recovery Strategy. As an initial
draft, this is intended to be a starting place by bringing together long-time partners, as well as
identifying new partners in California's community development network. Suggestions for other
community partners can be forwarded to [email protected].
Partners in Improving Business Access to Capital
American Indian Chambers of Commerce of California: The primary goal of the American Indian
Chamber of Commerce of California is to provide opportunities for networking and support of American
Indian business people in California. http://www.aicccal.org/
Angel Capital Association: The Angel Capital Association is a peer organization of angel investing groups
in North America. The professional association focuses on networking and sharing of best practices
among these angel organizations. www.angelcapitalassociation.org
Business for Social Responsibility (BSR) BSR works to create a just and sustainable world by working with companies to promote more responsible business practices, innovation and collaboration. www.bsr.org
California Association of Enterprise Zones (CAEZ): CAEZ is a peer organization formed for the purpose of advancing the art and science of implementing economic development in Enterprise Zones. www.caez.org
Council of Development Financial Agencies (CDFA): CDFA is a national association dedicated to the advancement of development finance concerns and interests. CDFA represents public, private and nonprofit entities which focus on improving access to capital for small and mid-size businesses. http://www.cdfa.net/
Association of Financial Development Corporations (FDC): FDC represents ten of the eleven FDC's that are the delivery mechanisms for California's uniquely successful statewide Small Business Loan Guarantee Program. FDC has been promoting job creation, strengthening local economies and revitalizing communities.
66
California Association of Independent Business, Inc. (CAIB): CAIB is a non-partisan association of small
business owners who provide government leaders with information they will need to make good
decisions for businesses, citizens, and the economy. CAIB's primary objective is to make small business
people aware of legislation that will impact the small business community. www.caib.net
California Association for Local Economic Development (Caled): Caled is the statewide professional economic development organization dedicated to advancing its members’ ability to achieve excellence in delivering economic development services to their communities and business clients. CALED's membership consists of public and private organizations and individuals involved in economic development: the business of creating and retaining jobs. www.caled.org
California Black Chamber of Commerce (CBCC): CBCC is the largest African American non-profit
business organization representing hundreds of small and emerging businesses, affiliates and chambers
of commerce throughout the state. http://www.calbcc.org/
California Hispanic Chambers of Commerce (CAHCC): CAHCC is a network of over 65 local Hispanic chamber and business associations whose mission is to represent the interests of the 600,000 Hispanic-owned businesses in California. http://www.cahcc.com/
California League of Cities (League): The League is an association of California city officials who work
together to enhance their knowledge and skills, exchange information, and combine resources so that
they may influence policy decisions that affect cities. http://www.cacities.org/index.jsp
California Small Business Association (CSBA): CSBA is a volunteer-driven nonprofit organization that
advocates on behalf of small businesses at the state and federal level, conducts research on issues and
develops policies that benefit small businesses. That work includes acting as a liaison between the
legislature and members, and helping members grow their businesses. www.csba.com
California Small Business Alliance (CSBA): CSBA is a non-partisan coalition of California trade associations
committed to providing small businesses with a single constructive voice before air quality management
districts and other environmental regulatory agencies. www.calsmallbusinessalliance.org
Community Development Venture Capital Alliance (CDVCA): CDVCA promotes the use of venture capital tools to create jobs, entrepreneurial capacity and wealth to advance both the livelihoods of low-income people and the economies of distressed communities. www.cdvca.org
Coalition for Environmentally Responsible Economies (CERES): CERES encourages corporate environmental responsibility by working with companies to help them meet their commitments, promoting environmental reporting and mobilizing their network in activist projects. www.ceres.org
Environmental Entrepreneurs (E2): Environmental Entrepreneurs (E2) is a national community of business people who believe in protecting the environment while building economic prosperity. Working with NRDC (Natural Resources Defense Council), E2 serves as a champion on the economic side of good environmental policy. www.environmentalentrepreneurs.org
Federal Technology Center (FTC): FTC's mission is to promote economic development by facilitating
technology transfer between government and the private sector, and by helping small businesses
successfully compete for government contracts. www.theftc.org/index.html
67
The Keiretsu Forum: The Keiretsu Forum is the world’s largest angel investor network with 750
accredited investor members throughout seventeen chapters on three continents.
http://www.k4forum.com/
National Federation of Independent Businesses (NFIB): NFIB is a nonprofit, nonpartisan organization
that represents small and independent businesses. NFIB's mission is to promote and protect the right of
our members to own, operate and grow their businesses. By pooling the purchasing power of its
members, the National Federation of Independent Business gives members access to many business
products and services at discounted costs. http://www.nfib.com/page/home
The National Association of Small Business Investment Companies (NASBIC): The NASMIC is the
professional association for the SBIC industry and the oldest organization of venture capitalists in the
world. For half a century NASBIC has played a pivotal role in building, maintaining, and promoting a
strong and profitable SBIC industry to better serve the growth-capital needs of America’s small
businesses. www.naic.org
National Small Business Association (NSBA): NSBA is a national nonprofit membership organization and
represents America's Small Business Companies and Entrepreneurs. NSBA represents all sectors and
industries of the U.S. economy from retail to trade to technology. NSBA advocates on their behalf before
the Executive Branch, the Small Business Administration, Congress, and state regulatory and legislative
bodies. www.nsba.biz/index.shtm
The New America Alliance (NAA): The NAA is organization of American Latino business leaders
committed to leading the process of Latino empowerment and wealth-building by expanding the forms
of capital most crucial for economic advancement, including economic capital, political capital, human
capital, and philanthropy http://www.naaonline.org/
National Small Business Association (NSBA): The NSBA is a national trade association representing
150,000 small businesses. http://www.nsba.biz/
Research Initiative on Social Entrepreneurship (RISE): RISE is a research project at Columbia Business School that studies and disseminates knowledge about the markets, metrics and management of for-profit and nonprofit social enterprise and social venturing. www.riseproject.org
Social Investment Forum: Social Investment Forum is a national, nonprofit membership organization promoting the concept, practice and growth of socially responsible investing. www.socialinvest.org
Small Business California (SB-Cal): SB-Cal is a proactive, non-partisan business advocacy organization
whose agenda is the well being of California small businesses and intends to be responsive to the needs
of California small business owners. http://www.smallbusinesscalifornia.org/index.htm
Partners in Targeting Infrastructure Projects Linked to Economic Development
California Association for Local Economic Development (Caled): Caled is the statewide professional economic development organization dedicated to advancing its members’ ability to achieve excellence in delivering economic development services to their communities and business clients. CALED's membership consists of public and private organizations and individuals involved in economic development. www.caled.org
68
Association of Metropolitan Planning Agencies (AMPA): AMPA is a National network of 385 organizations established through federal transportation law to serve as the lead transportation planning organizations for areas with a population over 50,000. http://www.ampo.org/index.php
California State Association of Counties (CSAC): CSAC represents the 58 county governments before the California Legislature, administrative agencies and the federal government. http://www.csac.counties.org/
Regional Council of Rural Counties (RCRC): RCRC is a council comprised of one county supervisor from
each of California's rural counties. RCRC is dedicated to representing the collective, unique interests of
its membership, providing legislative and regulatory representation at the State and Federal levels, and
providing services to its members which will enhance and protect the quality of life in rural California
counties. http://www.rcrcnet.org/index.html
California League of Cities (League): The League is an association of California city officials who work
together to enhance their knowledge and skills, exchange information, and combine resources so that
they may influence policy decisions that affect cities. http://www.cacities.org/index.jsp
Partners in Expediting Workforce Services and Training Opportunities
California Workforce Association (CWA): CWA is a membership organization that develops public policy
strategies and builds local capacity to address critical workforce issues. CWA represents the 49
Workforce Investment Boards, over 200 One-Stop Career Centers and other workforce development
partners in California. http://www.calworkforce.org/
California EDGE Campaign: The California Edge Campaign is a non-partisan coalition of major employers, educators, regional workforce development leaders, labor, and industry associations committed to the belief that California’s economic growth depends on increasing the skills of its workers. Its mission is to influence state workforce education, training, and related policies and practices to address employers' need for a skilled workforce and provide opportunities for all California residents. http://www.californiaedgecampaign.org/index.php
California State Association of Counties (CSAC): CSAC represents the 58 county governments before the California Legislature, administrative agencies and the federal government. http://www.csac.counties.org/
The New America Alliance (NAA): The NAA is organization of American Latino business leaders
committed to leading the process of Latino empowerment and wealth-building by expanding the forms
of capital most crucial for economic advancement, including economic capital, political capital, human
capital, and philanthropy. http://www.naaonline.org/
Partners in Enhancing Local and Regional Community Development Capacity
California Association for Local Economic Development (Caled): Caled is the statewide professional economic development organization dedicated to advancing its members’ ability to achieve excellence in delivering economic development services to their communities and business clients. CALED's membership consists of public and private organizations and individuals involved in economic development. www.caled.org

69
California Association of Enterprise Zones (CAEZ): CAEZ is a peer organization formed for the purpose of advancing the art and science of implementing economic development in Enterprise Zones. www.caez.org
California Black Chamber of Commerce (CBCC): CBCC is the largest African American non-profit
business organization representing hundreds of small and emerging businesses, affiliates and chambers
of commerce throughout the state. . http://www.calbcc.org/
California Hispanic Chambers of Commerce (CAHCC): CAHCC is a network of over 65 local Hispanic chamber and business associations whose mission is to represent the interests of the 600,000 Hispanic-owned businesses in California. http://www.cahcc.com/
California Community Development Association (CCDA): CCDA is a statewide association comprised of
organizations actively engaged in revitalizing California's neighborhoods, including local governments and
resident driven community development corporations, community action agencies, and faith based
institutions. http://www.cceda.com/
California League of Cities (League): The League is an association of California city officials who work
together to enhance their knowledge and skills, exchange information, and combine resources so that
they may influence policy decisions that affect cities. http://www.cacities.org/index.jsp
California State Association of Counties (CSAC): CSAC represents the 58 county governments before the
California Legislature, administrative agencies and the federal government.
http://www.csac.counties.org/
National Association of Regional Councils (NARC): NARC is a national network of 520 multi -jurisdictional
local government-based planning and development organizations, including the network of 380 EDA
designated districts. http://www.narc.org/
Regional Council of Rural Counties (RCRC): RCRC is a council comprised of one county supervisor from
each California's rural counties. RCRC is dedicated to representing the collective, unique interests of its
membership, providing legislative and regulatory representation at the State and Federal levels, and
providing services to its members which will enhance and protect the quality of life in rural California
counties. http://www.rcrcnet.org/index.html
TeamCalifornia: TeamCalifornia is a private, non-profit California membership-based corporation that
brings together economic development organizations from across the state to market their communities
for business investment and job creation in California. TeamCalifornia’s members are important
advocates and resources for business development in California. http://www.teamca.org/index.php
Partners in Ensuring All Californians Participate in the State’s Recovery Efforts
California Hispanic Chambers of Commerce (CAHCC): CAHCC is a network of over 65 local Hispanic chamber and business associations whose mission is to represent the interests of the 600,000 Hispanic-owned businesses in California. http://www.cahcc.com/
70
California Black Chamber of Commerce (CBCC): CBCC is the largest African American non-profit
business organization representing hundreds of small and emerging businesses, affiliates and chambers
of commerce throughout the state. . http://www.calbcc.org/
American Indian Chambers of Commerce of California: The primary goal of the American Indian
Chamber of Commerce of California is to provide opportunities for networking and support of American
Indian business people in California. http://www.aicccal.org/
Regional Council of Rural Counties (RCRC): RCRC is a council comprised of one county supervisor from
each California's rural counties. RCRC is dedicated to representing the collective, unique interests of its
membership, providing legislative and regulatory representation at the State and Federal levels, and
providing services to its members which will enhance and protect the quality of life in rural California
counties. http://www.rcrcnet.org/index.html
California League of Cities (League): The League is an association of California city officials who work
together to enhance their knowledge and skills, exchange information, and combine resources so that
they may influence policy decisions that affect cities. http://www.cacities.org/index.jsp
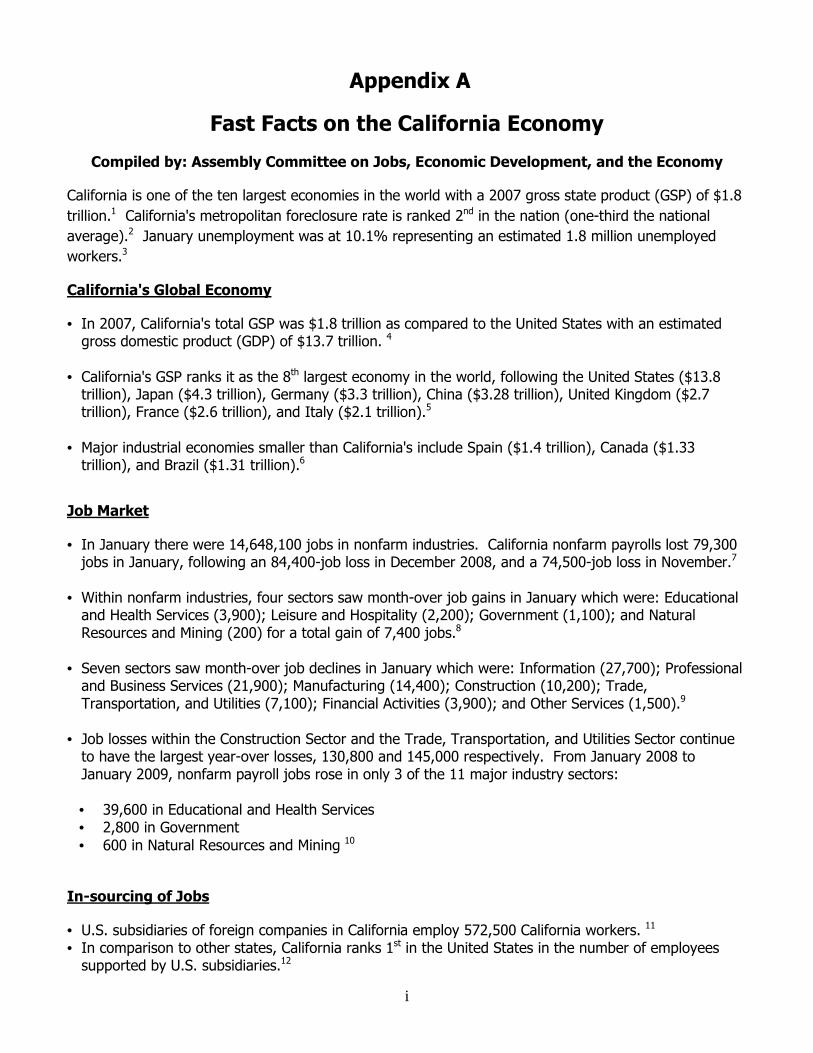
i
Appendix A
Fast Facts on the California Economy
Compiled by: Assembly Committee on Jobs, Economic Development, and the Economy
California is one of the ten largest economies in the world with a 2007 gross state product (GSP) of $1.8
trillion.1 California's metropolitan foreclosure rate is ranked 2nd in the nation (one-third the national
average).2 January unemployment was at 10.1% representing an estimated 1.8 million unemployed
workers.3
California's Global Economy
• In 2007, California's total GSP was $1.8 trillion as compared to the United States with an estimated gross domestic product (GDP) of $13.7 trillion. 4
• California's GSP ranks it as the 8th largest economy in the world, following the United States ($13.8
trillion), Japan ($4.3 trillion), Germany ($3.3 trillion), China ($3.28 trillion), United Kingdom ($2.7 trillion), France ($2.6 trillion), and Italy ($2.1 trillion).5
• Major industrial economies smaller than California's include Spain ($1.4 trillion), Canada ($1.33
trillion), and Brazil ($1.31 trillion).6
Job Market
• In January there were 14,648,100 jobs in nonfarm industries. California nonfarm payrolls lost 79,300 jobs in January, following an 84,400-job loss in December 2008, and a 74,500-job loss in November.7
• Within nonfarm industries, four sectors saw month-over job gains in January which were: Educational
and Health Services (3,900); Leisure and Hospitality (2,200); Government (1,100); and Natural Resources and Mining (200) for a total gain of 7,400 jobs.8
• Seven sectors saw month-over job declines in January which were: Information (27,700); Professional
and Business Services (21,900); Manufacturing (14,400); Construction (10,200); Trade, Transportation, and Utilities (7,100); Financial Activities (3,900); and Other Services (1,500).9
• Job losses within the Construction Sector and the Trade, Transportation, and Utilities Sector continue
to have the largest year-over losses, 130,800 and 145,000 respectively. From January 2008 to January 2009, nonfarm payroll jobs rose in only 3 of the 11 major industry sectors:
• 39,600 in Educational and Health Services • 2,800 in Government • 600 in Natural Resources and Mining 10
In-sourcing of Jobs
• U.S. subsidiaries of foreign companies in California employ 572,500 California workers. 11 • In comparison to other states, California ranks 1st in the United States in the number of employees
supported by U.S. subsidiaries.12
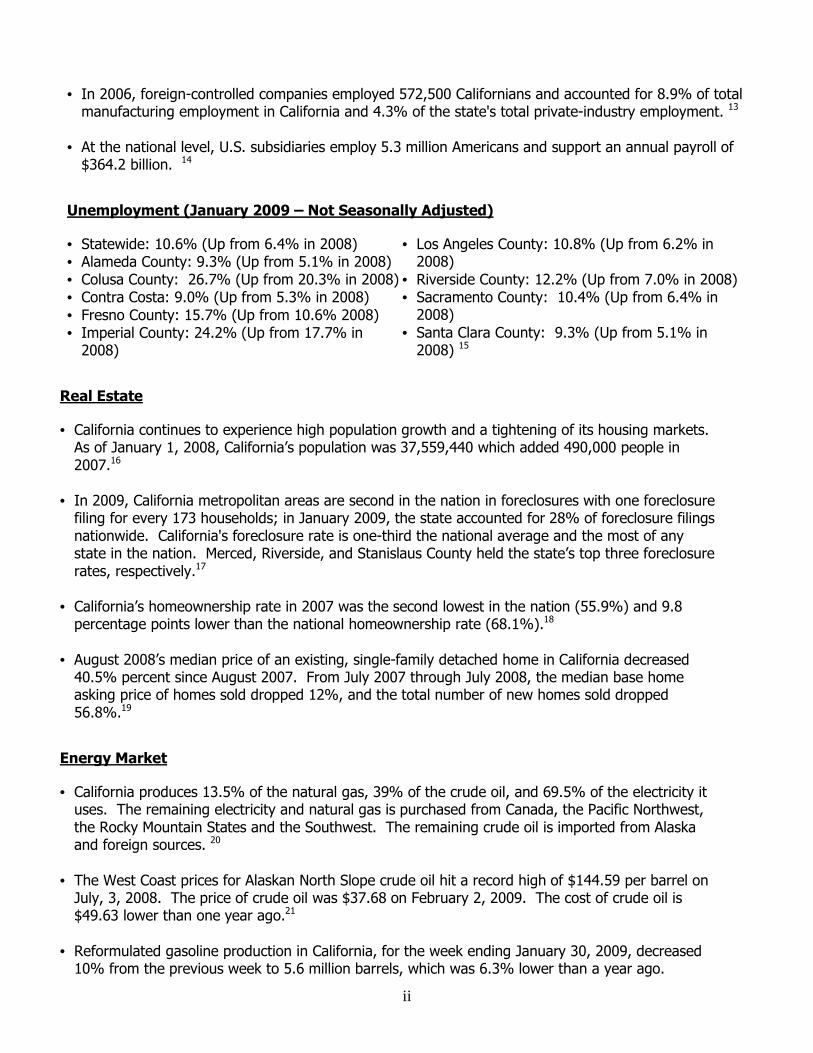
ii
• In 2006, foreign-controlled companies employed 572,500 Californians and accounted for 8.9% of total
manufacturing employment in California and 4.3% of the state's total private-industry employment. 13 • At the national level, U.S. subsidiaries employ 5.3 million Americans and support an annual payroll of
$364.2 billion. 14
Unemployment (January 2009 – Not Seasonally Adjusted)
• Statewide: 10.6% (Up from 6.4% in 2008) • Alameda County: 9.3% (Up from 5.1% in 2008) • Colusa County: 26.7% (Up from 20.3% in 2008) • Contra Costa: 9.0% (Up from 5.3% in 2008) • Fresno County: 15.7% (Up from 10.6% 2008) • Imperial County: 24.2% (Up from 17.7% in
2008)
• Los Angeles County: 10.8% (Up from 6.2% in 2008)
• Riverside County: 12.2% (Up from 7.0% in 2008) • Sacramento County: 10.4% (Up from 6.4% in
2008) • Santa Clara County: 9.3% (Up from 5.1% in
2008) 15
Real Estate
• California continues to experience high population growth and a tightening of its housing markets. As of January 1, 2008, California’s population was 37,559,440 which added 490,000 people in 2007.16
• In 2009, California metropolitan areas are second in the nation in foreclosures with one foreclosure
filing for every 173 households; in January 2009, the state accounted for 28% of foreclosure filings nationwide. California's foreclosure rate is one-third the national average and the most of any state in the nation. Merced, Riverside, and Stanislaus County held the state’s top three foreclosure rates, respectively.17
• California’s homeownership rate in 2007 was the second lowest in the nation (55.9%) and 9.8
percentage points lower than the national homeownership rate (68.1%).18 • August 2008’s median price of an existing, single-family detached home in California decreased
40.5% percent since August 2007. From July 2007 through July 2008, the median base home asking price of homes sold dropped 12%, and the total number of new homes sold dropped 56.8%.19
Energy Market
• California produces 13.5% of the natural gas, 39% of the crude oil, and 69.5% of the electricity it uses. The remaining electricity and natural gas is purchased from Canada, the Pacific Northwest, the Rocky Mountain States and the Southwest. The remaining crude oil is imported from Alaska and foreign sources. 20
• The West Coast prices for Alaskan North Slope crude oil hit a record high of $144.59 per barrel on
July, 3, 2008. The price of crude oil was $37.68 on February 2, 2009. The cost of crude oil is $49.63 lower than one year ago.21
• Reformulated gasoline production in California, for the week ending January 30, 2009, decreased
10% from the previous week to 5.6 million barrels, which was 6.3% lower than a year ago.
iii
Inventories for California reformulated gasoline also decreased during the same period by 3.8%. 22
California's Innovation Economy
• California ranks 4th among 50 states in state science and technology. Other top states include Massachusetts (1st), Maryland (2nd), Colorado (3rd), and Washington (5th). The index ranks states based on research and development dollars, number of patents issued, venture capital investment, and business starts.23
• California ranks 1st among 50 states for patents issued in 2007 when 22,601 total patents were
granted. Other top performing states include Texas (6,228 patents), New York (6,025 patents), Washington (3,894 patents), and Massachusetts (3,837 patents).24
• California ranks 1st in start-ups and 1st in new branches in high-tech manufacturing. Other top
ranking states include Texas, Florida, New York, and Michigan for start-ups and Texas, Florida, Georgia, and New York in new branches.25
• The University of California ranks 2nd, with Caltech ranking 3rd and Stanford ranking 4th, among all
universities in the U.S. for the ability to transfer intellectual property (biotech research and patents) into commercial uses. These rankings are demonstrated in the Technology Transfer and Commercialization Index. Other top ranking universities include MIT (1st) and University of Florida (5th).26
California Trade and Foreign Investment Activity
• Exports from California accounted for 12% of total U.S. exports in 2007.27 • California receives more foreign direct investment than any other U.S. state.28 • California's export shipments of merchandise in 2008 totaled $144.8 billion, ranking California
second only to Texas ($192.1 billion) among the states in terms of total exports of products.29 If the value of services were added to the export of profit, it is likely that California would rank first in total exports.30
• California exported to 222 foreign destinations in 2007, and the State leads the nation in export-
supported jobs with one in seven jobs related to trade.31 • Small and medium-sized firms generated more than two-fifths (44%) of California's total exports of
merchandise in 2006.32 • California's top three export markets in 2008 were Mexico, Canada, and Japan, respectively.33 • In 2008, the state's leading export category was computers and electronic products, representing
29% ($41.7 billion) of California's total merchandise exports.34

iv
Appendix B
v
Appendix C
Programmatic Changes Necessary to Implement the Strategy
Implementation of the CA Economic Stimulus Strategy will require a coordinated effort to
create new and modify existing policies, programs, and services to address the current
economic crisis. Below is a list of necessary programmatic changes.
Changes in State Programs and Services
• Qualified Financial Intermediary. Statutorily define a qualified financial institution and require HCD
to only enter contracts for administering a loan program with entities that are either a qualified
financial intermediary or contract with a qualified financial intermediary to administer the monies.
Proposed Changes to Federal Programs and Services
• Expedite SBA Small Business Loans. Create a streamlined SBA 7(a) loan program with up to 95%
government guarantee for small business loans up to $500,000 and reduced lender and borrower
fees that will provide greater small business capital in expedited manner to start, or grow a small
business and create jobs. Improve access to commercial loans by increasing the government
guarantee percentage on SBA 7A, reduce qualification standards, eliminate loan fees, and
incrementally forgive the SBA portion of 504 loans for each quality job created with healthcare
benefits. (St. Josephs Area Chamber of Commerce in testimony before the House Committee on
Small Business)
• Remove Local and State Match Requirements: Enhance credit access for entrepreneurs through
the expansion of local “Revolving Loan Programs” funded through SBA grants by lowering the local
match requirement. (St. Josephs Area Chamber of Commerce in testimony before the House
Committee on Small Business)
• Provide Flexibility of S Corporation: Key modifications to organization and structure of S
Corporations include:
• Increasing the maximum number of allowable S corporation shareholders to 150 from 100.
• Allowing IRAs as eligible S corporation shareholders.
• Permitting the issuance of preferred stock for all S corporations. (Independent Community
Bankers of America)
• Small Business Exemptions: Reduce excessive auditing standards for small businesses with less
than 50 employees by exempting them from Section 404 of the Sarbanes-Oxley Act. (St. Josephs
Area Chamber of Commerce in testimony before the House Committee on Small Business)

vi
• Increase Access to Private Debt: Require banks that receive TARP funds to dedicate at least 25%
of those funds to small business loans.
vii
• Appendix D
Summary of Selected State Economic and Workforce Investment Programs
Below are brief descriptions of several of California's economic and workforce development programs available at the state level. This listing is intended to provide a basic representation of the types of programs and services that are available to businesses in California. For a complete listing of state programs and services, please refer to the Catalog of State Economic and Workforce Development Programs developed by JEDE in 2007. The Catalog is available through the JEDE Committee office and from its website located at www.assembly.ca.gov. California’s economic and workforce investment programs are spread across several governmental agencies and entities.
Workforce Development and Business Assistance
California Workforce Investment Board (CWIB)
CWIB was formed to assist the State of California in complying with the federal Workforce Investment Act of 1998. CWIB’s goals, as described in its strategic plan, are to “achieve sustainable economic growth, meet the demands of global competition in the modern economy, and improve the quality of life for all Californians.” To meet these goals, CWIB and local workforce investment boards throughout the state work with stakeholder groups consisting of private businesses and public entities. CWIB’s mission focuses on providing employment training with strong job prospects and to connect employers with job seekers. More information on the CWIB and the local workforce investment boards may be found at: www.calwia.org.
California Employment Training Panel (ETP)
Established in 1983, the ETP is a business- and labor-supported state agency that funds job skills training to provide workers with jobs that have good pay potential and long-term usefulness. ETP is governed by a seven-member panel appointed by the Governor and Assembly and Senate Leadership. ETP uses the Employment Training Fund for their training programs. Monies in the Employment Training Fund are provided by one-tenth of 1% of unemployment insurance wages paid by every private, for-profit employer in the state, as well as some non-profits, amounting to no more than $7.00 per covered employee per year. Research has shown that for every $1.00 invested in the ETP Program $5.00 is returned in economic benefits. More information regarding the ETP may be found at: www.etp.ca.gov
California One-Stop Career Centers
The One-Stop Career Center (One-Stop Center) system is a statewide network of centers that provide employment, education, and training services all in one location. The One-Stop Centers work with public and private non-profit partners to provide their services. Some One-Stop Centers have all of their partners on site, and some do not. However, all partners are community-based and easily accessible to workers, job seekers, and businesses.
viii
California Business Portal
This state government website provides links to a wide range of information for businesses, including establishing a business, growing an existing business, exporting goods, foreign investment, doing business with government, key industries information, and Internet links to relevant public and private entities that provide other services to businesses. The Internet address for the California Business Portal is: www.calbusiness.ca.gov.
Small Business Development Centers
Small Business Development Centers (SBDC) provide free services to business clients to assist them in achieving their global market goals. SBDCs provide basic business development assistance at 46 locations throughout the state. These centers are funded by the U.S. Small Business Administration, the Chancellor's Office of California Community Colleges, and donations from business and other academic institutions. More information may be found at: www.calbusiness.ca.gov/cedpgybsbdc.asp
Infrastructure Development and Goods Movement
Goods Movement Plan
This effort, led by BT&H and CalEPA, is intended to improve the movement of goods in California. This plan aims to facilitate business growth in both the near and long term by promoting infrastructure improvements and developing strategies to maximize the ability of businesses to import, export, and distribute goods using California’s roadways, ports, rails, and other modes of transport. In January 2007, the Phase II Goods Movement Plan was published which provided a statewide action plan for goods movement. More information on funding priorities may be found at: www.arb.ca.gov/gmp/gmp.htm.
Metropolitan Planning Organizations
A Metropolitan Planning Organization (MPO) is an organization of elected officials in urbanized regions with a population of over 50,000. MPOs provide a forum for local decision-making on transportation issues of a regional nature. Under TEA-21, the MPOs objective is to "encourage and promote the development of transportation systems embracing various modes of transportation in a manner which will efficiently maximize the mobility of people and goods within and through urbanized areas and minimize transportation-related fuel consumption and air pollution." As a condition for receipt of federal capital or operating assistance, MPOs must have a continuing, cooperative and comprehensive transportation planning process. The MPOs are to cooperate with the state in developing transportation plans and programs for urbanized areas. This transportation planning process is to result in plans and programs consistent with the urbanized area's comprehensive planned development. In addition, the plans are to provide for the development of transportation facilities (including pedestrian walkways and bicycle facilities) and serve as an intermodal system for the state, metropolitan areas and the nation. More information on funding priorities may be found at:
http://www.dot.ca.gov/hq/tpp/offices/orip/index_files/MPOs_and_RTPAs_Contact_List.pdf
ix
The California Infrastructure and Economic Development Bank (I-Bank)
The I-Bank was created to promote economic revitalization, enable future development, and encourage a healthy climate for jobs in California. The I-Bank has the authority to issue tax-exempt and taxable revenue bonds I-Bank administered programs include: the Infrastructure State Revolving Fund Program; the Industrial Development Revenue Bond Program; the Infrastructure & Community 501(c)(3) Revenue Bond Program; and, the Exempt Facility Revenue Bond Program. More information may be found at: www.ibank.ca.gov
General Business Promotion
California Government: Online to Desktops (CalGOLD)
Contained within CalEPA, CalGOLD is an Internet portal for businesses to access information about environmental, regulatory, and permitting requirements. CalGOLD does not issue licenses or permits but provides assistance for businesses in determining permitting and licensing requirements and provides contact information for the appropriate permitting or licensing agency. More information is available at: www.calgold.ca.gov.
California Business Investment Services (CalBIS)
Contained within the California Labor and Workforce Development Agency, CalBIS “serves employers, corporate real estate executives, and site location consultants considering California for new business investment and expansion.” Among its services, CalBIS provides site selection services, information on international trade, workforce services, labor market data, and guides for businesses, including “California Investment Guide: an Overview of Advantages, Assistance, Taxes and Permits” and “Setting Up Business in California: a Guide for Investors.” More information may be found at: www.labor.ca.gov/calBIS/.
Small Business Loan and Guarantee Program (SBLGP)
The SBLGP Program was established to assist small businesses obtain term loans or lines of credit when they cannot otherwise qualify for these types of credit on their own. The State, working through eleven financial development Centers, guarantees that a qualifying small business borrower's loan is guaranteed in the event the borrower defaults. Loan terms and interest rates are negotiated between the borrower and the lender. More information may be found at: www.leginfo.ca.gov/cgi-bin/displaycode?section=corp&group=14001-15000&file=14055-14060.6
Direct Farm Loan Program
The Direct Farm Loan Program provides loans to family farms for crop production, harvest loans, farm ownership, farm improvements or equipment acquisition. The loans must be eligible for guarantee by the U.S. Department of Agriculture’s Farm Services Agency. Whereas small business loan guarantees are made with the approval of the Financial Development Corporation's Board of directors, loans made in the Direct Farm Loan Program must receive approval from the Farm Services Agency prior to the Financial Development Corporation's approval. More information may be found at: www.leginfo.ca.gov/cgi-bin/displaycode?section=corp&group=14001-15000&file=14070-14076
x
Community Development Block Grant Program
The Department of Housing and Community Development administers the small cities portion of the federal Community Development Block Grant (CDBG) Program. Large and medium sized municipalities are provided with direct allocations from the federal Housing and Urban Development Department. Counties with fewer than 200,000 residents in unincorporated areas and cities with fewer than 50,000 residents that are not participants in the federal CDBG Program compete for program dollars. Each year the CDBG Program makes funds available to eligible jurisdictions through several allocations including: General, Native American and Colonias; Economic Development – Over the Counter; Economic Development – Enterprise; and, Planning and Technical Assistance allocations. Due to the flexibility of the program, most of these allocations are significantly over subscribed. More information may be found at: www.hcd.ca.gov/fa/cdbg/Enterprise.html
Sustainable Communities Grant and Loan program
The Sustainable Communities Grant and Loan Program, administered by the California Pollution Control Financing Authority, assists cities and counties to develop and implement sustainable community growth policies, programs and projects. The Program has funded specific plans, alternative transportation studies, finance plans, redevelopment plans, engineering studies, public projects, and other efforts that promote sustainable development policies. More information may be found at: www.treasurer.ca.gov/cpcfa/scgl/summary.pdf
California Capital Access Program
Administered by the California Pollution Control Financing Authority, the California Capital Access Program (CalCAP) is chaired by the State Treasurer. CalCAP encourages banks and other financial institutions to make loans to small businesses that fall just outside of most banks’ conventional underwriting standards. Eligible businesses must be in one of the industries in the Standard Industry Classification codes list and meet specified standards for conducting business in California. The business activity resulting from the loan must be created and retained in California, and must meet federal Small Business Administration classification guidelines or have fewer than 500 employees. More information may be found at: www.treasurer.ca.gov/cpdfa/calcap.htm.3.
Geographically-Targeted Economic Development Programs
Geographically-Targeted Economic Development Areas
The Enterprise Zone (EZ) Program and the other geographically-targeted economic development areas (G-TEDAs) are among the largest state economic development programs in California. The Department of Housing and Community Development (HCD) administers four G-TEDA programs including: EZs, Manufacturing Enhancement Areas (MEAs), Local Agency Military Base Realignment Areas (LAMBRAs), and one Targeted Tax Area (TTA). Under the G-TEDA programs, businesses and other entities located within targeted areas are eligible for a variety of local and state provided incentives. Local governments often write down the costs of development. They may also fund related infrastructure improvements, provide job training to prospective employees, or establish a streamlined process of obtaining permits. Additionally, the state offers a number of incentives, including: tax credits; special tax provisions; priority notification when selling state surplus lands; access to certain brownfield clean-up programs; and, preferential treatment for state contracts. More information may be found at: www.caez.org
xi
Community Redevelopment Project Areas
The California Constitution provides for the establishment of community redevelopment project areas and the issuance of property tax increment bonds. Areas are selected by a local community based on specific conditions of blights. RDAs have special authorities and responsibilities within project areas for the purpose of eliminating blight and increasing property values and the community's quality of life. Once established, prescribed portions of any increases in property taxes from within the project area are available to the RDA to finance the implementation of the approved redevelopment plan. More information may be found at: http://www.calredevelop.org//AM/Template.cfm?Section=Home
Recycling Market Development Zones
The Recycling Market Development Zone (RMDZ) program, administered through the Integrated Waste Management Board, offers assistance to support new businesses, expand existing ones, create jobs, and divert waste from landfills. Businesses located in a Recycling Market Development Zone that use materials in the waste stream to manufacture their products have a variety of assistance available, including low interest loans, technical assistance, and free product marketing. The zones cover roughly 71,790 square miles of California from the Oregon border to San Diego. More information on the program can be found at: www.ciwmb.ca.gov/RMDZ/AllZones.asp
Foreign Trade Zones (FTZ)
FTZs are areas where goods may be imported without submitting to all U.S. Customs rules or tariffs and are intended to promote U.S. participation in trade and retain domestic employment that might otherwise go to foreign countries. These zones are established by the federal government with authorizing state statutes in the California Government Code (sections 6300 to 6305). California has 17 general purpose FTZs out of 234 zones in the U.S. More information may be found at: www.labor.ca.gov/calBIS/cbforeigntradezones.pdf and www.cbp.gov/xp/cgov/import/cargo_control/ftz/.
Empowerment Zones
Federal tax law that authorizes the issuance Empowerment Zone Bonds (EZ Bonds) by the California Industrial Development Financing Advisory Commission. The EZ Bond Program is intended to augment the benefits of the Industrial Development Bond (IDB) Program by providing additional support for economic development to the most distressed communities in California. The EZ Bond Program expands the eligibility of the state IDB Program to manufacturers, retailers, and any service business that operates in a federal Empowerment Zone. There are currently four federal Empowerment Zones in California – Los Angeles, Santa Ana, San Diego, and an unincorporated section of Riverside County. Federal Empowerment Zones are designated based on high unemployment and poverty rates. More information may be found at: http://www.rurdev.usda.gov/rbs/ezec/ and http://www.treasurer.ca.gov/cidfac.
California Main Street Program
The California Main Street Program, administered by the State Office of Historic Preservation, was re-enacted in 2004 through SB 107, Chapter X, Statutes of 2004. Originally administered through the now defunct Technology, Trade and Commerce Agency, the program now operated without a specific budget augmentation. The Main Street Program was developed by National Trust for Historic Preservation's National Main Street Center to provide technical assistance and training for small cities
xii
and communities to enhance the economic revitalization and development of traditional central business districts and neighborhoods. California has 58 Main Street Program participants including cities such as Arcata, Oceanside, Salinas, Hanford, Grass Valley and San Diego. For more information, contact the Office of Historic Preservation at www.ohp.parks.ca.gov.
Foreign Trade and Investment
California Business Investment Services (CalBIS)
Contained within the California Labor and Workforce Development Agency, CalBIS “serves employers, corporate real estate executives, and site location consultants considering California for new business investment and expansion.” Among its services, CalBIS provides site selection services, information on international trade, workforce services, labor market data, and guides for businesses, including “California Investment Guide: an Overview of Advantages, Assistance, Taxes and Permits” and “Setting Up Business in California: a Guide for Investors.” More information may be found at: www.labor.ca.gov/calBIS/.
Centers for International Trade Development (CITD)
These centers are funded through the California Community Colleges, Economic and Workforce Development Program. With 14 centers in the state, each hosted by a local community college, the CITD assists companies in doing business abroad with technical assistance, market research, educational programs, and relationship-building opportunities. In addition, the CITD works closely with the California Commission on Jobs and Economic Growth, Small Business Development Centers, the U.S. Department of Commerce, chambers of commerce, business associations, and the California-Mexico Trade Assistance Centers. More information may be found at www.citd.org.
California-Mexico Trade Assistance Centers (CMTAC)
CMTAC has 18 centers throughout California to provide assistance for California companies to conduct business in Mexico. These centers have close ties to the Centers for International Trade Development (CITD), which are run through the California Community Colleges. Among its services, CMTAC provides technical assistance, trade data, trade missions to Mexico, hosted business events and conferences, and information on investment regulations and transportation logistics. More information may be found at: www.cmtac.org.
TradePort
This Internet Web site provides information and services to assist California businesses with global trade initiatives. TradePort was launched in 1996 with federal and state funding, is owned by the Bay Area Economic Forum and the Los Angeles Area Chamber of Commerce, and is managed by the Monterey Bay International Trade Association. This Internet portal provides businesses with information on market research, export strategy, rules of trade, financing, logistics, and trade statistics. Also, TradePort has a network of affiliates, including service centers in the Bay Area, Los Angeles, Inland Empire, Fresno/Central Valley, Sacramento, and San Diego. The Internet address is www.tradeport.org.

xiii
Agricultural Export Program (AEP)
AEP, administered by the California Department of Food and Agriculture, was established to “assist California’s agricultural producers in foreign market development, leading to increased exports of our agricultural products.” Among its services, AEP supports trade shows, trade missions, foreign buyer visits, market research, and up-to-date education on international trade policies and regulations. More information may be found at: calagexports.com.
International Business Relations Program (IBRP)
IBRP, administered by the Office of the Secretary of State, provides information and assistance for out-of-state and foreign companies seeking to conduct business in California. Their services consist of assistance with filing and reporting requirements for conducting business primarily, but the program also provides access to information on California businesses, foreign consulates, foreign trade offices in California, and other general information about California companies and government. More information may be found at: www.ss.ca.gov/business/ibrp/ibrp.htm.
Energy Technology Export Program (ETEP)
ETEP, administered by the California Energy Commission, provides financial assistance to California-based companies conducting business on the international market, organizes trade missions, conducts visits by foreign energy decision makers, and provides energy market information. More information may be found at: www.globalenergyconnection.ca.gov.
Foreign Trade Zones (FTZ)
FTZs are areas where goods may be imported without submitting to all U.S. Customs rules or tariffs and are intended to promote U.S. participation in trade and retain domestic employment that might otherwise go to foreign countries. These zones are established by the federal government with authorizing state statutes in the California Government Code (sections 6300 to 6305). California has 17 general purpose FTZs out of 234 zones in the U.S. More information may be found at: www.labor.ca.gov/calBIS/cbforeigntradezones.pdf and www.cbp.gov/xp/cgov/import/cargo_control/ftz/.
World Trade Centers (WTC)
Part of the network of 282 WTCs throughout the world, California houses 10 WTCs. These organizations are intended to promote international trade and business relations and provide a range of services, including research and information, educational programs, and business networking opportunities. The WTCs serve as a “one-stop shopping center” for international business. California WTC in the following areas: Bay Area, Baja California/Greater Tijuana, Long Beach, Los Angeles, Orange County, Oxnard, Palm Springs, Sacramento, San Diego, and San Francisco. More information can be found at: world.wtca.org.
xiv
Appendix E
Summary of Selected Federal Economic and Workforce
Investment Programs
This appendix provides information on several key federal agencies, which provide economic and workforce development programs and services, including the United States (U.S.) Department of Agriculture (USDA), the federal Small Business Administration (SBA), the federal Economic Development Agency (EDA), US Commercial Service, and the U.S. Treasury.
Department of Agriculture, Rural Development
USDA Rural Development works to improve the economy and quality of life throughout rural America by helping rural individuals, communities, and businesses obtain the financial and technical assistance needed to address their diverse and unique needs. Their goal is to make sure that rural citizens can participate fully in the global economy.
USDA Rural Development has multiple programs to provide people with financial and technical assistance as well as promoting economic development. Financial programs support essential public facilities and services such as: water and sewer systems; housing; health clinics; emergency service facilities; and, electric and telephone service. USDA Rural Development promotes economic development by supporting loans to businesses through banks and community-managed lending pools. They provide technical assistance and information to help agricultural and other cooperatives get started and improve the effectiveness of their member services and help communities undertake community empowerment programs. They have an $86 billion dollar portfolio of loans and administer nearly $16 billion in program loans, loan guarantees, and grants through their programs. More information about USDA Rural Development can be found at: www.rurdev.usda.gov. Below are various divisions and programs administered by USDA Rural Development:
Community Facilities Loans/Guaranteed Loans/Grants
Community Programs, a division of the Housing and Community Facilities Programs, administers programs designed to develop essential community facilities for public use in rural areas. These facilities include: schools; libraries; childcare; hospitals; medical clinics; assisted living facilities; fire and rescue stations; police stations; community centers; public buildings; and, transportation. Through its Community Facilities Programs, USDA is striving to ensure that such facilities are readily available to all rural communities. Community Facilities Programs uses three financial programs to achieve this goal:
• The Community Facilities Guaranteed Loan Program Community Programs can make and guarantee loans to develop essential community facilities in rural areas and towns of up to 20,000 in population. Loans and guarantees are available to public entities such as municipalities, counties, and special-purpose districts, as well as to non-profit corporations and tribal governments.
• The Community Facilities Direct Loan Program Loan funds may be used to construct, enlarge, or improve community facilities for health care, public safety, and public services. This can include costs to acquire land needed for a facility, pay
xv
necessary professional fees, and purchase equipment required for its operation.
• The Community Facilities Grant Program The Community Facilities Grant Program is typically used to fund projects under special initiatives, such as Native American community development efforts; child care centers linked with the Federal government's Welfare-to-Work initiative; Federally-designated Enterprise and Champion Communities, and the Northwest Economic Adjustment Initiative area.
Empowerment Zone and Enterprise Community Program
Administered by the United States Department of Agriculture, the Empowerment Zone and Enterprise Community Program offers a compact between the federal government, local communities, and state and local governments in order to promote economic and community development. Each community in the Empowerment Zone and Enterprise Community Program tailors its own strategic plan to meet the needs of the community. There are four communities in California participating in the Empowerment Zone and Enterprise Community Program: the City of Watsonville in Santa Cruz County, the County of Imperial, the Westside Tulare region, including rural portions in Fresno and Tulare Counties, and Desert Communities in Riverside County. More information may be found at www.ezec.gov.
Small Business Administration
The U.S. SBA is an independent agency of the Executive Branch of the Federal Government. It is charged with the responsibility of providing four primary areas of assistance to American Small Business: advocacy, management, procurement, and financial assistance. Financial assistance is delivered primarily through SBA’s Investment programs, Business Loan Programs, Disaster Loan Programs, and Bonding for Contractors. A selection of SBA's financial assistance programs are described below. A complete list of SBA programs and services is available at: www.sba.gov/.
Minority and Women Prequalification Pilot Loan Program
The Minority Prequalification Loan Program and the Women’s Prequalification Pilot Loan Program use intermediaries to assist prospective minority and women borrowers in developing viable loan application packages and securing loans. The Women’s Program uses only non-profit organizations as intermediaries; the Minority Program uses for-profit intermediaries as well.
Eligibility requirements include: Businesses at least 51% owned, operated and managed by people of ethnic or racial minorities or by women; businesses with average annual sales for the preceding three years that do not exceed $5 million; and, businesses that employ fewer than 100 persons, including affiliates.
The maximum amount for loans under the Women’s program is $250,000; under the Minority Program, it is generally the same, although some districts set other limits. The SBA will guarantee up to 80% of loans $100,000 and less and up to 75% of loans above $100,000 for both programs. The intermediary then helps the borrower locate a lender offering the most competitive rates.
Microloan Program
The Microloan Program provides very small loans (up to $35,000) to startup newly established, or growing, small businesses. These funds are made available to non-profit community based lenders

xvi
that, in turn, make loans to borrowers. There are 12 participating lenders in California and these lenders must provide training and technical assistance to its microloan borrowers.
International Trade Loans
Under the International Trade Loans program, small businesses engaged in or ready to begin international trade – or adversely affected by competition from imports – may qualify for short or long term financing. The SBA can guarantee up to $1.25 million for a combination of fixed asset financing and Export Working Capital Program assistance.
Applicants must establish that the loan will assist businesses to: significantly expand or develop an export market; upgrade equipment or facilities to improve their competitive position; provide a business plan that reasonably projects export sales sufficient to cover the loan; or, help address adverse affects of import competition.
For International Trade Loans, SBA can guarantee up to 85% of loans of $150,000 and less, and up to 75% of loans above $150,000. The maximum guaranteed amount is $1,250,000.
7(A) Loan Programs
The most basic and most common type of loans offered by the SBA to American small businesses are 7(a) loans. All 7(a) loans are provided by lenders who are called participants because they participate with SBA in the 7(a) program. Not all lenders choose to participate, but most American banks do. There are also some non-bank lenders who participate with SBA in the 7(a) program which expands the availability of lenders making loans under SBA guidelines. 7(a) loans are only available on a guaranty basis, but SBA does not fully guaranty 7(a) loans. Both the lender and SBA share the risk that a borrower will not be able to repay the loan in full. The guaranty is a guaranty against payment default. It does not cover imprudent decisions by the lender or misrepresentation by the borrower. Under the guaranty concept, commercial lenders make and administer the loans. Some of SBA's lender programs include:
• The Certified Lenders Program (CLP) is designed to provide expeditious service on loan applications received from lenders who have a successful SBA lending track record and a thorough understanding of SBA policies and procedures. CLP lenders are expected to perform a complete analysis of the application and, in return, SBA promises a fast loan decision. SBA reviews the lender's credit analysis rather than conducts a second analysis. SBA still makes the final credit and eligibility decision but, by completing a credit review instead of an independently conducted analysis, SBA strives for 3 working days turn around in arriving at its decision. The key aspect of CLP is the greater utilization of the credit knowledge of the lender's loan officers to shorten SBA's loan processing time. SBA still makes an independent determination as to whether the applicant can repay the loan from the profits of the business, but under CLP, the lenders work is reviewed rather than completely double checked.
• The Preferred Lenders Program (PLP) is another step in SBA's process of streamlining the procedures necessary to provide financial assistance to the small business community. Under PLP, SBA delegates loan approval, closing, and most servicing and liquidation authority and responsibility to these carefully selected lenders. SBA will continue to check loan eligibility criteria under this program.
xvii
PLP lenders are nominated based on their historical record with the Administration. They must have demonstrated a proficiency in processing and servicing SBA-guaranteed loans. The credit criteria for PLP loans is the same as that for the CLP and/or the Regular 7(a) program. In the event of payment default by the borrower and the need for enforced collections, the PLP lender agrees to liquidate all business assets before asking SBA to honor its guaranty.
FastTRAK Loan Program
The FastTRAK Loan Program is a 7(a) loan program that allows lenders to provide for smaller revolving loans needed for working capital. Lenders may approve unsecured lines of credit for up to $25,000 and the maximum loan amount of $150,000. Under the FastTRAK Program, a limited number of lenders have SBA-delegated authority to streamline loan approval, and primarily use their own paperwork. Loans may not exceed $250,000, and may be used for revolving credit or for a term loan. More information about the SBA FastTRAK program can be found at: www.sba.gov/financing/frfastrak.html.
CAPLines Loan Program
CAPLines is the 7(a) umbrella program under which the SBA helps small businesses meet their short-term and cyclical working-capital needs. SBA generally can guarantee up to $1 million, with a maximum interest rate for loans over $50,000 of prime + 2.25%. Total loan amounts may be as high as $2 million. One of the five short-term working-capital loan programs for small businesses under the CAPLines umbrella is the Contract Line.
Export Working Capital Program
EWCP was designed to provide short-term working capital to exporters and supports export financing to small businesses when financing is not otherwise available. This program encourages lenders to offer export working capital loans by guaranteeing repayment of up to $1.5 million or 90% of a loan amount, whichever is less. A loan can support a single transaction or multiple sales on a revolving basis. Designed to provide short-term working capital to exporters, EWCP is a combined effort of the SBA and the Export-Import Bank. These two agencies have joined their working capital programs to offer a unified approach to the federal government's support of export financing.
Certified Development Company (504) Loan Program
Certified Development Companies (CDCs) are nonprofit corporations set up to contribute to the economic development of their communities. CDC's partnering with SBA provide small businesses long-term, fixed-rate financing to acquire real estate, machinery and equipment for business expansion or to modernize facilities. SBA guarantees funding CDC assistance up to $1 million, which may not exceed 40% of the project cost. A SBA guarantee of up to $1.3 million is possible for loans which meet stated public policy goals. Recipient small businesses must contribute a minimum of 10% equity as part of the loan package. The private lender’s portion of these loans is unlimited. These loans are only available through CDCs and must create at least one job per every $35,000 loaned under SBA’s guarantee. For more information, go to: www.sba.gov/financing, and click on “CDC – 504 Loans.”
xviii
Small Business Development Centers Program
The Small Business Development Centers Program is administered by the U.S. Small Business Administration, with California sponsorship from California State University (CSU) Chico, CSU San Jose, CSU Fullerton, CUS Northridge, University of California Merced, Southwestern Community College, and the Chancellor’s Office of the California Community Colleges Economic and Workforce Development Program. The Small Business Development Centers assist small businesses “through business management counseling and training, resulting in the creation and retention of jobs, increased sales and profits, new business starts, and more.” More information on the Small Business Development Centers may be found at: www.calbusiness.ca.gov/cedpgybsbdc.asp.
Small Business Investment Company (SBIC) Program
SBA’s Small Business Investment Company (SBIC) Program provides long-term loans and/or venture capital to small firms. SBICs are privately-owned investment companies which are licensed and regulated by SBA. Because money for venture or risk investments is difficult for small firms to obtain, SBA provides financial assistance to SBICs to stimulate and supplement the flow of private equity and long-term loan funds to small companies. Venture capitalists participate in the SBIC program to supplement their own private capital with funds borrowed at favorable rates through SBA’s guarantee of SBIC debentures, which are sold to private investors. Because an SBIC’s success is linked to the growth and profitability of the companies which it finances; some SBICs primarily assist businesses with significant growth potential, such as new firms in innovative industries. SBICs finance small firms by providing straight loans and/or equity-type investments which often give them partial ownership of those businesses in the hope of sharing in the companies’ profits as they grow and prosper. The following types of investments are commonly used by SBICs:
• Loans with Warrants – SBICs may make loans in return for warrants which enable them to purchase common stock, usually at a favorable price, during a specific period of time.
• Convertible Debentures – SBICs may make loans with a conversion feature whereby the debenture
can be converted, at the SBIC’s option, into an equivalent amount of common stock. • Stock – SBICs may purchase common or preferred stock from the business
Some SBICs also provide management assistance to the companies they finance to foster growth. Eligible businesses generally include small businesses with a net worth not exceeding $6 million and average annual net profits after taxes over the past two years not exceeding $2 million. Businesses interested in raising venture capital can go to the SBA website for a list of participating funds. http://www.sba.gov/INV
Economic Development Administration
The Economic Development Administration (EDA) was established to generate jobs, help retain existing jobs, and stimulate industrial and commercial growth in economically distressed areas of the U.S. EDA assistance is available to rural and urban areas of the U.S. experiencing high unemployment, low income, or other severe economic distress.
xix
EDA works to help distressed communities become empowered to develop and implement their own economic development and revitalization strategies. Based on these locally- and regionally-developed priorities, EDA works in partnership with state and local governments, regional economic development districts, public and private nonprofit organizations, and Indian tribes. EDA helps distressed communities address problems associated with long-term economic distress, as well as sudden and severe economic dislocations including recovering from the economic impacts of natural disasters, the closure of military installations and other Federal facilities, changing trade patterns, and the depletion of natural resources. More information on the EDA can be found at: http://www.eda.gov/.
Economic Adjustment Assistance Program
The Economic Adjustment Assistance Program provides a wide range of technical, planning and infrastructure assistance in regions experiencing adverse economic changes that may occur suddenly or over time. This program is designed to respond flexibly to pressing economic recovery issues and is well-suited to help address challenges faced by U.S. regions and communities. More information on this program can be found in the Catalog of Federal Domestic Assistance, No. 11.307.
Planning Programs for Economic Development Districts, Indian Tribes and Redevelopment Areas
The Planning Program helps support planning organizations, including District Organizations and Indian Tribes, in the development, implementation, revision or replacement of comprehensive economic development strategies (CEDS), and for related short-term planning investments. This program also helps state plans designed to create and retain higher-skill, higher-wage jobs, particularly for the unemployed and underemployed in the nation’s most economically distressed regions. More information on this program can be found in the Catalog of Federal Domestic Assistance, No. 11.302.
Technical Assistance Programs – Local Technical Assistance
The Local Technical Assistance Program helps fill the knowledge and information gaps that may prevent leaders in the public and nonprofit sectors in economically distressed regions from making optimal decisions on local economic development issues. More information on this program can be found in the Catalog of Federal Domestic Assistance, No. 11.303.
Public Works and Economic Development Program
Public Works and Economic Development investments help support the construction or rehabilitation of essential public infrastructure and facilities necessary to generate or retain private sector jobs and investments, attract private sector capital, and promote regional competitiveness, including investments that expand and upgrade infrastructure to attract new industry, support technology-led development, redevelop brownfield sites and provide eco-industrial development. (CFDA No. 11.300). University Center Economic Development Program
The University Center Economic Development Program is a partnership between the Federal government and academia that helps to make the varied and vast resources of universities available to economic development communities. (CFDA No. 11.303)
xx
Trade Adjustment Assistance for Firms Program
EDA administers the Trade Adjustment Assistance for Firms Program through a national network of eleven Trade Adjustment Assistance Centers to help manufacturing and production firms, which have lost domestic sales and employment due to increased imports of similar or competitive goods, become more competitive in the global economy. (CFDA No. 11.313)
Research and Evaluation Program and National Technical Assistance Programs
The Research and National Technical Assistance Program supports research of leading, world class economic development practices, and funds information dissemination efforts. More information on this program can be found in the Catalog of Federal Domestic Assistance, No. 11.303 and No. 11.312.
Other Federal Departments
Community Development Block Grant Program, Department of Housing and Urban Affairs
Administered by the United States Department of Housing and Urban Development, the Community Development Block Grant Program administers a number of community and economic development programs that provide grants, loans, tax incentives, and other assistance. In particular, the Rural Housing and Economic Development Program assists in the establishment of Community Development Financial Institutions, lines of credit, revolving loan funds, small business incubators, and microenterprises. More information can be found at: www.hud.gov/offices/cpd/communitydevelopment/programs.index.cfm.
Community Affairs Program, Federal Reserve System
Administered by the Federal Reserve System, this program provides outreach, education, and technical assistance to address financial service issues affecting low- and moderate-income persons and communities. Working through programs at the twelve Federal Reserve Banks, this program provides information through training programs, workshops, forums, conferences, and trade fairs. More information on this program may be found at: www.federalreserve.gov/communityaffairs/national/default.htm.
Workforce Innovation in Regional Economic Development Activities, Department of Labor
The 13 original 2005 Workforce Innovation in Regional Economic Development (WIRED) awardees split a pool of $195 million; each 2nd Generation WIRED region will receive an award of $500,000, with the ability to access a $4.5 million balance contingent upon completion of a regional implementation blueprint. Each of the second generation WIRED regions already received $100,000 after the 2005 competition to prepare talent development strategies. California has received WIRED designations in both the 1st and 2nd Generations. The 1st Generation includes the California Innovation Corridor, while the 2nd Generation encompasses 18 counties in Northern California. More information can be found at: www.doleta.gov.
New Markets Tax Credits, Department of Treasury
xxi
The New Markets Tax Credit (NMTC) Program permits taxpayers to receive a credit against Federal income taxes for making qualified equity investments in designated Community Development Entities (CDEs). Substantially all of the qualified equity investment must in turn be used by the CDE to provide investments in low-income communities.
The credit provided to the investor totals 39% of the cost of the investment and is claimed over a seven-year credit allowance period. In each of the first three years, the investor receives a credit equal to five percent of the total amount paid for the stock or capital interest at the time of purchase. For the final four years, the value of the credit is six percent annually. Investors may not redeem their investments in CDEs prior to the conclusion of the seven-year period.
Over the life of the NMTC Program, CDEs are authorized to issue up to $16 billion NMTCs, including $1 billion of special allocation authority to be used for the recovery and redevelopment of the Gulf Opportunity Zone. To date, 233 awards have been made totaling $12.1 billion in allocation authority. More information can be found at: www.cdfifund.gov.
US Trade and Development Agency
US Trade and Development Agency (USTDA) advances economic development and U.S. commercial interests in developing and middle income countries. The agency funds various forms of technical assistance, early investment analysis, training, orientation visits and business workshops that support the development of a modern infrastructure and a fair and open trading environment. In Fiscal Year 2007, USTDA obligated nearly $46 million in support of the development goals of project sponsors in 51 host counties around the world. USTDA-funded activities fall into two categories: (1) trade capacity building and sector development; and (2) project definition and investment analysis. Trade capacity building and sector development assistance supports the establishment of industry standards, rules and regulations, trade agreements, market liberalization and other policy reform. Project definition and investment analysis generally involves studies that support large capital investments that contribute to overseas infrastructure development. Last year, USTDA funded 63 technical assistance activities, 43 feasibility studies, and 31 orientation visits. The average size of a USTDA grant is $400,000. http://www.ustda.gov/
The Minority Business Development Agency
The Minority Business Development Agency (MBDA), administered under the U.S. Department of Commerce, is the only federal agency created specifically to foster the establishment and growth of minority-owned businesses in America.
MBDA mission is to promote the growth and competitiveness of large, medium and small minority business enterprises. MBDA provides funding for a network of Minority Business Development Centers (MBDCs), Native American Business Development Centers (NABDCs), and Business Resource Centers located throughout the Nation. The Centers provide minority entrepreneurs with one-on-one assistance in writing business plans, marketing, management and technical assistance and financial planning to assure adequate financing for business ventures. The Centers are staffed by business specialists who have the knowledge and practical experience needed to run successful and profitable businesses. Business referral services are provided free of charge. However, the network generally charges nominal fees for specific management and technical assistance services. There are several MBDCs regional offices located in San Francisco and Los Angeles which serve the

xxii
Western U.S. MBDC's also funds more local offices to serve smaller subregions of the West. There are two offices serving the Inland Empire, located in Riverside and Los Angels; two serving Los Angeles with locations in Los Angeles; and two serving Northern California, located in San Jose and San Francisco. There is a NABDC located in El Monte which serves California Native Americans. .http://www.mbda.gov/?section_id=10&bucket_id=151&content_id=2269&well=entire_page
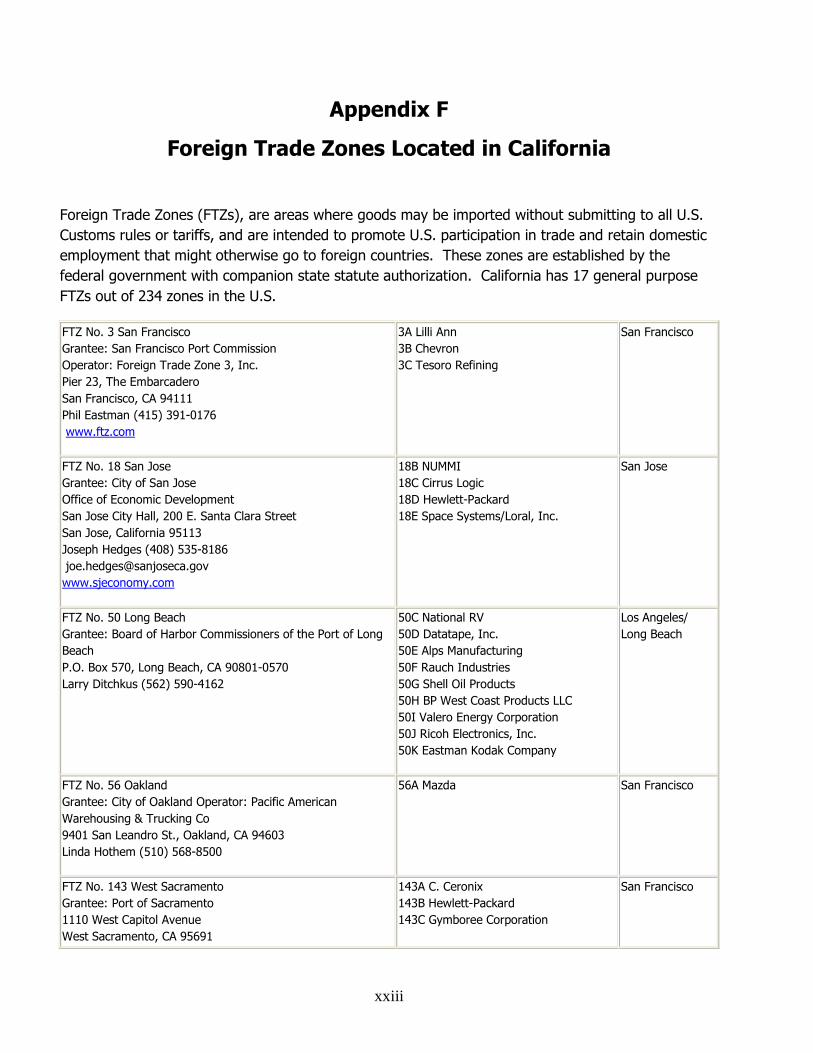
xxiii
Appendix F
Foreign Trade Zones Located in California
Foreign Trade Zones (FTZs), are areas where goods may be imported without submitting to all U.S.
Customs rules or tariffs, and are intended to promote U.S. participation in trade and retain domestic
employment that might otherwise go to foreign countries. These zones are established by the
federal government with companion state statute authorization. California has 17 general purpose
FTZs out of 234 zones in the U.S.
FTZ No. 3 San Francisco
Grantee: San Francisco Port Commission
Operator: Foreign Trade Zone 3, Inc.
Pier 23, The Embarcadero
San Francisco, CA 94111
Phil Eastman (415) 391-0176
www.ftz.com
3A Lilli Ann
3B Chevron
3C Tesoro Refining
San Francisco
FTZ No. 18 San Jose
Grantee: City of San Jose
Office of Economic Development
San Jose City Hall, 200 E. Santa Clara Street
San Jose, California 95113
Joseph Hedges (408) 535-8186
www.sjeconomy.com
18B NUMMI
18C Cirrus Logic
18D Hewlett-Packard
18E Space Systems/Loral, Inc.
San Jose
FTZ No. 50 Long Beach
Grantee: Board of Harbor Commissioners of the Port of Long
Beach
P.O. Box 570, Long Beach, CA 90801-0570
Larry Ditchkus (562) 590-4162
50C National RV
50D Datatape, Inc.
50E Alps Manufacturing
50F Rauch Industries
50G Shell Oil Products
50H BP West Coast Products LLC
50I Valero Energy Corporation
50J Ricoh Electronics, Inc.
50K Eastman Kodak Company
Los Angeles/
Long Beach
FTZ No. 56 Oakland
Grantee: City of Oakland Operator: Pacific American
Warehousing & Trucking Co
9401 San Leandro St., Oakland, CA 94603
Linda Hothem (510) 568-8500
56A Mazda San Francisco
FTZ No. 143 West Sacramento
Grantee: Port of Sacramento
1110 West Capitol Avenue
West Sacramento, CA 95691
143A C. Ceronix
143B Hewlett-Packard
143C Gymboree Corporation
San Francisco

xxiv
Mike Luken (916) 371-8000
www.portofsacramento.com
FTZ No. 153 San Diego
Grantee: City of San Diego
600 B St., Ste 400, San Diego, CA 92101
Lydia Moreno (619) 533-7512
153A EMD Biosciences, Inc.
153B Hewlett-Packard
153C DNP Electronics
153D Callaway Golf Company
153E National Steel & Shipbuilding Co.
San Diego
FTZ No. 191 Palmdale
Grantee: City of Palmdale, Economic Development, 38250
North Sierra Highway, Palmdale, CA 93550
David Walter (661) 267-5125
Los Angeles/
Long Beach
FTZ No. 202 Los Angeles
Grantee: Board of Harbor Commissioners of the City of Los
Angeles
425 South Palos Verdes Street
San Pedro, CA 90731
Masa Morimoto (310) 732-3843
202A 3M
202B Chevron USA, Inc.
202C ConocoPhillips
202D IKEA Wholesale, Inc.
202E Sony Electronics, Inc.
Los Angeles/
Long Beach
FTZ No. 205 Port Hueneme
Grantee: Board of Harbor Commissioners, Oxnard Harbor
District
Port of Hueneme, P.O. Box 608
333 Ponoma St., Port Hueneme, CA 93044
Will Berg (805) 488-3677
205A Imation Corporation Port Hueneme
FTZ No. 226 Merced, Madera & Fresno Counties
Grantee: Board of Supervisors of the County of Merced
2507 Heritage Drive, Atwater, CA 95301
John F. Fowler (209) 385-7686
www.ftz226.co.merced.ca.us
Fresno
FTZ No. 231 Stockton
Grantee: Stockton Port District
P.O. Box 2089 Stockton, CA 95201
Henry McKay (209) 946-0246
231A Medline Industries, Inc. San Francisco
FTZ No. 236 Palm Springs
Grantee: City of Palm Springs
3200 East Tahquitz Canyon Way
Palm Springs, CA 92262
Cathy Van Horn (760) 323-8175
Palm Springs
FTZ No. 237 Santa Maria
Grantee: Santa Maria Public Airport District
3217 Terminal Drive, Santa Maria, CA 93455
San Luis
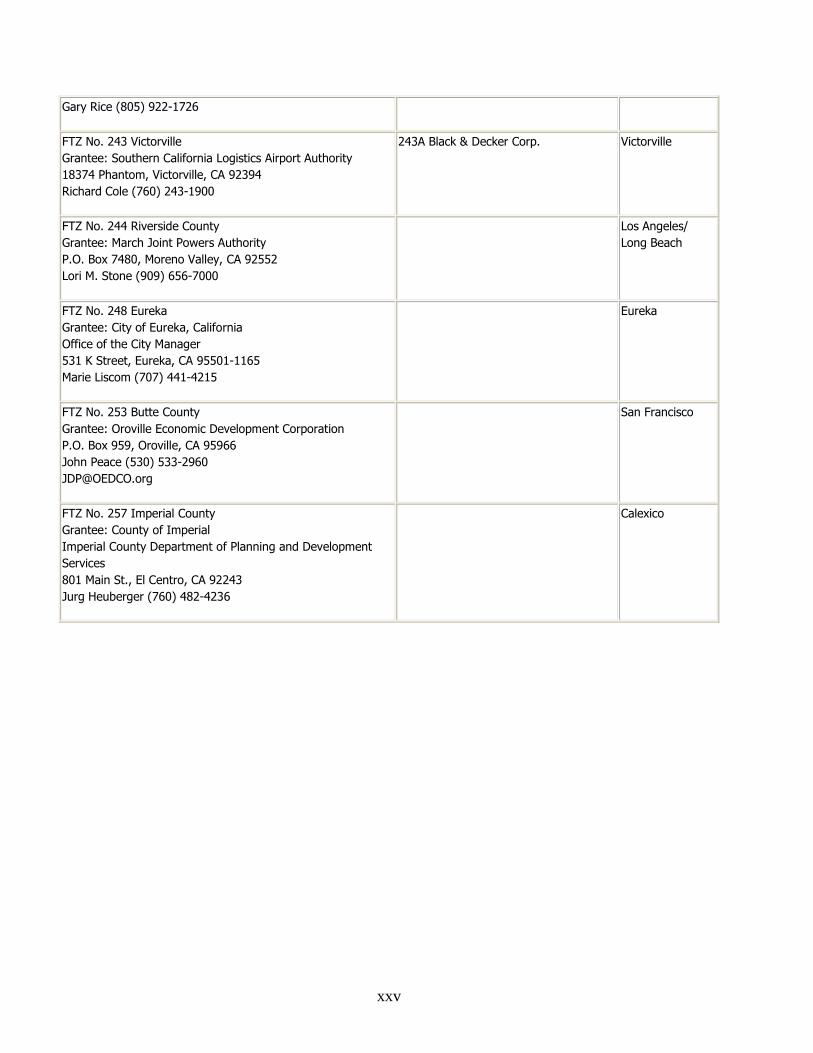
xxv
Gary Rice (805) 922-1726
FTZ No. 243 Victorville
Grantee: Southern California Logistics Airport Authority
18374 Phantom, Victorville, CA 92394
Richard Cole (760) 243-1900
243A Black & Decker Corp. Victorville
FTZ No. 244 Riverside County
Grantee: March Joint Powers Authority
P.O. Box 7480, Moreno Valley, CA 92552
Lori M. Stone (909) 656-7000
Los Angeles/
Long Beach
FTZ No. 248 Eureka
Grantee: City of Eureka, California
Office of the City Manager
531 K Street, Eureka, CA 95501-1165
Marie Liscom (707) 441-4215
Eureka
FTZ No. 253 Butte County
Grantee: Oroville Economic Development Corporation
P.O. Box 959, Oroville, CA 95966
John Peace (530) 533-2960
San Francisco
FTZ No. 257 Imperial County
Grantee: County of Imperial
Imperial County Department of Planning and Development
Services
801 Main St., El Centro, CA 92243
Jurg Heuberger (760) 482-4236
Calexico
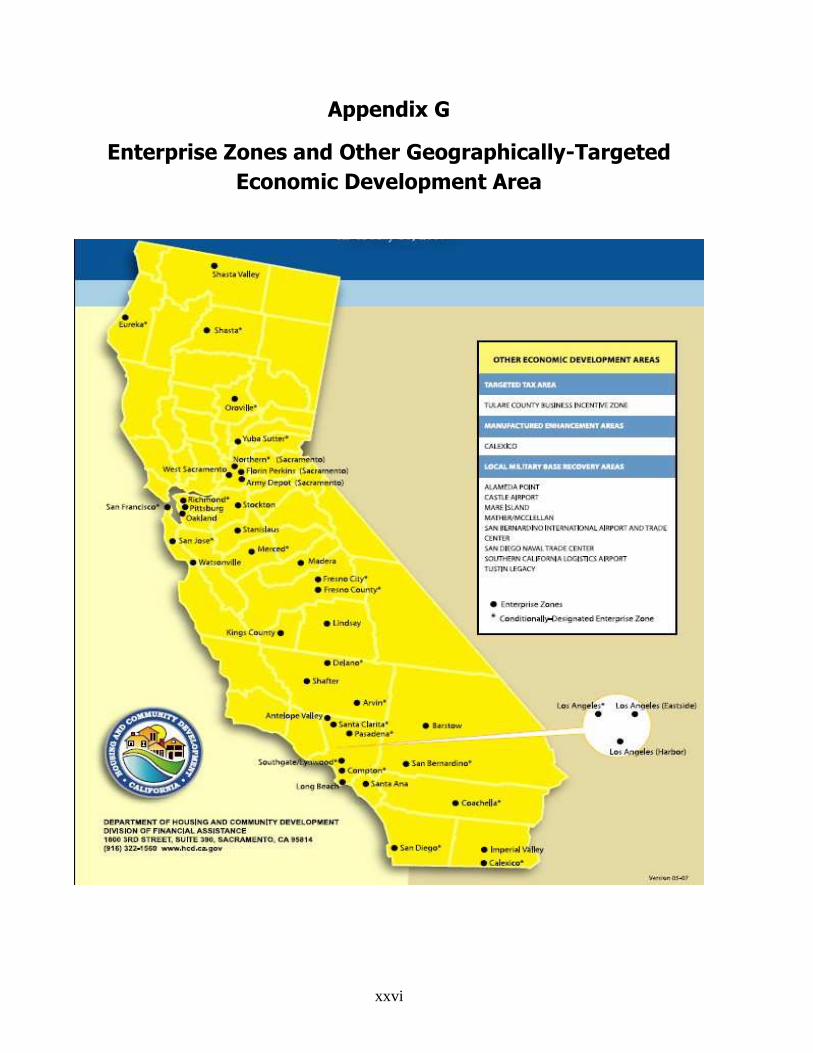
xxvi
Appendix G
Enterprise Zones and Other Geographically-Targeted
Economic Development Area
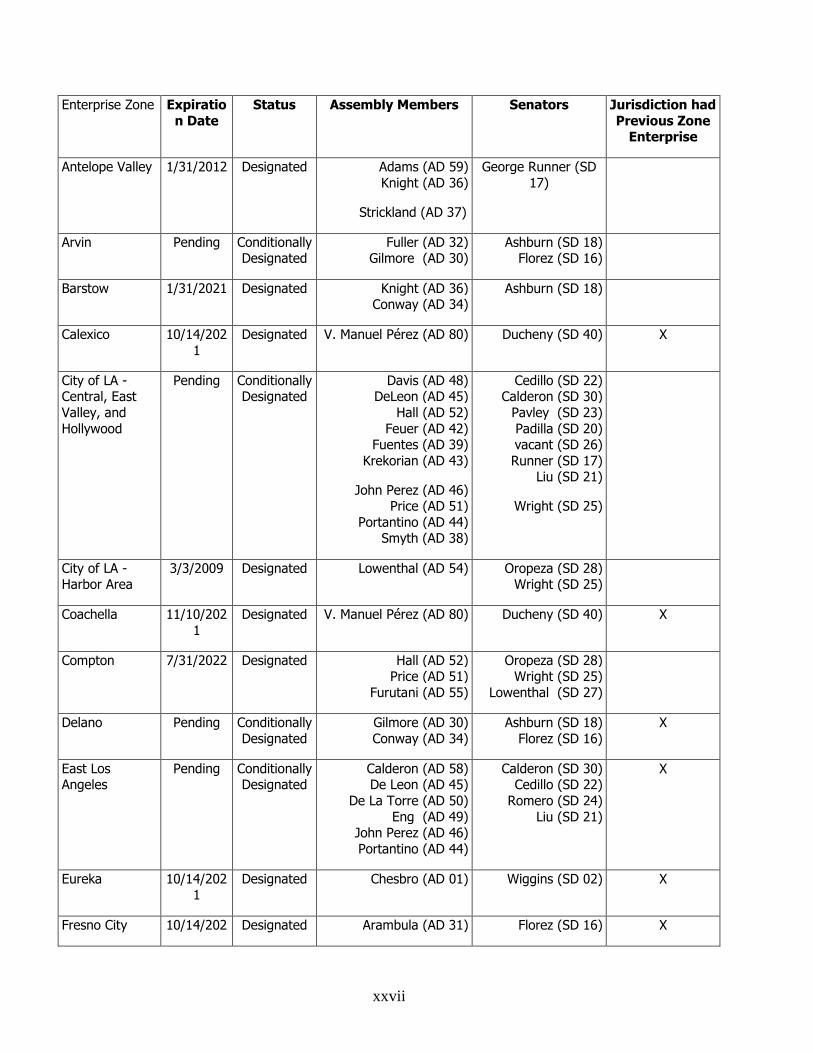
xxvii
Enterprise Zone Expiration Date
Status Assembly Members Senators Jurisdiction had Previous Zone Enterprise
Antelope Valley 1/31/2012 Designated Adams (AD 59) Knight (AD 36)
Strickland (AD 37)
George Runner (SD 17)
Arvin Pending Conditionally Designated
Fuller (AD 32) Gilmore (AD 30)
Ashburn (SD 18) Florez (SD 16)
Barstow 1/31/2021 Designated Knight (AD 36) Conway (AD 34)
Ashburn (SD 18)
Calexico 10/14/2021
Designated V. Manuel Pérez (AD 80) Ducheny (SD 40) X
City of LA - Central, East Valley, and Hollywood
Pending Conditionally Designated
Davis (AD 48) DeLeon (AD 45)
Hall (AD 52) Feuer (AD 42)
Fuentes (AD 39) Krekorian (AD 43)
John Perez (AD 46) Price (AD 51)
Portantino (AD 44) Smyth (AD 38)
Cedillo (SD 22) Calderon (SD 30)
Pavley (SD 23) Padilla (SD 20) vacant (SD 26)
Runner (SD 17) Liu (SD 21)
Wright (SD 25)
City of LA - Harbor Area
3/3/2009 Designated Lowenthal (AD 54) Oropeza (SD 28) Wright (SD 25)
Coachella 11/10/2021
Designated V. Manuel Pérez (AD 80) Ducheny (SD 40) X
Compton 7/31/2022 Designated Hall (AD 52) Price (AD 51)
Furutani (AD 55)
Oropeza (SD 28) Wright (SD 25)
Lowenthal (SD 27)
Delano Pending Conditionally Designated
Gilmore (AD 30) Conway (AD 34)
Ashburn (SD 18) Florez (SD 16)
X
East Los Angeles
Pending Conditionally Designated
Calderon (AD 58) De Leon (AD 45)
De La Torre (AD 50) Eng (AD 49)
John Perez (AD 46) Portantino (AD 44)
Calderon (SD 30) Cedillo (SD 22)
Romero (SD 24) Liu (SD 21)
X
Eureka 10/14/2021
Designated Chesbro (AD 01) Wiggins (SD 02) X
Fresno City 10/14/202 Designated Arambula (AD 31) Florez (SD 16) X

xxviii
1 Villines (AD 29) Cogdill (SD 14)
Fresno County 6/26/2022 Designated Arambula (AD 31)
Tom Berryhill (AD 25) Galgiani (AD 17) Conway (AD 34) Gilmore (AD 30) Villines (AD 29)
Ashburn (SD 18) Denham (SD 12)
Florez (SD 16) Cogdill (SD 14)
Imperial Valley 3/28/2021 Designated V. Manuel Pérez (AD 80) Ducheny (SD 40)
Kings County Pending Conditionally Designated
Gilmore (AD 30) Florez (SD 16) X
Lindsay 10/5/2010 Designated Conway (AD 34) Florez (SD 16) Ashburn (SD 18)
Long Beach 1/7/2022 Designated Hall (AD 52) Lowenthal (AD 54)
Furutani (AD 55)
Oropeza (SD 28) Lowenthal (SD 27)
Wright (SD 25)
X
Madera 3/3/2009 Designated Villines (AD 29) Cogdill (SD 14)
Merced County Pending Conditionally Designated
Arambula (AD 31) Galgiani (AD 17)
Denham (SD 12) Florez (SD 16)
Cogdill (SD 14)
X
Oakland Pending Conditionally Designated
Skinner (AD 14) Hayashi (AD 18)
Swanson (AD 16)
Hancock (SD 09) X
Oroville 11/5/2021 Designated Logue (AD 03) Nielsen (AD 02)
Aanestad (SD-04) X
Pasadena 4/9/2021 Designated Eng (AD 49) Portantino (AD 44)
Cedillo (SD 22) Huff (SD 29)
Liu (SD 21)
X
Richmond Pending Conditionally Designated
Skinner (AD 14) Hancock (SD 09) X
Sacramento - Army Depot
10/3/2009 Designated Jones (AD 09) Huber (AD 10) Niello (AD 05)
Steinberg (SD 6)
Sacramento - Florin/Perkins
4/4/2009 Designated Huber (AD 10) Cox (SD 01) Steinberg (SD 06)
Sacramento - North
Conditionally Designated
Jones (AD 09) Niello (AD 05)
Steinberg (SD 06) X
Salinas Valley Pending Conditionally Designated
Caballero (AD 28) Denham (SD 12)

xxix
San Bernardino Pending Conditionally Designated
Carter (AD 62) Cook (AD 65)
Emmerson (AD 63) Adams (AD 59)
Dutton (SD 31) Runner (SD 17)
Negrete McLeod (SD 32)
X
San Diego Pending Conditionally Designated
Block (AD 78) Anderson (AD 77)
Fletcher (AD 75) Saldana (AD 76)
Salas (AD 79)
Kehoe (SD 39) Ducheny (SD 40)
Hollingsworth (SD 36)
Wyland (SD 38)
X
San Francisco Pending Conditionally Designated
Ammiano (AD 13) Ma (AD 12)
Leno (SD 03) Yee (SD 08)
X
San Joaquin County
Pending Conditionally Designated
Bill Berryhill (AD 26) Galgiani (AD 17)
Huber (AD 10)
Cogdill (SD 14) Wolk (SD 5)
X
San Jose 12/30/2021
Designated Beall (AD 24) Coto (AD 23) Fong (AD 22)
Alquist (SD 13) Corbett (SD 10)
X
Santa Ana Pending Conditionally Designated
Solorio (AD 69) Miller (AD 71)
Correa (SD 34) X
Santa Clarita 6/30/2022 Designated Smyth (AD 38) Strickland (SD 19) Runner (SD 17)
Shafter 10/3/2010 Designated Gilmore (AD 30) Florez (SD 16)
Shasta Pending Conditionally Designated
Nielsen (AD-2) Aanestad (SD-04) X
Siskiyou County Pending Conditionally Designated
Nielsen (AD 02) Aanestad (SD 04) X
Southgate/Lynwood
10/14/2021
Designated De La Torre (AD 50) Hall (AD 52)
Calderon (SD 30) Lowenthal (SD 27)
Wright (AD 25)
X
Stanislaus County
11/15/2020
Designated Bill Berryhill (AD 26) Tom Berryhill (AD 25)
Cogdill (SD 14) Denham (SD 12)
Watsonville 4/30/2012 Designated Monning (AD 27) Caballero (AD 28)
Wolk (SD 15)
West Sacramento
Pending Conditionally Designated
Yamada (AD 08) Wolk (SD 05) X
Yuba/Sutter Pending Conditionally Designated
Logue (AD 03) Nielsen (AD 02)
Aanestad (SD-04) X
xxx
Appendix H
California's Redevelopment Agencies and Project Areas
Prepared by Time Structures™ for the California Redevelopment Association
Community Redevelopment Agencies play an important role in state community development
activities. Its two primary roles being their ability to aggregate land and to issue property tax
increment bonds to finance the rejuvenation of blight communities. Below is a summary of the
impact of these agencies’ most recent activities.
I. Estimated Economic Impact of Redevelopment http://www.calredevelop.org/AM/AMTemplate.cfm?Section=Facts_and_Reports1&TEMPLATE=/CM/ContentDisplay.cfm&CONTENTID=2430
In October 2004, the California Redevelopment Association (CRA) contracted with the Center for
Economic Development at California State University, Chico (CED) to conduct a follow-up analysis to
estimate the economic impact on the state of California of construction activity resulting from
residential, commercial, industrial, and public infrastructure projects associated with local
redevelopment agency activity.
Using a widely accepted economic computer model (IMPLAN), CED calculated the direct, indirect, and
induced effects on economic output of redevelopment agency construction in order to determine the
resulting statewide economic impacts. The CED study identifies the economic flows associated with
the combination of construction in redevelopment project areas for housing, commercial, industrial,
and infrastructure, and construction involving agency funds outside of project areas during FY 2002-
03. Below is a summary of some of the key findings of this analysis:
Total State Economic Activity
In the 2002-03 fiscal year, California redevelopment agencies generated $31.84 billion in total
economic activity. This includes the direct impact of RDA construction activities, as well as the
indirect and induced effects that RDA activities have on affected industry sectors.
Employment and Income Gains (Total income is the sum of wages and salaries, proprietor income,
corporate profits, property income, and indirect business taxes.)
RDA-associated construction activity was responsible for the creation of 310,000 full and part time
jobs in California in the 2002-03 fiscal year, through its direct, indirect and induced impacts on the
state’s various industry sectors. State income was increased by $16.56 billion because of RDA-
associated construction in 2002-03.
State and Local Taxes
RDA construction activity resulted in an increase of $1.58 billion in tax revenues for state and local
governments for 2002-03.
Impact on Construction Industry (2002-03)
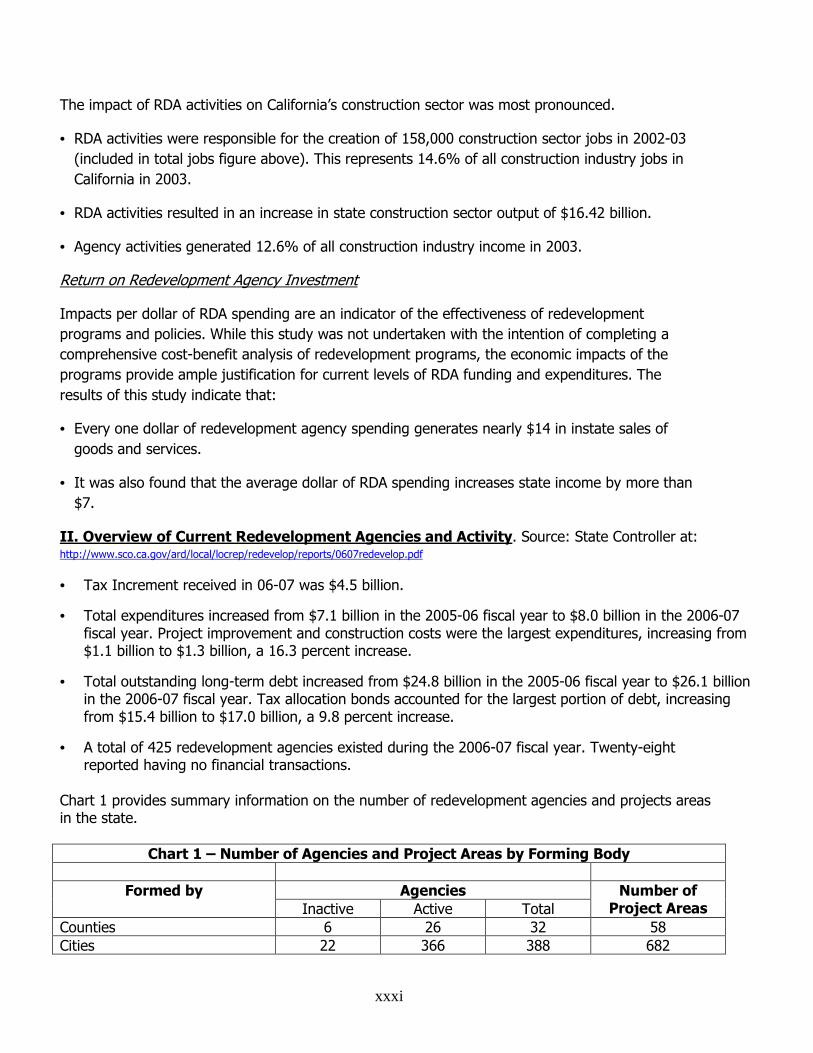
xxxi
The impact of RDA activities on California’s construction sector was most pronounced.
• RDA activities were responsible for the creation of 158,000 construction sector jobs in 2002-03
(included in total jobs figure above). This represents 14.6% of all construction industry jobs in
California in 2003.
• RDA activities resulted in an increase in state construction sector output of $16.42 billion.
• Agency activities generated 12.6% of all construction industry income in 2003.
Return on Redevelopment Agency Investment
Impacts per dollar of RDA spending are an indicator of the effectiveness of redevelopment
programs and policies. While this study was not undertaken with the intention of completing a
comprehensive cost-benefit analysis of redevelopment programs, the economic impacts of the
programs provide ample justification for current levels of RDA funding and expenditures. The
results of this study indicate that:
• Every one dollar of redevelopment agency spending generates nearly $14 in instate sales of
goods and services.
• It was also found that the average dollar of RDA spending increases state income by more than
$7.
II. Overview of Current Redevelopment Agencies and Activity. Source: State Controller at: http://www.sco.ca.gov/ard/local/locrep/redevelop/reports/0607redevelop.pdf
• Tax Increment received in 06-07 was $4.5 billion.
• Total expenditures increased from $7.1 billion in the 2005-06 fiscal year to $8.0 billion in the 2006-07 fiscal year. Project improvement and construction costs were the largest expenditures, increasing from $1.1 billion to $1.3 billion, a 16.3 percent increase.
• Total outstanding long-term debt increased from $24.8 billion in the 2005-06 fiscal year to $26.1 billion in the 2006-07 fiscal year. Tax allocation bonds accounted for the largest portion of debt, increasing from $15.4 billion to $17.0 billion, a 9.8 percent increase.
• A total of 425 redevelopment agencies existed during the 2006-07 fiscal year. Twenty-eight reported having no financial transactions.
Chart 1 provides summary information on the number of redevelopment agencies and projects areas in the state.
Chart 1 – Number of Agencies and Project Areas by Forming Body
Agencies Formed by Inactive Active Total
Number of Project Areas
Counties 6 26 32 58 Cities 22 366 388 682
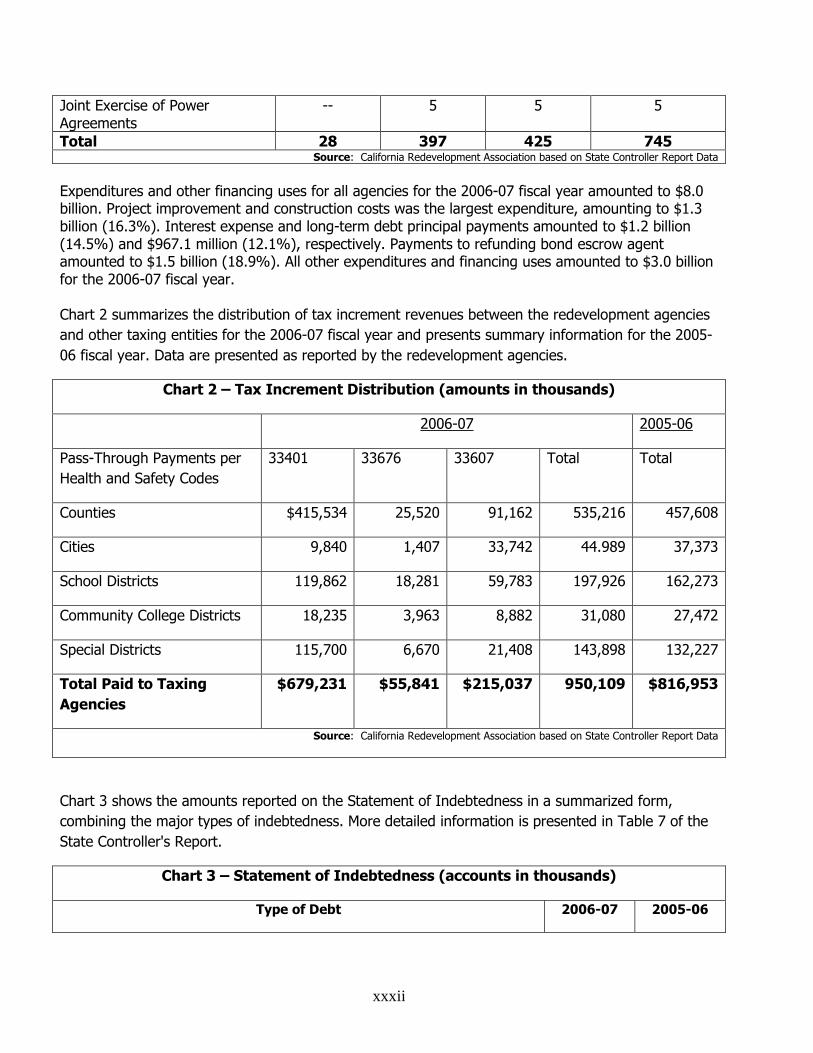
xxxii
Joint Exercise of Power Agreements
-- 5 5 5
Total 28 397 425 745 Source: California Redevelopment Association based on State Controller Report Data
Expenditures and other financing uses for all agencies for the 2006-07 fiscal year amounted to $8.0 billion. Project improvement and construction costs was the largest expenditure, amounting to $1.3 billion (16.3%). Interest expense and long-term debt principal payments amounted to $1.2 billion (14.5%) and $967.1 million (12.1%), respectively. Payments to refunding bond escrow agent amounted to $1.5 billion (18.9%). All other expenditures and financing uses amounted to $3.0 billion for the 2006-07 fiscal year. Chart 2 summarizes the distribution of tax increment revenues between the redevelopment agencies
and other taxing entities for the 2006-07 fiscal year and presents summary information for the 2005-
06 fiscal year. Data are presented as reported by the redevelopment agencies.
Chart 2 – Tax Increment Distribution (amounts in thousands)
2006-07 2005-06
Pass-Through Payments per
Health and Safety Codes
33401 33676 33607 Total Total
Counties $415,534 25,520 91,162 535,216 457,608
Cities 9,840 1,407 33,742 44.989 37,373
School Districts 119,862 18,281 59,783 197,926 162,273
Community College Districts 18,235 3,963 8,882 31,080 27,472
Special Districts 115,700 6,670 21,408 143,898 132,227
Total Paid to Taxing
Agencies
$679,231 $55,841 $215,037 950,109 $816,953
Source: California Redevelopment Association based on State Controller Report Data
Chart 3 shows the amounts reported on the Statement of Indebtedness in a summarized form,
combining the major types of indebtedness. More detailed information is presented in Table 7 of the
State Controller's Report.
Chart 3 – Statement of Indebtedness (accounts in thousands)
Type of Debt 2006-07 2005-06
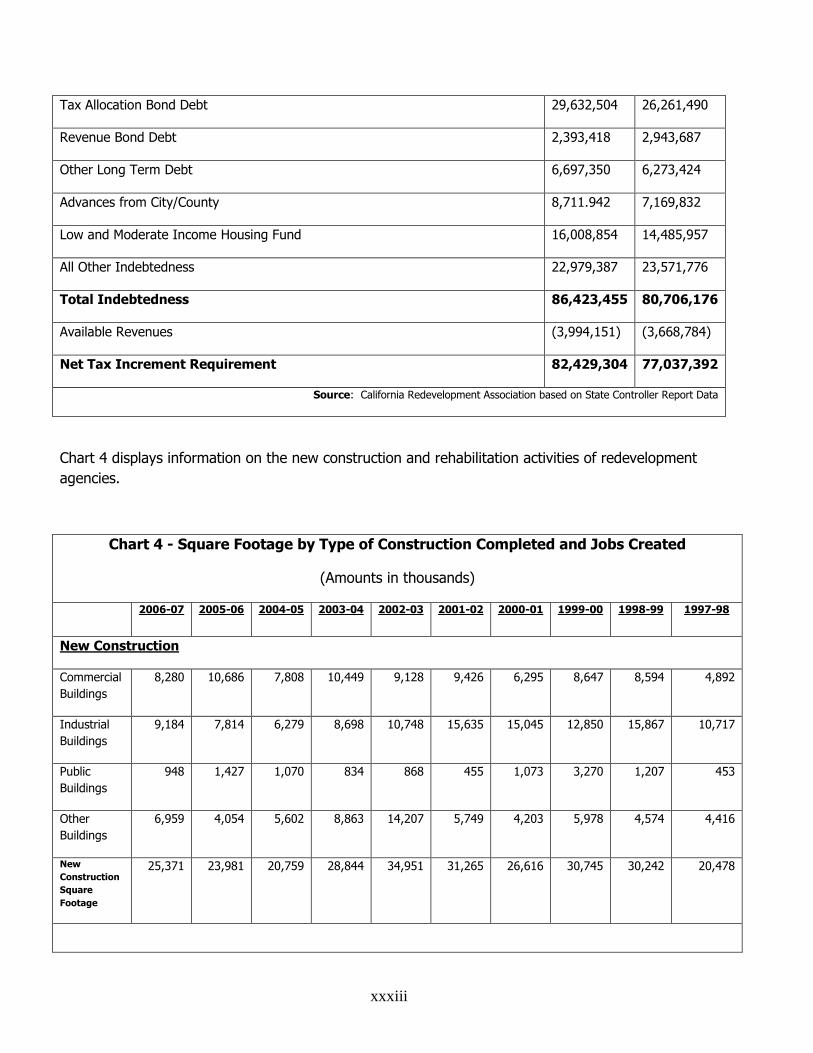
xxxiii
Tax Allocation Bond Debt 29,632,504 26,261,490
Revenue Bond Debt 2,393,418 2,943,687
Other Long Term Debt 6,697,350 6,273,424
Advances from City/County 8,711.942 7,169,832
Low and Moderate Income Housing Fund 16,008,854 14,485,957
All Other Indebtedness 22,979,387 23,571,776
Total Indebtedness 86,423,455 80,706,176
Available Revenues (3,994,151) (3,668,784)
Net Tax Increment Requirement 82,429,304 77,037,392
Source: California Redevelopment Association based on State Controller Report Data
Chart 4 displays information on the new construction and rehabilitation activities of redevelopment
agencies.
Chart 4 - Square Footage by Type of Construction Completed and Jobs Created
(Amounts in thousands)
2006-07 2005-06 2004-05 2003-04 2002-03 2001-02 2000-01 1999-00 1998-99 1997-98
New Construction
Commercial
Buildings
8,280 10,686 7,808 10,449 9,128 9,426 6,295 8,647 8,594 4,892
Industrial
Buildings
9,184 7,814 6,279 8,698 10,748 15,635 15,045 12,850 15,867 10,717
Public
Buildings
948 1,427 1,070 834 868 455 1,073 3,270 1,207 453
Other
Buildings
6,959 4,054 5,602 8,863 14,207 5,749 4,203 5,978 4,574 4,416
New
Construction
Square
Footage
25,371 23,981 20,759 28,844 34,951 31,265 26,616 30,745 30,242 20,478
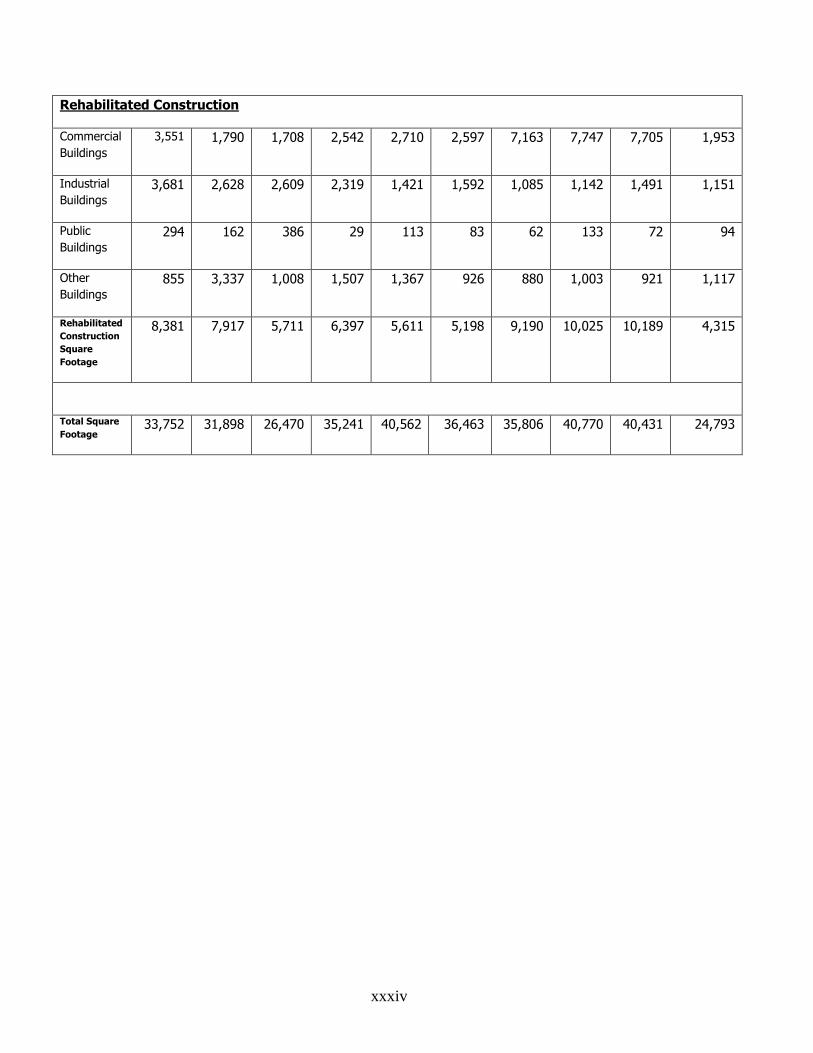
xxxiv
Rehabilitated Construction
Commercial
Buildings
3,551 1,790 1,708 2,542 2,710 2,597 7,163 7,747 7,705 1,953
Industrial
Buildings 3,681 2,628 2,609 2,319 1,421 1,592 1,085 1,142 1,491 1,151
Public
Buildings 294 162 386 29 113 83 62 133 72 94
Other
Buildings 855 3,337 1,008 1,507 1,367 926 880 1,003 921 1,117
Rehabilitated
Construction
Square
Footage
8,381 7,917 5,711 6,397 5,611 5,198 9,190 10,025 10,189 4,315
Total Square
Footage 33,752 31,898 26,470 35,241 40,562 36,463 35,806 40,770 40,431 24,793
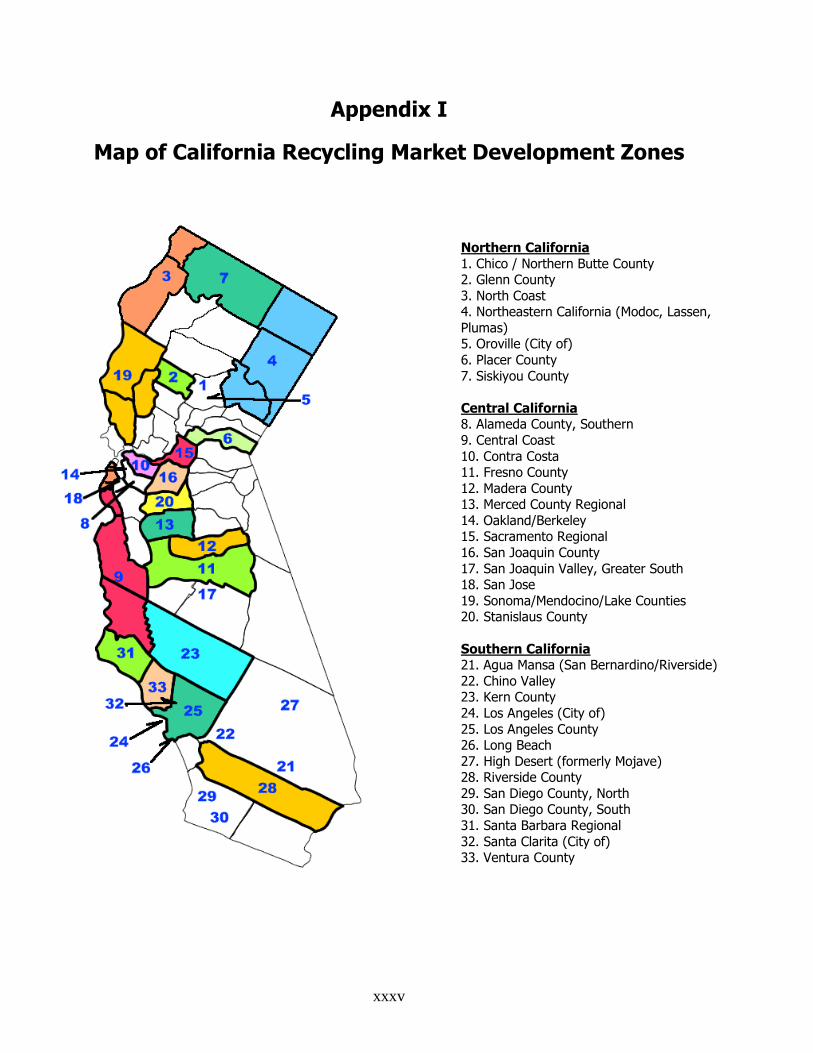
xxxv
Appendix I
Map of California Recycling Market Development Zones
Northern California 1. Chico / Northern Butte County 2. Glenn County 3. North Coast 4. Northeastern California (Modoc, Lassen, Plumas) 5. Oroville (City of) 6. Placer County 7. Siskiyou County Central California 8. Alameda County, Southern 9. Central Coast 10. Contra Costa 11. Fresno County 12. Madera County 13. Merced County Regional 14. Oakland/Berkeley 15. Sacramento Regional 16. San Joaquin County 17. San Joaquin Valley, Greater South 18. San Jose 19. Sonoma/Mendocino/Lake Counties 20. Stanislaus County Southern California 21. Agua Mansa (San Bernardino/Riverside) 22. Chino Valley 23. Kern County 24. Los Angeles (City of) 25. Los Angeles County 26. Long Beach 27. High Desert (formerly Mojave) 28. Riverside County 29. San Diego County, North 30. San Diego County, South 31. Santa Barbara Regional 32. Santa Clarita (City of) 33. Ventura County
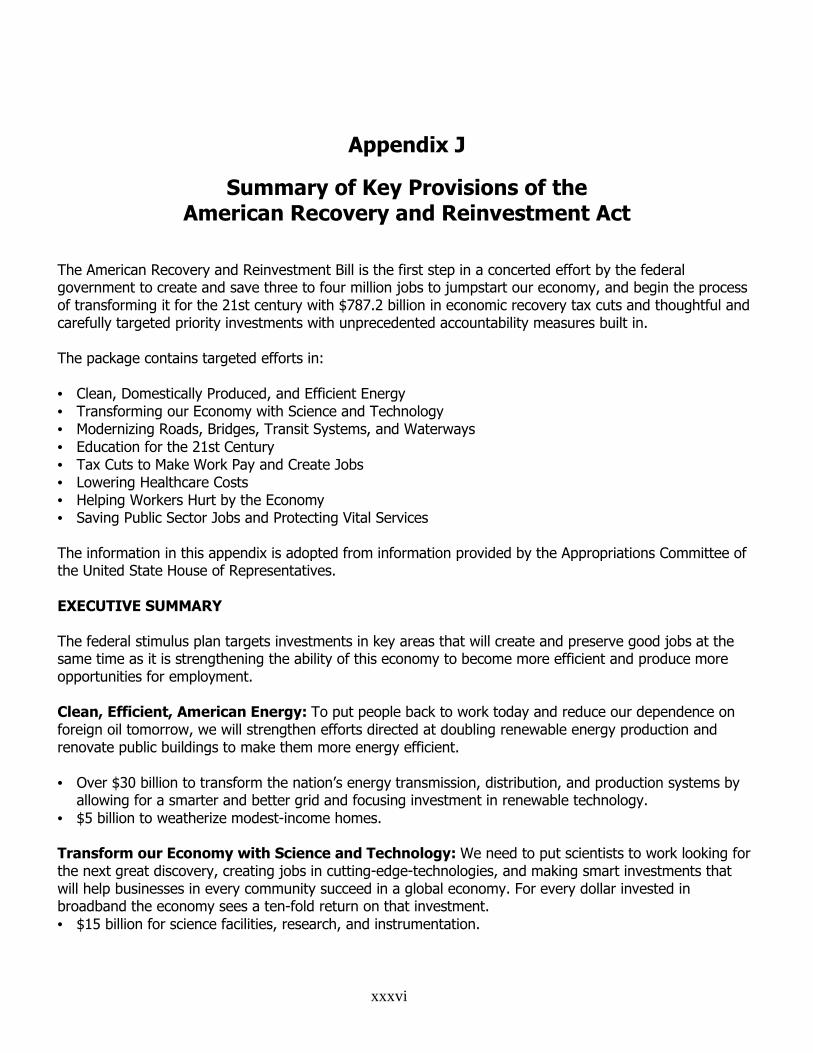
xxxvi
Appendix J
Summary of Key Provisions of the American Recovery and Reinvestment Act
The American Recovery and Reinvestment Bill is the first step in a concerted effort by the federal government to create and save three to four million jobs to jumpstart our economy, and begin the process of transforming it for the 21st century with $787.2 billion in economic recovery tax cuts and thoughtful and carefully targeted priority investments with unprecedented accountability measures built in. The package contains targeted efforts in: • Clean, Domestically Produced, and Efficient Energy • Transforming our Economy with Science and Technology • Modernizing Roads, Bridges, Transit Systems, and Waterways • Education for the 21st Century • Tax Cuts to Make Work Pay and Create Jobs • Lowering Healthcare Costs • Helping Workers Hurt by the Economy • Saving Public Sector Jobs and Protecting Vital Services The information in this appendix is adopted from information provided by the Appropriations Committee of the United State House of Representatives. EXECUTIVE SUMMARY The federal stimulus plan targets investments in key areas that will create and preserve good jobs at the same time as it is strengthening the ability of this economy to become more efficient and produce more opportunities for employment. Clean, Efficient, American Energy: To put people back to work today and reduce our dependence on foreign oil tomorrow, we will strengthen efforts directed at doubling renewable energy production and renovate public buildings to make them more energy efficient. • Over $30 billion to transform the nation’s energy transmission, distribution, and production systems by
allowing for a smarter and better grid and focusing investment in renewable technology. • $5 billion to weatherize modest-income homes. Transform our Economy with Science and Technology: We need to put scientists to work looking for the next great discovery, creating jobs in cutting-edge-technologies, and making smart investments that will help businesses in every community succeed in a global economy. For every dollar invested in broadband the economy sees a ten-fold return on that investment. • $15 billion for science facilities, research, and instrumentation.
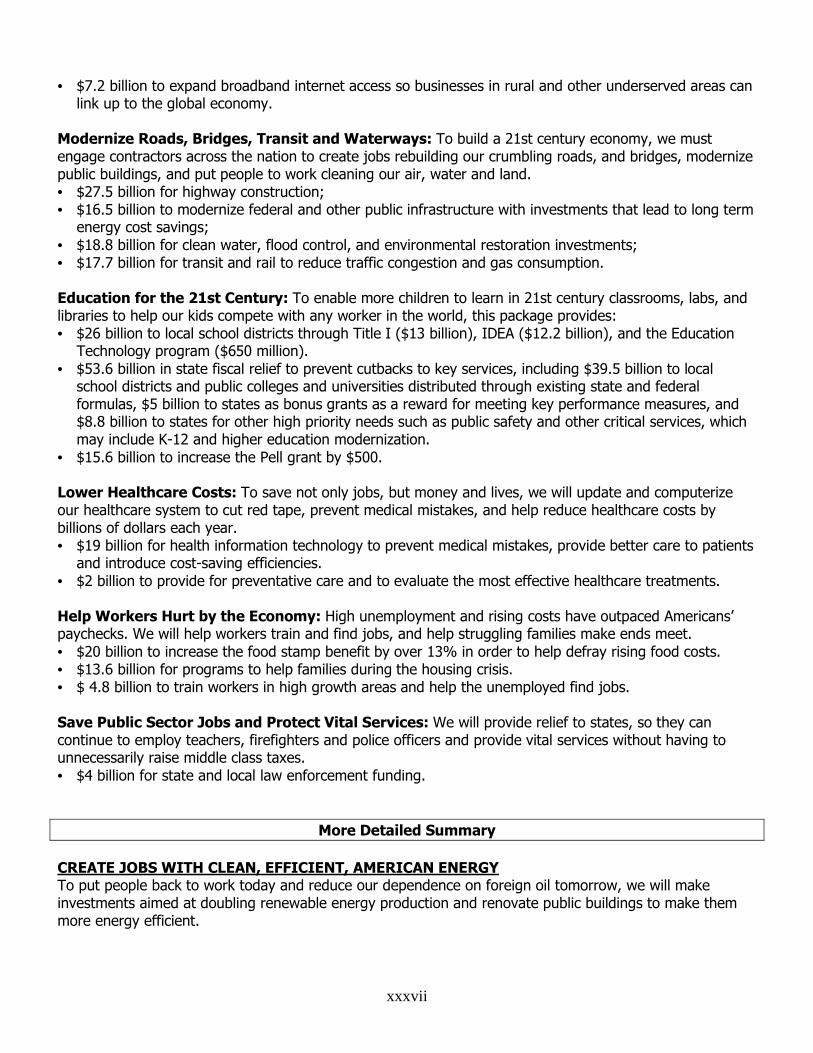
xxxvii
• $7.2 billion to expand broadband internet access so businesses in rural and other underserved areas can link up to the global economy.
Modernize Roads, Bridges, Transit and Waterways: To build a 21st century economy, we must engage contractors across the nation to create jobs rebuilding our crumbling roads, and bridges, modernize public buildings, and put people to work cleaning our air, water and land. • $27.5 billion for highway construction; • $16.5 billion to modernize federal and other public infrastructure with investments that lead to long term
energy cost savings; • $18.8 billion for clean water, flood control, and environmental restoration investments; • $17.7 billion for transit and rail to reduce traffic congestion and gas consumption. Education for the 21st Century: To enable more children to learn in 21st century classrooms, labs, and libraries to help our kids compete with any worker in the world, this package provides: • $26 billion to local school districts through Title I ($13 billion), IDEA ($12.2 billion), and the Education
Technology program ($650 million). • $53.6 billion in state fiscal relief to prevent cutbacks to key services, including $39.5 billion to local
school districts and public colleges and universities distributed through existing state and federal formulas, $5 billion to states as bonus grants as a reward for meeting key performance measures, and $8.8 billion to states for other high priority needs such as public safety and other critical services, which may include K-12 and higher education modernization.
• $15.6 billion to increase the Pell grant by $500. Lower Healthcare Costs: To save not only jobs, but money and lives, we will update and computerize our healthcare system to cut red tape, prevent medical mistakes, and help reduce healthcare costs by billions of dollars each year. • $19 billion for health information technology to prevent medical mistakes, provide better care to patients
and introduce cost-saving efficiencies. • $2 billion to provide for preventative care and to evaluate the most effective healthcare treatments. Help Workers Hurt by the Economy: High unemployment and rising costs have outpaced Americans’ paychecks. We will help workers train and find jobs, and help struggling families make ends meet. • $20 billion to increase the food stamp benefit by over 13% in order to help defray rising food costs. • $13.6 billion for programs to help families during the housing crisis. • $ 4.8 billion to train workers in high growth areas and help the unemployed find jobs. Save Public Sector Jobs and Protect Vital Services: We will provide relief to states, so they can continue to employ teachers, firefighters and police officers and provide vital services without having to unnecessarily raise middle class taxes. • $4 billion for state and local law enforcement funding.
More Detailed Summary
CREATE JOBS WITH CLEAN, EFFICIENT, AMERICAN ENERGY To put people back to work today and reduce our dependence on foreign oil tomorrow, we will make investments aimed at doubling renewable energy production and renovate public buildings to make them more energy efficient.
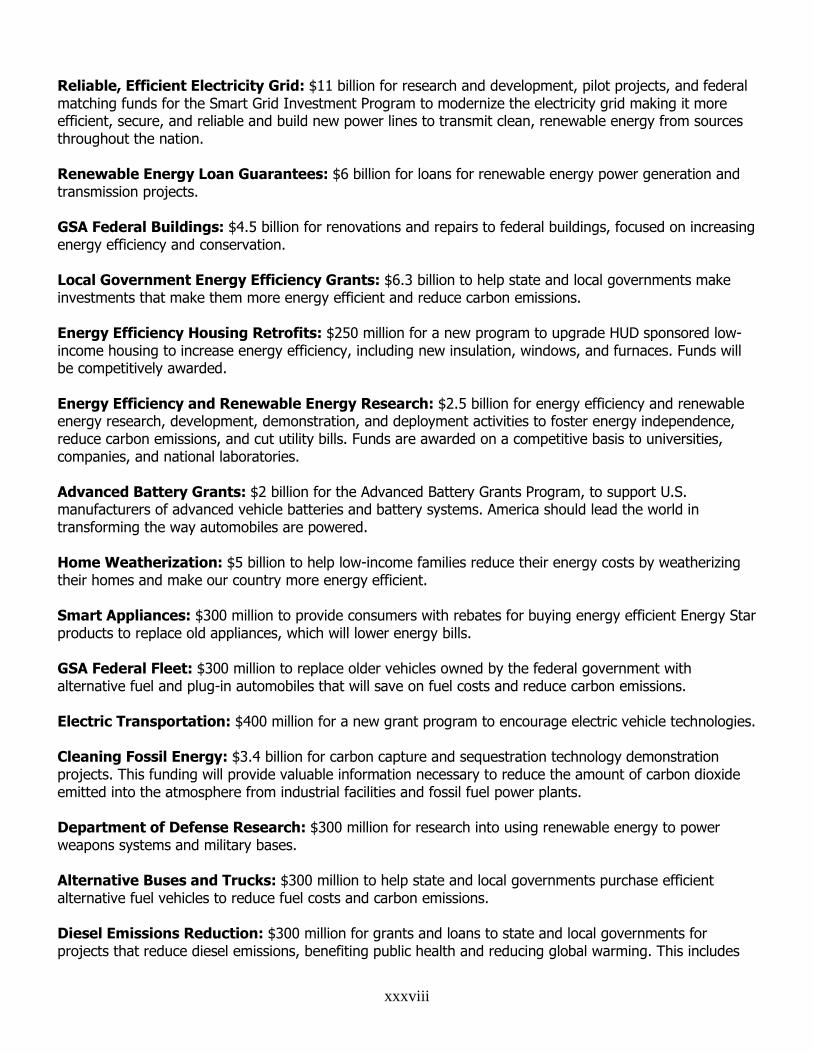
xxxviii
Reliable, Efficient Electricity Grid: $11 billion for research and development, pilot projects, and federal matching funds for the Smart Grid Investment Program to modernize the electricity grid making it more efficient, secure, and reliable and build new power lines to transmit clean, renewable energy from sources throughout the nation. Renewable Energy Loan Guarantees: $6 billion for loans for renewable energy power generation and transmission projects. GSA Federal Buildings: $4.5 billion for renovations and repairs to federal buildings, focused on increasing energy efficiency and conservation. Local Government Energy Efficiency Grants: $6.3 billion to help state and local governments make investments that make them more energy efficient and reduce carbon emissions. Energy Efficiency Housing Retrofits: $250 million for a new program to upgrade HUD sponsored low-income housing to increase energy efficiency, including new insulation, windows, and furnaces. Funds will be competitively awarded. Energy Efficiency and Renewable Energy Research: $2.5 billion for energy efficiency and renewable energy research, development, demonstration, and deployment activities to foster energy independence, reduce carbon emissions, and cut utility bills. Funds are awarded on a competitive basis to universities, companies, and national laboratories. Advanced Battery Grants: $2 billion for the Advanced Battery Grants Program, to support U.S. manufacturers of advanced vehicle batteries and battery systems. America should lead the world in transforming the way automobiles are powered. Home Weatherization: $5 billion to help low-income families reduce their energy costs by weatherizing their homes and make our country more energy efficient. Smart Appliances: $300 million to provide consumers with rebates for buying energy efficient Energy Star products to replace old appliances, which will lower energy bills. GSA Federal Fleet: $300 million to replace older vehicles owned by the federal government with alternative fuel and plug-in automobiles that will save on fuel costs and reduce carbon emissions. Electric Transportation: $400 million for a new grant program to encourage electric vehicle technologies. Cleaning Fossil Energy: $3.4 billion for carbon capture and sequestration technology demonstration projects. This funding will provide valuable information necessary to reduce the amount of carbon dioxide emitted into the atmosphere from industrial facilities and fossil fuel power plants. Department of Defense Research: $300 million for research into using renewable energy to power weapons systems and military bases. Alternative Buses and Trucks: $300 million to help state and local governments purchase efficient alternative fuel vehicles to reduce fuel costs and carbon emissions. Diesel Emissions Reduction: $300 million for grants and loans to state and local governments for projects that reduce diesel emissions, benefiting public health and reducing global warming. This includes
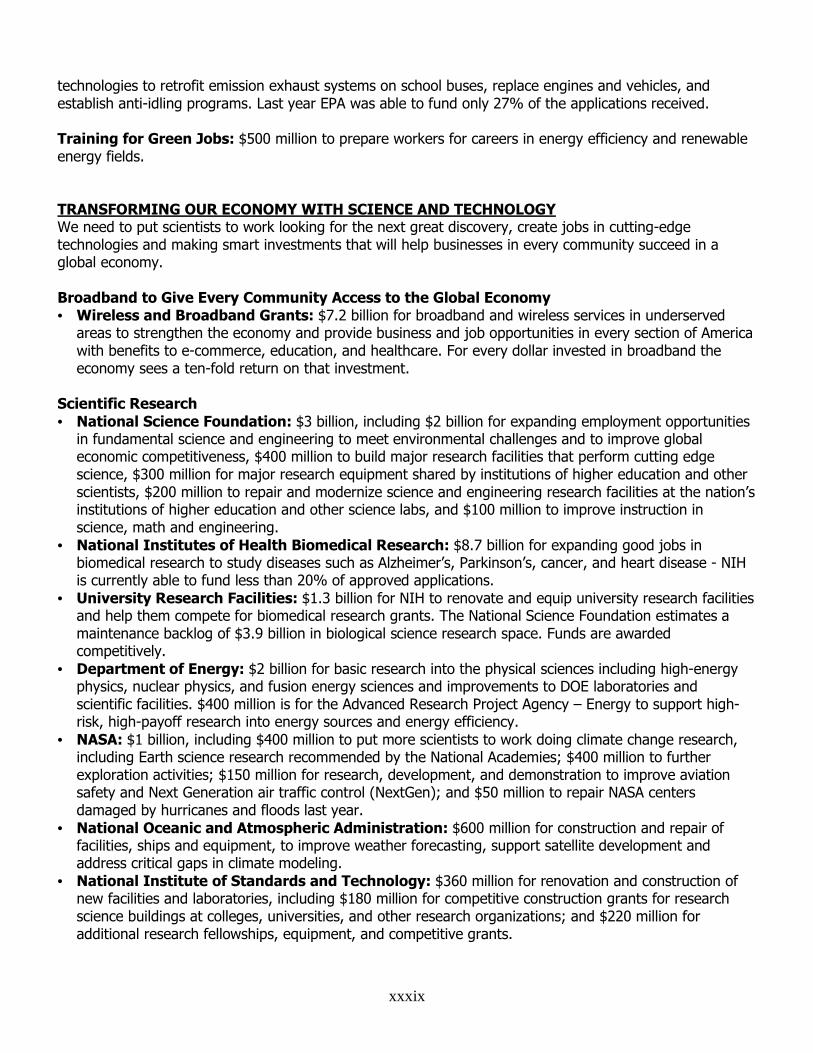
xxxix
technologies to retrofit emission exhaust systems on school buses, replace engines and vehicles, and establish anti-idling programs. Last year EPA was able to fund only 27% of the applications received. Training for Green Jobs: $500 million to prepare workers for careers in energy efficiency and renewable energy fields. TRANSFORMING OUR ECONOMY WITH SCIENCE AND TECHNOLOGY We need to put scientists to work looking for the next great discovery, create jobs in cutting-edge technologies and making smart investments that will help businesses in every community succeed in a global economy. Broadband to Give Every Community Access to the Global Economy • Wireless and Broadband Grants: $7.2 billion for broadband and wireless services in underserved
areas to strengthen the economy and provide business and job opportunities in every section of America with benefits to e-commerce, education, and healthcare. For every dollar invested in broadband the economy sees a ten-fold return on that investment.
Scientific Research • National Science Foundation: $3 billion, including $2 billion for expanding employment opportunities
in fundamental science and engineering to meet environmental challenges and to improve global economic competitiveness, $400 million to build major research facilities that perform cutting edge science, $300 million for major research equipment shared by institutions of higher education and other scientists, $200 million to repair and modernize science and engineering research facilities at the nation’s institutions of higher education and other science labs, and $100 million to improve instruction in science, math and engineering.
• National Institutes of Health Biomedical Research: $8.7 billion for expanding good jobs in biomedical research to study diseases such as Alzheimer’s, Parkinson’s, cancer, and heart disease - NIH is currently able to fund less than 20% of approved applications.
• University Research Facilities: $1.3 billion for NIH to renovate and equip university research facilities and help them compete for biomedical research grants. The National Science Foundation estimates a maintenance backlog of $3.9 billion in biological science research space. Funds are awarded competitively.
• Department of Energy: $2 billion for basic research into the physical sciences including high-energy physics, nuclear physics, and fusion energy sciences and improvements to DOE laboratories and scientific facilities. $400 million is for the Advanced Research Project Agency – Energy to support high-risk, high-payoff research into energy sources and energy efficiency.
• NASA: $1 billion, including $400 million to put more scientists to work doing climate change research, including Earth science research recommended by the National Academies; $400 million to further exploration activities; $150 million for research, development, and demonstration to improve aviation safety and Next Generation air traffic control (NextGen); and $50 million to repair NASA centers damaged by hurricanes and floods last year.
• National Oceanic and Atmospheric Administration: $600 million for construction and repair of facilities, ships and equipment, to improve weather forecasting, support satellite development and address critical gaps in climate modeling.
• National Institute of Standards and Technology: $360 million for renovation and construction of new facilities and laboratories, including $180 million for competitive construction grants for research science buildings at colleges, universities, and other research organizations; and $220 million for additional research fellowships, equipment, and competitive grants.
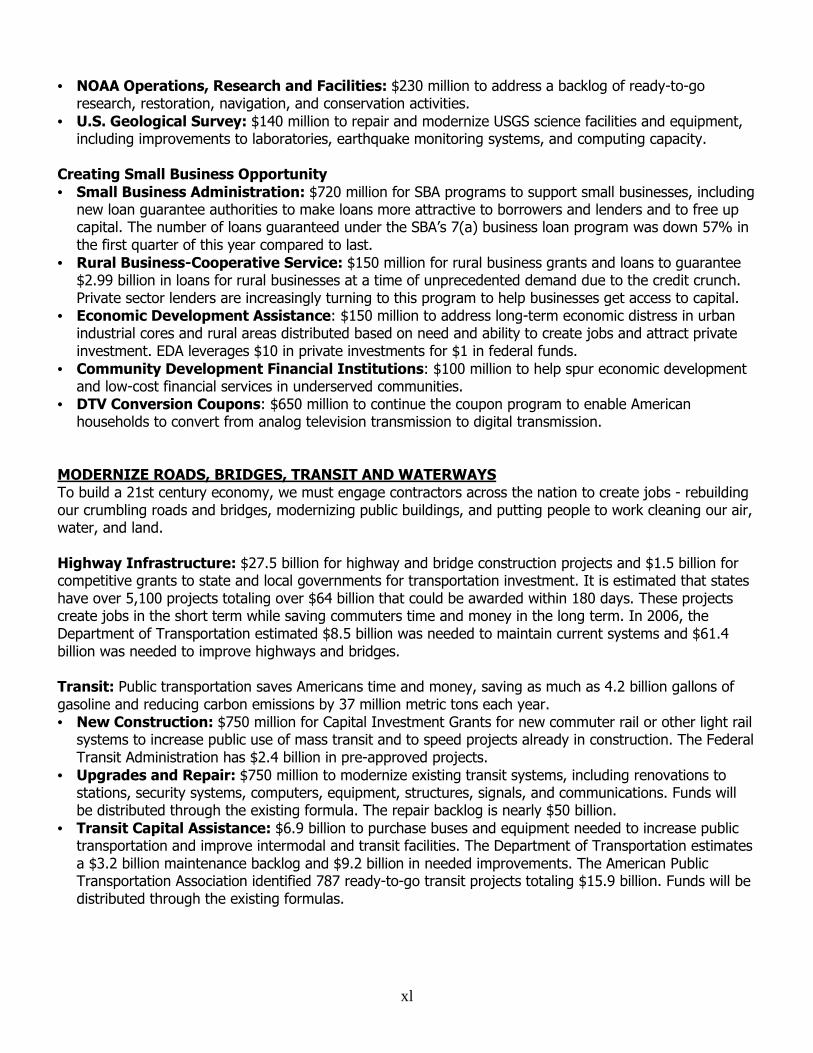
xl
• NOAA Operations, Research and Facilities: $230 million to address a backlog of ready-to-go research, restoration, navigation, and conservation activities.
• U.S. Geological Survey: $140 million to repair and modernize USGS science facilities and equipment, including improvements to laboratories, earthquake monitoring systems, and computing capacity.
Creating Small Business Opportunity • Small Business Administration: $720 million for SBA programs to support small businesses, including
new loan guarantee authorities to make loans more attractive to borrowers and lenders and to free up capital. The number of loans guaranteed under the SBA’s 7(a) business loan program was down 57% in the first quarter of this year compared to last.
• Rural Business-Cooperative Service: $150 million for rural business grants and loans to guarantee $2.99 billion in loans for rural businesses at a time of unprecedented demand due to the credit crunch. Private sector lenders are increasingly turning to this program to help businesses get access to capital.
• Economic Development Assistance: $150 million to address long-term economic distress in urban industrial cores and rural areas distributed based on need and ability to create jobs and attract private investment. EDA leverages $10 in private investments for $1 in federal funds.
• Community Development Financial Institutions: $100 million to help spur economic development and low-cost financial services in underserved communities.
• DTV Conversion Coupons: $650 million to continue the coupon program to enable American households to convert from analog television transmission to digital transmission.
MODERNIZE ROADS, BRIDGES, TRANSIT AND WATERWAYS To build a 21st century economy, we must engage contractors across the nation to create jobs - rebuilding our crumbling roads and bridges, modernizing public buildings, and putting people to work cleaning our air, water, and land. Highway Infrastructure: $27.5 billion for highway and bridge construction projects and $1.5 billion for competitive grants to state and local governments for transportation investment. It is estimated that states have over 5,100 projects totaling over $64 billion that could be awarded within 180 days. These projects create jobs in the short term while saving commuters time and money in the long term. In 2006, the Department of Transportation estimated $8.5 billion was needed to maintain current systems and $61.4 billion was needed to improve highways and bridges. Transit: Public transportation saves Americans time and money, saving as much as 4.2 billion gallons of gasoline and reducing carbon emissions by 37 million metric tons each year. • New Construction: $750 million for Capital Investment Grants for new commuter rail or other light rail
systems to increase public use of mass transit and to speed projects already in construction. The Federal Transit Administration has $2.4 billion in pre-approved projects.
• Upgrades and Repair: $750 million to modernize existing transit systems, including renovations to stations, security systems, computers, equipment, structures, signals, and communications. Funds will be distributed through the existing formula. The repair backlog is nearly $50 billion.
• Transit Capital Assistance: $6.9 billion to purchase buses and equipment needed to increase public transportation and improve intermodal and transit facilities. The Department of Transportation estimates a $3.2 billion maintenance backlog and $9.2 billion in needed improvements. The American Public Transportation Association identified 787 ready-to-go transit projects totaling $15.9 billion. Funds will be distributed through the existing formulas.
xli
Amtrak: $1.3 billion to improve the speed and capacity of intercity passenger rail service. The Department of Transportation’s Inspector General estimates the North East Corridor alone has a backlog of over $10 billion. High Speed Rail and Intercity Passenger Rail Grants: $8 billion to advance the development of high speed rail and to improve the intercity passenger rail service in corridors across the nation. The States for Passenger Rail Coalition estimates that there are over $1.5 billion in projects that are ready-to-go. Airport Improvement Grants: $1.1 billion for airport improvement projects that will improve safety and reduce congestion. An estimated $49.7 billion in eligible airport infrastructure projects are needed between 2009-2013. • Transportation Security Administration Explosive Detection Systems: $1 billion to install
Aviation Explosive Detection Systems and checkpoint screening systems in the nation’s airports, improving security, and making life easier on travelers by speeding security lines. Funds are competitively awarded based on security risk.
• Border and Ports of Entry: $720 million to construct GSA and Customs and Border Protection land ports of entry to improve border security, make trade and travel easier and reduce wait times.
• Coast Guard: $240 million to rehabilitate and repair Coast Guard infrastructure and obstacles to navigation.
Technology Improvements for a More Efficient and Secure Government • Social Security Administration Modernization: $500 million to replace the 30 year old Social
Security Administration’s National Computer Center to meet growing needs for processing retirement and disability claims and records storage.
• Farm Service Agency: $50 million for critical IT improvements to systems. • State Department Technology: $290 million to upgrade and modernize information technology
platforms to meet security requirements post-9/11. • Department of Agriculture: $24 million for repairs and security improvements at USDA’s
headquarters. Department of Defense Facilities • Medical Facilities: $1.3 billion for new construction to provide state-of-the-art medical care to service
members and their families. • Facilities Renovations: $4.2 billion to invest in energy efficiency projects and to repair and modernize
Department of Defense facilities of which $400 million will be used to improve military medical facilities and $153 million will be used to restore Army barracks.
• Housing for Troops and Their Families: $890 million to improve base housing for our troops and families, and to provide aid to restationing military homeowners.
• Child Development Center: $240 million for new child development centers. • National Guard: $100 million for new construction to support Guard and Reserve units across the
country with operations and training facilities and utilities infrastructure. • State Extended Care Facilities: $150 million for Grants for Construction of State Extended Care
Facilities. • Claims Processing: $150 million for a temporary increase to claims processing staff. Veterans Administration Facilities • Veterans Medical Facilities: $1 billion for veterans’ medical facilities. The Department has identified a
$5 billion backlog in needed repairs, including energy efficiency projects, at its 153 medical facilities. • Veterans Cemeteries: $50 million to put people to work making monument and memorial repairs at
cemeteries for American heroes.
xlii
Job Corps Facilities: $250 million to upgrade job training facilities serving at-risk youth while improving energy efficiency. Clean Water • Clean Water State Revolving Fund: $4 billion for loans to help communities upgrade wastewater
treatment systems. EPA estimates a $388 billion funding gap. The Association of State and Interstate Water Pollution Control Administrators found that 26 states have $10 billion in approved water projects.
• Drinking Water State Revolving Fund: $2 billion for loans for drinking water infrastructure. EPA estimates there is a $274 billion funding gap. The National Governors Association reported that there are $6 billion in ready-to-go projects, which could quickly be obligated.
• Rural Water and Waste Disposal: $1.38 billion to support $3.8 billion in grants and loans to help communities fund drinking water and wastewater treatment systems. In 2008, there were $2.4 billion in requests for water and waste loans and $990 million for water and waste grants went unfunded.
Water Resources • Corps of Engineers: $4.6 billion for environmental restoration, flood protection, hydropower, and
navigation infrastructure critical to the economy. The Corps has a construction backlog of $61 billion. • Bureau of Reclamation: $1 billion to provide clean, reliable drinking water to rural areas and to
ensure adequate water supply to western localities impacted by drought. • Watershed Infrastructure: $340 million for the Natural Resources Conservation Service watershed
improvement programs to design and build flood protection and water quality projects, repair aging dams, and purchase and restore conservation easements in river flood zones.
• International Boundary and Water Commission: $220 million to repair flood control systems along the international segment of the Rio Grande damaged by hurricane Katrina and other serious storms.
Environmental Cleanup • Superfund Hazardous Waste Cleanup: $600 million to clean up hazardous and toxic waste sites
that threaten health and the environment. EPA has 1,255 sites on its National Priority List, selected based on a hazard ranking system. There are many Superfund sites ready for construction, but not funded due to budget shortfalls and over 600 sites with ongoing construction that could be accelerated.
• Leaking Underground Storage Tanks: $200 million for enforcement and cleanup of petroleum leaks from underground storage tanks at approximately 1,600 additional sites. There are an estimated 116,000 sites with the potential to contaminate important water supplies.
• Nuclear Waste Cleanup: $6 billion for nuclear waste cleanup at sites contaminated by the nation’s past nuclear activities. Accelerating the completion of projects creates jobs and reduces long-term costs.
• NOAA Operations, Research and Facilities: $230 million for ready-to-go habitat restoration, research and maintenance activities.
• Brownfields: $100 million for competitive grants for evaluation and cleanup of former industrial and commercial sites - turning them from problem properties to productive community use. Last year EPA was only able to fund 37% of Brownfields applications.
Construction on Public Lands: $2.5 billion for infrastructure projects on federal lands including improvements to visitor facilities, road and trail restoration, preservation of buildings of cultural and historic importance, rehabilitation of abandoned mines and oil fields, and environmental cleanup projects. This includes $750 million for the National Park Service, $320 million for the Bureau of Land Management, $280 million for the National Wildlife Refuges and National Fish Hatcheries, and $650 million for the Forest Service.
xliii
Reducing Wildfires Threats: $515 million for hazardous fuels removal and other efforts to prevent wildfires on America’s wildlands. Making these investments today will create jobs in the short run, but also save long term costs of fighting fires in the future. Bureau of Indian Affairs: $500 million to address maintenance backlogs at schools, dams, detention and law enforcement facilities, and over 24,000 miles of roads. BIA schools alone have an over $1 billion construction and maintenance backlog including shamefully unsafe conditions. National Endowment for the Arts: $50 million to support workers in the arts. EDUCATION FOR THE 21st CENTURY We will provide our kids with a 21st Century education and help families send their kids to college so that American students can compete with any worker in the world. Higher Education: Tuition is up, unemployment is up, and as a result more people are choosing to go to school to upgrade their skills and more of these students need student aid. This investment addresses those short term needs while investing in our nation’s future economic strength. • Pell Grants: $15.6 billion to increase the maximum Pell Grant by $500, from $4,850 to $5,350. • College Work-Study: $200 million to support undergraduate and graduate students who work. K-12 Education and Early Childhood Development: As states begin tackling a projected $350 billion in budget shortfalls these investments will prevent cuts to critical education programs and services. • IDEA Special Education: $12.2 billion for formula grants to increase the federal share of special
education costs and prevent these mandatory costs from forcing states to cut other areas of education. • Title I Help for Disadvantaged Kids: $13 billion for grants to help disadvantaged kids in nearly every
school district and more than half of all public schools reach high academic standards. • Education Technology: $650 million for 21st century classrooms, including computer and science labs
and teacher technology training. • Statewide Data Systems: $250 million for competitive grants to states to design and develop data
systems that analyze individual student data to find ways to improve student achievement, providing teachers and administrators with effective tools.
• Education for Homeless Children and Youth: $70 million for formula grants to states to provide services to homeless children including meals and transportation when high unemployment and home foreclosures have created an influx of homeless kids.
• Improving Teacher Quality: $300 million, including $200 million for competitive grants to school districts and states to provide financial incentives for teachers and principals who raise student achievement and close the achievement gaps in high-need schools and $100 million for competitive grants to states to address teacher shortages and modernize the teaching workforce.
• Child Care Development Block Grant: $2 billion to provide child care services for an additional 300,000 children in low-income families while their parents go to work. Today only one out of seven eligible children receives care.
• Head Start and Early Head Start: $2.1 billion to provide comprehensive development services to help children succeed in school. Funds are distributed based on need. Only about half of all eligible preschoolers and less than 3 percent of eligible infants and toddlers participate in Head Start.
QUALITY AFFORDABLE HEALTHCARE To save not only jobs, but money and lives, we will update and computerize our healthcare system to cut red tape, prevent medical mistakes, and help reduce healthcare costs by billions of dollars each year.
xliv
Health Information Technology: $19 billion to jumpstart efforts to computerize health records to cut costs and reduce medical errors. Prevention and Wellness Fund: $1 billion to fight preventable chronic diseases, the leading cause of deaths in the U.S., and infectious diseases. Preventing disease rather than treating illnesses is the most effective way to reduce healthcare costs. This includes hospital infection prevention, immunization programs, and evidence-based disease prevention. Healthcare Effectiveness Research: $1.1 billion for Healthcare Research and Quality programs to compare the effectiveness of different medical treatments. Finding out what works best and educating patients and doctors will improve treatment. Community Health Centers: $2 billion to increase the number of uninsured Americans who receive quality healthcare and renovate clinics and make health information technology improvements. More than 400 applications submitted earlier this year for new or expanded CHC sites remain unfunded. Training Primary Care Providers: $500 million to address shortages and prepare our country for universal healthcare by training primary healthcare providers including doctors, dentists, and nurses as well as helping pay medical school expenses for students who agree to practice in underserved communities through the National Health Service Corps. Indian Health Service: $500 million to modernize aging hospitals and health clinics and make healthcare technology upgrades to improve healthcare for underserved rural populations. HELP WORKERS HURT BY THE ECONOMY High unemployment and rising costs have outpaced Americans’ paychecks. We will help workers train and find jobs, and help struggling families make ends meet. Helping Workers Find Jobs • Training and Employment Services: $3.95 billion for job training including formula grants for adult,
dislocated worker, and youth services, and increased funds for the YouthBuild program, and competitive grants for training in health care and green jobs.
• Vocational Rehabilitation State Grants: $500 million for state formula grants to help persons with disabilities prepare for gainful employment.
• Employment Services Grants: $400 million to match unemployed individuals to job openings through state employment service agencies and allow states to provide customized services.
• Community Service Employment for Older Americans: $120 million to provide subsidized community service jobs for low-income older Americans.
Attacking the Housing Crisis • Public Housing Capital Fund: $4 billion for building repair and modernization, including critical safety
repairs. Every dollar of Capital Fund expenditures produces $2.12 in economic return. • HOME: Low Income Housing Tax Credits: $2.25 billion for gap financing to restart low-income
housing construction stalled during the credit crisis. • Rental Assistance: $2 billion for full-year payments to owners receiving Section 8 project-based rental
assistance. • Native American Housing Block Grants: $510 million to rehabilitate and improve energy efficiency
at some of the over 42,000 housing units maintained by Native American housing programs. Half of the
xlv
funding will be distributed by formula and half will be competitively awarded to projects that can be started quickly.
• Neighborhood Stabilization: $2 billion to help communities purchase and rehabilitate foreclosed, vacant properties in order to create more affordable housing and reduce neighborhood blight.
• Homeless Assistance Grants: $1.5 billion for the Emergency Shelter Grant program to provide short term rental assistance, housing relocation, and stabilization services for families during the economic crisis. Funds are distributed by formula.
• Rural Housing Insurance Fund: $200 million to support $11 billion in direct loans and loan guarantees to help rural families and individuals buy homes during the credit crunch. Last year these programs received a record number of applications.
• Rural Community Facilities: $130 million to support grants and loans to rural areas for critical community facilities, such as for healthcare, education, fire and rescue, day care, community centers, and libraries. There are over $1.2 billion in applications pending.
• Lead Paint: $100 million for competitive grants to local governments and nonprofit organizations to remove lead-based paint hazards in low-income housing.
Alleviating Hunger • Supplemental Nutrition Assistance: $19.9 billion to provide a 13% increase in nutrition assistance to
modest-income families and to lift restrictions that limit the amount of time individuals can receive food stamps.
• Senior Nutrition Programs: $100 million for formula grants to states for elderly nutrition services including Meals on Wheels and Congregate Meals.
• School Lunch Program: $100 million to provide schools with assistance in purchasing equipment with priority for low-income schools.
• Emergency Food Assistance Program: $150 million to purchase commodities for food banks to refill emptying shelves.
Community Services Block Grant: $1 billion for grants to local communities to support employment, food, housing, and healthcare efforts serving those hardest hit by the recession. Community action agencies have seen dramatic increases in requests for their assistance due to rising unemployment, housing foreclosures, and high food and fuel prices. Community Development Block Grants: $1 billion for community and economic development projects including housing and services for those hit hard by tough economic times. Emergency Food and Shelter: $100 million to help local community organizations provide food, shelter, and support services to the nation’s hungry, homeless, and people in economic crisis including one-month utility payments to prevent service cut-off and one-month rent or mortgage assistance to prevent evictions or help people leave shelters. Funds are distributed by formula based on unemployment and poverty rates. Social Security Administration Disability Backlog and Claims Processing: $500 million to help the Social Security Administration process a steep rise in disability and retirement claims, getting people their benefits faster, and preventing existing backlogs from getting worse. Centers for Independent Living: $140 million for state formula grants to help individuals with disabilities continue to live in their communities. AmeriCorps Programs: $200 million to put approximately 16,000 additional AmeriCorps members to work doing national service, meeting needs of vulnerable populations and communities during the recession.

xlvi
Nonprofit Fund: $50 million for grants to community-based organizations to provide critical safety net services to needy individuals and families. Department of Labor Worker Protection and Oversight: $80 million to ensure that worker protection laws are enforced as recovery infrastructure investments are carried out. SAVE PUBLIC SECTOR JOBS AND PROTECT VITAL SERVICES We will provide relief to states, so they can continue to employ teachers, firefighters, and police officers and provide vital services without having to unnecessarily raise middle class taxes. State and Local Law Enforcement: $4 billion to support state and local law enforcement including $2 billion for Byrne Justice Assistance formula grants to support local law enforcement efforts with equipment and operating costs, and $1 billion for the COPS hiring grant program. Periodic Census and Programs, Communications: $1 billion for work necessary to ensure a successful 2010 census, including additional personnel and up to $250 million for expanded communications and outreach programs to minimize undercounting. Firefighter Assistance Grants: $210 million for grants to modify, upgrade, and construct fire stations to ensure that vital emergency response infrastructure remains intact during this economic crisis. Funds will be competitively awarded. Transit Security Grants: $150 million for grants to protect critical transit infrastructure, including freight rail, Amtrak and ferry systems in high-threat areas. Funds are competitively awarded based on security risk.
Port Security Grants: $150 million for grants to protect critical port facilities and infrastructure. Funds are
competitively awarded based on security risk.
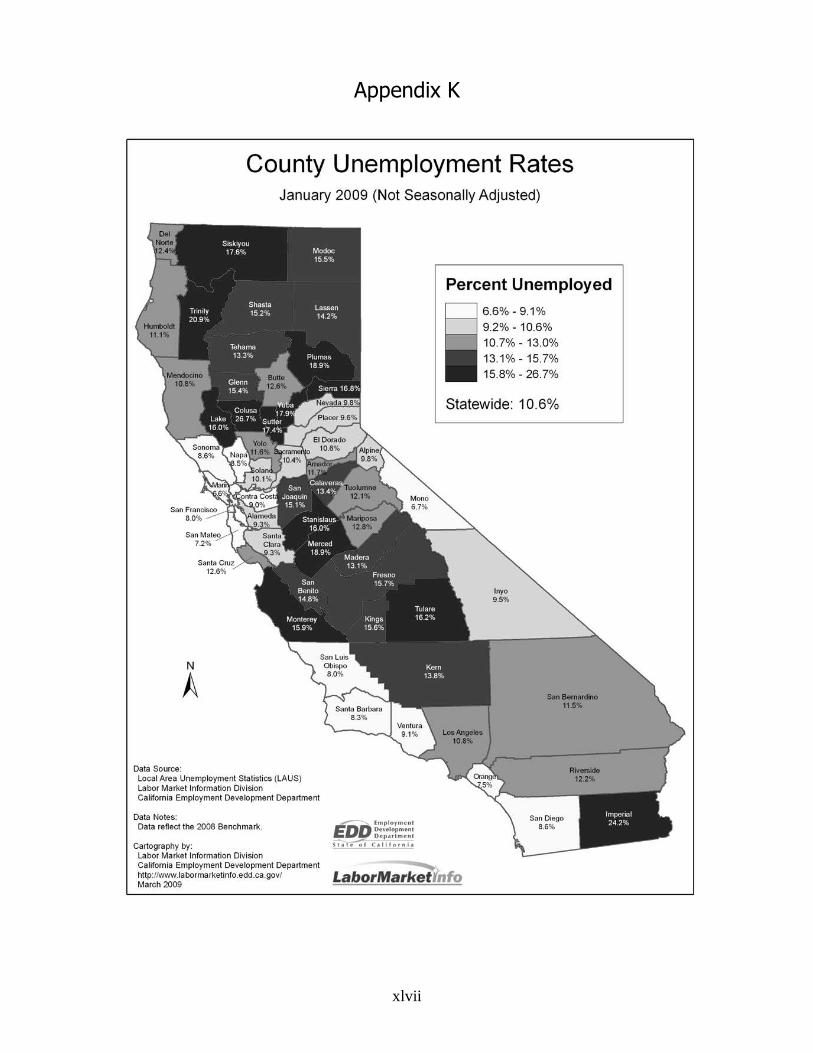
xlvii
Appendix K
xlviii
Appendix L
Background on the Unemployment Fund Financial Crisis
A. Introduction
California's unemployment rate rose to 10.1% in January 2009. A month earlier unemployment stood at
9.3%, and a year ago it was 7.2%. As a consequence of rising unemployment, and a flawed
Unemployment Insurance (UI) system, the state's Unemployment Fund (Fund) is going broke, and will
become insolvent by the end of this calendar year.
In October 2008, the Employment Development Department projected that at the end of 2009, the
Unemployment Fund will be $2.4 billion in the red and have a $4.9 billion negative balance by the end of
2010. As unemployment continues to rise as economic forecasts predict, the Unemployment Fund deficits
can be even higher.
This appendix will provide background information on the Unemployment Insurance (UI) Program and the
Unemployment Fund, identify average and maximum benefits, describe the funding mechanism, provide a
status report on the Unemployment Fund, and present options for returning the Fund to solvency.
B. Background on UI Program and Unemployment Fund
The unemployment insurance program was established by Congress over 70 years ago, during the Great
Depression, as part of the Social Security Act in 1935. This federal law requires individual states to enact
an unemployment insurance law with a purpose to provide temporary wage replacement assistance to
workers who are unemployed through no fault of their own.
The federal law establishes the basic structure of the UI Program, while state law sets forth the benefits
and the tax structure.
The UI Program provides unemployment insurance compensation to covered employees who become
unemployed and meet a series of eligibility criteria. Unemployment insurance promotes economic stability
for unemployed workers and communities by maintaining the workers' purchasing power.
1. Unemployment Fund
The state Employment Development Department (EDD) administers the Unemployment Fund as part of the
federal-state partnership of the UI Program.2 The state Unemployment Fund is a special fund into which
employer contributions are deposited. The purpose of this fund is to pay for the regular UI benefits of
eligible unemployed workers.
2 State statutory authority: Sections 1521 et seq. of the California Unemployment Insurance Code.
xlix
2. Funding for Unemployment Insurance
The UI Program is funded entirely by employers who pay payroll taxes on each employee. Employers pay a
federal tax that funds program administration and the federal share of extended benefits to workers, while
the state tax pays for regular benefit payments to unemployed individuals.
After receiving an offset of 5.4% against the federal tax rate (6.2%), federal UI taxes on most employers is
a net tax of 0.8 percent on the first $7,000 of each employee's earnings, or $56 per employee per year.3
The state UI tax system is composed of multiple parts that are interrelated. These pieces include the
taxable wage base, an experience modified tax rate, employee earnings requirements, minimum and
maximum benefit amounts, and the number of UI beneficiaries. Each of these components is discussed in
more detail below.
a. Taxable Wage Base
Federal law requires a minimum taxable wage base of $7,000. This means that each state must require
employers to pay unemployment taxes on the first $7,000 of each employee's wages. Federal law does not
set a maximum taxable wage base level and allows states to set their own taxable wage base. Table A
provides a listing of the states and their taxable wage bases.
California has the lowest taxable wage base allowed by federal law at $7,000,4 and this figure has not
changed since 1983. Presently, 42 states tax more than the first $7,000 of employee earnings. The
average national taxable wage base is $13,774, and Idaho has the highest taxable wage base at $32,200.
For employers with higher-wage and full-time employees, this wage base may be 10% or less of total
wages paid. For other employers, with low-wage and seasonal employees, this wage base can be as much
as 70% or more of total wages paid.
Average wages in California have risen over time as the cost-of-living has risen. A significant number of
states (18) use "indexing" to automatically increase the taxable wage base annually, reflecting changes in
average wages. The basic principle involved in this approach is that as wages increase with the cost of
living, the funding base must also grow proportionately.
Without indexing or periodic increases in the taxable wage base, the Unemployment Fund can experience a
built-in downward spiral towards insolvency. This is because as wages rise over time, the benefit payouts
from the Fund will rise as more individuals qualify for higher weekly benefit amounts. Yet, with a static
3 Employers are subject to a 6.2 percent federal tax, but receive an offset of 5.4 percent against the federal tax rate, resulting in a net federal tax of 0.8 percent on the first $7,000 in the wages of an employee, or a net cost to the employer of $56 per employee per year. This tax credit can be eliminated by the U.S. Department of Labor if a state's UI laws do not conform to the federal requirements. The tax credit can also be reduced if a state Unemployment Fund is insolvent and must borrow from the federal government, and the state fails to repay the loan in given period of time.
Public employers do not pay federal or state UI taxes. Instead, they reimburse the Unemployment Fund for all UI benefits paid to their former employees.
4 California is one of eight states with the lowest taxable wage base in the nation.
l
taxable wage base, revenues into the Fund will not keep pace with increased benefit payouts. This would
be true even if there are no statutory benefit increases over time.5
b. Tax Rate
Federal law requires a maximum tax rate of at least 5.4% for state UI taxes. States must adopt at least a
5.4 percent rate in order for that state's employers to receive the full credit against the federal UI tax, as
noted above.
In California, there are seven tax schedules (AA – F), with rates ranging from 0.1 to 5.4 percent. This
range is explained more fully in the "Experience Rating" section, below. The additional 15 percent
"emergency solvency surcharge" (the F+ Schedule) increases the maximum tax rate to 6.2 percent.
California employers are presently subject to the F+ Schedule and these costs range from $105 to $434 per
employee per year.
For the last 25 years, UI tax revenue has been capped at the taxable wage ceiling of $7,000 and the
maximum tax rate of 5.4 percent (plus the emergency solvency surcharge).
3. Experience Rating
Federal law allows reduced tax rates based on an individual employer's experience with regard to
unemployment, or "experience rating." When a former employee collects UI benefits, those payments
represent a charge to the employer. The more charges to the employer's account, the higher the tax rate
to the employer. If an employer maintains a stable workforce, his or her tax rate will be lower. Thus,
experience rating serves as an incentive for employers to take actions that minimize employee layoffs.
California uses a "pooled-risk" insurance fund approach. This approach requires all participating employers
to pay UI taxes that are pooled into a common fund for benefit payments. Pooled-risk requires all
employers to assume some liability for the state's unemployed workers, helping to defray the high UI costs
of employers with high experience ratings. Employers who hire many temporary or seasonal workers can
be expected to pay at a higher rate than employers who don't have frequent layoffs. However, the higher
tax rate paid by those employers may not be sufficient to recover all of the additional costs to the UI
system. Therefore, these extra costs are spread across the system to all employers. It is estimated that
36% of the UI benefits result from this spreading of costs.
4. Earnings Requirements of Employees
Individuals may be eligible for UI benefits if they earn sufficient wages during a base period. In California,
an unemployed worker must have earned a minimum of $1,300 in a single calendar quarter or $1,125
during a base period, consisting of a 12-month period in the past (but generally excluding the 4- 6 months
immediately previous to becoming unemployed). California has one of the lowest base period earnings
requirements. The State of North Carolina has one of the highest base period earnings requirement at
$4,291.
5 While California has had benefit increases in the 25 years since the state adopted the $7,000 taxable wage base, California's current benefit level ranks 40th in the nation using the standard federal measure (i.e., average benefits divided by average weekly wage). Source: DOL/ETA/OWS Division of Fiscal and Actuarial Services.
li
An individual's most recent earnings prior to becoming unemployed are not considered when establishing
eligibility for UI benefits, and this penalizes some employees who work in industries such as construction
and agriculture in which the main earnings are during summer or fall months.
5. Weekly Benefit Amount and Duration
Currently in California, the benefit amount ranges from a minimum of $40 per week to a maximum of $450
per week. The average weekly benefit in California is $307. California's UI benefit level is equal to an
income replacement rate of 50% of the employee's earnings, with a maximum benefit of $450 per week.
The State of Massachusetts has the highest maximum weekly benefit amount of $600 for an unemployed
worker, and $900 per week for those unemployed with dependents.
Regular UI benefits are payable for a maximum of 26 weeks. There is a one-week waiting period for which
no benefits are paid to an unemployed worker. Regular UI benefits are paid by state UI funds. Extended
UI benefits are paid by the federal government and generally are for a maximum of 13 weeks, per
extension, to unemployed workers who continue to be unemployed after the state benefits have been
exhausted.
6. The Number of UI Beneficiaries
California's unemployment rate increased to 7.7 percent of the labor force in August 2008. This is the
highest rate of the last 12 years. Last year, the unemployment rate in California was 5.5 percent. In
August 2008, 1.4 million people were unemployed in the state, an increase of 413,000 unemployed persons
from one year earlier. Also, in August 2008, there was an average of 504,667 UI weekly claims filed,6
compared to 352,725 in August of 2007, or a 43 percent increase in the number of UI claims filed from one
year ago.
C. Condition of the Unemployment Fund
The most recent report on the Unemployment Fund estimates that it will have a deficit by March of next
year. This forecast uses an unemployment rate of 6.6 percent for 2009, however, the unemployment rate
is now at 9.3 percent and the number of unemployed workers and UI claimants has been growing rapidly.
Even under the overly optimistic unemployment scenario, EDD estimates that the Unemployment Fund
would be in the red by $1.6 billion by the end of 2009, and to have a deficit of $3.5 billion by the end of
2010.7 As a result of the significantly higher unemployment levels, we can expect the Unemployment Fund
to have a much greater deficit than the EDD estimates next year, and each of the following years for the
foreseeable future. While the Unemployment Fund remained solvent through the end of 2008, it is likely
that it become insolvent in early 2009.
In the past two years, the Unemployment Fund has received approximately $5 billion in revenue and
disbursed approximately the same amount annually in UI benefit payments. In 2008, the Fund expects to
receive $5 billion in revenue and to pay total benefits of $6.8 billion. It is important to note that even in the
6 These figures represent weeks claimed and may include individuals collecting multiple times. 7 EDD made this projection in May, and is scheduled to release new estimates in late October. To date (10/1/08), we have the advantage of knowing the unemployment rates and UI claims levels for June, July, and August of 2008.
lii
overly optimistic unemployment scenario noted above,8 the Unemployment Fund is projected to receive $5
billion in 2009 and $5.2 billion in 2010 while disbursing $7.2 billion in 2009 and $7.2 billion in 2010.
D. Effects of Deficit
When the state Unemployment Fund has insufficient funds to pay benefits, the state must borrow funds
from the federal government but these funds must be repaid. The federal government requires repayment
of the principal and charges interest if the loan is not repaid by September 30. Furthermore, if additional
borrowing occurs between October 1 and December 31, interest is payable for that period and for the prior
months. However, federal law prohibits the state from paying the interest from the state Unemployment
Fund. Thus, the state will have to find another source of state funds to pay the interest costs, placing the
state General Fund at risk of covering these costs.
E. Policy Options
The Assembly Insurance Committee and the Assembly Budget Subcommittee No. 4 have asked EDD for
policy options to consider for returning the UI Fund to solvency.
In order to consider policy options, it may be necessary for the Legislature and Governor to decide those
key policies that would guide the writing of the corrective legislation. Among the policies that can be
considered are the following:9
• Should the Unemployment Fund be restructured to establish "Counter-cyclical Financing," or continue on a "Pay as You Go Basis"? In a "counter-cyclical financing" structure, during periods of economic prosperity, employers pay into the Fund at levels that will support UI benefits during downturns in the economy. This method of financing is also called "forward funding." In the "pay as you go financing" structure, which California currently uses, there are insufficient funds during periods of high unemployment and the need for extra financing.
• Should the taxable wage base be adjusted? UI payroll taxes are assessed on a taxable wage base, rather than on total wages paid to each employee. California uses the lowest federally-allowed wage base ($7,000), and most nearby states have a higher taxable wage base (Nevada is $24,600, Oregon is $30,200, and Washington is $31,400). California's taxable wage base has failed to keep pace with increases in the cost of living or with wages. Increasing the taxable wage base would generate additional revenue to the Unemployment Fund.
• Should the maximum UI tax be increased? Maximum UI tax rates range from 5.4 percent to 10 percent
across the United States. A low maximum tax rate has the effect of holding down UI costs for
employers with high utilization rates for UI benefits and spreading these costs over the rest of the
employer population. While nine states have the lowest taxable wage base ($7,000), only six states
have both the lowest maximum tax rate and the lowest taxable wage ceiling. Revenue in the
Unemployment Fund is directly related to the maximum tax rate and the taxable wage base. One
option for increasing the Fund would be to increase the maximum tax rate.
• Should California adopt an "alternative base period?" The Alternative Base Period (ABP) is a concept that looks at more recent earnings to determine benefit levels, rather than wages earned six months
8 6.4 percent unemployment rate in 2009 and 6.6 percent unemployment rate in 2010. 9 The source of many of these policy options is the briefing paper "California's Unemployment Insurance Trust Fund is at Risk of Insolvency," by Rona Sherriff, California Senate Office of Research, August 2003.
liii
prior to filing a UI claim. ABP more accurately reflects what workers were earning and spending in their communities at the time that they were laid off. Benefits based on an ABP would tend to sustain economic activity better, especially in more economically distressed communities.
Not only would an ABP immediately generate approximately $150 million in additional benefits which can be spent in communities around the state, but it is the last remaining element that is lacking in California law that could garner $903 million in new federal funds from the pending federal Unemployment Insurance Modernization Act. Legislation (AB3X 23) is currently pending before the California Legislature to make this change and enable California to draw down those significant federal dollars.
• Should the solvency surcharge be increased? California and 24 other states assess a surtax on
employers when the balance in the state's unemployment fund falls below a specified level. California's solvency surcharge is 1.15 percent of the employer's tax rate when the Unemployment Fund falls below 0.6 percent of taxable payroll. The threshold for assessment of a solvency surcharge or the amount of the surcharge could be increased to generate additional revenue to the Fund.
• Should access to UI benefits be maintained at current levels for workers across the spectrum of
earnings? Changes in eligibility requirements can affect the ability of low wage and part-time workers to qualify for benefits. Only nine states have earnings requirements lower than California.
• Should the state issue a bond to help the Unemployment Fund? Some states have authority to issue bonds to pay benefit costs as a way of avoiding taking out a federal loan. They assess special taxes to pay the bonds and related costs.
liv
Appendix M
Glossary of Terms
Abbreviations
BTH: Business Transportation and Housing Agency.
CAEZ: California Association of Enterprise Zones.
CalBIS: California Business Investment Services.
CALED: California Association for Local Economic Development.
CALGOLD: California Government Online to Desktops.
CALWORKS: The California Work Opportunity and Responsibility to Kids Program.
CDFI: Community Development Financial Institution.
CEDP: California Economic Development Partnership.
DGS: Department of General Services.
DVBE: Disabled Veterans Business Enterprise.
EDC: Economic Development Corporation.
EDD: Employment Development Department.
EDM: Emerging Domestic Markets
ETP: Employment Training Panel.
EZ: Enterprise Zone.
FDI: Foreign Direct Investment.
G-TEDA: Geographically-Targeted Economic Development Area.
HCD: Department of Housing and Community Development.
I-BANK: Infrastructure and Economic Development Bank.
JEDE: Jobs, Economic Development and the Economy Committee.
JTPA: Job Training Partnership Act.
LAMBRA: Local Agency Military Base Recovery Area.
MASA: Military and Aerospace Support Act.
MEA: Manufacturing Enhancement Area.
MOU: Memorandum of Understanding.
lv
OES: Office of Emergency Services.
OSBA: Office of Small Business Administration.
ROI: Return on Investment.
SBE: Small Business Enterprise.
SBLGP: Small Business Loan Guarantee Program.
TEA: Targeted Employment Area.
TTA: Targeted Tax Area.
WIA: Workforce Investment Act.
WIB: Workforce Investment Board.
Definitions:
BUSINESS TRANSPORTATION AND HOUSING AGENCY (BTH): BTH oversees the activities of 13
departments consisting of more than 42,000 employees, a budget greater than $11 billion, plus several
economic development programs and commissions. Its operations address financial services,
transportation, affordable housing, real estate, managed health care plans and public safety.
CALIFORNIA ASSOCIATION OF ENTERPRISE ZONES (CAEZ): Non-profit organization that lobbies
on behalf of Enterprise Zones and works to foster economic development within those zones.
CALIFORNIA BUSINESS INVESTMENT SERVICES (CalBIS): Housed in the Labor and Workforce
Development Agency, CalBIS serves employers, corporate real estate executives, and site location
consultants considering California for new business investment and expansion.
CALIFORNIA ASSOCIATION FOR LOCAL ECONOMIC DEVELOPMENT (CALED): CALED is a
statewide professional economic development organization dedicated to advancing its members’ ability to
achieve excellence in delivering economic development services to their communities and business clients.
CALED’s membership consists of public and private organizations and individuals involved in economic
development.
CALIFORNIA GOVERNMENT ONLINE TO DESKTOPS (CalGOLD): The CalGOLD database provides
links and contact information that direct businesses to agencies that administer and issue business permits,
licenses and registration requirements from all levels of government. The CalGold listings include
descriptions of the requirements, the names, addresses, and telephone numbers of the agencies that
administer those requirements and issue the permits and licenses, and in most cases a direct link to the
agencies' Internet web pages.
CALIFORNIA WORK OPPORTUNITY AND RESPONSIBILITY TO KIDS PROGRAM (CALWORKS):
Provides temporary financial assistance and employment focused services to families with minor children
who have income and property below State maximum limits for their family size. Most able-bodied aided
parents are also required to participate in the CalWORKs GAIN employment services program.
lvi
COMMUNITY DEVELOPMENT FINANCIAL INSTITUTION (CDFI): Nationwide, over 1000 CDFIs
serve economically distressed communities by providing credit, capital and financial services that are often
unavailable from mainstream financial institutions. CDFIs have loaned and invested in distressed
communities. Their loans and investments have leveraged billions more dollars from the private sector for
development activities in low wealth communities across the nation. California offers tax credits for
investments in CDFI’s under the Insurance Tax Law, as well as under the Personal and Corporate Income
Tax Laws.
CALIFORNIA ECONOMIC DEVELOPMENT PARTNERSHIP (CEDP): The CEDP was formed by
Governor Schwarzenegger in 2005 as an interagency team to coordinate state government economic
development activities. It seeks seamless coordination between the state, regional/local economic
development organizations, and public/private resources for the retention, expansion and attraction of jobs
in California.
DEPARTMENT OF GENERAL SERVICES (DGS): The department consists of six divisions, 23 operational
offices, 4,000 employees and a budget in excess of half a billion dollars. Its functions include e-commerce
and telecommunications; siting, acquisition, development, leasing, disposal and management of state
properties; architectural approval of local schools and other state-responsibility buildings; printing services
provided by the second largest government printing plant in the U.S.; procurement of supplies needed by
other state agencies; and maintenance of the vast fleet of state vehicles. The director serves on half a
dozen state boards and commissions.
DEPARTMENT OF HOUSING AND COMMUNITY DEVELOPMENT (HCD): HCD is one of 13
departments within BTH. As California's principal housing agency, the mission of HCD is to provide
leadership, policies and programs to expand and preserve safe and affordable housing opportunities and
promote strong communities for all Californians. HCD is responsible for oversight of California’s G-TEDA
programs.
DISABLED VETERAN BUSINESS ENTERPRISE (DVBE): Certified DVBE’s that meet eligibility
requirements are eligible to receive bid preferences on state contracts.
ECONOMIC DEVELOPMENT CORPORATION (EDC): Locally based corporations whose mission is to
promote investment and economic growth in their region.
ECONOMIC STRATEGY PANEL: The Economic Strategy Panel was established in 1993 to develop an
overall economic vision and strategy to guide public policy. The Panel engages in an objective and
collaborative biennial planning process that examines economic regions, industry clusters, and cross-
regional economic issues. The California Regional Economies Project is currently the lead mechanism for
these efforts.
EMPLOYMENT DEVELOPMENT DEPARTMENT (EDD): EDD offers a wide variety of services under the
Job Service, Unemployment Insurance, Disability Insurance, Workforce Investment, and Labor Market
Information programs. As California’s largest tax collection agency, EDD also handles the audit and
collection of payroll taxes and maintains employment records for more than 17 million California workers.
EMERGING DOMESTIC MARKETS (EDM): The term "emerging domestic markets" refers to people,
places, or businesses with growth potential, which have historically faced systemic capital constraints. The
lvii
demographics of emerging domestic markets include ethnic- and women-owned firms, urban and rural
communities, companies which serve low- to moderate-income populations, and other small- and medium-
sized businesses.
EMPLOYMENT TRAINING PANEL (ETP): ETP is a California State agency that began in 1983 and is
designed to fund training that meets the needs of employers for skilled workers and the need of workers
for long-term jobs. The program funds the retraining of incumbent, frontline workers in companies
challenged by out-of-state competition. ETP also funds training for unemployed workers, and prioritizes
small businesses, and employers and workers in high unemployment areas of the State. ETP is funded by a
tax on business.
ENTERPRISE ZONE (EZ): Geographically-based economic incentive areas in California that provide
regulatory or tax benefits to businesses. There are 42 Enterprise Zones in California.
GEOGRAPHICALLY TARGETED ECONOMIC DEVELOPMENT AREA (G-TEDA): A generic term for all
geographically-based economic incentive areas in California, including TTAs, LAMBRAs, EZs, and MEAs.
INFRASTRUCTURE AND ECONOMIC DEVELOPMENT BANK (I-BANK): The I-Bank is a state
financing authority that provides low-cost financing to public agencies, manufacturing companies, nonprofit
organizations and other entities eligible for tax-exempt financing. Since January 1, 1999, the I-Bank has
financed more than $6.5 billion in tax-exempt bonds and loans for economic development and public
infrastructure projects throughout the state.
JOB TRAINING PARTNERSHIP ACT (JTPA): JTPA is a federal law that authorizes and funds a number
of employment and training programs in California. JTPA's primary purpose is to establish programs to
provide job training services for economically disadvantaged adults and youth, dislocated workers and
others who face significant employment barriers. These programs help prepare individuals in California for
participation in the state's workforce, increasing their employment and earnings potential, improving their
educational and occupational skills and reducing their dependency on welfare.
LOCAL AGENCY MILITARY BASE RECOVERY AREA (LAMBRA): A LAMBRA is an area located in
California that is designated as such by the Business, Transportation and Housing Agency. LAMBRAs are
established to stimulate growth and development in areas that experience military base closures.
Taxpayers investing, operating, or located within a LAMBRA may qualify for special tax incentives. There
are currently eight LAMBRAs: Southern California International Airport, Castle Air Force Base, Mare Island
Naval Base, San Bernardino International Airport and Trade Center, Alameda Naval Air Station, Mather
Field/McClellan Park, Liberty Station, and Tustin Marine Corps Air Station.
MANUFACTURING ENHANCEMENT AREA (MEA): Incentives available to businesses located in an MEA
are streamlining local regulatory controls, reduced local permitting fees and eligibility to earn $29,234 or
more in state tax credits for each qualified employee hired. All manufacturing businesses that are engaged
in those lines of business described in Codes 2011 to 3999, inclusive, of the Standard Industrial
Classification (SIC) and are located in the MEA are eligible for program benefits. There are 2 MEAs located
in California. They are the Cities of Brawley and Calexico (contacts are listed below). Each community is
located in Imperial County. An MEA designation lasts until December 31, 2012.
lviii
MICROBUSINESS: A business that was started with less than $35,000 in equity, and has fewer than five
employees.
MILITARY AND AEROSPACE SUPPORT ACT (MASA): Established the Office of Military and Aerospace
Support, located in the Business, Transportation and Housing Agency, which has numerous duties of which
the main focus is development and implementation of a strategic plan to keep military bases in the state.
The office is also charged with assisting communities with the conversion of military bases closed or
realigned during prior or recent BRAC rounds. This office is set to sunset on January 1, 2009.
NORTH AMERICAN INDUSTRY CLASSIFICATION SYSTEM (NAICS): The North American Industry
Classification System (NAICS) has replaced the U.S. Standard Industrial Classification (SIC) system. NAICS
was developed jointly by the U.S., Canada, and Mexico to provide new comparability in statistics about
business activity across North America. The NAICS and SIC manuals provide code number for every
industry. These codes are frequently used in legislation to identify industries, especially those benefiting
from certain tax legislation like the Manufacturers Investment Credit (MIC).
OFFICE OF EMERGENCY SERVICES (OES): The Governor’s Office of Emergency Services coordinates
overall state agency response to major disasters in support of local government. The office is responsible
for assuring the state’s readiness to respond to and recover from natural, manmade, and war-caused
emergencies, and for assisting local governments in their emergency preparedness, response and recovery
efforts.
OFFICE OF SMALL BUSINESS ADMINISTRATION (OSBA): Since its founding on July 30, 1953, the
U.S. Small Business Administration has delivered about 20 million loans, loan guarantees, contracts,
counseling sessions and other forms of assistance to small businesses.
SMALL BUSINESS ENTERPRISE (SBE): A business with 100 or fewer employees, and an average
annual gross receipts of $10 million or less over the previous three tax years, or a manufacturer with 100 or
fewer employees. SBE’s are eligible to receive a 5% bid preference on state contracts.
SMALL BUSINESS LOAN GUARANTEE PROGRAM (SBLGP): The state Small Business Loan Guarantee
Program (SBLGP) provides guarantees on bank loans to small businesses that would otherwise not be
made. A network of 11 Small Business Financial Development Corporations - working closely with small
business borrowers and local community banks - issues the guarantees on behalf of the state. The
guarantees are backed by a trust fund that can be leveraged four times. The state currently guarantees
more than $276 million in outstanding loans.
SPECIAL FUND FOR ECONOMIC UNCERTAINTIES: A fund in the General Fund (a similar reserve is
included in each special fund) authorized to be established by statutes and Budget Act control sections to
provide for emergency situations. (GC 16418)
TARGETED EMPLOYMENT AREA (TEA): One of many options to voucher an employee, Targeted
Employment Areas (TEA) allow residents of certain designated low-income areas to qualify Enterprise Zone
employers for substantial hiring credits.
TARGETED TAX AREA (TTA): The Tulare TTA is a program very similar to Enterprise Zones. TTA offers
incentives that are only available to companies located in the Tulare TTA and engaged in a trade or
lix
business within certain Standard Industrial Codes. State incentives include tax credits for sales and use
taxes paid on certain machinery, machinery parts, and equipment; tax credits for hiring qualified
employees; and a fifteen year net operating loss carry-forward.
WORKFORCE INVESTMENT ACT (WIA): The federal Workforce Investment Act (WIA), which
superseded the Job Training Partnership Act, offers a comprehensive range of workforce development
activities through statewide and local organizations. Available workforce development activities provided in
local communities can benefit job seekers, laid off workers, youth, incumbent workers, new entrants to the
workforce, veterans, persons with disabilities, and employers. The purpose of these activities is to promote
an increase in the employment, job retention, earnings, and occupational skills improvement by
participants. California will receive approximately $454 million from the federal government this year to
provide services for adults, laid-off workers, and youth.
WORKFORCE INVESTMENT BOARD (WIB): The Governor has appointed a State Workforce
Investment Board (WIB) consisting primarily of representatives from businesses, labor organizations,
educational institutions, and community organizations. The State WIB assists the Governor in designing a
statewide plan and establishing appropriate program policy.
lx
Bibliography
2007 COIN Data Call Key Findings. California Organized Investment Network, California Department of
Insurance. March 2008.
Anderson, Thomas. Foreign Direct Investment in the United States – New Investment in 2004. June 2005.
Assembly Committee on Jobs, Economic Development, and the Economy. Microenterprise: The Engine of
Regional Economics. 2006.
Assembly Committee on Jobs, Economic Development, and the Economy and Assembly Committee on
Revenue and Taxation. 20 Years of California Enterprise Zones: A Review and Prospectus.
Assembly Committee on Jobs, Economic Development, and the Economy and Senate Committee on
Business, Professions, and Economic Development. California Trade Prospectus: Finding Our Way Within a
Global Economy. 2006.
Asset Building and Community Development. 2008. Ford Foundation. Accessed 9 September 2008
http://www.fordfound.org/programs/assets.
Extended Bibliography will be added in final publication
lxi
End Notes
1 http://www.bea.gov/regional/gsp/; Bureau of Economic Analysis, Gross State Product, accessed 03/06/09 2 http://www.hcd.ca.gov/hpd/hc092508.pdf; Department of Housing and Community Development, "California's Deepening Housing Crisis: September 25, 2008," accessed 03/06/09 3 http://www.calmis.cahwnet.gov/file/lfmonth/calmr.pdf; California Employment Development Department, “California Labor Market Review, January 2009,” accessed 03/06/09 4 http://www.bea.gov/regional/gsp/; Bureau of Economic Analysis, Gross State Product, accessed 03/06/09 5 http://siteresources.worldbank.org/DATASTATISTICS/Resources/GDP.pdf; accessed 03/06/09 6 http://siteresources.worldbank.org/DATASTATISTICS/Resources/GDP.pdf; accessed 03/06/09 7 http://www.calmis.cahwnet.gov/file/lfmonth/calmr.pdf; California Employment Development Department, “California Labor Market Review, January 2009,” accessed 03/06/09 8 http://www.calmis.cahwnet.gov/file/lfmonth/calmr.pdf; California Employment Development Department, “California Labor Market Review, January 2009,” accessed 03/06/09 9 http://www.calmis.cahwnet.gov/file/lfmonth/calmr.pdf; California Employment Development Department, “California Labor Market Review, January 2009,” accessed 03/06/09 10 http://www.calmis.cahwnet.gov/file/lfmonth/calmr.pdf; California Employment Development Department, “California Labor Market Review, January 2009,” accessed 03/06/09 11 http://www.ofii.org/ca.htm; Organization for International Investment, accessed 03/06/09 12 http://www.ofii.org/ca.htm; Organization for International Investment, accessed 03/06/09 13 http://www.ita.doc.gov/td/industry/otea/state_reports/california.html; accessed 03/06/09 14 http://www.ofii.org/ca.htm; Organization for International Investment, accessed 03/06/09 15 http://www.calmis.cahwnet.gov/file/lfmonth/calmr.pdf; California Employment Development Department, “California Labor Market Review, January 2009,” accessed 03/06/09 16 http://www.hcd.ca.gov/hpd/hc092508.pdf; Department of Housing and Community Development, “California's Deepening Housing Crisis: September 25, 2008,” accessed 03/06/09 17 http://www.realtytrac.com/contentmanagement/library.aspx?channelid=13&itemid=5872, RealtyTrac, accessed 03/10/2009 18 http://www.hcd.ca.gov/hpd/hc092508.pdf; Department of Housing and Community Development, “California's Deepening Housing Crisis: September 25, 2008,” accessed 03/06/09 19 http://www.hcd.ca.gov/hpd/hc092508.pdf; Department of Housing and Community Development, “California's Deepening Housing Crisis: September 25, 2008,” accessed 03/06/09 20 http://energyalmanac.ca.gov/overview/energy_sources.html; California Energy Commission, “California's Major Sources of Energy,” accessed 03/06/09 21 http://www.energyalmanac.ca.gov/petroleum/petroleum_watch/2009-02-05_PETROLEUM_WATCH.PDF; California Energy Commission, “Petroleum Watch,” accessed 03-06-09 22 http://www.energyalmanac.ca.gov/petroleum/petroleum_watch/2009-02-05_PETROLEUM_WATCH.PDF; California Energy Commission, “Petroleum Watch,” accessed 03-06-09 23 http://www.milkeninstitute.org/tech/tech.taf ; Milken Institute Science and Technology Index; June 2008; accessed 03/06/09 24 http://www.uspto.gov/web/offices/ac/ido/oeip/taf/cst_all.pdf; Patents by Country/State and year, all patents, all types, January 1, 1977 to December 31, 2007; accessed 03/06/09 25 http://www.gcx-online.com/gcx/article.asp?magarticle_id=653; Global Corporate Expansion, Economic Development Rankings-2008; accessed 03/06/09 26 http://www.milkeninstitute.org/publications/publications.taf?function=detail&ID=576&cat=ResRep; Milken Institute, “Mind to Market: A Global Analysis of University Biotechnology Transfer and Commercialization, 2006”; University Technology Transfer and Commercialization Index, accessed 03/06/09 27 http://www.calchamber.com/BusinessResources/InternationalResources/AllAboutInternationalTrade/Pages/TradeStatistics.aspx; CalChamber, Trade Statistics; accessed 03/06/09 28 http://www.ita.doc.gov/td/industry/otea/state_reports/california.html; International Trade Administration, U.S. Department of Commerce, “California: Exports, Jobs, and Foreign Investment”; accessed 03/06/09 29 http://www.ita.doc.gov/td/industry/otea/state_reports/california.html; International Trade Administration, U.S. Department of Commerce, “California: Exports, Jobs, and Foreign Investment”; accessed 03/06/09 30 California Business, Transportation & Housing Agency; Toward a California Trade and Investment Strategy: Potential Roles for the State in Global Market Development, October 1, 2007; Page 8 31 http://www.calchamber.com/BusinessResources/InternationalResources/AllAboutInternationalTrade/Pages/TradeStatistics.aspx; CalChamber, Trade Statistics; accessed 03/06/09 32 http://www.ita.doc.gov/td/industry/otea/state_reports/california.html; International Trade Administration, U.S. Department of Commerce, “California: Exports, Jobs, and Foreign Investment”; accessed 03/06/09 33 http://www.ita.doc.gov/td/industry/otea/state_reports/california.html; International Trade Administration, U.S. Department of Commerce, “California: Exports, Jobs, and Foreign Investment”; accessed 03/06/09 34 http://www.ita.doc.gov/td/industry/otea/state_reports/california.html; International Trade Administration, U.S. Department of Commerce, “California: Exports, Jobs, and Foreign Investment”; accessed 03/06/09