california healthcare performance information system...
TRANSCRIPT

California Healthcare Performance Information System (CHPI)
Methods for Rating Physicians and Practice Sites – Cycle 2
Prepared by:
California Healthcare Performance Information System
Last updated September 2016

Contents
Contents ....................................................................................................................................................................................... 2
Figures................................................................................................................................................................ .......................... 3
Tables ................................................................................................................................................................ ........................... 3
Project Team ................................................................................................................................................................ .............. 4
Executive Summary ................................................................................................................................................................ 5
Introduction ................................................................................................................................................................ ............... 8
Data Sources .............................................................................................................................................................................. 9
Measures ................................................................................................................................................................ ................... 12
Individual Measures ........................................................................................................................................................ 12
Composite Measures ....................................................................................................................................................... 16
Attribution ................................................................................................................................................................................ 17
Overview ................................................................................................................................................................ .............. 17
Evaluation and Management (E&M) Codes Used As the Basis for Attribution ....................................... 18
Primary Care Physician Attribution .......................................................................................................................... 19
Specialist Attribution Rule ............................................................................................................................................ 20
Practice Site Attribution Rule ...................................................................................................................................... 21
California Physician Database (CPD) and Attribution ....................................................................................... 22
Measure-Specific Designated Specialties ................................................................................................................ 23
Scoring ....................................................................................................................................................................................... 24
Risk Adjustment ..................................................................................................................................................................... 24
Reported Result: Physician and Practice Site Rates ........................................................................................... 25
Statistical Validity .................................................................................................................................................................. 25
Physician and Practice Site Measure-Specific Reliability ................................................................................. 25
Calculating Reliability Statistics ................................................................................................................................. 25
Reportable Results for Physicians and Practice Sites ........................................................................................ 26
Reportable Measures ...................................................................................................................................................... 27
Outliers ................................................................................................................................................................ ...................... 28
Peer Groups.............................................................................................................................................................................. 28
Benchmarks ............................................................................................................................................................................. 28

Benchmarks to Assign Star Ratings .......................................................................................................................... 28
Reported Result: Physician and Practice Site Percentile Ranks .................................................................... 29
Reported Result: Physician and Practice Site Rates ........................................................................................... 29
Reported Result: Physician and Practice Site Star Ratings ............................................................................. 29
Additional Benchmarks .................................................................................................................................................. 30
Composites ................................................................................................................................................................ ............... 30
Composite Calculations .................................................................................................................................................. 30
Review and Corrections ...................................................................................................................................................... 31
Figures
Figure 1. Overview of CHPI Operations .......................................................................................................................... 9 Figure 2. CHPI Data Intake and Auditing Process .................................................................................................... 11 Figure 3. CHPI Individual Physician and Practice Site Performance Hierarchy .......................................... 16 Figure 4. Rule for Attributing Patients to PCPs ......................................................................................................... 20 Figure 5. Rule for Attributing Patients to Specialists.............................................................................................. 21 Figure 6. Practice Site Attribution Rule ........................................................................................................................ 22 Tables
Table 1. Current and Past CHPI Data Types................................................................................................................ 10 Table 2. CHPI Cycle 2 Clinical Measures ...................................................................................................................... 12 Table 3. CHPI Denominator Periods, Numerator Periods, and Data Types................................................... 15 Table 4. CHPI Cycle 2 Composites and Underlying Measures ............................................................................. 17 Table 5. CHPI Defined Specialties and Reporting Groups ..................................................................................... 18 Table 6. CHPI E&M Attribution Codes ........................................................................................................................... 18 Table 7. Data Sources for CHPI CPD ............................................................................................................................... 23 Table 8. Reported Result by Reporting Outlet ........................................................................................................... 23

4 California Healthcare Performance Information System - Methods for Rating Physicians and Practice Sites – Cycle 2 ©CHPI 2016
575 MARKET STREET, SUITE 600, SAN FRANCISCO, CA 94105
Project Team
California Healthcare Performance Information System (CHPI) Project Staff
Rachel Brodie Emily London, PMP Melanie Mascarenhas Pete Sikora
Kristy Thornton William H. Rogers, PhD Milliman MedInsight Team
We acknowledge the important contributions made by the members of the CHPI project committees in designing and conducting the CHPI project:
The CHPI Board
Jacob Asher, MD, Anthem Blue Cross Steve Barron, Dignity Health Elizabeth Helms, California Chronic Care Coalition David Lansky, PhD, Pacific Business Group on Health (Interim CHPI Board President) Jeffrey Mason, MD, UnitedHealthcare of California (Board Secretary) Doug McKeever, CalPERS John Stenerson, Self-Insured Schools of California (Board Treasurer) Melissa Welch, MD, Blue Shield of California Amy Nguyen Howell, MD, MBA, CAPG
The CHPI Physician Advisory Group
Parag Agnihotri, MD, Sharp Rees-Stealy Jacob Asher, MD, Anthem Blue Cross James Foxe, MD, Partnership of Drs. James Foxe and William Roach Michael Gilbert, MD, St Joseph Heritage Medical Group Paul Grossman, MD, California Academy of Family Physicians (CAFP) Dipti Itchhaporia, MD, Hoag Memorial Hospital Presbyterian
Mike Kern, MD, John Muir Health (former Chair) Jeffrey Mason, MD, UnitedHealthcare of California Neil W. Treister, MD, Sharp Community Medical Group Melissa Welch, MD, Blue Shield of California Fiona Wilson, MD, Brown and Toland Medical Group José Arevalo, MD, Sutter Independent Physicians

5 California Healthcare Performance Information System - Methods for Rating Physicians and Practice Sites – Cycle 2 ©CHPI 2016
575 MARKET STREET, SUITE 600, SAN FRANCISCO, CA 94105
Executive Summary CHPI is a multi-stakeholder non-profit entity whose mission is to serve as a trusted source of healthcare information by accurately measuring the quality and cost of care; producing health care provider performance ratings; educating the public about healthcare value; and helping drive improvements in California’s health care delivery system. CHPI will report two cycles’ worth of physician and practice site clinical quality ratings to the public in the winter of 2016. For the Cycle 1 ratings, the measurement year is 2012. For the Cycle 2 ratings, the measurement year is 2014. For both cycles, the measure steward year is 2013. Analysis has shown that there are not significant differences between the steward year 2013 and 2015 measure specifications for the reportable CHPI measures. In future cycles, the most recent measure steward year will be applied.
Table A. Steps for Calculating CHPI Cycle 2 Physician and Practice Site Ratings Methods Topic CHPI Approach Data Intake Process
• Upload health plan and Medicare files from secure FTP site and secure hard drive • Perform 76 queries to test data quality and troubleshoot potential problems
Data Sources • Collect fully-insured and select self-funded commercial, PPO, HMO, POS, and Medicare Advantage claims and encounters from Anthem Blue Cross of California, Blue Shield of California, and UnitedHealthcare of California
• Collect Medicare fee-for-service claims from the Centers for Medicare and Medicaid Services as part of the Qualified Entity (QE) Program
• Aggregate data for approximately 10 million members across California Measures • Calculate 16 individual clinical quality process measures which are almost all endorsed by
the National Quality Forum • Combine selected individual measures to form two composite measures in Cancer
Screening and Diabetes Care • Note: The measurement year is 2014 and the measure steward year is 2013. For Cycle 3,
the most recent measure steward year will be applied Attribution • Assign a patient to a single physician per specialty by determining which physician had the
greatest number of patient-specific ambulatory/outpatient encounters during the measurement year (2014) and year prior (2013), and with whom the patient had an encounter within the measurement year
• Assign a patient to all practice sites at which their physician(s) practice Scoring • Calculate raw physician and practice site scores for each individual measure by
aggregating each physician’s and practice site’s patients/measure results across data sources
Risk Adjustment
• Adjust raw physician and practice site scores for patient age and gender; indicators of education, poverty status, and race/ethnicity as merged from the Census; payer, and product
Statistical Validity
• Report physician and practice site results only if they have at least 11 patients and meet 0.70 reliability
• Report individual measures only if they have more than 100 reportable physicians Outliers • Abstain from using outlier methods, as clinical quality measures not subject to extreme
values Peer Groups • Compare PCPs only to other PCPs
• Compare Pediatricians only to other Pediatricians • Compare non-PCPs and non-Pediatricians to scores of all physicians, regardless of
specialty

6 California Healthcare Performance Information System - Methods for Rating Physicians and Practice Sites – Cycle 2 ©CHPI 2016
575 MARKET STREET, SUITE 600, SAN FRANCISCO, CA 94105
Benchmarks • Use a statewide, current-year benchmark and peer groups defined above to assign star ratings
• Assign one to four star ratings to individual measure scores for physicians and practice sites based on cut-points at the 25th, 50th, and 75th percentiles within peer group
Composites • Score composites only for physicians and practice sites who have reportable scores for more than half of underlying measures
• Convert each physician’s and practice site’s individual measure scores to a common scale based on assigning a percentile rank within peer group
• Calculate composite scores for physicians and practice sites as the simple average of percentile ranks of the underlying measure scores
• Report physician and practice site composite scores only if they meet 0.70 reliability • Assign one to four star ratings to composite scores for physicians and practice sites based
on cut-points at 25%, 50%, and 75% Review and Corrections
• Allow physicians 65 days to review and correct results via mailed reports and an online portal
• Re-calculate results for public reporting using corrected data
The table below describes measures and their relevant specialties:
Table B. CHPI Cycle 2 Measures and Relevant Specialties NQF # Measure Name Relevant Specialties †CHPI modified this measure from the original measure steward specification. See “Measures” section for further information. *Measure will not be reported for adult primary care physicians (internal medicine and family practice) because there are fewer than 100 adult primary care physicians with a reportable result. Measure will be reported for other specialties. N/A† Breast Cancer Screening – Ages 50-69 Family practice, internal medicine, OB/GYN
0032 Cervical Cancer Screening Family practice, internal medicine, OB/GYN
0057 Comprehensive Diabetes Care: Hemoglobin A1c (HbA1c) testing
Internal medicine, family practice, endocrinology
0062 Comprehensive Diabetes Care: Medical Attention for Nephropathy
Internal medicine, family practice, endocrinology, nephrology
N/A†
Annual Monitoring for Patients on Persistent Medications: ACE Inhibitors or ARBs
Family practice, internal medicine, cardiology
Annual Monitoring for Patients on Persistent Medications: Diuretics
Family practice, internal medicine, cardiology
Annual Monitoring for Patients on Persistent Medications: Total Rate
Family practice, internal medicine, cardiology
0058 Avoidance of Antibiotic Treatment in Adults with Acute Bronchitis
Family practice, internal medicine, allergy/immunology, pulmonology
0002 Appropriate Testing for Children with Pharyngitis
Family practice*, internal medicine*, pediatrics
0069 Appropriate Treatment for Children with Upper Respiratory Infection
Family practice*, internal medicine*, pediatrics
0541
Proportion of Days Covered: Diabetes All Class Family practice*, internal medicine*, cardiology, endocrinology Proportion of Days Covered: Renin Angiotensin System Antagonists Family practice, internal medicine, cardiology, endocrinology Proportion of Days Covered: Statins

7 California Healthcare Performance Information System - Methods for Rating Physicians and Practice Sites – Cycle 2 ©CHPI 2016
575 MARKET STREET, SUITE 600, SAN FRANCISCO, CA 94105
NQF # Measure Name Relevant Specialties †CHPI modified this measure from the original measure steward specification. See “Measures” section for further information. *Measure will not be reported for adult primary care physicians (internal medicine and family practice) because there are fewer than 100 adult primary care physicians with a reportable result. Measure will be reported for other specialties.
0546 Diabetes: Appropriate Treatment of Hypertension
Family practice, internal medicine, cardiology, endocrinology
N/A Adolescent Well-Care Visits Family practice, pediatrics
1516 Well-Child Visits in the Third, Fourth, Fifth and Sixth Years of Life
Family practice*, pediatrics
CHPI aims to update measure results on an annual basis, dependent on availability of data, and may expand into additional areas of quality measurement.

8 California Healthcare Performance Information System - Methods for Rating Physicians and Practice Sites – Cycle 2 ©CHPI 2016
575 MARKET STREET, SUITE 600, SAN FRANCISCO, CA 94105
What is CHPI?
CHPI is a multi-stakeholder non-profit entity whose mission is to serve as a trusted source of healthcare information by accurately measuring the quality and cost of care, producing health care provider performance ratings, educating the public about healthcare value, and helping drive improvements in California’s health care delivery system. CHPI builds on a history of prior physician performance measurement programs going back to 2007, such as the California Better Quality Information (BQI) Pilot and the California Physician Performance Initiative (CPPI). CHPI produces both clinical quality ratings of providers, through its claims database, and patient experience ratings, through its annual Patient Assessment Survey (PAS). CHPI is a public benefit corporation (501(c)4) that is governed by an independent board of stakeholder representatives from health plans, providers, purchasers, and consumers.
Introduction This report summarizes the methods work from the CHPI Cycle 2 aggregation, which is based on measurement year 2014. CHPI is combining Medicare fee-for-service (FFS) data from CMS with HMO, POS, PPO, and Medicare Advantage administrative claims data from three large commercial health plans in California (Anthem Blue Cross of California, Blue Shield of California, and United Healthcare) to generate physician-level quality measure scores. CHPI contracted with Milliman and Dr. William H. Rogers to conduct data aggregation and analytic activities.
Significant data file construction and integration, methods development, analytic, and validation work occurred in the Cycle 1 and Cycle 2 periods of the project as highlighted in Figure 1. Full details of the outcome of this work will be publically reported after a 65-day provider review and corrections period.

9 California Healthcare Performance Information System - Methods for Rating Physicians and Practice Sites – Cycle 2 ©CHPI 2016
575 MARKET STREET, SUITE 600, SAN FRANCISCO, CA 94105
Figure 1. Overview of CHPI Operations
Data Sources CHPI administers the only Multi-Payer Claims Database (MPCD) currently in operation in California. CHPI consists of eligibility, claims and encounters from the state’s three largest commercial health plans and the Medicare fee-for-service (FFS) program. CHPI is designated by the Centers for Medicare & Medicaid Services (CMS) Medicare Data Sharing Program as a Qualified Entity (QE).
In addition to the Medicare FFS data, CHPI includes both insured and select self-funded commercial PPO, HMO, POS, and Medicare Advantage eligibility, claims and encounters from Anthem Blue Cross, Blue Shield of California, and UnitedHealthcare. In all, CHPI is aggregating administrative claims (allowed amount and provider fee schedule data are not included at this time), encounters and eligibility data for approximately 10 million members across California.
CHPI receives the following types of data files from each of its data suppliers:
Data Intake, Audit, and Quality Assurance
Data submitted by health plans and CMS to CHPI's data aggregation vendor Milliman
CHPI Measure SelectionCHPI measures are selected and approved by the Physician Advisory Group (PAG)
CHPI Methods Development/Refinement
CHPI methods are developed and refined by the CHPI PAG, Milliman, and CHPI's statistician with support from CHPI staff
Measure ScoringCHPI attributes relevant patients to California physicians and practice sites, scores providers, risk adjust results, and confirms statistical validity as the methods are being refined
Physician Reviews and Corrections
CHPI provides California providers with a 65-day opportunity to review, correct, and attest to the accuracy of their data, to align with the CMS QE regulations
Public ReportingCHPI publishes clinical quality measures and composite scores on California physicians and practice sites on a searchable, consumer friendly website, per PAG recommendaiton and Board approval
10 California Healthcare Performance Information System - Methods for Rating Physicians and Practice Sites – Cycle 2 ©CHPI 2016
575 MARKET STREET, SUITE 600, SAN FRANCISCO, CA 94105
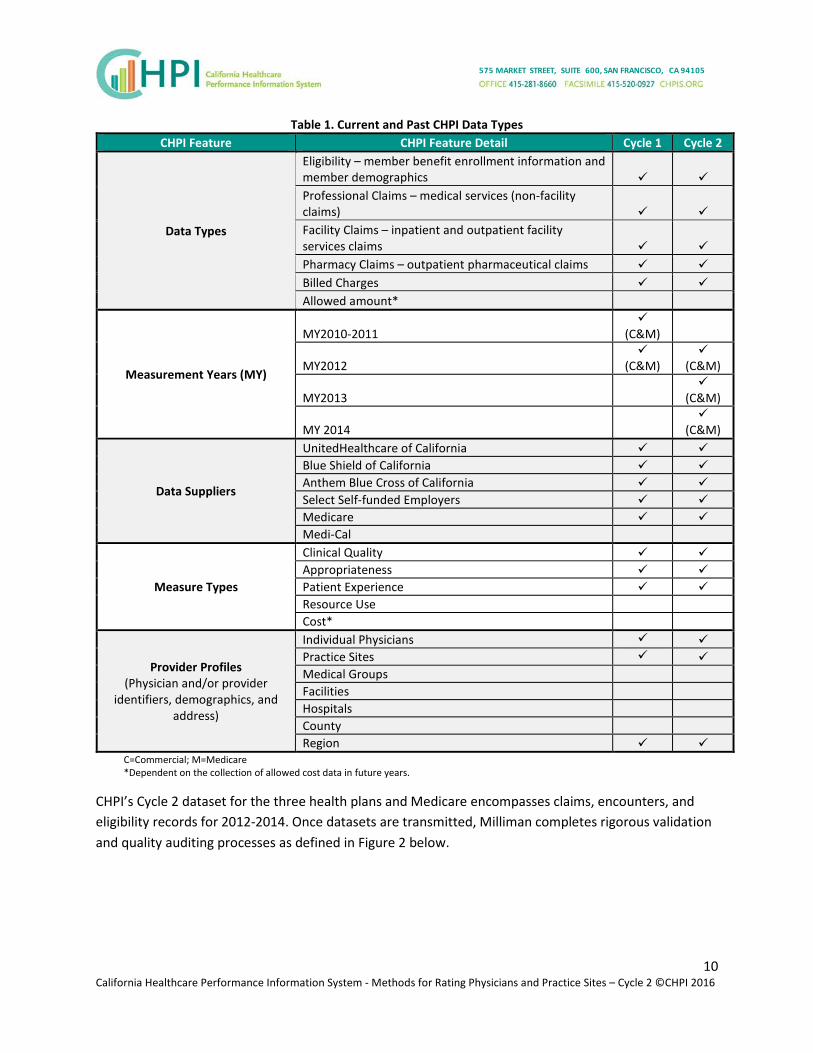
Table 1. Current and Past CHPI Data Types CHPI Feature CHPI Feature Detail Cycle 1 Cycle 2
Data Types
Eligibility – member benefit enrollment information and member demographics Professional Claims – medical services (non-facility claims) Facility Claims – inpatient and outpatient facility services claims Pharmacy Claims – outpatient pharmaceutical claims Billed Charges Allowed amount*
Measurement Years (MY)
MY2010-2011
(C&M)
MY2012
(C&M)
(C&M)
MY2013
(C&M)
MY 2014
(C&M)
Data Suppliers
UnitedHealthcare of California Blue Shield of California Anthem Blue Cross of California Select Self-funded Employers Medicare Medi-Cal
Measure Types
Clinical Quality Appropriateness Patient Experience Resource Use Cost*
Provider Profiles (Physician and/or provider
identifiers, demographics, and address)
Individual Physicians Practice Sites Medical Groups Facilities Hospitals County Region
C=Commercial; M=Medicare *Dependent on the collection of allowed cost data in future years.
CHPI’s Cycle 2 dataset for the three health plans and Medicare encompasses claims, encounters, and eligibility records for 2012-2014. Once datasets are transmitted, Milliman completes rigorous validation and quality auditing processes as defined in Figure 2 below.

11 California Healthcare Performance Information System - Methods for Rating Physicians and Practice Sites – Cycle 2 ©CHPI 2016
575 MARKET STREET, SUITE 600, SAN FRANCISCO, CA 94105
Figure 2. CHPI Data Intake and Auditing Process
For Cycle 2, CHPI used data from measurement years 2012 – 2014 to assess patients’ eligibility for inclusion in measures and report on them.
Enrollees had to meet health plan continuous enrollment requirements within each data source (i.e., plan-product such as Blue Shield HMO, or Medicare fee-for-service) to qualify for a particular clinical measure. For example, if an enrollee switched from a PPO plan to an HMO plan (within the same carrier or between carriers) during the continuous enrollment period, s/he would not meet continuous enrollment requirements. Enrollees also had to meet any pharmacy coverage requirements, per the measure steward specifications. That is, if a measure requires pharmacy data, then the member had to be eligible for pharmacy benefits in the member eligibility file during the measure-relevant time period.
The continuous enrollment requirement means that some patients whom a physician is currently seeing will not be included in their measure rate calculation because the patients fail to meet the continuous enrollment criteria. For example, the continuous enrollment requirement for Breast Cancer Screening—Ages 50-69, is two years (1/1/2013 through 12/31/2014). If a member joined one of the participating health plans in January 2014, the member would not be included in the measure or in a physician’s score because they were only enrolled for part of the required two-year period, even if they saw the physician between January and December 2014, and had the recommended mammogram.

12 California Healthcare Performance Information System - Methods for Rating Physicians and Practice Sites – Cycle 2 ©CHPI 2016
575 MARKET STREET, SUITE 600, SAN FRANCISCO, CA 94105
Measures
Individual Measures Table 2 displays the 16 clinical measures for Cycle 2 reporting, with a brief summary of their specifications and criteria for patient exclusions. The measures selected for Cycle 2 are:
• Relevant to the Commercial and Medicare populations, • Rigorously developed by established measure stewards, • Endorsed by the National Quality Forum (with the exception of three measures), • Appropriate for measurement using administrative claims data, and • Reviewed and approved by the CHPI Physician Advisory Group (PAG).
Table 2. CHPI Cycle 2 Clinical Measures NQF
# Measure Name Measure Description Exclusions Steward (Year)
NOTES: †CHPI modified this measure from the original measure steward specification. See “Measures” section for further information.
N/A† Breast Cancer Screening – Ages 50-69
The percentage of women ages 50 to 69 who had one or more mammograms
Bilateral mastectomy, Unilateral mastectomy (2 occurrences on 2 different dates)
NCQA (2013)
0032 Cervical Cancer Screening
Percentage of women 21–64 years of age who received one or more Pap tests to screen for cervical cancer
Hysterectomy NCQA (2013)
0057 Comprehensive Diabetes Care: Hemoglobin A1c (HbA1c) testing
Percentage of patients aged 18 through 75 years of age with diabetes who had hemoglobin A1c (HbA1c) testing
Polycystic ovaries, gestational or steroid induced diabetes
NCQA (2013)
0062 Comprehensive Diabetes Care: Medical Attention for Nephropathy
The percentage of members 18-75 years of age with diabetes (type 1 and type 2) who received a nephropathy screening test or had evidence of nephropathy
Polycystic ovaries, gestational or steroid induced diabetes
NCQA (2013)

13 California Healthcare Performance Information System - Methods for Rating Physicians and Practice Sites – Cycle 2 ©CHPI 2016
575 MARKET STREET, SUITE 600, SAN FRANCISCO, CA 94105
NQF # Measure Name Measure Description Exclusions Steward
(Year) NOTES: †CHPI modified this measure from the original measure steward specification. See “Measures” section for further information.
N/A†
Annual Monitoring for Patients on Persistent Medications: ACE Inhibitors or ARBs
The percentage of members 18 years of age and older who received at least 180 treatment days of ambulatory medication therapy and at least one therapeutic monitoring event for the therapeutic agent None
NCQA (2013)
Annual Monitoring for Patients on Persistent Medications: Diuretics
NCQA (2013)
Annual Monitoring for Patients on Persistent Medications: Total
The sum of the two numerators divided by the two denominators for the two preceding measures
NCQA (2013)
0058 Avoidance of Antibiotic Treatment in Adults with Acute Bronchitis
Percentage of patients aged 18 through 64 years with a diagnosis of acute bronchitis who were not prescribed or dispensed an antibiotic prescription The measure is reported as an inverted rate [1 – (numerator/eligible population)]. A higher score indicates appropriate treatment of acute bronchitis (i.e., the proportion who were not prescribed or dispensed an antibiotic prescription).
None NCQA (2013)
0002 Appropriate Testing for Children with Pharyngitis
Percentage of children aged 2 through 18 years with a diagnosis of pharyngitis, who were prescribed an antibiotic and who received a group A streptococcus (strep) test for the episode
None NCQA (2013)
0069 Appropriate Treatment for Children with Upper Respiratory Infection
Percentage of children aged 3 months through 18 years with a diagnosis of URI who were not prescribed or dispensed an antibiotic prescription on or within 3 days of the initial date of service The measure is reported as an inverted rate [1 – (numerator/eligible population)]. A higher score indicates appropriate treatment of upper respiratory infection (i.e., the proportion who were not prescribed or dispensed an antibiotic prescription).
None NCQA (2013)
0541 Proportion of Days Covered: Diabetes All Class
The percentage of patients 18 years and older who met the proportion of days covered (PDC) threshold of 80%
None PQA (2012)

14 California Healthcare Performance Information System - Methods for Rating Physicians and Practice Sites – Cycle 2 ©CHPI 2016
575 MARKET STREET, SUITE 600, SAN FRANCISCO, CA 94105
NQF # Measure Name Measure Description Exclusions Steward
(Year) NOTES: †CHPI modified this measure from the original measure steward specification. See “Measures” section for further information.
Proportion of Days Covered: Renin Angiotensin System Antagonists
A performance rate is calculated separately for each medication category.
One or more prescriptions for insulin in the measurement period
PQA (2012)
Proportion of Days Covered: Statins
None PQA (2012)
0546 Diabetes: Appropriate Treatment of Hypertension
The percentage of patients who were dispensed a medication for diabetes and hypertension that are receiving an angiotensin-converting -enzyme-inhibitor (ACEI) or angiotensin receptor blocker (ARB) or direct renin inhibitor (DRI) renin-angiotensin-antagonist medication
None PQA (2012)
N/A Adolescent Well-Care Visits
The percentage of enrolled members 12–21 years of age who had at least one comprehensive well-care visit with a PCP or an OB/GYN practitioner
None NCQA (2013)
1516 Well-Child Visits in the Third, Fourth, Fifth and Sixth Years of Life
The percentage of members 3–6 years of age who had one or more well-child visits with a PCP
None NCQA (2013)
CHPI calculated each measure using the specifications from the measure steward. 1 In general, the measure specifications dictate that the numerator for each patient be coded as 0 or 1 depending on whether the patient care met the evidence-based criteria. CHPI subsequently risk adjusts this 0 or 1 value to account for differences between physicians’ patient demographics. For further detail, see the “Risk Adjustment” section later in this document.
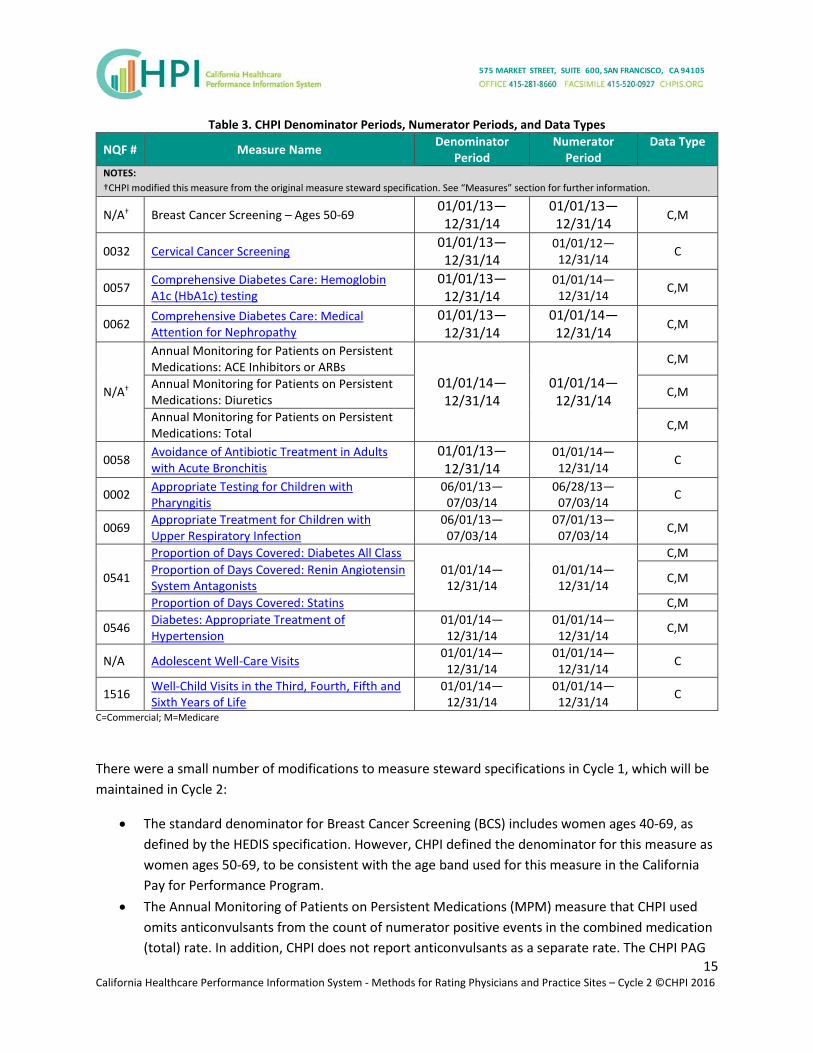
Table 3 displays the denominator and numerator periods for each measure, as well as whether each measure incorporated commercial or Medicare data. The denominator period defines the time period during which the member had to be enrolled and/or had a clinical condition/event to qualify for the measure. The numerator period defines the time period during which the member was to receive the evidence-based care (e.g., mammogram). The attribution period, described further in the “Attribution” section below, for each measure is 01/01/13—12/31/14.
1 As described later in this section, CHPI modified the specifications for the following measures: Breast Cancer Screening, Monitoring for Patients on Persistent Medications. In addition, CHPI calculates average scores across selected measures, called “composite measures” for two areas of care. See “Composite Measures” section.
15 California Healthcare Performance Information System - Methods for Rating Physicians and Practice Sites – Cycle 2 ©CHPI 2016
575 MARKET STREET, SUITE 600, SAN FRANCISCO, CA 94105
Table 3. CHPI Denominator Periods, Numerator Periods, and Data Types
NQF # Measure Name Denominator Period
Numerator Period
Data Type
NOTES: †CHPI modified this measure from the original measure steward specification. See “Measures” section for further information.
N/A† Breast Cancer Screening – Ages 50-69 01/01/13—
12/31/14 01/01/13—12/31/14
C,M
0032 Cervical Cancer Screening 01/01/13—
12/31/14 01/01/12—12/31/14 C
0057 Comprehensive Diabetes Care: Hemoglobin A1c (HbA1c) testing
01/01/13—12/31/14
01/01/14—12/31/14 C,M
0062 Comprehensive Diabetes Care: Medical Attention for Nephropathy
01/01/13—12/31/14
01/01/14—12/31/14
C,M
N/A†
Annual Monitoring for Patients on Persistent Medications: ACE Inhibitors or ARBs
01/01/14—12/31/14
01/01/14—12/31/14
C,M
Annual Monitoring for Patients on Persistent Medications: Diuretics C,M
Annual Monitoring for Patients on Persistent Medications: Total C,M
0058 Avoidance of Antibiotic Treatment in Adults with Acute Bronchitis
01/01/13—12/31/14
01/01/14—12/31/14 C
0002 Appropriate Testing for Children with Pharyngitis
06/01/13—07/03/14
06/28/13—07/03/14 C
0069 Appropriate Treatment for Children with Upper Respiratory Infection
06/01/13—07/03/14
07/01/13—07/03/14 C,M
0541
Proportion of Days Covered: Diabetes All Class 01/01/14—
12/31/14 01/01/14—12/31/14
C,M Proportion of Days Covered: Renin Angiotensin System Antagonists C,M
Proportion of Days Covered: Statins C,M
0546 Diabetes: Appropriate Treatment of Hypertension
01/01/14—12/31/14
01/01/14—12/31/14 C,M
N/A Adolescent Well-Care Visits
01/01/14—12/31/14
01/01/14—12/31/14 C
1516 Well-Child Visits in the Third, Fourth, Fifth and Sixth Years of Life
01/01/14—12/31/14
01/01/14—12/31/14 C
C=Commercial; M=Medicare
There were a small number of modifications to measure steward specifications in Cycle 1, which will be maintained in Cycle 2:
• The standard denominator for Breast Cancer Screening (BCS) includes women ages 40-69, as defined by the HEDIS specification. However, CHPI defined the denominator for this measure as women ages 50-69, to be consistent with the age band used for this measure in the California Pay for Performance Program.
• The Annual Monitoring of Patients on Persistent Medications (MPM) measure that CHPI used omits anticonvulsants from the count of numerator positive events in the combined medication (total) rate. In addition, CHPI does not report anticonvulsants as a separate rate. The CHPI PAG
16 California Healthcare Performance Information System - Methods for Rating Physicians and Practice Sites – Cycle 2 ©CHPI 2016
575 MARKET STREET, SUITE 600, SAN FRANCISCO, CA 94105
determined that the clinical evidence supporting annual monitoring of this drug category was relatively weak and recommended removal of the anticonvulsant category from the measure. This is in line with changes NCQA made to the HEDIS 2015 measure specifications. CHPI calculated the MPM total rate by adding the numerators and denominators for the two remaining drug categories: diuretics and ACE/ARB. CHPI also reports stand-alone medication rates for diuretics and for angiotensin converting enzyme (ACE) inhibitors or angiotensin receptor blockers (ARB).
National Committee for Quality Assurance (NCQA) Measure Specification Updates: CHPI Cycle 2 measures follow the NCQA Healthcare Effectiveness Data and Information Set (HEDIS) 2013 measure specifications. Other than those noted above, there were no other major specifications changes to the CHPI Cycle 2 measures derived from the NCQA HEDIS set.
Pharmacy Quality Alliance (PQA) Measures Specification Updates: CHPI Cycle 2 measures follow the PQA 2012 measure specifications, which was the version endorsed by the National Quality Forum (NQF) when CHPI selected the measures.
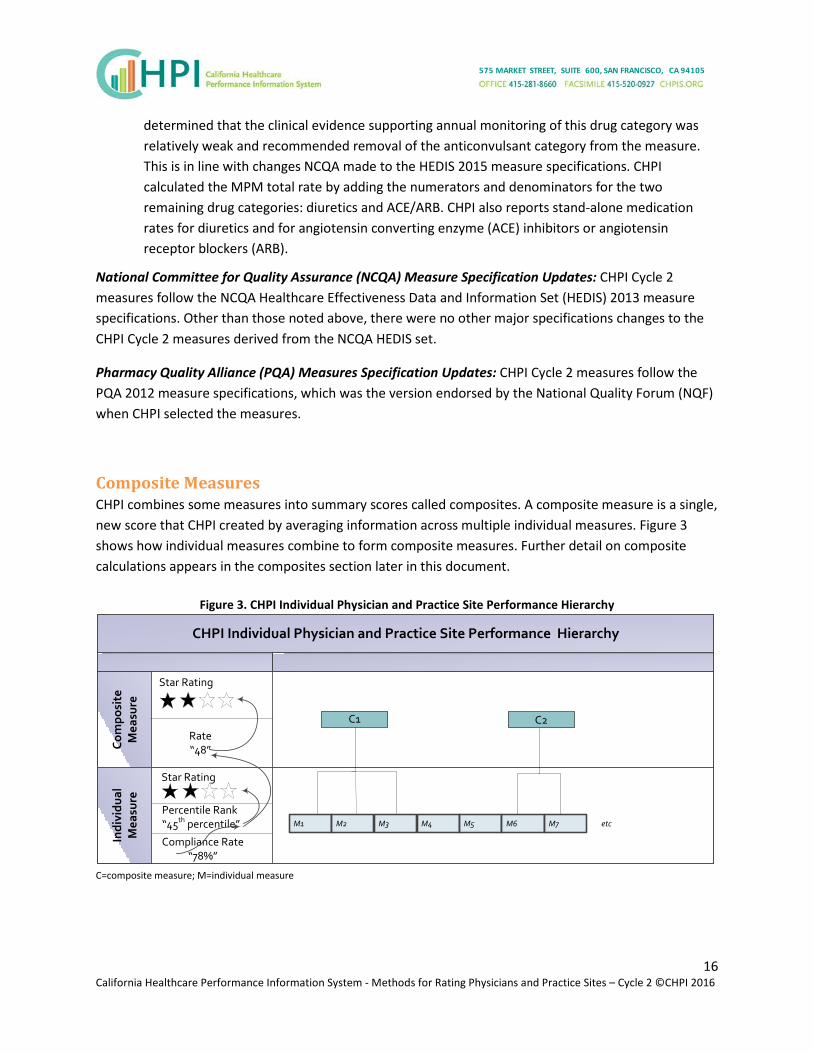
Composite Measures CHPI combines some measures into summary scores called composites. A composite measure is a single, new score that CHPI created by averaging information across multiple individual measures. Figure 3 shows how individual measures combine to form composite measures. Further detail on composite calculations appears in the composites section later in this document.
Figure 3. CHPI Individual Physician and Practice Site Performance Hierarchy
CHPI Individual Physician and Practice Site Performance Hierarchy
Com
posi
te
Mea
sure
Indi
vidu
al
Mea
sure
C1
M1 M2 M3 M4 M5 M6 M7
C2Rate“48”
Compliance Rate“78%”
etc
Star Rating
Star Rating
Percentile Rank“45th percentile”
C=composite measure; M=individual measure

17 California Healthcare Performance Information System - Methods for Rating Physicians and Practice Sites – Cycle 2 ©CHPI 2016
575 MARKET STREET, SUITE 600, SAN FRANCISCO, CA 94105
Table 4 lists the composites for CHPI Cycle 2 reporting, as well as the measures that comprise each.
Table 4. CHPI Cycle 2 Composites and Underlying Measures Composite Underlying Measures Data Type
NOTE: CHPI staff created these composites based on statistical analysis of internal consistency of the underlying measures, as well as research on measure-to-composite mappings used in other state and federal programs.
Cancer Screening
Breast Cancer Screening – Ages 50-69 C,M
Cervical Cancer Screening
Diabetes Care Comprehensive Diabetes Care: Hemoglobin A1c (HbA1c) testing
C,M Comprehensive Diabetes Care: Medical Attention for Nephropathy Diabetes: Appropriate Treatment of Hypertension
C=Commercial; M=Medicare
Attribution
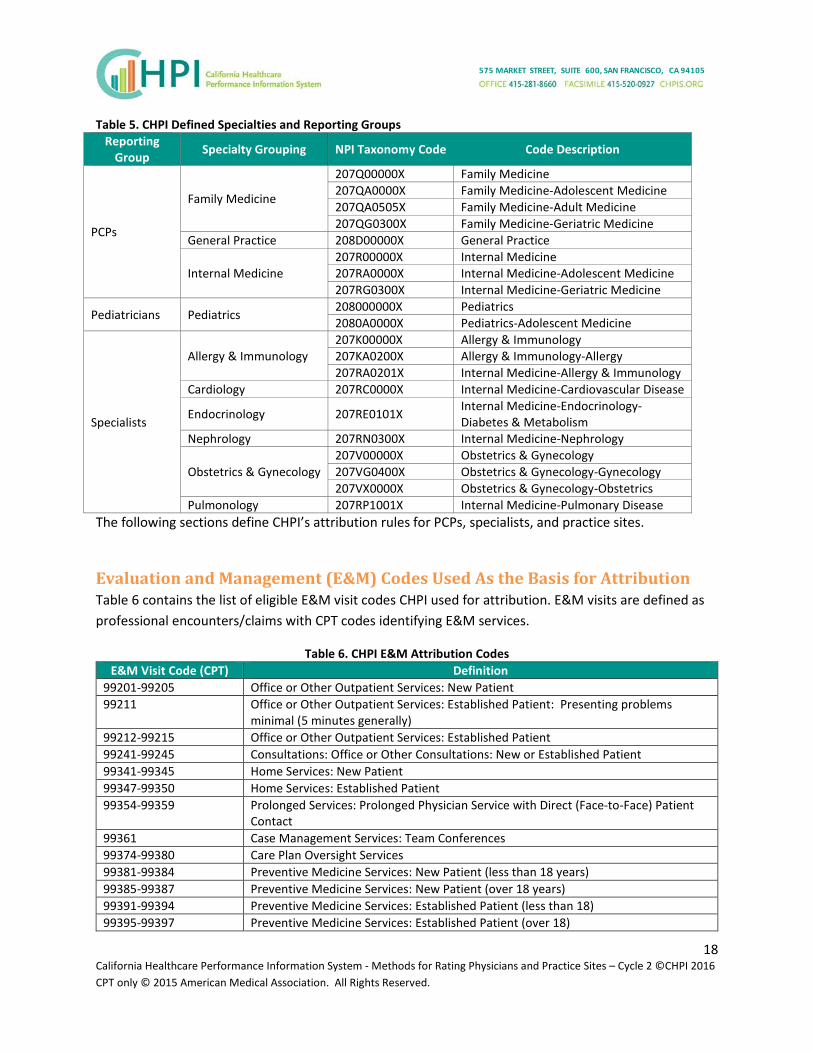
Overview CHPI attributes a patient event to one or more physicians of a relevant specialty for each measure. To be assigned, the patient must have had more than one E&M visit with the designated physician(s) during the measurement period. CHPI assigns a single, primary specialty to each physician in the California Physician Database (CPD) and this specialty is used in the patient attribution step. CHPI’s 10 specialties are defined in Table 5 below. NPI taxonomy code is an alpha-numeric code that derives from the NPI Registry that represents a specific specialty in the NPI specialty taxonomy. Each of the 10 specialties further rolls up to a reporting group: primary care physician (PCP), Pediatrician, or Specialist. Some methods in this document, including Attribution and Peer Groups, group physicians according to these reporting group.
18 California Healthcare Performance Information System - Methods for Rating Physicians and Practice Sites – Cycle 2 ©CHPI 2016 CPT only © 2015 American Medical Association. All Rights Reserved.
575 MARKET STREET, SUITE 600, SAN FRANCISCO, CA 94105
Table 5. CHPI Defined Specialties and Reporting Groups Reporting
Group Specialty Grouping NPI Taxonomy Code Code Description
PCPs
Family Medicine
207Q00000X Family Medicine 207QA0000X Family Medicine-Adolescent Medicine 207QA0505X Family Medicine-Adult Medicine 207QG0300X Family Medicine-Geriatric Medicine
General Practice 208D00000X General Practice
Internal Medicine 207R00000X Internal Medicine 207RA0000X Internal Medicine-Adolescent Medicine 207RG0300X Internal Medicine-Geriatric Medicine
Pediatricians Pediatrics 208000000X Pediatrics 2080A0000X Pediatrics-Adolescent Medicine
Specialists
Allergy & Immunology 207K00000X Allergy & Immunology 207KA0200X Allergy & Immunology-Allergy 207RA0201X Internal Medicine-Allergy & Immunology
Cardiology 207RC0000X Internal Medicine-Cardiovascular Disease
Endocrinology 207RE0101X Internal Medicine-Endocrinology- Diabetes & Metabolism
Nephrology 207RN0300X Internal Medicine-Nephrology
Obstetrics & Gynecology 207V00000X Obstetrics & Gynecology 207VG0400X Obstetrics & Gynecology-Gynecology 207VX0000X Obstetrics & Gynecology-Obstetrics
Pulmonology 207RP1001X Internal Medicine-Pulmonary Disease The following sections define CHPI’s attribution rules for PCPs, specialists, and practice sites.
Evaluation and Management (E&M) Codes Used As the Basis for Attribution Table 6 contains the list of eligible E&M visit codes CHPI used for attribution. E&M visits are defined as professional encounters/claims with CPT codes identifying E&M services.
Table 6. CHPI E&M Attribution Codes E&M Visit Code (CPT) Definition
99201-99205 Office or Other Outpatient Services: New Patient 99211 Office or Other Outpatient Services: Established Patient: Presenting problems
minimal (5 minutes generally) 99212-99215 Office or Other Outpatient Services: Established Patient 99241-99245 Consultations: Office or Other Consultations: New or Established Patient 99341-99345 Home Services: New Patient 99347-99350 Home Services: Established Patient 99354-99359 Prolonged Services: Prolonged Physician Service with Direct (Face-to-Face) Patient
Contact 99361 Case Management Services: Team Conferences 99374-99380 Care Plan Oversight Services 99381-99384 Preventive Medicine Services: New Patient (less than 18 years) 99385-99387 Preventive Medicine Services: New Patient (over 18 years) 99391-99394 Preventive Medicine Services: Established Patient (less than 18) 99395-99397 Preventive Medicine Services: Established Patient (over 18)

19 California Healthcare Performance Information System - Methods for Rating Physicians and Practice Sites – Cycle 2 ©CHPI 2016 CPT only © 2015 American Medical Association. All Rights Reserved.
575 MARKET STREET, SUITE 600, SAN FRANCISCO, CA 94105
E&M Visit Code (CPT) Definition 99401-99404 Preventive Medicine Services: Preventive Medicine, Individual Counseling 99411-99412 Preventive Medicine Services: Group Counseling 99420 Preventive Medicine Services: Other Preventive Medicine Services 99429 Preventive Medicine Services: Other Preventive Medicine Services 99495-99496 Transitional Care Management Services with the following required elements 99499 Other E/M Services G0402 Initial Preventive Physical Examination (IPPE) or Welcome to Medicare Visit - This
code can only be billed when the services are provided during the first twelve months the patient is enrolled in Medicare Part B.
G0438 Annual Wellness Visit (AWV); includes a personalized prevention plan (PPPS) ; This code can only be used for a beneficiary who is no longer within the first twelve months after the effective date of Part B coverage; And if he/she has not already received either an IPPE or an AWV (Annual Well Visit) within the past twelve months. Medicare pays for only one Initial Annual Wellness Visit per beneficiary per lifetime.
G0439 Subsequent Annual Wellness Visit (G0439). G0439 Subsequent Annual Wellness Visit (AWV); includes a personalized prevention plan (PPPS)This code is to be used in the years subsequent to the submission of G0438 for the initial annual wellness visit, even if the patient switches to another provider.
CHPI uses the E&M visit for attribution. CHPI only counts office-based visits, hospital outpatient visits, and independent clinic visits. CHPI identified these visits by the Place of Service (POS) code on the claim/encounter.
• Included POS Codes: 11 (Office Visit), 22 (Outpatient Hospital), and 49 (Independent Clinic). • Excluded POS Codes: Hospital Inpatient, Emergency Room, and Ambulatory Surgery Centers.
CHPI excludes from the performance results for a given measure any patients who qualify for the measure denominator, but who cannot be attributed to a physician.
Primary Care Physician Attribution CHPI attributes any measure with a relevant specialty of Primary Care Physician (internal medicine and family/general practice) to a PCP. CHPI assigns a patient to a single PCP by determining which PCP had the greatest number of patient-specific ambulatory/outpatient encounters during the measurement year and year prior (i.e., 01/01/13 to 12/31/14) and with whom the patient had an encounter within the measurement year (i.e., 01/01/14 to 12/31/14). Figure 4 illustrates this process.
The assignment rules, described below, differ for patient event by product because HMO, POS, and Medicare Advantage products generally require a patient to choose a PCP, and therefore CHPI can identify the PCP through a single encounter.
• HMO, POS, and Medicare Advantage (MA) patient events: To be assigned an HMO, POS, or Medicare Advantage patient event a PCP is required to have a minimum of one encounter with

20 California Healthcare Performance Information System - Methods for Rating Physicians and Practice Sites – Cycle 2 ©CHPI 2016
575 MARKET STREET, SUITE 600, SAN FRANCISCO, CA 94105
• the patient during the two-year period; if only one encounter occurs, then the encounter must have occurred during the measurement year (MY).
• PPO and Medicare Fee-for-Service (MFFS) patient events: To be assigned a PPO or Medicare FFS patient event, a PCP is required to have a minimum of two encounters with the patient during the two-year period; at least one of the encounters must have occurred during the measurement year (MY).
If the patient visit count is equivalent for two or more PCPs, then CHPI attributes the patient to the PCP with whom the patient had the most recent visit. If the patient visits counts are equal and the most recent visit date is the same for multiple PCPs (unlikely), the patient is attributed to the PCP with the largest billed charge on that day.
Figure 4. Rule for Attributing Patients to PCPs Pool of patients who qualify for measure denominator with relevant specialty PCP.
Patients who had 1 or more visits during measurement year are attributed. Visits during measurement year (MY) and 1 year prior are counted.
# Visits with 1 or more PCPs
Assign patient to PCP with most # visits
• HMO, POS, & MA patients can be assigned to PCP on basis of a minimum of one visit during two-year period, but must have had a visit within the MY
• PPO & MFFS patients can be assigned to a PCP on the basis of minimum of two visits during the two-year period, but must have had a visit within the MY
If multiple PCPs have same # visits,
then assign to single PCP with most recent visit*
If multiple PCPs with the same # visits on the same day,
then assign to single PCP with largest billed charges that day.
Specialist Attribution Rule This rule concerns any measure with a relevant specialty other than Primary Care Physician (e.g., cardiology, endocrinology), including pediatricians. CHPI assigns patient/measure results to a single physician within a specialty, but can also assign them to another physician in another specialty. For example, the Comprehensive Diabetes Care: Medical Attention for Nephropathy measure (NQF #0062) result for a given patient can be assigned to only one endocrinologist, but can also be assigned to one

21 California Healthcare Performance Information System - Methods for Rating Physicians and Practice Sites – Cycle 2 ©CHPI 2016
575 MARKET STREET, SUITE 600, SAN FRANCISCO, CA 94105
nephrologist.2 CHPI assigns a patient to a single physician within a specialty by determining which physician in that specialty had the greatest number of patient-specific ambulatory/outpatient encounters during the measurement year and year prior (i.e., 01/01/13 to 12/31/14) and with whom the patient had an encounter within the measurement year (i.e., 01/01/14 to 12/31/14). Figure 5 illustrates this process.
The assignment rules are the same for all product lines (HMO, POS, PPO, Medicare FFS, and Medicare Advantage)
If the patient visit count is equivalent for two or more physicians within a specialty, then CHPI attributes the patient to the physician with whom the patient had the most recent visit. If the patient visits counts are equal and the most recent visit date is the same for multiple physicians within a specialty (unlikely), CHPI attributes the patient to the physician with the largest billed charges on that day.
Figure 5. Rule for Attributing Patients to Specialists Pool of patients who qualify for measure denominator with relevant specialty.
Patients who had 1 or more visits during measurement year are attributed. Visits during measurement year (MY) and 1 year prior are counted.
# Visits with 1 or more physician specialists
Group physicians by specialty
# of visits with 1 or more physicians in specialty A # of visits with 1 or more physicians in specialty B
If multiple physicians in the specialty A have same # of visits, then assign to single physician with most recent visit
If multiple physicians in the specialty B have same # visits, then assign to single physician with most
recent visit If multiple physicians in specialty A with the same # of visits on the same day, then assign to single physician with largest billed charges that day.
If multiple physicians in specialty B with the same # of visits on the same day, then assign to single physician
with largest billed charges that day.
Practice Site Attribution Rule In addition to patient attribution to individual physicians, CHPI has attributed patients to practice sites. CHPI defines a practice site as two or more physicians of the same specialty who share a common address, based on both primary (e.g., “575 Market Street”) and secondary address units (e.g., ”Suite 600,” where available). Practice sites are specialty-specific; for example, CHPI groups PCPs only with PCPs, cardiologists only with cardiologists, etc. Physicians of different specialties who share the same
2 Because numerator definitions are defined separately from attribution, each physician receives the same numerator value for each patient. An endocrinologist and nephrologist both receive a positive numerator for a patient if only the endocrinologist ordered the recommended test.

22 California Healthcare Performance Information System - Methods for Rating Physicians and Practice Sites – Cycle 2 ©CHPI 2016
575 MARKET STREET, SUITE 600, SAN FRANCISCO, CA 94105
office are assigned different practice site identifiers. Using this logic, CHPI has assigned practice site identifiers to each physician in the CHPI California Physician Database (CPD) who practices at the same address, and in the same specialty, with at least one other physician. CHPI attributes a physician to up to three practice sites. CHPI attributes patients to practice sites based on whether their physician practices at that address, as claims data do not provide addresses at which patients were seen.
CHPI first assigns a patient/measure result to a physician using the Primary Care Physician Attribution rule and the Specialist Attribution Rule (above). The patient/measure result is then assigned to all practice sites with which the attributed physician(s) is affiliated in the CPD. The same patient/measure result can thus appear in more than one practice site, but it cannot appear within the same practice site more than once (because the patient/measure results can only be assigned once per physician specialty and a practice site is only comprised of one physician specialty).The attribution logic for the practice site assignment rule is shown in Figure 6.
Figure 6. Practice Site Attribution Rule Patients/measure results are assigned to physician(s)
Physicians are affiliated with practice site(s) using the CPD assignment
Patients/measure results are assigned to any and all practice site affiliated with the attributed physician
California Physician Database (CPD) and Attribution CHPI maintains demographic information on approximately 95,000 physicians currently engaged in patient care in California, of which approximately 43,000 are in a CHPI-reportable specialty. The CPD is updated for each reporting cycle.
The CPD includes cross-referenced physician identifiers (state license number (SLN), National Provider Identifier (NPI)), specialty, practice addresses, and medical group affiliations for those physicians. CHPI created the California Physician Database (CPD) using information from the Medical Board of California, The California Department of Consumer Affairs (CDCA), CMS National Plan and Provider Enumeration System, Department of Managed Health Care, medical group physician directories, and CHPI health plan provider files, with consultation from California physician demographic data experts.
CHPI built the master list of provider identifiers from a trustworthy list of NPIs and SLNs from the California Medical Board and the National Provider Registry. CHPI then matched these identifiers to health plan provider files and included plan provider records on the condition that they shared one of the SLNs in CHPI’s master list. CHPI most recently updated the CPD in the fourth quarter of 2015, and used that version in the current physician and practice site ratings as it was the latest available at the

23 California Healthcare Performance Information System - Methods for Rating Physicians and Practice Sites – Cycle 2 ©CHPI 2016
575 MARKET STREET, SUITE 600, SAN FRANCISCO, CA 94105
close of CHPI data collection. While the measurement year for CHPI’s ratings is 2014, CHPI used the latest physician directory data available to ensure that CHPI reports on physicians who are currently practicing (not retired), given CHPI’s goal that patients use the ratings to find a physician. As physician demographic information constantly changes, it is important to note that CHPI’s CPD is only as up-to-date as the data sources from which CHPI created it. Table 7 below lists the data sources and date of last update for physician directory information that CHPI used in the Cycle 2 physician and practice site ratings.
Table 7. Data Sources for CHPI CPD Type of Information Last Update Physician
Names Physician Practice
Addresses Physician Specialty
California Department of Consumer Affairs
Sept. 2015
Medical Board of California Survey Sept. 2015 National Provider Identifier Standard Sept. 2015 Department of Managed Health Care (DMHC) Timely Access filings
Dec. 2014
Covered California filings Nov. 2013 Centers for Medicare and Medicaid Services (CMS) Physician Compare
Oct. 2015
The CPD is CHPI’s source to identify a unique physician for the patient-to-physician attribution. The attribution logic matches the provider ID (e.g., NPI, Plan Provider ID) on the E&M claim to a physician ID in the CPD. CHPI uses the CPD specialties and practice sites in the attribution logic, as detailed in the attribution rules above.
Measure-Specific Designated Specialties CHPI uses the physician specialty to determine if a physician is eligible to be scored for a given measure. CHPI assigns relevant specialties to each measure. The CPD primary specialty field is the source to identify a physician’s specialty. The CHPI Cycle 2 measures’ relevant specialties appear in Table B.

24 California Healthcare Performance Information System - Methods for Rating Physicians and Practice Sites – Cycle 2 ©CHPI 2016
575 MARKET STREET, SUITE 600, SAN FRANCISCO, CA 94105
Scoring
After attributing patients to physicians, CHPI calculates raw physician-level scores by aggregating each physician’s attributed patients across all data sources.
For each measure, the numerator is either 0 (did not have service) or 1 (had service) for each patient in the denominator.3
CHPI calculates each physician’s raw performance rate for each measure as a ratio calculated from the data for that physician’s attributed patients. The numerator of the ratio is generated by the count of eligible members whose care met evidence-based criteria (e.g., breast cancer screening). The denominator of the ratio is generated by the count of members eligible to receive that care (e.g., women ages 50 – 69), after applying exclusions identified in the measure specification and in Table 2.
CHPI calculates practice site raw scores similarly, by calculating a ratio of each practice site’s attributed patients across all data sources.
Risk Adjustment CHPI adjusts results at the patient/measure level to control for patient differences across physicians and practice sites. The purpose of the adjustment is to avoid rating physicians based on aspects of patient care that are beyond their control such as a patient’s insurance product type enrollment or socioeconomic status. CHPI adjusts for the following:
• Demographic characteristics: Patient age and gender; • Socioeconomic status: Indicators of education, poverty status, and race/ethnicity as merged
from the Census using patient’s 5-digit zip code 4; • Payer: Blue Shield of California, Anthem Blue Cross, UnitedHealthcare, Medicare; and • Product: HMO, POS, PPO, Medicare Advantage, Medicare Fee-for-Service.
For each measure and reporting group (PCPs, Pediatricians, and Specialists), CHPI calculates a multiple logistic regression equation relating measure compliance to these factors. CHPI then uses the results of the fitted logistic equation to calculate a predicted measure compliance rate for each physician and practice site. For each physician and practice site, CHPI averages the raw performance rates and averages the predicted performance rates, and for each measure and reporting group CHPI averages the raw performance rates to yield an average raw performance rate.
3 The measure Monitoring Patients on Persistent Medications: Total Rate is an exception to this rule. Per the NCQA specifications, CHPI calculates the Total Rate as the sum of the numerators for the three medication monitoring measures (ACE/ARB, Digoxin, and Diuretics), divided by the sum of the three denominators. 4 CHPI used these markers from the Census as a proxy for patient socioeconomic status, given that this information does not exist in the claims or eligibility data. Average socioeconomic status within the 5-digit zip code may differ from an individual patient’s actual socioeconomic status.

25 California Healthcare Performance Information System - Methods for Rating Physicians and Practice Sites – Cycle 2 ©CHPI 2016
575 MARKET STREET, SUITE 600, SAN FRANCISCO, CA 94105
Then CHPI calculates the adjusted performance rate in two steps:
• Step 1: Log odds ratio of the adjusted performance rate = (log odds ratio of the raw physician or practice rate) - (log odds ratio of the predicted physician or practice rate) + (log odds ratio of the average raw performance rate for the reporting group and measure).
• Step 2: Adjusted performance rate = (exponential of the log odds ratio of the adjusted performance rate from Step 1)
Reported Result: Physician and Practice Site Rates For individual measures, CHPI reports each physician’s and practice site’s risk-adjusted performance rate. CHPI labels this value as “Your Rate” in mailed reports to physicians and on the provider review and corrections portal (see Review and Corrections). CHPI’s public reports simplify information for consumers by emphasizing the star rating, although the reports also display the rate.
Statistical Validity
Physician and Practice Site Measure-Specific Reliability Reliability is a key measure of the scientific soundness of a measure and is a ratio of signal-to-noise. The signal in this case is the proportion of the variability in quality that can be explained by real differences in performance. The score runs from 0.00, meaning no signal, to 1.00, which means all signal and no noise in the estimate. The higher the score, the more fidelity present in the measurement. To use a metaphor of a radio station, higher reliability is like having less static and better fidelity to the music. In the CHPI physician and practice site scoring work, a reliability of 0.00 implies that all of the variability in a measure is attributable to measurement error. A reliability of 1.00 implies that all of the variability is attributable to real differences in performance. High reliability does not mean that performance on a given measure is good, but rather that one can confidently distinguish the performance of one physician or practice site from another. CHPI uses a minimum reliability threshold score of 0.70 to indicate that there was sufficient signal in the estimate of performance to discriminate performance across physicians or practice sites.5
Calculating Reliability Statistics CHPI calculates the reliability of a HEDIS rate based on n denominator patients from the Spearman-Brown prophecy formula:
5 Yu H, Mehrotra A, Adams J. Reliability of utilization measures for primary care physician profiling. Healthcare: the Journal of Delivery Science and Innovation. June 2013: 1(1-2):22-29.

26 California Healthcare Performance Information System - Methods for Rating Physicians and Practice Sites – Cycle 2 ©CHPI 2016
575 MARKET STREET, SUITE 600, SAN FRANCISCO, CA 94105
2
22
MDi
iMD
i
R
n
σ
σσ
=
+
In this formula, σ2MD is the between-physician variance, that is, the true variance among physician rates;
σ2i is the binomial variance associated with the rate for physician i, and ni is the rate denominator
(sample size) for physician i. Consequently, Ri is the proportion of the total variance that is attributable to the variance among physicians. As is evident from the formula for Ri, the reliability of each physician’s measure compliance rate increases with 1) the variation in rates among physicians, and 2) the physician’s sample size (denominator). For practice sites, σ2
MD refers to the between-practice variance.
We estimated the physician-to-physician variance, σ2MD, using a beta-binomial model6which assumed
that the underlying true physician rates were distributed according to a beta distribution and that the observed rate for physician i was distributed according to a binomial distribution with sample size ni. To estimate the binomial sampling variance, σ2
i, for each physician, we used the property of the binomial distribution, σ2
i = pi(1-pi), where pi is the physician’s true rate. For moderate to large sample sizes, this variance can be estimated by substituting the physician’s observed rate p̂i = (xi / ni) for pi into the formula for σ2
i, where xi is the number of successes for the sample of ni patients treated by physician i. However, many physicians have small denominators, resulting in unstable estimates of their true rates. Therefore, for the purpose of estimating the reliability, Ri, for physician i, we estimated each physician’s rate, pi, using a shrinkage estimator (explained in the next section) to compensate for the instability of estimated rates for small-denominator physicians. For example, without this adjustment, physicians with a denominator sample of size n = 1 would always have pi = 0 or pi = 1, resulting in an estimated reliability of 100 percent, which is clearly inappropriate.
Reportable Results for Physicians and Practice Sites CHPI deems a physician’s or practice site’s measure-specific score reportable if the score has a reliability of at least 0.70, and if the physician or practice site has at least 11 patients for the given measure.
As explained above, the reliability threshold of 0.70 establishes the statistical validity of the results. The sample size threshold of 11 patients serves a different purpose, which is to protect the confidentiality of patient data by not reporting on cell sizes with small samples.
CHPI uses a reliability threshold of 0.70 for public reporting of measure. CHPI report results with reliability below 0.70 to physicians with a footnote explaining this fact, provided they have at least 11 patients. This rule ensures that if changes made during the provider review and corrections period cause the reliability of a provider’s score to shift above the 0.70 reliability threshold, the provider will have had an opportunity to review the result, and CHPI will include the result in public reporting.
6 Griffiths DA. Maximum likelihood estimators for the beta-binomial distribution and an application to the household distribution of the total number of cases of a disease. Biometrics. December 1973: 29(4):637-48.
27 California Healthcare Performance Information System - Methods for Rating Physicians and Practice Sites – Cycle 2 ©CHPI 2016
575 MARKET STREET, SUITE 600, SAN FRANCISCO, CA 94105
CHPI will not report results with fewer than 11 patients to the public or to providers.
Reportable Measures After determining which results are potentially reportable at the physician and practice site level, CHPI implements rules at the measure level to ensure that results are only reported where there are a robust number of physicians or practice sites that can be compared to each other. CHPI accomplishes this objective by reporting only on measures that have at least 100 physicians with reportable results. Because PCPs are only compared with other PCPs, and Pediatricians are only compared with other Pediatricians (see “Peer Groups” section, below), CHPI also implements the 100 physician reporting threshold separately for these groups, by measure. The specific rules are as follows:
• Rule 1: A measure must have at least 100 reportable physicians to qualify for public reporting. • Rule 2: If there are fewer than 100 reportable PCPs for a given measure, CHPI will suppress the
results for all PCPs for that measure. • Rule 3: If there are fewer than 100 reportable Pediatricians for a given measure, CHPI will
suppress the results for all Pediatricians for that measure. • Rule 4: If applying Rule 2 and Rule 3 results in the measure having fewer than 100 reportable
physicians, CHPI will drop the measure from public reporting.
There were no instances in which a measure or reporting group had more than 100 reportable practice sites but fewer than 100 reportable physicians. CHPI ensures consistency between physician and practice site results by only reporting on the same measures and composites at the practice site level as at the physician level. In addition, in order for a practice site to be reportable, it must have at least one physician with reportable results.
In Cycle 1, measures with fewer than 100 reportable physicians were included in the provider reports for review and corrections, so that if the number of reportable physicians increased above 100 due to changes made during review and corrections, the physician would have reviewed his or her result prior to public reporting. In Cycle 2, measures with fewer than 100 reportable physicians were not included in the provider reports for review and corrections and will not be publicly reported.
In some instances, measures have fewer than 100 reportable PCPs. In this case, the measures will not reported for PCPs but will be reported for Specialists. The measures for which PCPs have fewer than 100 reportable physicians are as follows:
• Appropriate Testing for Children with Pharyngitis • Appropriate Treatment for Children with Upper Respiratory Infection • Proportion of Days Covered: Diabetes All Class • Well-Child Visits in the Third, Fourth, Fifth and Sixth Years of Life
There are no measures for which Pediatricians have fewer than 100 reportable physicians in Cycle 2.
The following measures had fewer than 100 reportable physicians and will not be reported for any physicians in Cycle 2:

28 California Healthcare Performance Information System - Methods for Rating Physicians and Practice Sites – Cycle 2 ©CHPI 2016
575 MARKET STREET, SUITE 600, SAN FRANCISCO, CA 94105
• Annual Monitoring for Patients on Persistent Medications: Digoxin • Asthma Medication Ratio • Chlamydia Screening • Persistence of Beta-Blocker Treatment After a Heart Attack • Use of Imaging Studies for Low Back Pain
Additionally, in Cycle 2, the following measures were not aligned with external benchmarks so they will not be reported:
• Disease-Modifying Anti-Rheumatic Drug Therapy for Rheumatoid Arthritis • Immunizations for Adolescents – Combo
Outliers CHPI’s Cycle 2 measures are all clinical quality measures that assess whether evidence-based care occurred. As such, patient-level scores for these measures equal “0” or “1” and are not subject to extreme values. CHPI does not use an outlier method because CHPI’s results are not subject to outliers. CHPI’s Cycle 2 individual measures and composites are all clinical quality measures.
Peer Groups To calculate reliability scores and star ratings, CHPI compares physicians to each other using specific rules based on specialty:
• If a physician’s primary specialty is a primary care physician (Internal Medicine, Family/General Practice), his/her score is compared to the scores of only physicians identified as PCPs.
• If a physician’s primary specialty is a non-PCP relevant specialty (e.g. cardiology or endocrinology), his/her score is compared to both PCP and non-PCP specialist scores.
• If a physician's primary specialty is Pediatrics, his/her score is compared to the scores of only physicians identified as Pediatricians.
CHPI uses the same rules to define which practice sites CHPI compares to each other. For example, CHPI compares PCP practice sites only to other PCP practice sites.
Benchmarks
Benchmarks to Assign Star Ratings CHPI assigns star ratings to each physician’s results on a given measure by comparing that physician’s result to other physicians’. CHPI compares California physician and practice site scores only to other California physician and practice site scores within CHPI’s results. The benchmark for creating the star ratings is based on state-wide, current-year data. CHPI assigns each physician one to four stars for each measure, based on cut-points at the 25th, 50th, and 75th percentiles. Physicians below the 25th percentile

29 California Healthcare Performance Information System - Methods for Rating Physicians and Practice Sites – Cycle 2 ©CHPI 2016
575 MARKET STREET, SUITE 600, SAN FRANCISCO, CA 94105
for a measure receive one star; physicians at or above the 25th percentile and below the 50th percentile receive two stars; physicians at or above the 50th percentile and below the 75th percentile receive three stars; and physicians at or above the 75th percentile receive four stars.
CHPI uses the same process to assign star ratings to practice sites.
Reported Result: Physician and Practice Site Percentile Ranks The physician percentile rank for individual measures is labeled as “Your % Rank Relative to Physician Peers” in the mailed report and on the review and corrections portal. In the public report, the physician percentile rank for individual measures is labeled as “This Doctor’s Percentile Rank,” and the practice percentile rank for individual measures is labeled as “This Practice’s Percentile Rank.”
Reported Result: Physician and Practice Site Rates The physician rate for individual measures is labeled as “Your Rate” in the mailed report and on the review and corrections portal, and as “This Doctor’s Percentage Score” in the public report. The practice rate for individual measures is labeled as “Practice Site Rate” on the review and corrections portal, and as “This Practice’s Percentage Score” in the public report. The physician composite rate is labeled as “Your Rate” in the mailed report and “Composite Score” on the review and corrections portal.
Reported Result: Physician and Practice Site Star Ratings Physician star ratings for individual measures and composites are included in the mailed report, on the review and corrections portal and in the public report. Practice star ratings for individual measures and composites are included on the review and corrections portal and in the public report.
Table 8. Reported Result by Reporting Outlet Reported Result Mailed Report Review & Corrections Portal Public Report
Physician Level
Individual Measures Rate
Pg. 2
Percentile Rank Pgs. 4-6
Star Rating Pg. 2
Composite Measures Rate
Pg. 2
Star Rating Pg. 2
Practice Level
Individual Measures Rate
Percentile Rank
Star Rating
Composite Measures Rate
Star Rating

30 California Healthcare Performance Information System - Methods for Rating Physicians and Practice Sites – Cycle 2 ©CHPI 2016
575 MARKET STREET, SUITE 600, SAN FRANCISCO, CA 94105
Additional Benchmarks For each individual measure in the mailed reports and on the physician portal, CHPI includes the 75th percentile score for all other reportable physicians who appear in CHPI’s dataset within California, labeled as “Statewide 75th %.” CHPI also includes the 75th percentile score for all reportable physicians who practice within the same region of California for each individual measure in the mailed reports and physician portal. State and regional benchmarks are not provided for composite measures, nor are they displayed on the public website. CHPI defines the regions based on county-to-region mappings provided by the Integrated Healthcare Association (IHA) and corresponding to regions within which IHA grants Public Recognition Awards. CHPI staff mapped each county to zip codes based on a crosswalk from the U.S. Department of Housing and Urban Development. The eight regions are Sacramento/North, Bay Area, Central Coast, Central Valley, Los Angeles, Orange County, Inland Empire, and San Diego/Imperial.
Composites
Composite Calculations CHPI calculates composite results using the following steps:
• Step 1: Check that the physician has the minimum number of measures to score the composite. The physician receives a score for the composite if he or she has the minimum number of required reportable measure scores within that domain, where the minimum number of required measure scores is calculated as follows: If the number of measures in the composite is odd, then divide the number of measures by two and round up. If the number of measures is even, then divide by two and add one. This requirement helps ensure that composite calculations compare physicians on an apples-to-apples basis.
• Step 2: Compare each physician to a peer group and convert each measure to a common scale. CHPI calculates the percentile rank of each physician’s result for each measure, based on comparison with the same peer group used for individual measures, as described above. CHPI also bases the percentile ranks on comparison with state-wide, current-year data, similar to the methods described in the “Benchmarks” section above. Assigning a percentile rank addresses the issue that different measures have different distributions, and that different physicians are eligible for different measures.
• Step 3: Calculate a composite rate. CHPI scores each composite as the simple average of percentile ranks of the underlying measures. For example, suppose a physician has scores at the 55th percentile and 65th percentile for two measures in a composite. The physician’s composite rate will be the average of 55 and 65, or 60.
• Step 4. Assess statistical validity. CHPI applies the same statistical validity rules described above for individual measures, at the composite measure level. The only exception is that CHPI does not re-apply the requirement that a composite have 11 or more observations, as Step 1 of the composite calculations requires CHPI to calculate composites based only on underlying

31 California Healthcare Performance Information System - Methods for Rating Physicians and Practice Sites – Cycle 2 ©CHPI 2016
575 MARKET STREET, SUITE 600, SAN FRANCISCO, CA 94105
measures that are reportable per CHPI’s methods, which incorporate the requirement to have 11 or more patients in the measure denominator.
• Step 5: Use benchmarks to assign a star rating. CHPI bases star ratings on cut-point values of 25%, 50%, and 75%. Physicians with composite rate below 25% receive one star; physicians at or above 25% and below 50% receive two stars; physicians at or above 50% and below 75% receive three stars; and physicians at or above 75% receive four stars. In the case of the physician described in Step 3, a composite rate of 60 will yield a three-star rating. Based on the calculations CHPI used to assign the individual measure percentile ranks to calculate the composite rate, CHPI implicitly bases each physician’s composite rate on comparison with a state-wide benchmark based on current-year data. Based on the rule described in Step 1, a physician can still receive a composite rate if he or she was missing scores for one or two measures of a composite containing five measures. If the physician’s score for the composite meets 0.70 reliability, the physician’s rating will be displayed. If the physician’s score does not meet 0.70 reliability, or if the physician only had scores for one of the three measures in the composite, CHPI displays the phrase “Not enough data to report” in lieu of a rating.
CHPI uses the same methods to report composites at the practice site level.
Review and Corrections Based on requirements for provider review and corrections instituted by the Medicare Qualified Entity Program, CHPI will provide mailed reports and access to an online provider portal to physicians in advance of public reporting. CHPI will send the mailed reports via the U.S. Postal Service, and these reports will not contain beneficiary protected health information. The mailed reports will contain login information to the secure online provider portal, which will allow physicians to view and edit patient-level information (protected health information) that CHPI used to calculate their performance ratings.
Physicians will have 65 days from the mailing date of the mailed reports to review their results and request corrections7. CHPI will collect submitted requests for corrections, and will ensure the accuracy of those corrections by explicitly asking physicians to attest to the corrections’ accuracy and to provide supporting information such as dates of service, where applicable. CHPI will validate and apply corrections just after the end of the 65-day review and corrections period, and before public reporting. At this time, CHPI will re-calculate each step of the process to create physician and practice site scores, reliability, and star ratings for individual measures and composites.
While results will remain largely the same as reported to physicians during review and corrections, the publicly reported results may differ slightly from the results presented in the mailed report and online portal:
• It is possible that changes in the dataset due to review and corrections will cause the statistical validity of individual scores to shift below the 0.70 reliability reporting threshold. Thus, a score
7 The anticipated start date of Cycle 2 Review and Corrections is September 8, 2016. The Cycle 2 Review and Corrections period is anticipated to conclude on November 11, 2016.

32 California Healthcare Performance Information System - Methods for Rating Physicians and Practice Sites – Cycle 2 ©CHPI 2016
575 MARKET STREET, SUITE 600, SAN FRANCISCO, CA 94105
that appeared in the results for review and corrections may not be present in the publicly reported results.
• It is possible that changes in the dataset due to review and corrections will cause the statistical validity of individual scores to shift above the 0.70 reliability threshold. If the reliability shifts above 0.70 after review and corrections, CHPI will report these results in the public report without a footnote. CHPI will not publicly report any results whose reliability is below 0.70 after review and corrections.
• Individual physician (or practice site) scores and star ratings may change due to changes that the physician (or a physician affiliated with that practice site) made during review and corrections.
• Because CHPI bases star ratings for individual measures and composite measures, as well as composite rate themselves, on comparison with other physicians and practice sites, changes made during review and corrections will cause individual physicians’ (or practice sites’) results to change slightly even if that physician (or a physician affiliated with the practice site) did not make changes during review and corrections. In many cases, these will be small changes that do not result in a change to the physician or practice site’s star rating. However, physicians or practice sites may see a change in their star rating in public reporting if their results were very close to the cut-point threshold to receive the next highest or next lowest number of stars.
• CHPI will not publicly report any measure that has fewer than 100 reportable physicians across all specialties. In addition, for measures that have fewer than 100 reportable PCPs or 100 reportable Pediatricians, CHPI will suppress those reporting groups from reporting. In the event that changes made during review and corrections cause a measure or reporting group to decrease its reportable physicians below this threshold, CHPI will suppress the measure or reporting group accordingly.
Questions? Please visit chpis.org for further information, or contact us at [email protected].