campus sustainability report · 3 introduction i look forward every year to compiling the...
TRANSCRIPT

1
Campus Sustainability Report
December 2014(Updated January 2015)

2
About UC Berkeley
The University of California was chartered in 1868, and its flagship campus was established at Berkeley. Today the world’s premier public university and a wellspring of innovation, UC Berkeley occupies a 1,232 acre campus with a 178 acre central core. Net revenues in FY 12-13 were $2.6 billion,1 while total research expenditures were $536 million. Over 10,000 students graduate each year. The campus formalized its sustainability policy in 2007 by adopting the Statement of Our Commitment to the Environment.
sus.tain’a.bil’i.ty n.the ability to meet the needs of the present while living within the carrying capacity of supporting ecosystems and without compromising the ability of future generations to meet their own needs
Chancellor’s Advisory Committee on Sustainability
1. http://controller.berkeley.edu/sites/default/files/2012-13_FinancialStat.pdf

3
Introduction
I look forward every year to compiling the sustainability report as a chance to reflect on the
transformations and successes of the previous twelve months. The past year has brought
several changes to the campus, with an expanded mission for the Office of Sustainability and
Energy, a new opportunity to craft and implement energy policy, and new staff working on
important projects.
Each year, I seem to be struck by one or two of these changes, as being particularly
impactful. The new carbon neutrality goal set by UC President Napolitano is one of these,
and the thought of getting emissions to essentially zero within the next decade is both
empowering and daunting. Many on campus are already rethinking and retooling, with an
eye toward meeting this challenge.
A second item of note relates to the percentage of recent graduates (FY13-14) who took at
least one sustainability course. That figure is now 29%, up from 26% just the year before.
As more classes and related majors are developed, I expect to see even higher proportions
in the coming years. If Andy Warhol is right – that “they always say time changes things, but
you actually have to change them yourself” – then UC Berkeley graduates are getting the
education they will need to “change things themselves.”
After compiling annual sustainability reports for the past six years, this year we are sharing a
condensed version, which focuses on key highlights and updated metrics. We will reach out
to stakeholders to gauge whether this approach of a limited annual report in alternate years
offers enough value and transparency. Stay tuned next year for another comprehensive
report.
Lisa McNeilly
Director of Sustainability and Energy

4
UC to be Carbon Neutral from Building Energy Use by 2025 President Napolitano recently announced that the University of California System will be carbon neutral from building energy and fleet vehicle use by the year 2025. For Berkeley this means reducing our emissions by about 80% or 118,000 metric tons CO2e from current levels. Achieving carbon neutrality in the next 11 years is aspirational – a goal that will require infrastructure investments, new resources, and inclusive and reliable partnerships between the campus, UC Office of the President, and other stakeholders. While implementing efficiency measures will remain important, a significant focus will need to be on the acquisition of renewable energy – both electricity and fuels.
Energy Management Initiative Update The Energy Management Initiative’s second full year of operations demonstrated continued success at reducing campus energy use. Total savings from all parts of the initiative reached $2.4 million and exceeded the target by 10%, while the project remained under budget. The Energy Incentive Program will return almost $1 million to campus units in incentive payments, and no Operating Units were assessed overage charges, as all were under their baselines. The Energy Office expanded their offerings and influence, and can document savings that are almost 50% greater than last year. The Energy Use Policy was finalized and became effective in January 2014. Campus outreach continues to address behavior change and to support all of the Initiative elements.
Cal Climate Action Partnership (CalCAP) UC Berkeley’s Climate Action Partnership (CalCAP) is a coalition of faculty, campus leaders, staff and students that formed in 2006 to reduce greenhouse-gas emissions on campus. In 2013 CalCAP announced that the campus had met its goal of reducing greenhouse gas emissions to 1990 levels two years ahead of the campus schedule and eight years ahead of the UC systemwide policy goal. Key to CalCAP’s success has been the implementation of hundreds of energy efficiency initiatives, transportation fuel reduction efforts, and smart consensus driven decision-making that has transformed the campus culture around energy use, green buildings, procurement, travel, and student service learning. In recognition of this achievement, CalCAP was awarded a Best Practice Award for Sustainability Innovations at the 2014 California Higher Education Sustainability Conference.
UC Berkeley Wins $1.5 Million Grant From The EPA “UC Berkeley was announced as the recipient of a $1.5 million grant awarded by the U.S. Environmental Protection Agency to conduct research measuring household combustion created by cooking, heating and lighting. Through the grant, UC Berkeley researchers plan to measure how cooking with stoves contributes to outdoor air pollution and to introduce cleaner alternatives for developing countries suffering from cookstove pollution. Led by campus environmental health sciences professor Kirk Smith...the team of researchers plan to conduct fieldwork in a largely
Energy & Climate New carbon neutrality goalCampus has continued to make progress toward reducing energy use and greenhouse gas emissions. Electricity use decreased by 2.6% since 2012, and steam use dropped by 4.7%. Total energy use also dropped by 2.6% last year, (Figure 1), while natural gas use increased by 7.4%. Overall, total greenhouse gas emissions remain below 1990 levels, and emissions per research dollar are down over 40% since that same time (Figure 2).
Goal: By 2014, reduce greenhouse gas emissions to 1990 levels. Achieved. Achieve climate neutrality from building and fleet use by 2025. On track.
1990 2007 2010 2013
Total Greenhouse Gases (metric tons CO2 eq)
149,000 176,000 165,200 142,900
0
50
100
150
0
1,000,000
2,000,000
To
tal E
nerg
y
(G
J
per
1,00
0 s
q ft
)
To
tal E
nerg
y (G
J)
19901995
20002005
2013
Figure 1
0. 0
0. 3
0. 5
0. 8
1.0
0
100,000
200,000
300,000
GH
G
per
'000
Rese
arch
$
GH
G e
mis
sion
s (t
ons)
Figure 2
19901995
20002005
2013

5
Reduction Target: In 2012 Berkeley met its first GHG emissions target by
reducing emissions to lower than 1990 levels.
GHG Emissions ProfileBerkeley annually inventories and evaluates
ten GHG emission sources. Emissions are reported to The Climate Registry,
and inventories are third-party verified.
Emissions Today
Emission Trends
agricultural and rural community south of Delhi, India, to study the impacts of cookstove pollution2.” Read more.
UC Berkeley Researchers Aim For Comfort And Energy Efficiency “Researchers at [Berkeley] are working to take research innovations from their labs into the real world to cut commercial building energy consumption by close to a third, and give office workers an unprecedented sense of control over their thermal environments. Armed with a recently announced $1.6 million grant from the California Energy Commission, researchers from UC Berkeley’s Center for the Built Environment (CBE) are refining, testing and promoting a new set of tools to enable more efficient temperature control in buildings by using input from building occupants, a network of web-based applications, and a user-responsive Personal Comfort System (PCS). The PCS uses low-wattage devices embedded into a system of chairs, foot warmers and fans that can quickly warm or cool individual users on demand. The PCS system targets the most thermally sensitive parts of the body such as the face and head, the torso and feet, to provide warmth or cooling as needed and as desired, rather than trying to maintain one temperature for an entire building or floor3.” Read more. Photo credit: Center for the Built Environment
UC Berkeley Installing First CO2 Sensor Network In Oakland “The City of Oakland will be ground zero for the first urban sensor network to provide real-time, neighborhood-by-neighborhood measurements of carbon dioxide – a greenhouse gas that contributes to global warming – and other air pollutants. The prototype network, being installed by chemists at [Berkeley] will employ 40 sensors spread over a 27 square-mile grid, most of them mounted atop local schools to engage students in the project. The information the network will provide could be used to monitor local carbon dioxide emissions to check on the effectiveness of carbon-reduction strategies now mandated by the state, but hard to verify4.” Read more.
Students Tackle Climate Change In Neighboring Richmond “Residents of Richmond, Calif., on the northeastern edge of San Francisco Bay, expect climate change to present their city with major challenges – from rising sea levels to higher temperatures, flood risks and increased energy and water consumption – in coming years. For help meeting these challenges, the city is turning to planning students at UC Berkeley. Jason Corburn, an associate professor with the Department of City and Regional Planning, in the College of Environmental Design, and at the School of Public Health, is leading the campus effort, which expands on the Richmond Health Equity Partnership, a city initiative to improve the health of Richmond residents5.” Read more.
24 Hours Of Reality: The Cost Of Carbon The Office of Sustainability and Building Sustainability @ Cal screened a segment of the Climate Reality Project’s 24 Hours of Reality: The Cost of Carbon. After the screening, viewers discussed their opinions and ideas spurred by the news report. Topics ranged from infrastructure investments to climate change mitigation versus adaptation to the affordability of green technology. A common theme was the necessity to increase conversation about climate change and to find comprehensive local solutions. Participants shared ways to get more involved, through Climate Corps Bay Area and student groups such as Fossil Free Cal and Berkeley Water Group. The event also featured a photo booth where participants could take a picture with a sustainability related pledge.
Steam35%
Electricity31%
Air Travel15%
Natural Gas8%
Employee Commute
8%
Fleet 1%
Student Commute
1%Waste, Water & Refrigerants
1%
0
10
20
30
0
100,000
200,000
300,000
GH
G E
mis
sion
s
(ton
spe
r1,0
00
sq
ft)
GH
G E
mis
sion
s (t
ons)
1990
1995
2000
2005
2013
2. Lydia Tuan, The Daily Californian, “UC Berkeley wins $1.5 million grant from the EPA,” May 29, 2014. 3. Kathleen Maclay, NewsCenter, “Office too hot or cold? Researchers aim for comfort, energy efficiency,” August 27, 2013. 4. Robert Sanders, NewsCenter, “UC Berkeley installing first CO2 sensor network in Oakland,” June 27, 2012. 5. Kathleen Maclay, NewsCenter, “Students tackle climate change in neighboring Richmond,” November 18, 2013.

6
Water Successful drought response
The campus set a goal in 2011 to reduce potable water use to 10% below 2008 levels by 2020 and is on track to meet this ahead of schedule. The campus has responded to the current drought by making further reductions – irrigation has been reduced by 50%, and a number of areas have been designated for renovation to low(er) water use. The campus is prioritizing leak repairs and instituted an Every Drop Counts education campaign. As a result of these efforts and more, main campus water use dropped 6-8% in the early part of 2014 (relative to 2013).
UC Berkeley currently uses just over 605 million gallons a year of potable water, almost all purchased from the East Bay Municipal Water District6, down by 1.8% in 2013. Use is 7.7% lower than 2008 levels, and, more impressively, the campus uses 18% less water than in 1990, even given significant growth in population and buildings. In addition, use per weighted campus user7 is down 22% from the 2003-2005 growth adjusted baseline set as part of the UC system-wide reduction goal.
Goal: Reduce potable water use to 10% below 2008 levels by 2020. On track.
0
5,000
10,000
15,000
20,000
0
200,000
400,000
600,000
Wat
er p
er
capi
ta(g
allo
ns)
Wat
er (
1,00
0
gallo
ns)
1990
1995
2000
2005 2013
Practicing (Drought) Tolerance At The Botanical Garden Plant Sale At the annual Botanical Garden plant sale, staff and volunteers offered tips about planning and maintaining gardens during droughts. Tips included plant selection and other ways to ensure a water-smart garden. Read more. Photo credit: UC Botanical Garden
Irrigation8%
Domestic - Other Buildings
25%
Domestic - Residence Halls
25%
Steam Plant25%
Lab Buildings30%
Water Use by Type
Too Good To Waste: Drought In Berkeley As A Catalyst For Innovation In response to the drought, in May this year, the Daily Californian produced a video that took an in-depth look at research and innovation in water resource management.
602 616 605
2011 2012 2013
Millons of Gallons of Water Used
6. As much as 24,000 gallons of rainwater are reused each year for irrigation at the Boalt Law School. 7. Adjustments for population growth are by “Weighted Campus User,” which is defined as (1 × number of on-campus residents) + (0.75 × number of non-residential or commuter full-time students, faculty, and staff members) + (0.5 × number of non-residential or commuter part-time students, faculty, and staff members).

7
Built Environment 10% of campus space certified
2009
2012
2013
(2)
(14)
(10)
In the past year, the campus has added four new LEEDTM certified building projects. Three of these achieved LEEDTM Gold (Anna Head West, the Energy Biosciences Building, and Pat Brown’s Grill). A fourth, California Memorial Stadium, achieved LEEDTM Silver. These buildings bring the total square footage of certified buildings to almost 1.6 million square feet, or almost 10% of the campus total.
Goal: Design future projects to minimize energy and water consumption and wastewater production; incorporate sustainable design principles into capital investment decisions; base capital investment decisions on life cycle cost, including the cost of known future expenditures. On track.
Energy Biosciences Building
Four Berkeley Students Win Award In Better Building Case Competition Golden EnergTech, a team of four Berkeley engineering students took home the award of “Most Innovative Proposal” in the U.S. Department of Energy’s Better Building Case Competition. The multi-disciplinary team proposed tackling the large energy footprint of research laboratories and the lack of incentives to reduce energy use, through a series of self-sustaining policies and educational initiatives to accrue savings and promote investment in further projects to conserve energy. Golden EnergTech was only one of two undergraduate groups to receive an award. Read more.
The Green Renters’ Workshop In late April 2014, Building Sustainable @ Cal, in partnership with the Berkeley Climate Action Coalition’s Multifamily Energy Efficiency pilot program, held a free Green Renters’ Workshop. The workshop focused on many common issues, such as why to decrease energy and water use, and how to comply with the new mandatory recycling ordinance.

8
Waste Total waste dropped while diversion rate static
The campus has once again reduced the total amount of municipal solid waste generated and is now down 32% since 1995 (Figure 1). Waste per capita has also decreased by over one-third but in a shorter timeframe (since 2001). Diversion rates excluding construction waste, however, have remained stagnant and below the campus goals (Figure 2).
Goal: Achieve a 75% diversion rate by June 2012 and zero waste by 2020. On track.
New Move-In/Move-Out Program Encourages Students To Be Green “Be Green! Keep it out of the Waste Stream!” reads a message shared with students. As part of the Cal Move-Out program, the webpage highlights ways for students to recycle all of their goods, from clothes, electronics, furniture, to bikes and more. Combining the resources of UC Berkeley and the City of Berkeley, the program aims to decrease the effects of illegal dumping near campus, and the environmental effects that accompany it. Cal Move-Out encourages student to take advantage of resources like the ReUSE Online Exchange, the Alameda County Food Bank, the East Bay Center for Creative Reuse, and BiCyCal. Read more.
2000 Carleton St 24-Ton Purge “Staff employees at 2000 Carleton St., the off-campus home of [Facilities Services], recently jettisoned a 24.45-ton mother lode of metal, paper and other materials in a six-week cleanup. And they managed to direct 22.2 tons of that total — including broken and outdated equipment, furniture, electronics and office supplies — to recycling or reuse. The building-wide cleanup, involving 250 staff members and about 80,000 square feet of space, was long overdue, says Tim Guichard. ‘We lightened our load considerably and created lots more space for the shops (especially plumbing) and on the docks located on either side of the building.’ When all was said and done, the Motor Pool, which manages more than 150 campus vehicles, took the honors for cleanest shop. ‘You could eat off the floor,’ Guichard says. The Motor Pool got rid of close to one and a half tons of excess equipment8.” Read more.
Cal Clean-Up Day Is “Gettin’ The Butts Out” Returning to an old tradition, UC Berkeley carried out a clean-up day, where students picked up rubbish around campus, and received a free t-shirt for their efforts. To celebrate a year of being a “Tobacco-Free Campus,” the campaign this year focused on cigarette butts, cleaning up areas from campus and the banks of Strawberry Creek. Tim Pine (a campus Environmental Protection Specialist) commented [in his blog] that the event demonstrated “a campus-wide commitment to a trash- and tobacco-free UC Berkeley9.” He further states that “[UC Berkeley’s] enthusiastic volunteers made a real dent in the number of butts on UC Berkeley grounds and sets the stage for a more robust effort coming in the 2014 Fall Semester.”
Bears Retain National RecycleMania Title Berkeley has successfully defended its title in the national collegiate waste-diversion competition, RecycleMania. For a second time, Cal had the highest waste diversion rate (93 percent) at the March 8, 2014, men’s basketball home game against University of Colorado Boulder (which Cal won 66-65). To help motivate the crowd, the half-time entertainment included a composting and recycling competition on the court with prizes donated by Cal Dining. Read more.
Waste Diversion Rate(Including Construction and Demolition)
56% 63%50%
2011 2012 2013
*excludes construction and demolition
46%* 44%*43%*
8. Public Affairs, NewsCenter, “Spring cleaning at 2000 Carleton is a 24-ton purge,” May 2, 2014. 9. Tim Pine (May 5, 2014) UC Berkeley is “Gettin’ the Butts Out!” [Save the Bay Web Blog], http://blog.savesfbay.org/2014/05/uc-berkeley-is-gettin-the-butts-out/

9
3,664
118,394
35,249
6,835 2,175 4,2160
20,000
100,000
160,000
2007 2008 2009 2010 2011 2012
Div
erte
d C
onst
ruct
ion
Was
te
(sho
rt
tons
)
2013
1,062
“Building Clean Up” Continues The Building Clean Up Week project, sponsored by Space & Capital Resources with a long list of partners, completed two more buildings (Hilgard and Kroeber) and plan to continue to clean up one building per semester. In addition to repurposing 2,000 square feet of space, the project has sent furniture to be reused, shredded paper, and composted and recycled. Read more.
ProcurementData challenges remain
Even as the campus has added new software and shifted focus to green purchasing, the collection of consistent data remains a challenge. Data gathering continues to require individual requests of vendors or central procurement staff. One success can be highlighted – an increase in the percentage of recycled content copy paper purchases to 76%, largely due to the efforts of campus staff and the use of the new software to reroute orders to the less expensive, recycled paper.
Goal: Comply with the University of California environmentally-preferable purchasing policies and procedures. On track.
Taking Sustainable Office Supplies On The Road In June 2013, Emily McKeon and Lin King of Campus Recycling and Refuse Services’ Zero Waste Research Center partnered with Sandy Macasieb of UC Berkeley Procurement and Scott Hrudicka of OfficeMax to create a simplified list of environmentally-preferred products (EPP) offered in the Bear Buy purchasing system. The Zero Waste Research Center suggested products that would be sustainable alternatives to common office supplies. This list of products includes common office supplies such as pens, whiteboard markers, and post-its. Campus Shared Services hosted the first EPP Road Show in November.
Figure 1 Figure 2
Waste diversion from construction varies dramaticallydepending on the type and number of projects in a given year
Percentage of Recycled Copy Paper Purchases
2010 2011 2012 2013
Soli d
Was
te p
er w
eigh
ted
50
150
250
0
2,500
5,000
7,500
cam
pus u
ser
(sho
rt to
ns)
Solid
wsa
te(s
hort
tons
)
2013
2005
2000
1995

10
Food New initiatives spark innovation
University of California Global Food Initiative In July 2014, the University of California announced the launch of the Global Food Initiative “to address one of the critical issues of our time: how to sustainably and nutritiously feed a world population expected to reach eight billion by 2025.” Its focus is both external, such as how UC translates research into policy and helps communities eat more sustainably, and internal, such as how UC leverages its collective buying power and dining practices to create desirable policies and outcomes. The initiative aims to rally the broad UC community across a wide range of disciplines to work toward putting the world on a path to sustainably and nutritiously feed itself.
Goal: By 2020, increase sustainable food purchases by campus foodservice providers to at least 20%. On track.
The percentage of sustainable food purchases by campus foodservice vendors has remained steady at 27%. Data includes both Cal Dining (both residential dining and their retail operations) and two other vendors and represent the majority of food sales on campus. The data on purchases is presented two ways. The first number includes purchases that are locally grown, organic, fair trade, or humane (in accordance with UCOP policy). The second number also includes purchases produced by locally-owned businesses.
Sustainable Food Purchases
2011 2012 2013
33%* 38%* 38%*
*includes foods produced by locally-owned businesses
24% 28% 27%
Berkeley Food Institute Aims To Help Transform The Worlds Food System “Where else but Berkeley — home of both Chez Panisse and the Free Speech Movement — would the nation’s top public university launch an institute whose aim is not just better food for all but a fundamental transformation of the world’s food systems? UC Berkeley’s new Berkeley Food Institute has nothing less as its goal. The institute deploys the intellect, energy and influence of five colleges to connect with farmers and environmentalists, with people struggling to feed their families, with the food industry and with policymakers and powerbrokers to help supercharge the push for a fair and sustainable food system. ‘We aim — through research, education and outreach to citizens and policymakers — to help transform the global food system into one that is diverse, just, resilient and healthy,’ says Claire Kremen, a professor of environmental science, policy and management in the College of Natural Resources and co-faculty director of the institute with CNR colleague Alastair Iles10.”
2014 CACS Sustainability Summit Saru Jayaraman, a Berkeley Food Institute Visiting Scholar and the co-founder and co-director of Restaurant Opportunities Centers United, was the keynote at the 11th Annual Sustainability Summit in April 2014. Her talk on “Food Justice” covered aspects of her work to organize restaurant workers to win workplace justice campaigns, partner with responsible restaurants, and launch cooperatively-owned restaurants. The purpose of the summit is to honor achievements with Sustainability Awards, to give general community members the chance to green their campus with Green Fund Grants, to highlight major initiatives, and above all to reconnect and share. See more.
Food For Thought: Campus Food Day A Success! On October 24, 2013, students gathered on Upper Sproul to participate in Food Day. Food Day is a national event celebrating healthy, affordable, and sustainable food. Its goal is to encourage healthy and sustainable diets across America, support organic and local farmers, educate the public about worker and animal rights, and reduce nationwide hunger. Participants were encouraged to take the UC Eats Real Food Day Pledge to consciously eat sustainable and healthy food for at least a day. In addition to student groups, vendors including Purity Organic Fruit Drinks, BreadSrsly Bakery, Ubunto Coffee and more supplied free samples and information about sustainable and locally grown food.
10. Excerpt from Carol Ness, NewsCenter, “Berkeley Food Institute aims to help transform the world’s food system,” September 30, 2013.

11
Transportation Fuel use remains down
Total campus fuel use – from fleet and commute – increased slightly, but still remains over 50% below 1990 levels. Every three years, the campus surveys faculty, staff, and students on a range of transportation and commute questions. This survey will be completed again in early 2015, and will provide an update on commuter modal choices.
Berkeley Is Partner In A New Electric-Bicycle-Sharing Pilot Scheme “The cities of Berkeley and San Francisco are slated to launch a pilot electric-bicycle-sharing program in spring 2014. The San Francisco Municipal Transportation Agency board of directors granted $1.5 million for the program, which aims to increase mobility for Bay Area commuters, reduce emissions and lessen traffic congestion in the Bay Area. The program partners City CarShare, a Bay Area nonprofit car-sharing service, with the Transportation Sustainability Research Center at the UC Berkeley Institute of Transportation Studies. During the pilot period, the UC Berkeley Transportation Sustainability Research Center will evaluate energy and environmental impacts of the service and test the electric bicycle’s influence on commuters’ methods. The pilot period will end in 201811.” Read more. Photo credit: The Daily Californian
1990 2011 2012 2013
3.1 M Fuel Usage in Gallons (Commute and Fleet)
1.4 M 1.4 M 1.5 M
0
25
50
75
0
1,000,000
2,000,000
3,000,000
Fuel
usa
ge p
er c
apit
a(g
allo
ns)
Fuel
usa
ge (
gallo
ns)
1990
1995
2000
2005
2013
Goal: By 2014, reduce fuel use by commuters and campus fleet to 25% below 1990 levels. Achieved.
11. Lydia Tuan, The Daily Californian, “Electric-bicycle-sharing pilot program to launch in Berkeley, San Francisco in 2014,” August 25, 2013.

12
Land Use Planning for new campus
The campus lawn conversion program increased the area planted in native or drought tolerant species by almost 17,000 square feet, and is continuing to expand the program as part of the campus drought response.
Berkeley Global Campus: a new, bolder vision for Richmond Bay The campus continues work on a new vision for the Richmond Field Station, planning “to remake the site as a global campus and ‘living laboratory’ in partnership with public universities from around the world, as well as with private industry.” The Berkeley Global Campus at Richmond Bay, will have both a research mission and a strong educational component as well, with both undergraduate and graduate-level academic programs for U.S. and international students. Programs will be aimed at giving students the tools “to tackle global challenges through a curriculum centered on global governance, ethics and political economy, cultural and international relations,” as well as “direct involvement in special projects with global implications and applications12.” Read more.
Strawberry Creek Sustainable Infrastructure Walking Tour A new walking tour has been created centered on Strawberry Creek, highlighting various installations around campus that are examples of sustainable water management. The tour illustrates how each improvement affects Strawberry Creek, with highlights including the Grinnell Natural Area, the rain gardens, and the stormwater detention ponds.
Academics & Learning by Doing Examples of sustainability research
Seafloor Carpet Catches Waves To Generate Electricity “What do champion surfers who gathered at last week’s Mavericks Invitational have in common with a UC Berkeley engineer? They all are looking to harness the power of big ocean waves. But the similarities end there. For assistant professor Reza Alam, an expert in wave mechanics, the seafloor ‘carpet’ he is proposing will convert ocean waves into usable energy. ‘There is a vast amount of untapped energy in the oceans, and with increasing worldwide demand for power, the need to find cleaner alternatives to fossil fuels is critical,’ said Alam. ‘We are also seeing greater population growth along coastal cities, so the ocean-based system we are developing would produce electricity in a carbon-neutral way right where it is needed13.’” Read more.
UC Berkeley researchers, community team up to eliminate toxic chemicals “UC Berkeley researchers are teaming up with local organizations to plant thousands of ferns in a South Berkeley lot in an effort to extricate toxic chemicals and eventually create a new haven of green gardens. The project, spearheaded by the campus department of environmental science and the citywide nonprofit organization Berkeley Partners for Parks, will experiment with pteris vittata, also known as the Chinese brake — a specialized fern known to extract a thousand times more arsenic from the soil than a typical plant. If successful, the city will then transform the area into a greenway lined with bicycle paths and trees14.” Read more.
Sub-Urban Sprawl Cancels Carbon-Footprint Savings Of Dense Urban Cores “According to a new study by UC Berkeley researchers, population-dense cities contribute less greenhouse-gas emissions per person than other areas of the country, but these cities’ extensive suburbs essentially wipe out the climate benefits. Dominated by emissions from cars, trucks and other forms of transportation, suburbs account for about 50 percent of all household emissions – largely carbon dioxide – in the United States. The study… uses local census, weather and other data – 37 variables in total – to approximate greenhouse gas emissions resulting from the energy, transportation, food, goods and services consumed by U.S. households, so-called household carbon footprints.” Read more.
12. Adapted from Public Affairs, NewsCenter, “Berkeley Global Campus: a new, bolder vision for Richmond Bay,” October 30, 2014. 13. Sarah Yang, NewsCenter, “Seafloor carpet catches waves to generate energy,” January 28, 2014. 14. Virgie Hoban, The Daily Californian, “UC Berkeley researchers, community team up to eliminate toxic chemicals,” October 31, 2012. 15. Robert Sanders, News Center, “Suburban sprawl cancels carbon-footprint savings of dense urban cores,” January 6, 2014.

13
The campus community continues to find ways to expand their engagement and build new institutional links across the range of sustainability issues - walking tours were created and updated, a third staff sustainability training was held, and the main campus sustainability website was revamped. This past year, the number of certified green events rose to 154, with over 42,000 attendees. Almost a third were hosted by student groups and three-quarters included composting. Other examples include:
SERC Partnership with the 2014 SF Green Film Festival The Student Environmental Resource Center (SERC) partnered with the 2014 SF Green Film Festival to co-host a screening of “Mondo Banana” and an Open Mic Night, where the audience was invited to perform a song, an original piece of poetry, dance or other form of creative expression.
Sustainability in Action Student Nik Crain used funds from a TGIF Mini-Grant Project to create a three-minute video that highlights the Campus ReUse Stations, the Berkeley Student Food Collective, composting at Co-Ops, and more. See more.
Haas’ Earth Day At Berkeley Is A “Big Success” In May 2014, the Haas School of Business Green Team set up a “Make A Pledge For Earth Day” event in the staff lounge. The turnout of 81 staff members all wrote pledges to live greener lives and decrease their environmental footprint in the categories of waste, food,
climate, water, and energy. The pledges varied from biking to work to buying locally grown and organic produce.
Earth Week 2014 proves a hit In 2014, Earth Week offered an unprecedented number of sustainability events and activities. Over 30 events were organized and offered by a range of campus groups. Highlights included the ‘Human Oil Spill,’ (where students, completely dressed in black, laid under a large oil rig model with signs that spoke to oil-related issues), the Chancellor’s Advisory Committee on Sustainability’s annual Summit (with the theme of Food Justice) and the Hills to Bay Strawberry Creek Watershed walk. Read more. Photo credit: Kelly Johnson Revolutionary Photography
Words of the Watershed: Undergraduate Journal launched SERC initiated a new undergraduate publication called Words of the Watershed as one of its signature programs. The publication is the Undergraduate Journal of Environmental Writing, and features a multitude of poetry and prose concerning the environment (particularly that around Berkeley and the Bay). The first print volume was released in May 2014.
Information School Team App For West African Fishermen Snags Sustainable Fishing Prize Four UC Berkeley students (Jenton Lee, Isha Dandavate, Kate Rushton, and Dan Tsai) won the grand prize in a Fishackathon sponsored by the U.S. Department of State to support sustainable fishing practices around the world. The team’s end product, called “Fish DB,” was a mobile app that helps small-scale fishermen and support the West Africa Regional Fisheries Program (WARFP). Read more. Photo credit: Isha Dandavate
2014 Dow Sustainability Innovation Student Challenge Award Winner Emily Woods was named the grand prize winter of the competition for her project titled “Sanivation: Waste to Energy.” Woods is an M.S./Ph.D. candidate at the Energy and Resources Group at UC Berkeley and a graduate of Georgia Tech with a B.S. in Mechanical Engineering. She has created her own start-up company, Sanivation, to focus on solar treatment of human waste and conversion to charcoal in Kenya.
Across CampusIncreased engagement

14
2014 CACS Sustainability Award Winners
Residential Sustainability Program – Their mission is to provide resources and introduce on-campus residents to the importance of cultivating sustainable lifestyles. Created approximately seven years ago to assist residential managers in developing sustainable environments within the residence halls, RSP uses paid and volunteer students to educate students on how to contribute to the creation of a sustainable environment on campus. They also collaborate with various campus and departmental partners – for example, working with Cal Dining to experiment with a “Meatless Mondays” concept to raise awareness about factory farming and to promote a meatless diet for residents. They are among the first to introduce new students to our sustainability programs and take that responsibility seriously.
UC Berkeley Public Affairs – As a group, Public Affairs has been a long time champion of sustainability. In fact, before there was a campus composting program, they had their own worm composting for food waste. However, in the past year, their commitment to increase the volume and quality of campus sustainability communications has been evident. They have written numerous stories – including extensive coverage of the 10th anniversary of CACS – and about operations and sustainability research being done on campus. They often include stories in the Berkeleyan, have sustainability and zero waste tags in the NewsCenter, and host the Berkeley Blog, which includes regular entries in the Energy & Environment category.
Eli Perszyk – Eli is a model sustainability champion in his role as Facilities Manager for the College of Environmental Design and has proven to also be a mentor and educator for the student environmental leaders at UC Berkeley. If you search Eli’s name on the campus website, the results show exactly how involved he is in the full range of campus activities. He’s been a part of at least three Green Initiative Fund projects; he’s worked on hydration stations, energy competitions, and water meters; he works with student groups and advises classes; and he brought composting to Wurster Hall and piloted new indoor waste bins. Eli’s efforts – which go far above and beyond his job description – have promoted a culture of sustainability within Wurster Hall.
15
Economic Sustainability
Teaching The access to higher education by a broad range of students is one source of indirect economic impacts. For example, 27% of new students are first generation college student with neither parent having a four-year college degree, and 32% reported that their annual household income was less than $50,00016.
Financial aid California families that qualify for financial aid and have incomes below $80,000 pay no tuition under the University of California’s Blue and Gold Opportunity Plan. Eligible U.S. undergraduates with family incomes between $80,000 and $140,000 who have typical assets will be covered by the new Middle Class Access Plan (MCAP) which ensures that their parents’ contribution will not exceed 15% of their total annual income17.
Survey Names UC Berkeley In Top 10 Value Colleges UC Berkeley came 9th on Kiplinger’s List of the 100 Public Colleges and Universities with the best value. Approximately two-thirds of undergraduates receive some form of financial aid. The current average debt at graduation for UC Berkeley students who have borrowed is about $18,000. Read more.
Upward Bound Urban Ecology Class Proves A Hit The Upward Bound Program provides fundamental educational support to those from low-income backgrounds, families where neither parent holds a bachelor’s degree, or first-generation military veterans. The Urban Ecology Program guides students through various topics in the field such as urban wildlife, urban planning, and city forests. The students work in teams to brainstorm and propose a specific way for the campus to be more ecologically sustainable. Read more about Upward Bound here. Photo credit: Upward Bound
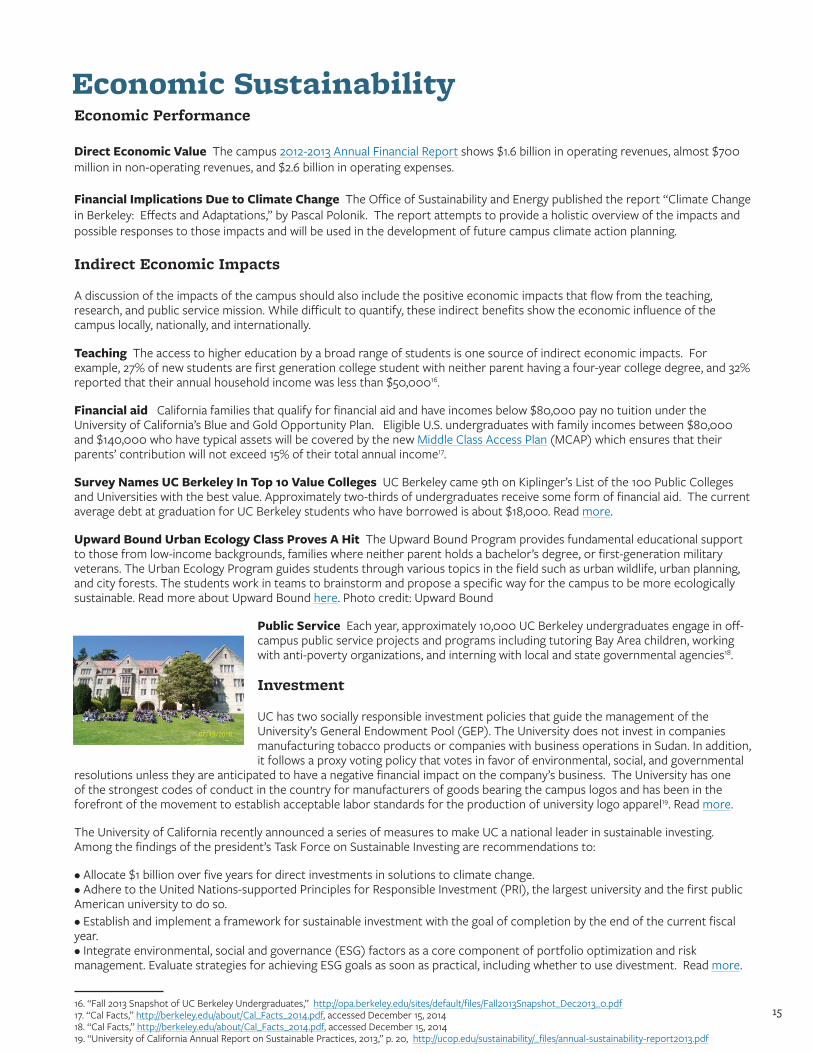
Public Service Each year, approximately 10,000 UC Berkeley undergraduates engage in off-campus public service projects and programs including tutoring Bay Area children, working with anti-poverty organizations, and interning with local and state governmental agencies18.
Investment
UC has two socially responsible investment policies that guide the management of the University’s General Endowment Pool (GEP). The University does not invest in companies manufacturing tobacco products or companies with business operations in Sudan. In addition, it follows a proxy voting policy that votes in favor of environmental, social, and governmental
resolutions unless they are anticipated to have a negative financial impact on the company’s business. The University has one of the strongest codes of conduct in the country for manufacturers of goods bearing the campus logos and has been in the forefront of the movement to establish acceptable labor standards for the production of university logo apparel19. Read more.
The University of California recently announced a series of measures to make UC a national leader in sustainable investing. Among the findings of the president’s Task Force on Sustainable Investing are recommendations to:
• Allocate $1 billion over five years for direct investments in solutions to climate change. • Adhere to the United Nations-supported Principles for Responsible Investment (PRI), the largest university and the first public American university to do so.• Establish and implement a framework for sustainable investment with the goal of completion by the end of the current fiscal year. • Integrate environmental, social and governance (ESG) factors as a core component of portfolio optimization and risk management. Evaluate strategies for achieving ESG goals as soon as practical, including whether to use divestment. Read more.
Economic Performance
Direct Economic Value The campus 2012-2013 Annual Financial Report shows $1.6 billion in operating revenues, almost $700 million in non-operating revenues, and $2.6 billion in operating expenses.
Financial Implications Due to Climate Change The Office of Sustainability and Energy published the report “Climate Change in Berkeley: Effects and Adaptations,” by Pascal Polonik. The report attempts to provide a holistic overview of the impacts and possible responses to those impacts and will be used in the development of future campus climate action planning.
Indirect Economic Impacts
A discussion of the impacts of the campus should also include the positive economic impacts that flow from the teaching, research, and public service mission. While difficult to quantify, these indirect benefits show the economic influence of the campus locally, nationally, and internationally.
16. “Fall 2013 Snapshot of UC Berkeley Undergraduates,” http://opa.berkeley.edu/sites/default/files/Fall2013Snapshot_Dec2013_0.pdf 17. “Cal Facts,” http://berkeley.edu/about/Cal_Facts_2014.pdf, accessed December 15, 2014 18. “Cal Facts,” http://berkeley.edu/about/Cal_Facts_2014.pdf, accessed December 15, 2014 19. “University of California Annual Report on Sustainable Practices, 2013,” p. 20, http://ucop.edu/sustainability/_files/annual-sustainability-report2013.pdf

16
Haas Business School MBAs Beat The Market In Socially Responsible Fund From its inception, the Haas Socially Responsible Investment (SRI) Fund has been lauded as both ambitious and groundbreaking. The first and largest student-led SRI fund within a leading business school, it offers Berkeley-Haas students real-world experience in how to deliver a strong financial return and have a positive social impact. Since 2008, the student principals have grown the initial investment of $1.1M to $2M+, a more than 50% return on investment over six years, and outperformed their environmental, social, and governance (ESG) benchmarks.
Social SustainabilityOccupational Health and Safety
Worker safety is an important part of the work of the campus. The summary of recordable injuries and illnesses is reported annually and is available online, and reports 462 recordable injuries and illnesses in 201320.
Training and Education
Staff NOW Conference Showcases Emerging Campus Careers The Second Next Opportunity at Work (NOW) Staff Development Conference convened about 600 attendees for workshops, motivational talks, networking, and on-the-spot career counseling. The conference showcased nine emerging campus careers and is intended to be an annual event. Vice Chancellor John Wilton welcomed attendees, saying that “[While] it’s often said that working at Berkeley is a privilege in itself, we can’t ignore that it can be tough to work in the midst of change on the scale taking place on campus21.” Read more. Photo credit: Rachelle Galloway-Popotas, NewsCenter
Students Turned Teachers In 2013, Berkeley ranked among the top contributors to Teach for America, sending 69 graduates to start two year classroom commitments at urban and rural K–12 schools in the fall of 201322.
Diversity and Equal Opportunity
New Ombuds Report The Staff Ombuds Office’s 2012-2014 Biennial Report provides information about the primary workplace concerns of employees as well as new systemic recommendations for the campus to consider. Workplace respect and civility continued to top the list of concerns brought to the Staff Ombuds Office. In addition, the data showed an increase in employee concerns about job/role clarity and work styles. This is likely the result of organizational change as many employees’ jobs or reporting lines changed as the campus centralized services. The report also identified several systemic issues and accompanying recommendations regarding the staff complaint process, equity in compensation, awareness about medical leave and reasonable accommodation, and the role of work lead positions.
Campus Releases Climate Survey Results In March 2014 the University of California released the results of a systemwide survey of its students, faculty and staff. The survey “was intended to create a baseline of data that will help develop a deeper awareness of how members of the UC community relate to one another on a day-to-day basis.”
Among the key findings for Berkeley:
• High levels of comfort with the climate: 76% of all respondents (n = 9,830) of all respondents were “comfortable” or “very comfortable” with the climate at UC Berkeley while 9% (n = 1,171) were “uncomfortable” or “very uncomfortable.” • Some members of the community experience exclusionary conduct : 26% of respondents (n = 3,307) believed that they had personally experienced exclusionary, intimidating, offensive and/or hostile conduct; 10% of respondents (n = 1,232) indicated that the conduct interfered with their ability to work or learn.
A complete copy of the survey and the recent campus response is available online.
20. http://uhs.berkeley.edu/facstaff/dms/pdf/OSHA_Annual_Summary_2013.pdf 21. Cathy Cockrell, NewsCenter, “Staff NOW conference showcases emerging campus careers,” June 20, 2014. 22. “Cal Facts,” http://berkeley.edu/about/Cal_Facts_2014.pdf, accessed December 15, 2014

17
Annual Sustainability Metrics: 1990-2013 1990 1995 2000 2011 2012 2013
Energy & Climate
Total greenhouse gases (metric tons CO2 eq.) 148,954 153,667 182,202 147,056 138,792 142,928
- GHG Scope 1 10,635 11,368 11,100 13,738 12,776 13,868
- GHG Scope 2 89,329 94,353 124,575 99,841 92,493 94,116
- GHG Scope 3 48,991 47,946 46,528 33,477 33,524 34,944
Electricity (kWh) 156,793,403 174,820,676 188,778,537 213,936,507 217,366,655 211,786,848
Steam (MMBtu) 968,246 975,972 983,760 1,084,036 1,034,039 985,201
Natural gas (MMBtu) 152,230 165,425 159,537 206,759 208,034 223,462
Total energy (G joules) 1,747,533 1,834,522 1,882,335 2,133,083 2,093,987 2,038,623
Renewable energy 100 kW 100 kW 100 kW
Renewable energy certificates (metric tons CO2) 205 0 0
WaterWater(millions of gallons) 739.3 744.8 698.7 602.1 616.3 605.0
Wastewater(millions of gallons) 546.7 512.2 473.9 421.5 429.9 423.5
Built Environment
LEED™ buildings (#/square footage) 10(1,112,861 ft2)
10(1,112,861 ft2)
14(1,596,403 ft2)
WasteSolid waste (short tons) 6,414 6,385 4,815 4,622 4,360Diverted waste (short tons) 1,705 3,157 6,192 7,733 4,407
- Recycled waste 1,705 2,374 2,127 1,978 1,844- Construction waste 2,175 4,216 1,062- Reusables 214 231 20- Composting 783 1,675 1,308 1,481
Diversion rate (%) 21% 33% 46%/56% 63%/43% 50%/44%Hazardous Waste (tons) 801 341 280 184 162
ProcurementTotal green purchasing ($) $1.5 million $11.8 million $14.4 million n/a
Recycled paper purchases (% of total copy, fine, and computer paper purchases) 64% 76% 71% 76%
Transportation
Fuel usage – commute and fleet (gal) 3,118,671 3,009,282 2,829,705 1,393,017 1,386,046 1,515,846Green fleet (%) 22.0% 22.9% n/aAir travel (miles) 112,500,176 112,320,124 113,884,430
FoodTotal sustainable purchases (%) 24%/33% 28%/38% 27%/38%
OtherPopulation 44,120 43,509 45,565 50,334 50,511 51,109
Gross Square footage 12,817,517 13,520,471 14,145,728 16,127,722 16,862,738 16,314,262
Research $309,755,000 $333,613,000 $415,408,000 $518,376,000 $500,879,000 $515,518,000

18
Annual Sustainability Metrics: Sources and Changes from Previous ReportsData from 2013 CalCAP inventory (January 2, 2015 version) unless otherwise noted (http://calcap.berkeley.edu). Most waste data is from Campus Recycling & Refuse Services. Data are calendar year unless otherwise noted; if fiscal year, data reported in the starting year of the fiscal year (e.g., FY 2008-2009 is reported as 2008).
Greenhouse gases: “Total greenhouse gas emissions” (the basis for the campus reduction goal) includes Scope 1,2,&3 emissions. Data slightly updated for accuracy after third party verification. Breakdown of emissions by scope updated to correctly identify refrigerants and de minimus emissions as Scope 1.
Natural gas: 2011 data have been corrected for accuracy.
Renewable energy: Onsite renewable energy represents a photovoltaic installation on the Student Union. The solar thermal installation at the Maximino Martinez Commons is not included because the campus does not retain the environmental attributes.
Renewable energy certificates: Credits purchased from third party to offset electricity emissions.
LEED™ buildings: Gross square footage for certified building projects from Judy Chess, personal communications.
Water: Approximately 24,000 gallons of rainwater are reused each year for irrigation at the Boalt Law School.
Solid waste: All waste sent to a landfill, excluding hazardous and construction. All data now being reported on a fiscal year basis. Estimated data for 1990 are no longer being reported.
Diverted waste: Includes recycled, reused, and source-reduced waste, construction waste, and composting.
Recycled waste: 2011 data updated to include additional data received after publication date last year.
Construction waste: Waste diverted from a landfill from construction and demolition sources. Waste from some construction projects may not be included. Not reported or not reported separately until 2007. This includes waste from some general campus operations.
Reusables: Newly reported data. Included in “Recycled waste” before 2012.
Diversion rate: The higher number is the percentage of all waste that was diverted from a landfill; the lower number excludes construction waste. 2012 rates updated using more accurate data.
Hazardous waste: Variations in hazardous waste due to construction projects, especially demolishing buildings containing asbestos and lead. Source: EH&S hazardous waste database.
Total green purchasing: Data from UCOP. Includes Energy Star, EPEAT, Green Guard, Green Seal, and recycled content from system-wide contracts only. Data since 2010 now also includes sustainable food purchases. Some green purchases may not have been included in this total due to inadequate reporting by some vendors. Data are for fiscal years.
Recycled paper: Data from major office suppliers. All data are based on cost, for paper with a 30% or higher post-consumer recycled content.
Fuel usage: Includes gasoline for commutes; includes gasoline, diesel, E85, and biodiesel for fleet. All data updated to correct a minor reporting error.
Vehicle miles traveled – commute: No longer being reported.
Vehicle miles traveled – fleet: No longer being reported.
Green fleet: Includes categories of vehicles as defined in the Energy Policy Act (various) plus hybrid vehicles. Source: Fleet Services.
Total Sustainable Food: Data for 2008 are from Cal Dining only, using the Real Food Challenge criteria. Data for 2011-2013 from Cal Dining and additional campus foodservice vendors. For 2010-2013: first number includes purchases that are locally grown, organic, fair trade, or humane. Second number also includes purchases produced by locally-owned businesses.
Population: Includes students, faculty, and staff. Faculty and staff are in full-time equivalent (FTE).
Gross Square footage: Number for 1990 is assumed to be the same as for 1991. Data represents Basic Gross Area for UC Berkeley-owned space.
Research: Research dollar expenditures, in constant 2009 dollars (converted using CPI). Data are fiscal year; 2012 data are preliminary. 2011 data updated to reflect adjustments made after publication last year. Source: Personal communications and Controller’s Office, Schedule 1-B http://www.ucop.edu/financial-accounting/financial-reports/campus-financial-schedules/

19
AcknowledgmentsLisa McNeilly was the primary author. Kira Stoll provided annual greenhouse emissions and other data, and contributed text and related evaluation. Amy Fudenberg designed the Report, building on previous work by Erin Fenley. A special thanks as well to the students of CE292A (Fall 2014) for their review and insights.
The Office of Sustainability and Energy would like to recognize all of those who contributed to this Report, while acknowledging that any errors or omissions remain our responsibility. Thanks to the following for their contributions to the writing, photos, and information for this report:
Lindsey Agnew Jenna Allen Alex ButlerJudy ChessCathy Cockrell Amy CraikNik CrainKelley EtheringtonAmy FudenbergTim Hedgeland
Jonathan Henke Virgie Hoban Arpad HorvathJessie Lau Yaling LiKathleen MaclayEmily McKeon Kevin NgCarol Ness Tim Pine
Pascal PolonikBen RushakoffRobert Sanders Kira StollLydia Tuan Katherine WalshAshley VillenuevaSarah Yang
To find out more about current sustainability efforts on campus, visit sustainability.berkeley.edu, email the Office of Sustainability and Energy at [email protected] or sign up for the Bright Green News.
About the Office of SustainabilityThe UC Berkeley Office of Sustainability and Energy provides leadership to campus by setting ambitious sustainability goals and strategies and by accelerating the achievement of these goals through project implementation, planning, partnerships, and community engagement. Our mission is to integrate cutting-edge sustainability practices into our operations and foster a culture of sustainability at home and in the world. We work to achieve climate neutrality with a focus on reducing energy use, and strive for excellence by implementing initiatives to reduce our ecological footprint and by emphasizing transparency and accountability through our plans and reports. The work of the Office includes communication across campus, and faculty, staff, and student engagement.

20
sustainability.berkeley.edu