capacity markets overview
TRANSCRIPT
© 2013 Platts, McGraw Hill Financial. All rights reserved.
Do Capacity MarketsSend a Signal for New-build Generation?
Peter Maloney, Senior Writer, Platts Power Group
Platts Commodity Week, Houston
October 9, 2013

Do Capacity MarketsSend a New-build Signal?
• What are capacity markets and why were they created?• To ensure reliability by providing the “missing money”
• The “missing money” problem • In markets with capped energy prices and mandated adequacy
requirements, returns from energy and ancillary services will not provide sufficient compensation to support the cost of new generation. – Dr. Roy Shanker
2
Do Capacity MarketsSend a New-build Signal?
There are two types of electricity:
• Energy – keeps the lights on
• Capacity – makes sure they stay on
3
Do Capacity MarketsSend a New-build Signal?
• How do you pay for something that is not used, i.e., capacity?
• Assign a value to capacity via a competitive auction
• There are four organized capacity auctions:– ISO-NE
– NY ISO
– PJM Interconnection
– Midcontinent ISO
4

Do Capacity MarketsSend a New-build Signal?
5
Do Capacity MarketsSend a New-build Signal?
6
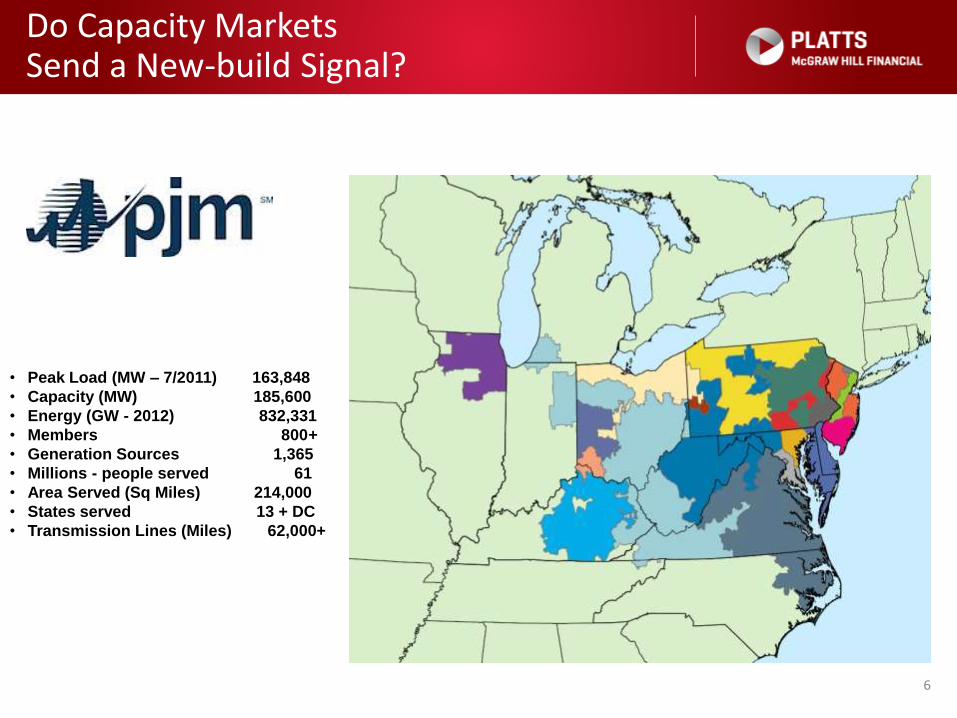
• Peak Load (MW – 7/2011) 163,848
• Capacity (MW) 185,600
• Energy (GW - 2012) 832,331
• Members 800+
• Generation Sources 1,365
• Millions - people served 61
• Area Served (Sq Miles) 214,000
• States served 13 + DC
• Transmission Lines (Miles) 62,000+
Do Capacity MarketsSend a New-build Signal?
7
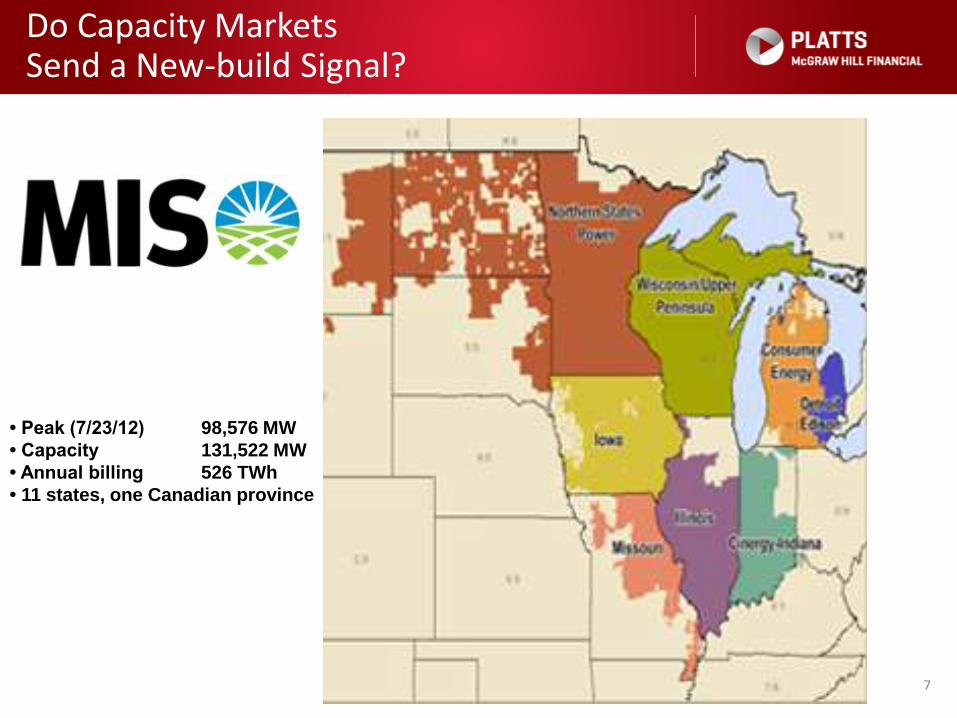
• Peak (7/23/12) 98,576 MW
• Capacity 131,522 MW
• Annual billing 526 TWh
• 11 states, one Canadian province

Do Capacity MarketsSend a New-build Signal?
8
• Peak demand (7/19/13) 33,956 MW
• Capacity 37,925 MW
• Transmission 11,005 miles
• Total power usage (2012) 162,842 GWh
• Peak demand (8/2/06) 28,130 MW
• Capacity 32,000 MW
• Generators 350
• Customers served 6.5 million
• RTO population 14 million
• Interconnections to N.Y., Canada 13
• High voltage transmission (miles) 8,000 miles
Do Capacity MarketsSend a New-build Signal?
• Distinctive features of capacity markets:
– Demand curves
– CONE (cost of new entry)
– Mitigation
9
Do Capacity MarketsSend a New-build Signal?
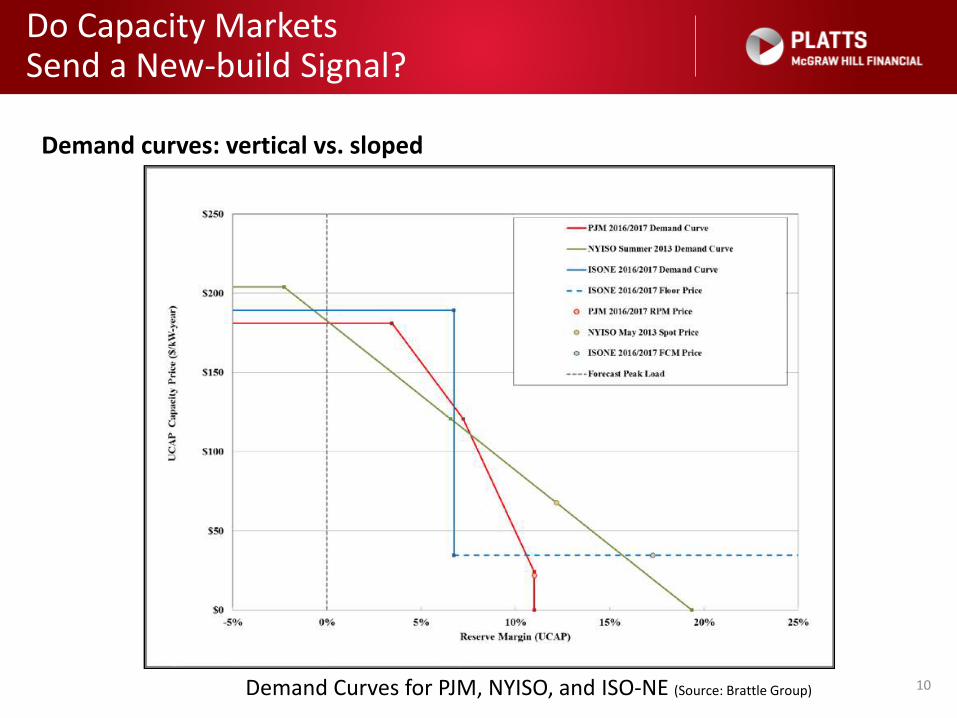
10Demand Curves for PJM, NYISO, and ISO-NE (Source: Brattle Group)
Demand curves: vertical vs. sloped
Do Capacity MarketsSend a New-build Signal?
• CONE
– The levelized capital costs and annual fixed O&M costs for a hypothetical gas-fired combustion turbine or combined-cycle unit in the delivery year for that capacity market.
11
Do Capacity MarketsSend a New-build Signal?
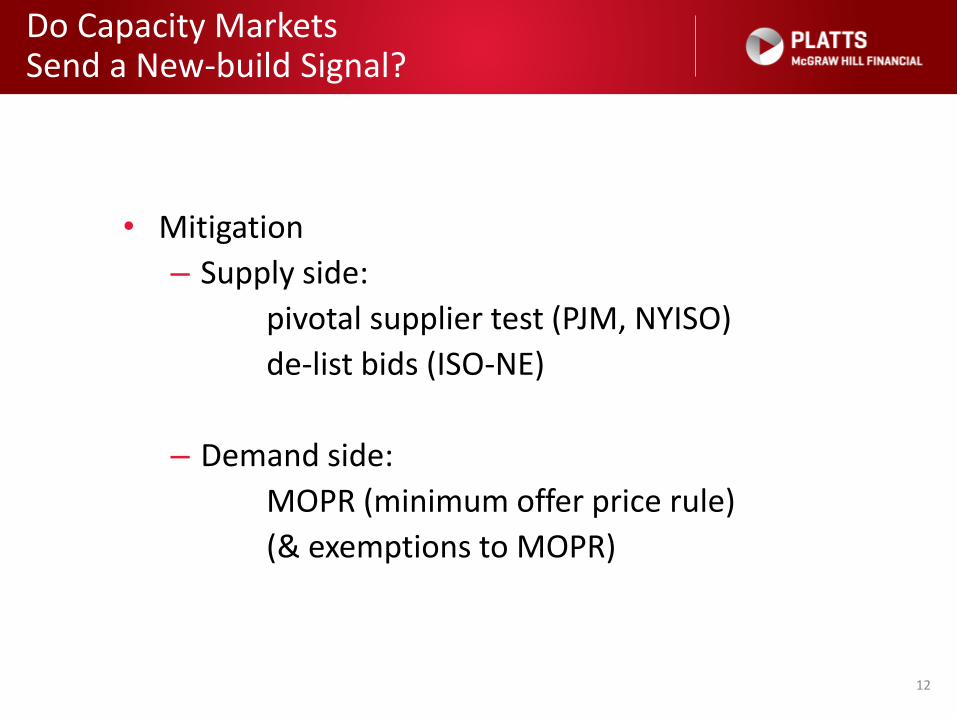
• Mitigation
– Supply side:
pivotal supplier test (PJM, NYISO)
de-list bids (ISO-NE)
– Demand side:
MOPR (minimum offer price rule)
(& exemptions to MOPR)
12
Do Capacity MarketsSend a New-build Signal?
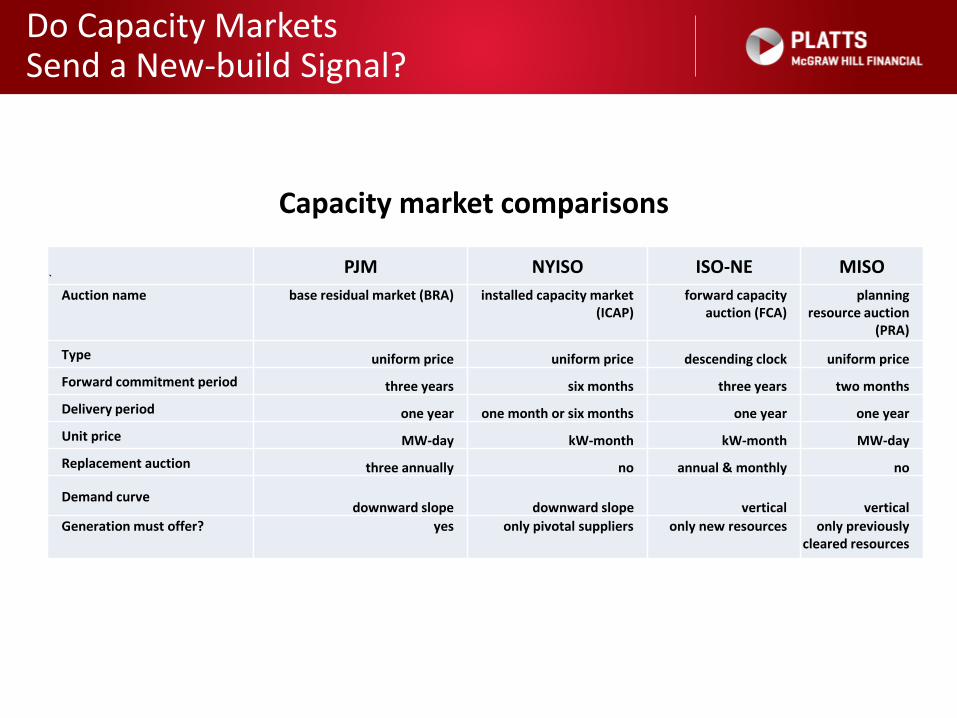
Capacity market comparisons
`PJM NYISO ISO-NE MISO
Auction name base residual market (BRA) installed capacity market (ICAP)
forward capacity auction (FCA)
planning resource auction
(PRA)
Type uniform price uniform price descending clock uniform price
Forward commitment period three years six months three years two months
Delivery period one year one month or six months one year one year
Unit price MW-day kW-month kW-month MW-day
Replacement auction three annually no annual & monthly no
Demand curvedownward slope downward slope vertical vertical
Generation must offer? yes only pivotal suppliers only new resources only previously cleared resources

Do Capacity MarketsSend a New-build Signal?
14
Capacity Clearing Prices in Each RTO and Select Sub-Regions for Commitment Periods between 2006 – 2017

Do Capacity MarketsSend a New-build Signal?
15
NERC 2013 Summer Reliability Report
NYISO MISO PJM ISO-NE
projected demand (MW) 33,279 91,532 145,029 26,690
anticipated resources (MW) 39,592 108,742 187,531 32,458
anticipated reserve (%) 18.8 18.8 29.3 21.6
NERC reference reserve (%) 17 14.2 15.9 15
Do Capacity MarketsSend a New-build Signal?
16
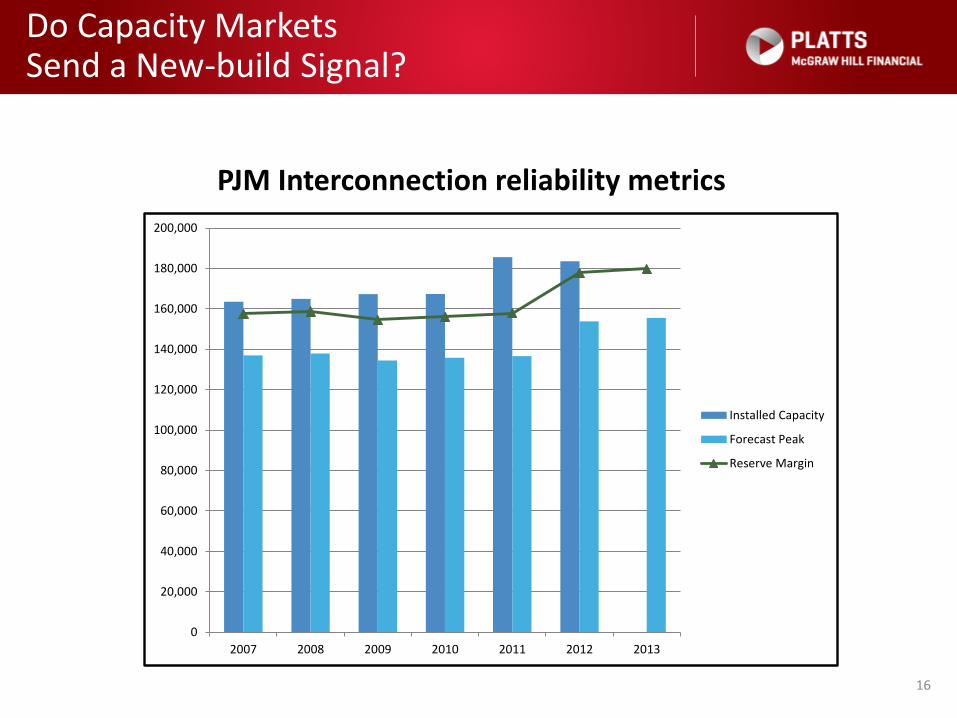
0
20,000
40,000
60,000
80,000
100,000
120,000
140,000
160,000
180,000
200,000
2007 2008 2009 2010 2011 2012 2013
Installed Capacity
Forecast Peak
Reserve Margin
PJM Interconnection reliability metrics
Do Capacity MarketsSend a New-build Signal?
17
0
5,000
10,000
15,000
20,000
25,000
30,000
35,000
40,000
45,000
2010 2011 2012 2013
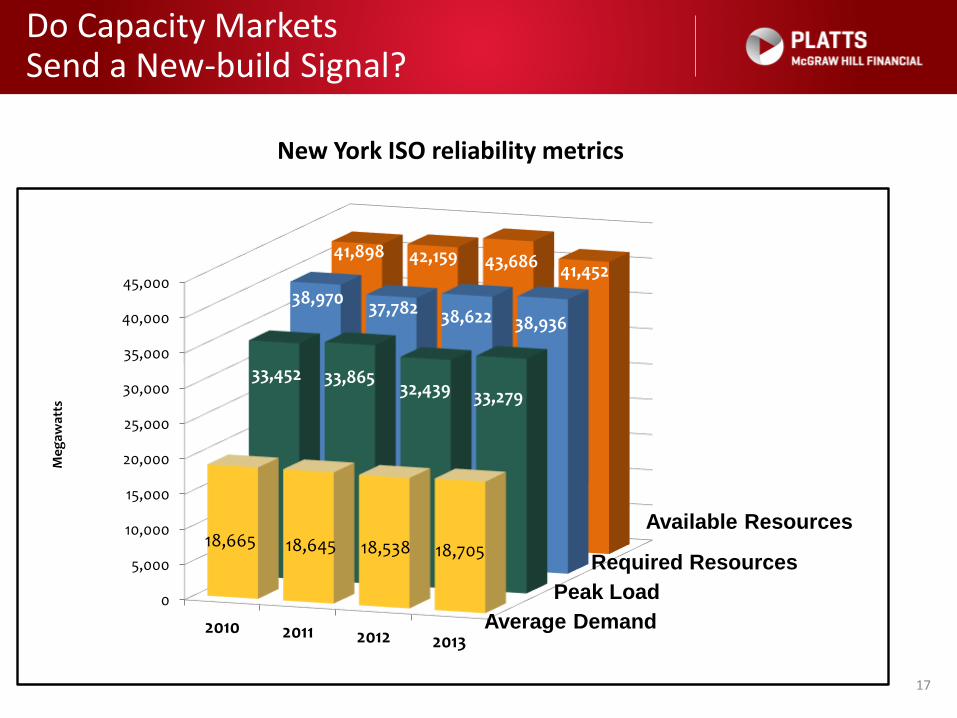
18,665 18,645 18,538 18,705
33,452 33,86532,439 33,279
38,97037,782 38,622 38,936
41,898 42,159 43,68641,452
Megaw
atts
Average Demand
Peak Load
Required Resources
Available Resources
New York ISO reliability metrics
Do Capacity MarketsSend a New-build Signal?
18
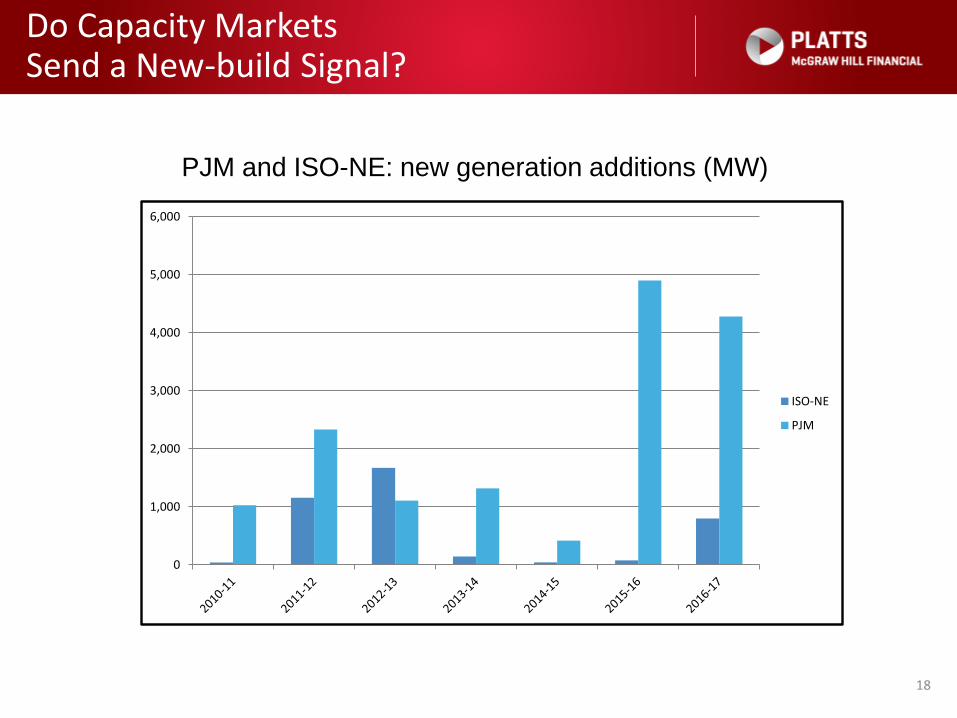
PJM and ISO-NE: new generation additions (MW)
0
1,000
2,000
3,000
4,000
5,000
6,000
ISO-NE
PJM
Do Capacity MarketsSend a New-build Signal?
19
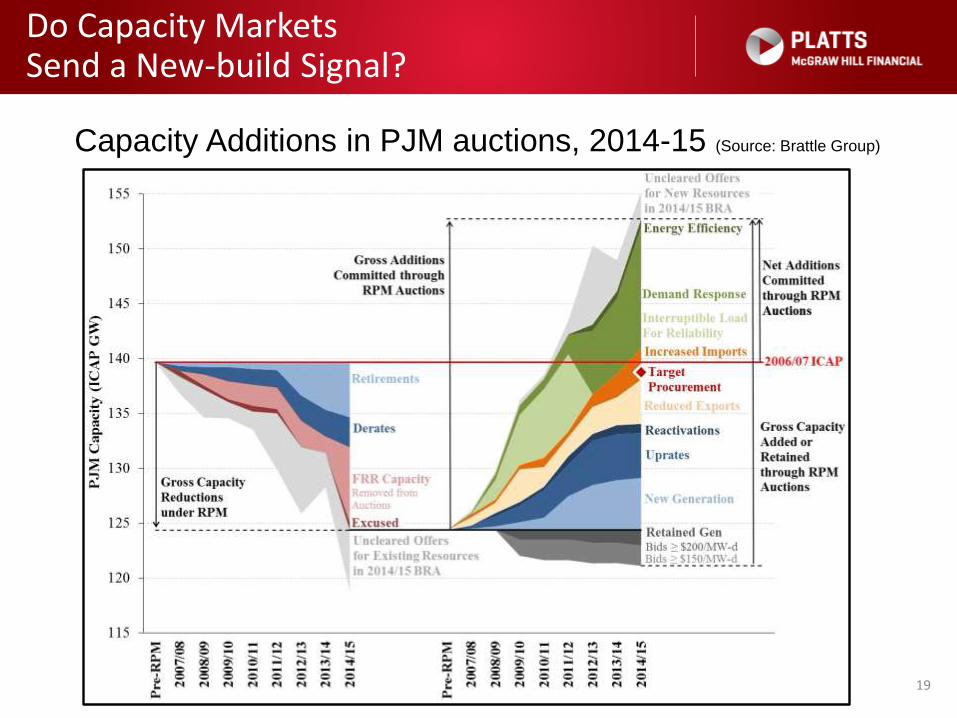
Capacity Additions in PJM auctions, 2014-15 (Source: Brattle Group)
Do Capacity MarketsSend a New-build Signal?
20
• PJM’s 2016-17 Base Residual Auction drove investment in:
– New generation
– Imports
– Retirements
– Demand Response
Do Capacity MarketsSend a New-build Signal?
21
0
20
40
60
80
100
120
140
160
180
200
2010-11 2011-12 2012-13 2013-14 2014-15 2015-16 2016-17
MW
-day
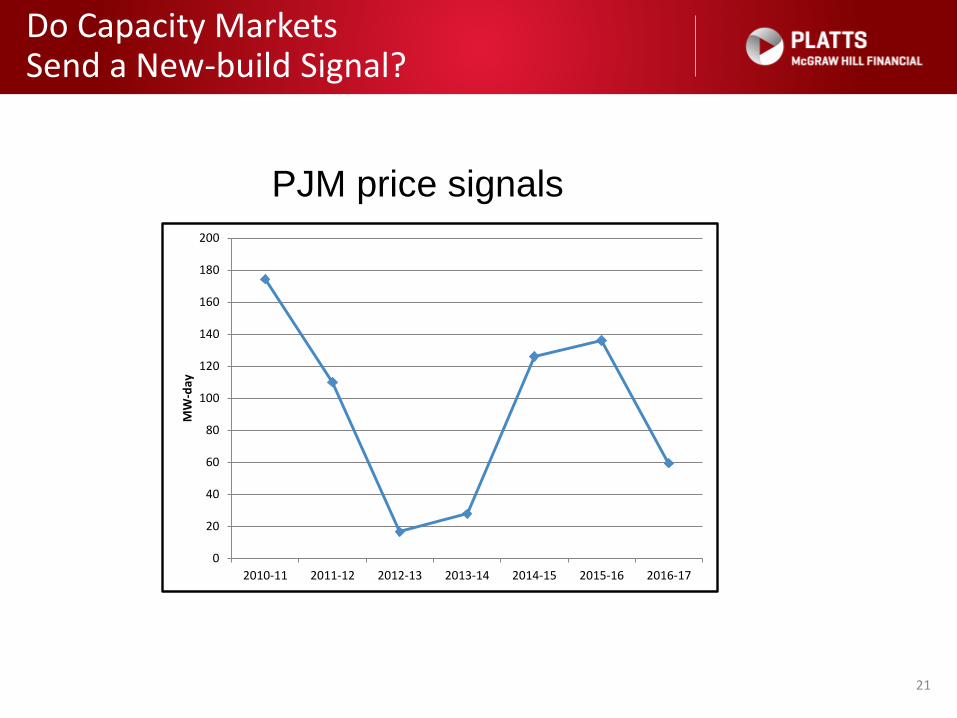
PJM price signals

Do Capacity MarketsSend a New-build Signal?
22
• Panda-Moxie Liberty 829 MW gas plant in Bradford County, Pennsylvania
• Based on $2/MMBtu nat. gas in Marcellus vs. $4/MMBtu at Henry Hub
New Generation
Generation Uprates
Imports Demand Response
Energy Efficiency
2016/2017 4,282 1,181 7,483 12,408 1,117
2015/2016 4,899 447 3,935 14,833 923
2014/2015 416 341 3,017 14,118 822
New generation in PJM’s 20116-17 BRA
Do Capacity MarketsSend a New-build Signal?
23
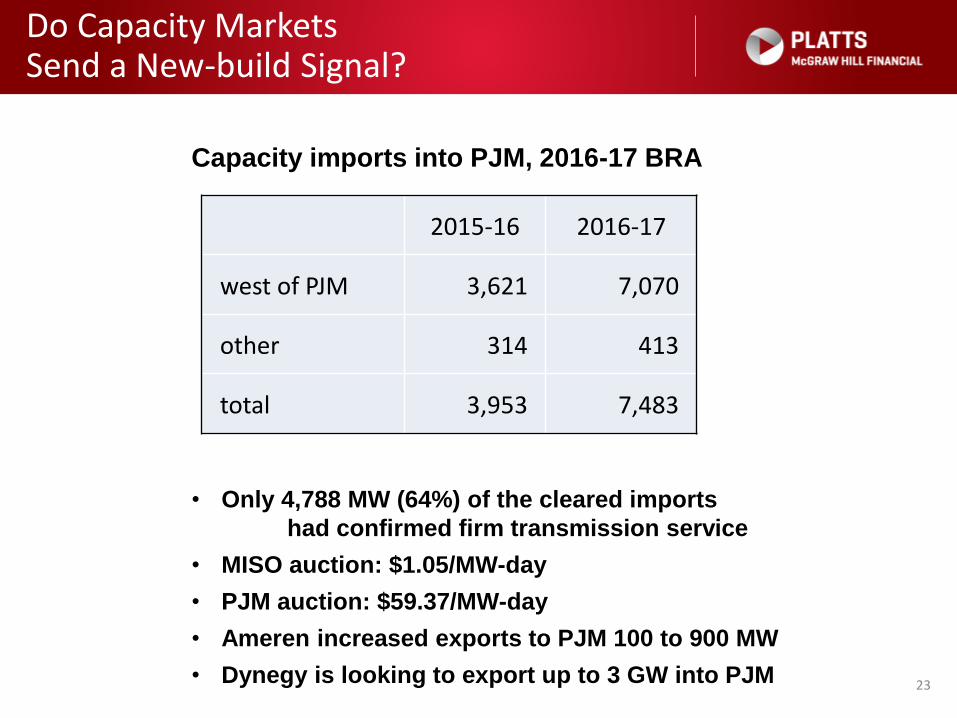
Capacity imports into PJM, 2016-17 BRA
2015-16 2016-17
west of PJM 3,621 7,070
other 314 413
total 3,953 7,483
• Only 4,788 MW (64%) of the cleared imports
had confirmed firm transmission service
• MISO auction: $1.05/MW-day
• PJM auction: $59.37/MW-day
• Ameren increased exports to PJM 100 to 900 MW
• Dynegy is looking to export up to 3 GW into PJM
Do Capacity MarketsSend a New-build Signal?
24
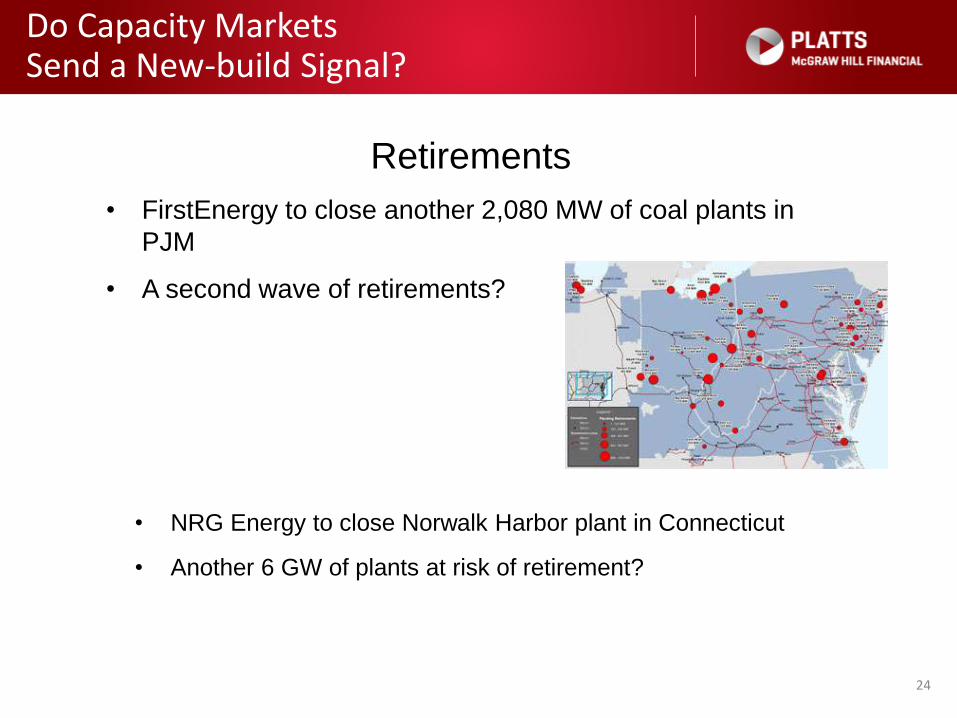
Retirements
• FirstEnergy to close another 2,080 MW of coal plants in
PJM
• A second wave of retirements?
• NRG Energy to close Norwalk Harbor plant in Connecticut
• Another 6 GW of plants at risk of retirement?
Do Capacity MarketsSend a New-build Signal?
25
• Issues facing capacity markets:
– Demand Response
– Gas-electric integration
– Imports
– Mitigation (MOPR)

Do Capacity MarketsSend a New-build Signal?
26
Issues: Demand response
• PJM is looking at changes to its demand curve
Do Capacity MarketsSend a New-build Signal?
27
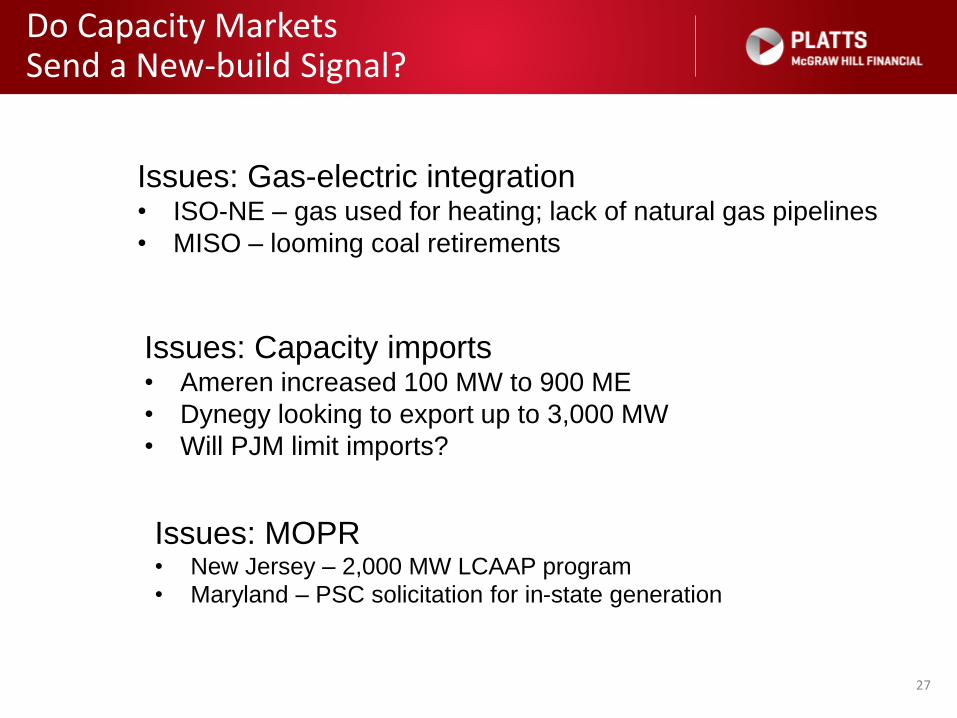
Issues: Gas-electric integration• ISO-NE – gas used for heating; lack of natural gas pipelines
• MISO – looming coal retirements
Issues: Capacity imports• Ameren increased 100 MW to 900 ME
• Dynegy looking to export up to 3,000 MW
• Will PJM limit imports?
Issues: MOPR• New Jersey – 2,000 MW LCAAP program
• Maryland – PSC solicitation for in-state generation
Do Capacity MarketsSend a New-build Signal?
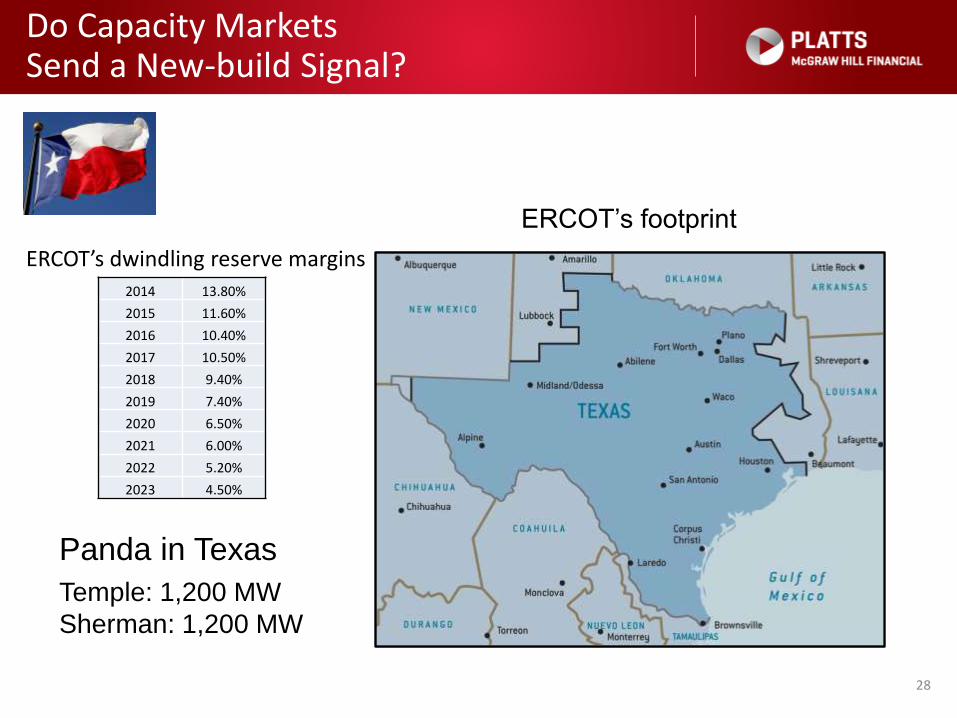
28
Panda in Texas
Temple: 1,200 MW
Sherman: 1,200 MW
ERCOT’s footprint
2014 13.80%
2015 11.60%
2016 10.40%
2017 10.50%
2018 9.40%
2019 7.40%
2020 6.50%
2021 6.00%
2022 5.20%
2023 4.50%
ERCOT’s dwindling reserve margins

© 2013 Platts, McGraw Hill Financial. All rights reserved.
Questions?