capillary pressure and rock wettability effects on wireline formation tester measurements.pdf
DESCRIPTION
the effects of capillary pressure and wettability of rock on wireline formation testerTRANSCRIPT

Copyright 1999, Society of Petroleum Engineers Inc.
This paper was prepared for presentation at the 1999 SPE Annual Technical Conference andExhibition held in Houston, Texas, 3–6 October 1999.
This paper was selected for presentation by an SPE Program Committee following review ofinformation contained in an abstract submitted by the author(s). Contents of the paper, aspresented, have not been reviewed by the Society of Petroleum Engineers and are subject tocorrection by the author(s). The material, as presented, does not necessarily reflect anyposition of the Society of Petroleum Engineers, its officers, or members. Papers presented atSPE meetings are subject to publication review by Editorial Committees of the Society ofPetroleum Engineers. Electronic reproduction, distribution, or storage of any part of this paperfor commercial purposes without the written consent of the Society of Petroleum Engineers isprohibited. Permission to reproduce in print is restricted to an abstract of not more than 300words; illustrations may not be copied. The abstract must contain conspicuousacknowledgment of where and by whom the paper was presented. Write Librarian, SPE, P.O.Box 833836, Richardson, TX 75083-3836, U.S.A., fax 01-972-952-9435.
AbstractWireline formation testers such as the well established RepeatFormation Tester (RFT) and the more recent ModularDynamics Tool (MDT) measure the pressure of thecontinuous phase present in the invaded region, which istypically drilling fluid filtrate. Conventional interpretationtechniques have often assumed this pressure identical to thepressure of the continuous phase in the virgin region of theformation, i.e., formation fluid pressure. As such, a series ofpressure measurements at different depths would be expectedto consistently yield a pressure gradient corresponding to thedensity of the formation fluid. More recent work has pointedout that this assumption cannot be entirely correct, otherwise itwould appear that most formation tester surveys areanomalous.
In reality, because the concepts of free fluid level, fluidcontacts, rock wettability, and pore fluid pressures are sointimately related, the measured tester pressure cannot besimply identical to formation pressure. Rather, it is differentfrom the formation fluid pressure by the amount of capillarypressure, which is itself mainly a function of the wetting phasesaturation. The effects of rock wettability and capillarypressure on wireline formation tester measurements are oftenmanifested in one or both of two ways:
1) Fluid level changes, which affect the position of the freewater level with respect to the fluid contacts determinedfrom other openhole logs.
2) Gradient changes, which affect the slope and scatter of the
gradient lines.
This paper explores the effects of capillary pressure andformation wettability on wireline formation testermeasurements and investigates ways of correcting orcompensating for these effects.
IntroductionWireline formation testers measure the pressure of drillingfluid filtrate, the continuous phase present in the invadedregion. According to conventional assumptions, this pressureis identical to the pressure of the formation fluid, implying thatthe wireline tester measurement is unaffected by the invasionprocess. Recent work has shown that many formation testersurveys cannot be explained if these assumptions were true. Inreality, the concepts of free fluid level, fluid contacts, rockwettability, and pore fluid pressures are so intimately relatedthat the measured tester pressure cannot be simply identical toformation pressure. This paper explores the effects of capillarypressure and formation wettability on formation testermeasurements, as manifested in fluid level and/or gradientchanges, and investigates ways of attempting to correct forthese effects.
Uses of formation pressure measurementsFormation pressure measurements in a virgin reservoir providea wealth of information about that reservoir. They areimportant in supplementing data unattainable from seismicsurveys, cores, conventional logs, and geological studies,hence helping to develop a static model of the reservoir. Thedistribution of formation pressure across a hydrocarbonreservoir and across its associated sedimentary basin providesinvaluable insights into their history, structure, as well asformation and fluid characteristics. Pressure gradients identifyproducible fluid by determining fluid densities and locatingfluid contacts.
Fluid density controls to a large extent the distribution offluids in the reservoir. This allows the use of pressure gradientmeasurements for fluid identification and for the location ofreservoir fluid contacts. In thick reservoirs, density variations
SPE 56712
Capillary Pressure and Rock Wettability Effects on Wireline Formation TesterMeasurements
H. Elshahawi, SPE and K. Fathy, SPE, Schlumberger Oilfield Services, and S. Hiekal, SPE, IEOC

2 H. ELSHAHAWI, K. FATHY, S. HIEKAL SPE 56712
may be discernable within the same reservoir. This may occurfor light crudes, which are often near-critical temperatures andpressures, or for heavy crudes, which have high wax andasphaltene content. The lack of chemical equilibrium inreservoirs affected by recent fluid migration can also lead topressure profile alterations. When barriers to vertical flowexist, the vertical pressure gradients will exhibit step-wisechanges, and when virgin pressures change radically betweentwo nearby wells, these two wells are likely situated indifferent reservoir compartments. If, on the other hand, virginreservoir pressures show fluid pressures that are abnormallyhigh or low, one can conclude that past uplift or erosion musthave occurred.
In the more complex case of a developed reservoir, formationpressures can also yield a lot of information. The reservoir-pressure distribution changes after some oil has beenwithdrawn. The fluid production causes a pressure droparound the wellbore and a gradual decrease of pressurethroughout the reservoir. The pressure disturbance propagatesfaster through the thinner, more permeable layers stoppingwhen it reaches impermeable faults or boundaries. As such,this pressure drop can be used to further our understanding ofthe reservoir’s structure by providing a way of zoning thereservoir into different layers. Since pressure is, in essence, ameasure of the potential energy used to drive fluid movementsin the reservoir, reservoir pressure measurements can providean estimate of aquifer or gas cap support. Moreover, becausepressure differences are enhanced by production, reservoirheterogeneities not detected by virgin formation pressuremeasurements may be clearly revealed by post-productionpressure measurements. Such is the case for alternating layersof high and low permeability, which should exhibit differentialdepletion rates.
DefinitionsIn an oil reservoir, water will normally compete with oil andgas for pore space. This is because water was present in thepores before oil migrated into the reservoir. Thus, at the samedepth in a formation, pressures will be different depending onwhether oil or water is filling the pores. The amount ofpressure difference between the two fluids is largely controlledby pore geometry, rock wettability and the interplay ofinterfacial tensions between rocks and fluids.
Before proceeding on to a more detailed discussion of theeffects of wettability and capillary pressure on formationpressure measurements, some definitions may be handy.
Wettability is the preferential affinity of the solid matrix foreither the aqueous or oil phases. It can also be defined as thetendency for one fluid to spread on or adhere to a solid surfacein the presence of other immiscible fluids. It is normallyquantified by the value of the contact angle, such that a valueless than 90 degrees indicates a water-wet system, and a valuegreater than 90 degrees indicates an oil-wet system.
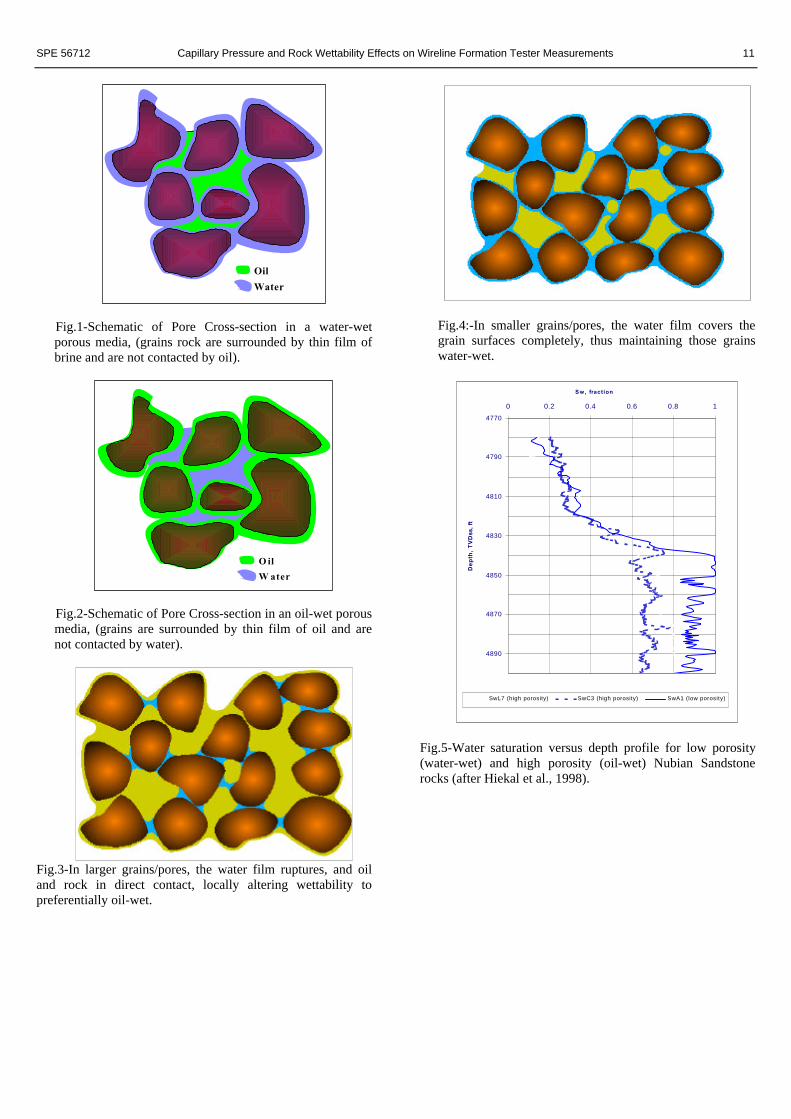
Wettability is an important petrophysical parameter, whichaffects saturation and recovery. Fig.1 shows the situation thatwould occur if the rock had a preference for being water-wet,wherein an isolated droplet of oil is being squeezed from alldirections by water. As a result, the pressure of the oilbecomes higher than that of the surrounding water by anexcess amount termed capillary pressure. On the other hand, ifa rock is preferentially oil-wet, the reverse occurs, with the oilbeing the continuous phase and the pressure being higher inthe water. Fig.2 shows how the surrounding oil in an oil-wetrock squeezes the water droplets from all directions.
Capillary pressure (Pc) is the excess pressure seen by thenon-wetting phase. It is defined the following equation:
Pc = Pnonwetting phase- Pwetting phase……………………………………...…………(1)
The value of capillary pressure is dependent on the saturationof each phase, on which phase is the continuous phase, and onthe shape and size of the pores and pore throats.
Displacement pressure (PD) is the threshold or entry capillarypressure needed for the non-wetting phase to displace thewetting phase from the largest pores.
Drainage is a process in which the wetting phase saturationdecreases and the non-wetting phase saturation increases.
Imbibition is process in which the wetting phase saturationincreases and the non-wetting phase saturation decreases.
The Free water level (FWL) in a reservoir is the level atwhich the oil-water capillary pressure vanishes. It is the oil-water interface that would exist at equilibrium in anobservation borehole, free of capillary effects, if it were to bedrilled in the porous medium and filled with oil and water.
The Oil-water contact (OWC) is the level at which thehydrocarbon saturation starts to increase from some minimumsaturation. In a water-wet rock, that minimum saturation isessentially zero.
The residual oil saturation (Sor) is the oil saturation levelabove which the oil starts to be moveable.
The connate or irreducible water saturation (Swc) is thewater saturation level below which the water becomesimmovable.
Supercharging is a phenomenon that leads to measurement ofa formation pressure that is higher than actual, leading toscattered pressure profiles or to altered gradients. The degreeof supercharging is generally inversely related to permeability.

SPE 56712 Capillary Pressure and Rock Wettability Effects on Wireline Formation Tester Measurements 3
Wettability of a porous mediumOne of the fundamental pieces of information required forefficient design of oil recovery processes is the reservoirwettability. Wettability has been the subject of much researchfor the last 60 years for its effects on capillary pressure,relative permeability, electrical properties, water cutproduction, waterflood behavior, and enhanced recovery. Thisis because wettability determines the fluid distribution in aporous medium. The wetting fluid coats the surface of thesolid grains, occupies the corners of grain contacts and residesin the smaller pores. In order to minimize the system’s specificsurface free energy, the wetting phase occupies the smallpores, which have high specific surface area. On the otherhand, the non-wetting phase is stays in the center of the poresand is concentrated in the larger pores.
Oil-wet and mixed-wet reservoirs, once considered ararity, have been found by several researchers to form half ormore of all reservoirs (Chiligarian and Chen, 1983). In theirnatural state, rocks may be either water-wet or oil-wetaccording to the atoms exposed in the grain or pore surface.Naturally water-wet rocks include quartz, calcite, anddolomite, while naturally oil-wet rocks include coal, sulfur,and some silicates. In the case of rocks, which tend to bewater-wet, they become thus when the oxygen atoms exposedat their surfaces attract hydrophilic hydrogen from the watermolecules. If polar impurities such as resins or asphaltenes canreach the surface, they will substitute lipophilic radicals for theH or OH, rendering the surfaces oil-wet. Note that while onlybasic impurities will attach to quartz, both basic and acidicimpurities can attach to calcite. This might explain the largepercentage of carbonate reservoirs found by severalresearchers to be oil-wet (Treibel et al, 1972). In their study of155 carbonate reservoirs worldwide, Chillinger et al found that65% are moderately to strongly oil-wet (contact angles 100-160). Oil wettability can be artificially induced by treating thesurface of the pores with substances that bond to the surfacesand render them oil-wet, such as chlorosilane compounds.
Increased surface roughness tends to make the water-wetrocks even more water-wet, while making the oil-wet rocksstill more oil-wet. As most rock surfaces are rugose, fewformations are neutrally wet, but some researchers havereported fractional wettability conditions, in which someportions of the rock are strongly oil-wet and others stronglywater-wet (Brown et al, 1956). Salathiel, in his landmark 1972work, identified mixed wettability reservoirs in which thepolar impurities reach the larger but not the smaller pores,resulting in a case wherein the larger pores (higher porosity)become oil-wet, the smaller pores (lower porosity) remainwater-wet, and both remain continuously connected. As shownin his core flood experiments, mixed-wet rock exhibited a verylow residual oil saturation but slow oil production rates atthese low saturation.
Consistent with Salathiel’s vision of continuous oil andwater phases, Hiekal et al. have hypothesized thatconfigurations of oil in pores involve either direct contactbetween oil and rock in the larger grains and pores (Fig.3); orseparation of the oil phase from the solid by aqueous films inthe smaller grains and pores (Fig.4). In the larger grains andpores, the oil saturation is highest. When a critical capillarypressure is exceeded, water films destabilize and rupture to anadsorbed molecular film of up to several water mono-layers.Crude oil now contacts rock directly, allowing the polar oilspecies to adsorb and/or deposit onto the rock. It is thisprocess that locally reverses the wettability of certain sectionsof the rock from water-wet to oil-wet (Morrow, 1991).
Wettability effects on saturation in a mixed-wetreservoir-Example of a mixed-wet reservoirThe Nubian Sandstone reservoir in the Zeit Bay field, locatedoffshore the Gulf of Suez, Egypt is a vivid example of mixed-wet reservoirs, which was used in this work to investigate theeffects of wettability and capillarity on formation pressuremeasurements. It is a fine to coarse-grained sandstonereservoir deposited on the lapping wedge of a tilted erodedbasement block. Ranging in thickness from nil to 600 ft-TVT,the Nubian Sandstone is a highly productive reservoir withaverage porosity and connate water saturation of 19% and13%, respectively. Exhibiting high average horizontalpermeability is 400md and a Kv/Kh ratio close to unity, thereservoir has been proven to be in complete hydrauliccommunication, showing the same pressure trends all across.(Hiekal et al., 1998).
The mixed wettability condition was deemed consistentwith reservoir features found in the Nubian Sandstonereservoir of the Zeit Bay field. The high oil saturations (up to30%) found below the OOWC in wells A1, C3 and L7 (Fig.5),and the very low connate water saturation level (less than 6%)found in some rock types suggest that some of the pore systemis oil-wet. Another phenomenon that supports this hypothesisis that significant oil saturations were found at depths belowthe original OWC (OOWC) in high porosity intervals.Although this oil may represent a paleo-residual zone formedby leakage of oil prior to discovery of the field, there are no oilseeps at the surface above the oil accumulation to support thisview. On the other hand, water saturation versus depth profilesfor low and moderate porosity intervals do not show anymoveable oil below the OOWC, contrary to what would beexpected if oil seepage were the source of this residual oil. Forexample, moveable oil was detected at a depth of 5,100 ft-TVDss in well L7, which is 265 ft-TVT below the OOWC(Fig.6). In fact, wherever the porosity is greater than 19%(between the depths of 4,835 ft-TVDss and 5,100 ft-TVDss),oil is found indicating oil-wet rock. In contrast, whereverporosity is less than 19% (depths below 5,100 ft-TVDss), verylittle oil can be found indicating water-wet rock. (Hiekal,1998).

4 H. ELSHAHAWI, K. FATHY, S. HIEKAL SPE 56712
A mixed wettability condition would explain the foregoingobservations. As oil accumulated in the reservoir, waterpresent in the initially water-wet rock was displaced from thelarger pores while capillary forces retained water in smallercapillaries and at grain contacts. After extended periods ofexposure to this fluid distribution, the required conditions formixed-wettability developed. As the oil saturation in the largerpore increased, the capillary pressure rose, and when a criticalcapillary pressure was exceeded, the water films destabilizedand ruptured to adsorbed molecular films of up to severalwater mono-layers, allowing crude oil to contact the rockdirectly. This, in turn, allowed the organic surface-activeagents to adsorb and/or deposit onto the rock surfaces in thelarger pores, thus reversing the native wettability of the higherporosity rock from water-wet to oil-wet. On the basis of thismodel, the high porosity system within the Nubian Sandstonecan be considered to be oil-wet while the lower porositysystem can be considered to be water-wet (Hiekal et al., 1998).
The water connate water saturation, measured 100 ft-TVDabove the OOWC (i.e., above the transition zone), was takenas another indication of wettability. The relationship betweenporosity and connate water saturation was based on multiplewell log data. Fig. 7 shows that two distinct systems exist;with the high porosity system having a very low connate watersaturation (as low as 4%) as would be expected in an oil-wetsystem; and the low porosity system having a higher connatewater saturation of up to 25% as would be expected in a water-wet system. This again confirms that the low porosity systemin the Nubian Sandstone is preferentially water-wet while thehigh porosity system is preferentially oil-wet (Hiekal et al.,1998).
Capillary pressure in a porous mediumThe combined effects of wettability and interfacial tensioncause the wetting fluid to be simultaneously imbibed into acapillary tube. This phenomenon is known as capillarity and issignificant in a porous medium saturated with two or moreimmiscible fluids since the interconnected pores of themedium are of capillary dimensions. As defined earlier,capillary pressure represents the pressure differential that mustbe applied to the nonwetting fluid in order to displace awetting fluid. For the capillary tube, an often used yetadmittedly simplistic representation of a pore throat, capillarypressure can be expressed as:
Pc = Pnw – Pw = 2σ cosθ/r = (ρw-ρnw)gh…………………….(2)
Where σ is the interfacial tension between the two fluids,θ represents the wettability of the capillary tube, r is the radiusof the capillary tube, Pw, Pnw are the pressures of the wettingand non-wetting phases, respectively, and ρw and ρnw are thewetting and non-wetting phase densities, respectively.
For a pendular ring at the contacts of two spherical sandgrains in an idealized porous medium consisting of a cubic
pack of uniform spheres (Fig. 8), the capillary pressure ingeneral, can be expressed by the Laplace equation (Eq.3). Thisis a more general expression for the pressure difference acrossthe curved interface between two immiscible fluids, with thepressure on the concave side greater than that on the convexside. In fact the capillary tube expression is a special case ofthe Laplace equation, which can be expressed as follows:
Pc= σ (1/r1 + 1/r2)…………………………………………...(3)
Where r1 and r2 are the two principal radii of curvatures ofthe interface in two perpendicular planes as shown on Fig 8.According to the figure and the Laplace equation, as thewetting fluid saturation in the pendular ring is increased, theradii of curvature will be increased, and the capillary pressurewill decrease. Vice versa, as the wetting fluid saturation in thependular ring is reduced, the radii of curvature will be reducedand the capillary pressure will increase. Of course, for anactual porous medium, the complexity of the pore structureand the fluid interface arrangements therein precludes the useof the above equation directly to calculate the capillarypressure. Instead, the capillary pressure is measuredexperimentally as a function of the wetting fluid saturation.Still, in general, the mean radius of curvature and thecapillary pressure increase as the wetting phase saturationdecreases. This can be expressed in the general form below:
Pc = fn(Sw) ∝ σ/rm…………………………………………...(4)
Where rm represents the mean radius of curvature.
The capillary pressure curve of a porous mediumThe capillary pressure curve for a porous medium is a functionof pore size, pore size distribution, pore geometry, fluidsaturation, fluid saturation history or hysterisis, wettability,and interfacial tension. Fig.9 shows drainage and imbibitioncapillary pressure curves. The drainage capillary pressurecurve describes the displacement of the wetting phase from theporous medium by a non-wetting phase, as is relevant for theinitial fluid distribution in a water-wet reservoir as well as forthe water front advance in an oil-wet reservoir. The imbibitioncapillary pressure curve, on the other hand, describes thedisplacement of a non-wetting phase by the wetting phase, asis relevant for water front advance in a water-wet reservoir. Inboth cases, the capillary pressure is equal to the non-wettingphase pressure minus the wetting phase pressure as given byEq.2.
The capillary pressure curve has several characteristicfeatures. Focusing on the drainage curve and describing it inmore detail, one finds that the minimum threshold pressure isthe displacement pressure that must be applied to the wettingphase in order to displace the non-wetting phase from thelargest pore connected to the surface of the medium such that:
Pc)Displacemnet = (Pnw – Pw)displacement = 2σ cosθ/rLargest pore……...(5)
SPE 56712 Capillary Pressure and Rock Wettability Effects on Wireline Formation Tester Measurements 5
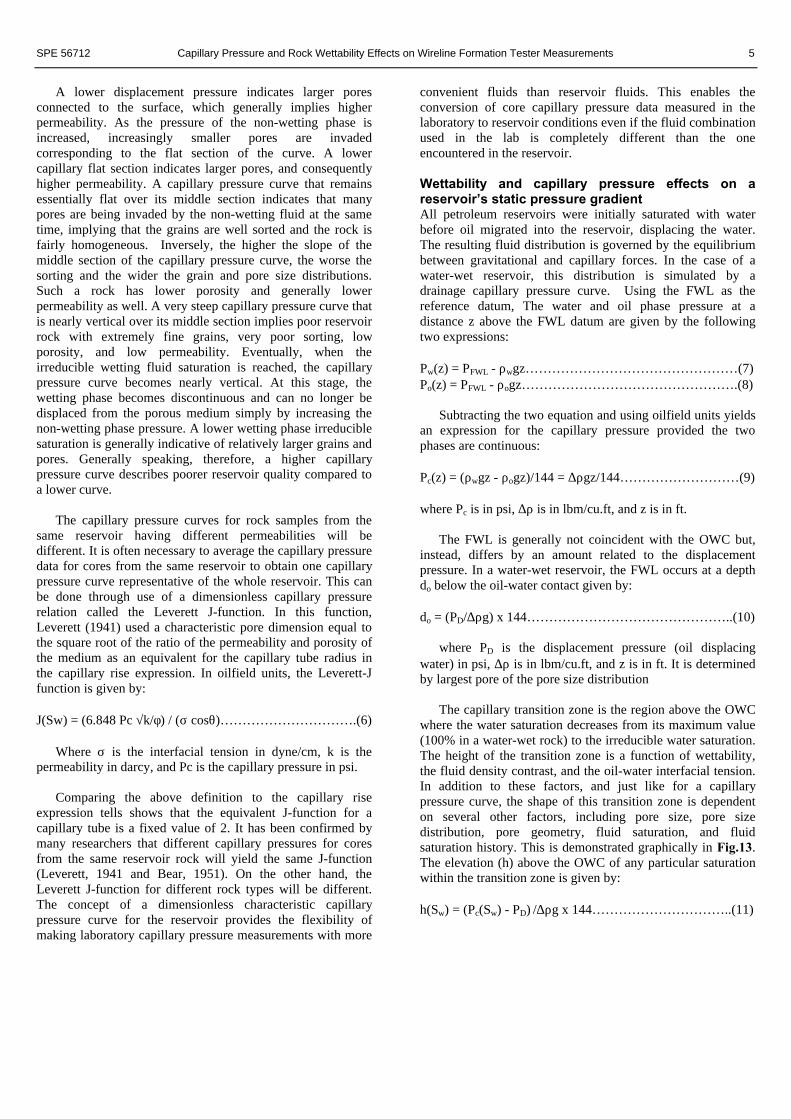
A lower displacement pressure indicates larger poresconnected to the surface, which generally implies higherpermeability. As the pressure of the non-wetting phase isincreased, increasingly smaller pores are invadedcorresponding to the flat section of the curve. A lowercapillary flat section indicates larger pores, and consequentlyhigher permeability. A capillary pressure curve that remainsessentially flat over its middle section indicates that manypores are being invaded by the non-wetting fluid at the sametime, implying that the grains are well sorted and the rock isfairly homogeneous. Inversely, the higher the slope of themiddle section of the capillary pressure curve, the worse thesorting and the wider the grain and pore size distributions.Such a rock has lower porosity and generally lowerpermeability as well. A very steep capillary pressure curve thatis nearly vertical over its middle section implies poor reservoirrock with extremely fine grains, very poor sorting, lowporosity, and low permeability. Eventually, when theirreducible wetting fluid saturation is reached, the capillarypressure curve becomes nearly vertical. At this stage, thewetting phase becomes discontinuous and can no longer bedisplaced from the porous medium simply by increasing thenon-wetting phase pressure. A lower wetting phase irreduciblesaturation is generally indicative of relatively larger grains andpores. Generally speaking, therefore, a higher capillarypressure curve describes poorer reservoir quality compared toa lower curve.
The capillary pressure curves for rock samples from thesame reservoir having different permeabilities will bedifferent. It is often necessary to average the capillary pressuredata for cores from the same reservoir to obtain one capillarypressure curve representative of the whole reservoir. This canbe done through use of a dimensionless capillary pressurerelation called the Leverett J-function. In this function,Leverett (1941) used a characteristic pore dimension equal tothe square root of the ratio of the permeability and porosity ofthe medium as an equivalent for the capillary tube radius inthe capillary rise expression. In oilfield units, the Leverett-Jfunction is given by:
J(Sw) = (6.848 Pc √k/φ) / (σ cosθ)………………………….(6)
Where σ is the interfacial tension in dyne/cm, k is thepermeability in darcy, and Pc is the capillary pressure in psi.
Comparing the above definition to the capillary riseexpression tells shows that the equivalent J-function for acapillary tube is a fixed value of 2. It has been confirmed bymany researchers that different capillary pressures for coresfrom the same reservoir rock will yield the same J-function(Leverett, 1941 and Bear, 1951). On the other hand, theLeverett J-function for different rock types will be different.The concept of a dimensionless characteristic capillarypressure curve for the reservoir provides the flexibility ofmaking laboratory capillary pressure measurements with more
convenient fluids than reservoir fluids. This enables theconversion of core capillary pressure data measured in thelaboratory to reservoir conditions even if the fluid combinationused in the lab is completely different than the oneencountered in the reservoir.
Wettability and capillary pressure effects on areservoir’s static pressure gradientAll petroleum reservoirs were initially saturated with waterbefore oil migrated into the reservoir, displacing the water.The resulting fluid distribution is governed by the equilibriumbetween gravitational and capillary forces. In the case of awater-wet reservoir, this distribution is simulated by adrainage capillary pressure curve. Using the FWL as thereference datum, The water and oil phase pressure at adistance z above the FWL datum are given by the followingtwo expressions:
Pw(z) = PFWL - ρwgz…………………………………………(7)Po(z) = PFWL - ρogz………………………………………….(8)
Subtracting the two equation and using oilfield units yieldsan expression for the capillary pressure provided the twophases are continuous:
Pc(z) = (ρwgz - ρogz)/144 = ∆ρgz/144………………………(9)
where Pc is in psi, ∆ρ is in lbm/cu.ft, and z is in ft.
The FWL is generally not coincident with the OWC but,instead, differs by an amount related to the displacementpressure. In a water-wet reservoir, the FWL occurs at a depthdo below the oil-water contact given by:
do = (PD/∆ρg) x 144………………………………………..(10)
where PD is the displacement pressure (oil displacingwater) in psi, ∆ρ is in lbm/cu.ft, and z is in ft. It is determinedby largest pore of the pore size distribution
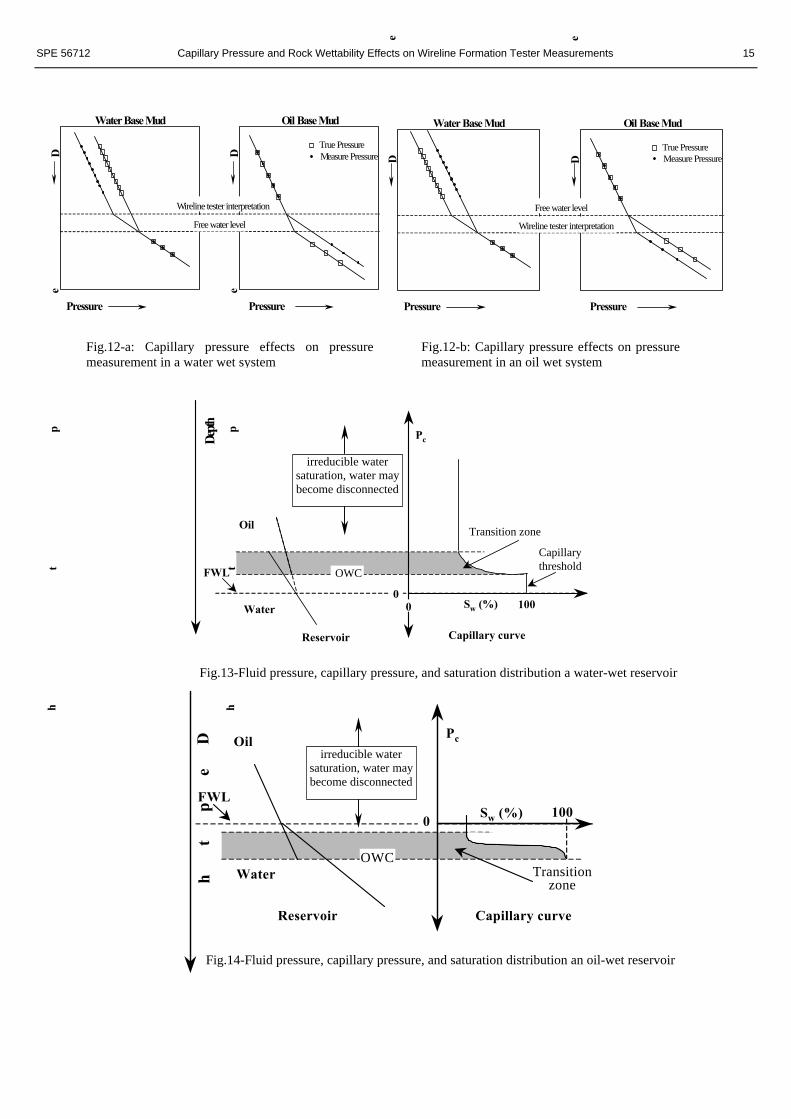
The capillary transition zone is the region above the OWCwhere the water saturation decreases from its maximum value(100% in a water-wet rock) to the irreducible water saturation.The height of the transition zone is a function of wettability,the fluid density contrast, and the oil-water interfacial tension.In addition to these factors, and just like for a capillarypressure curve, the shape of this transition zone is dependenton several other factors, including pore size, pore sizedistribution, pore geometry, fluid saturation, and fluidsaturation history. This is demonstrated graphically in Fig.13.The elevation (h) above the OWC of any particular saturationwithin the transition zone is given by:
h(Sw) = (Pc(Sw) - PD) /∆ρg x 144…………………………..(11)

6 H. ELSHAHAWI, K. FATHY, S. HIEKAL SPE 56712
In a layered reservoir, in which layers have differentcapillary pressure curves, the layers must remain in capillarypressure equilibrium on either side of layer boundaries. As aresult, saturation discontinuities will occur, but there will beonly one FWL.
In an oil-wet reservoir (Fig.14), the situation describedabove is slightly different. In this case, it is the water that isthe non-wetting phase, and hence, its pressure is higher than itwould be in a water-wet medium. Even though the reservoirwas initially saturated with water before oil migrated into thereservoir and displaced the oil, an imbibition capillarypressure curve, rather than a drainage curve better describesthe situation once the reservoir has become preferentially oil-wet reservoir. As an imbibition curve would predict, theminimum oil saturation encountered below the zero capillarypressure line is not zero, but rather a residual value, Sor. Sinceit is easier to displace water than oil in this case, the portion ofthe capillary pressure curve below the zero line (correspondingto the FWL) is larger than the part above. Consequently, heOWC in this case is the lowest level that the oil will reach (atwhich the oil saturation will start to increase from itsminimum value). The FWL is located above the OWC by adistance do given by:
do = (PD/∆ρg) x 144………………………………………(12)
which is generally larger than the equivalent distance in awater-wet rock. Also unlike for a water-wet reservoir, thisdistance is determined by the smallest-rather than the largest-pore of the pore size distribution.
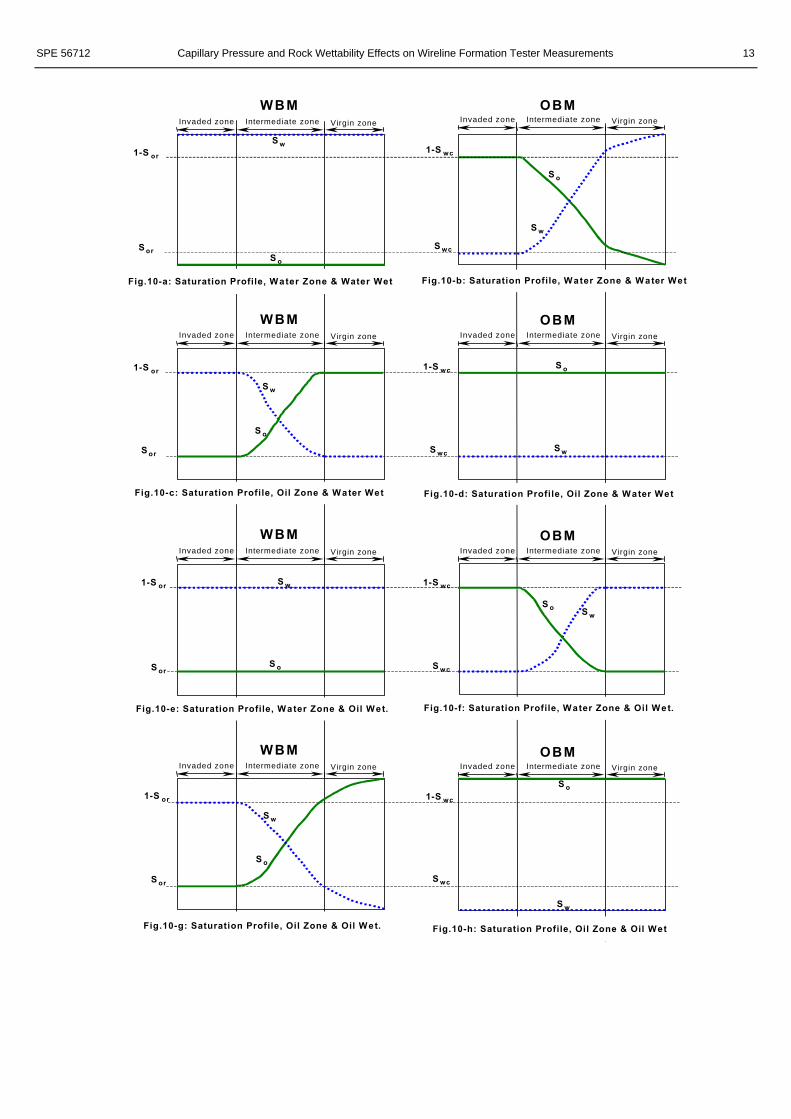
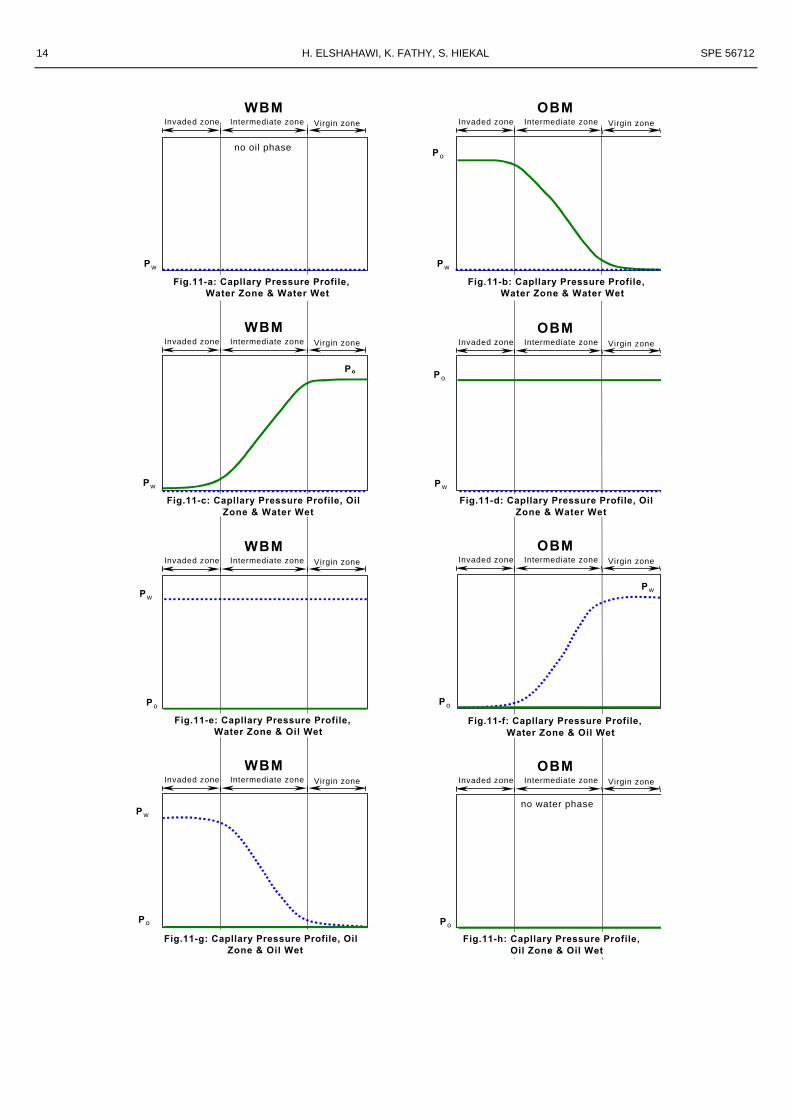
Wettability and capillary pressure effects on testergradient measurementsFrom the foregoing discussion, it is clear that a capillarypressure difference will exist between the oil and water in thecapillary transition zone by virtue of the very existence of thattransition zone. Despite this, and despite the fact that the toolactually draws mud filtrate into its small test chamber(s),conventional formation tester interpretation methods assumethat the tool measures the true formation pressure of thecontinuous mobile formation fluid in the virgin zone. Thefallacy of this assumption is made clear by examining Fig.10(a to h), which details the saturation profile for variouswetting fluid-drilling mud-formation fluid combinations,Fig.11(a to h), which details the capillary pressure distributioncorresponding to each combination, and Fig.12(a and b),which details the effect of these combinations on the wirelinepressure tester gradient measurements.
For a well drilled with water-based mud in a water-wetformation, the oil in the flushed zone of an oil-bearing interval(Fig.10-c) is close to residual saturation so that the capillarypressure in the invaded zone becomes small (Fig.11-c). Theresult is that the water-phase pressure actually measured isonly marginally lower than the oil phase pressure that we
desire to measure, shifting the oil gradient slightly to the left(top of left plot of (Fig.12-a)). In the water-bearing interval(Fig.11-a), there will be no capillary pressure differencebetween the mud filtrate and the formation water, and the toolmeasures the true formation pressure (Fig.11-a) and (bottomof left plot of (Fig.12-a)).
For a well drilled with oil-based mud in a water-wetformation, there is no capillary pressure difference betweenthe mud filtrate and the formation oil in an oil-bearinginterval, so the tool measures the actual formation gradient(Fig.10-d), (Fig.11-d) and by The formation tester over-estimates the value of the true formation gradient by In thewater-bearing zone (Fig.10-b), the water saturation in theinvaded zone is close to connate or irreducible, and thecapillary pressure is large (Fig.11-b). The value of the oilpressure actually measured is thus higher than the waterpressure that is desired by Pc(Swc). The measured watergradient is thus shifted to the right (bottom of right plot of(Fig.12-a)). In a gas reservoir drilled with oil-based mud, thepressure measured in the water zone is similarly boosted by anamount equal to the capillary pressure. The situation is furthercomplicated by the existence of three phases but can besimplified by treating the water and oil as a single wettingphase and the gas as the non-wetting phase which controls thecapillary pressure. In the invaded zone, however, gassaturations are normally close to residual levels, and thecapillary pressure is nearly nil, so the capillary effect on thepressure measurement can be safely neglected.
For a well drilled with water-based mud in an oil-wetformation, the oil in the flushed zone of an oil-bearing intervalis close to residual saturation (Fig.10-g), and the capillarypressure is maximum (Fig.11-g). The measured water phasepressure is higher than the oil phase pressure by the amount ofPc(Sor). The formation tester thus over-estimates the value ofthe true formation pressure, shifting the oil gradient line to theright (top of left plot of (Fig.12-b)). In the water-bearinginterval, there will be no capillary pressure difference betweenthe mud filtrate and the water, and the tool measures the trueformation gradient (Fig.10-e, Fig.11-e and bottom of left plotof (Fig.12-b)).
For a well drilled with oil-based mud in an oil-wetformation, there is no capillary pressure difference betweenthe mud filtrate and the formation oil in an oil-bearinginterval, so the tool measures the actual formation gradient(Fig.10-h, Fig.11-h and top of right plot of (Fig.12-b)). In thewater-bearing zone, the water saturation in the invaded zone isclose to irreducible, and the capillary pressure is a small value(Fig.10-f and Fig.11-f). The result is that the measured oilpressure is slightly lower than the desired water pressure.Thus, the measured water gradient is slightly shifted to the left(bottom of left plot of (Fig.12-b)).

SPE 56712 Capillary Pressure and Rock Wettability Effects on Wireline Formation Tester Measurements 7
When one of the two phases becomes discontinuous at lowsaturation, its pressure follows the gradient of the other(continuous) phase. The pressure of a discontinuous phase isunobservable except under lab conditions and is of nopractical importance. In silty sandstone reservoirs, theirreducible water saturation corresponding to the top of thecapillary transition zone may be quite high yet the oil phase iscontinuous and the well produces oil. A magnetic resonancelog would be able to differentiate moveable from bound fluid,but if only conventional logs are available, potentialrecoverable oil will probably be missed. In such a case,formation tester gradients can be used to distinguish betweenmoveable oil, which appears as a continuous oil gradient onthe pressure measurements despite the high water saturation,and residual oil, which appears as a continuous water gradient.The importance of this for reserve estimation is obvious.
Wettability and capillary pressure effects on testerfluid level measurementsThe effects of wettability and capillary pressure on thewireline formation tester’s fluid level measurement are closelylinked to their effects on gradient measurements. Ordinarily,the intersection of the continuous phase pressure lines on adepth-pressure diagram occurs at the FWL as shown in Fig.13and Fig.14 for water-wet and oil-wet reservoirs, respectively.The intersection of the water and hydrocarbon continuousphase pressure lines as measured by the wireline formationtester is an indication of the FWL. In general, however, thisintersection will differ from the FWL in a direction thatreflects the rock wettability and by an amount that isdependent on the degree of wettability, the magnitude ofcapillary pressure, and the type of drilling mud used (Fig.12aand b).
In a water-wet medium, the capillary pressures in the oil-filled pores are higher than in the water-filled ones, and theFWL is located below the OWC by a distance determined bythe capillary threshold or displacement pressure (Fig.13). Asshown in Fig.12-a, the actual intersection of the oil and watergradients from the wireline formation will be generally higherthan the true FWL. This is true for wells drilled with eitherwater and oil-based muds. As explained in the previoussection, with a water-based mud (WBM) in the oil zone, themeasured pressure will be the water phase pressure, which willbe lower than the oil phase pressure we are aiming to measure.Therefore, the measured oil line will be shifted to the left ofthe true formation oil pressure line, making the intersectionhigher than the actual FWL (left plot of Fig.12a). On the otherhand, with an oil-based mud (OBM) in the water zone, themeasured pressure is the oil filtrate pressure, which will begreater than the water phase pressure. Thus, the measuredwater line will be shifted to the right of the true formationwater pressure line, making the intersection again higher thanthe actual FWL (right plot of Fig.12a).
In an oil-wet medium, the capillary pressures in the water-filled pores are higher than in the oil-filled pores, and the FWLis located above the OWC by a distance again determined bythe capillary threshold or displacement pressure (Fig.14).. Theactual intersection of the oil and water gradients from thewireline formation tester will be generally lower than the trueFWL as shown by Fig.12b. This is true for wells drilled witheither water and oil-based muds. As discussed in the previoussection, with a WBM in the oil zone, the measured pressurewill be the water phase pressure, which will be higher than theoil phase pressure we are aiming to measure. Therefore, themeasured oil line will be shifted to the right of the trueformation oil pressure line, making the intersection lower thanthe actual FWL (left plot of Fig.12b). On the other hand, withOBM in the water zone, the measured pressure is the oilfiltrate pressure, which will be lower than the water phasepressure. Thus, the measured water line will be shifted to theleft of the true formation water pressure line, making theintersection again lower than the actual FWL (right plot ofFig.12a)..
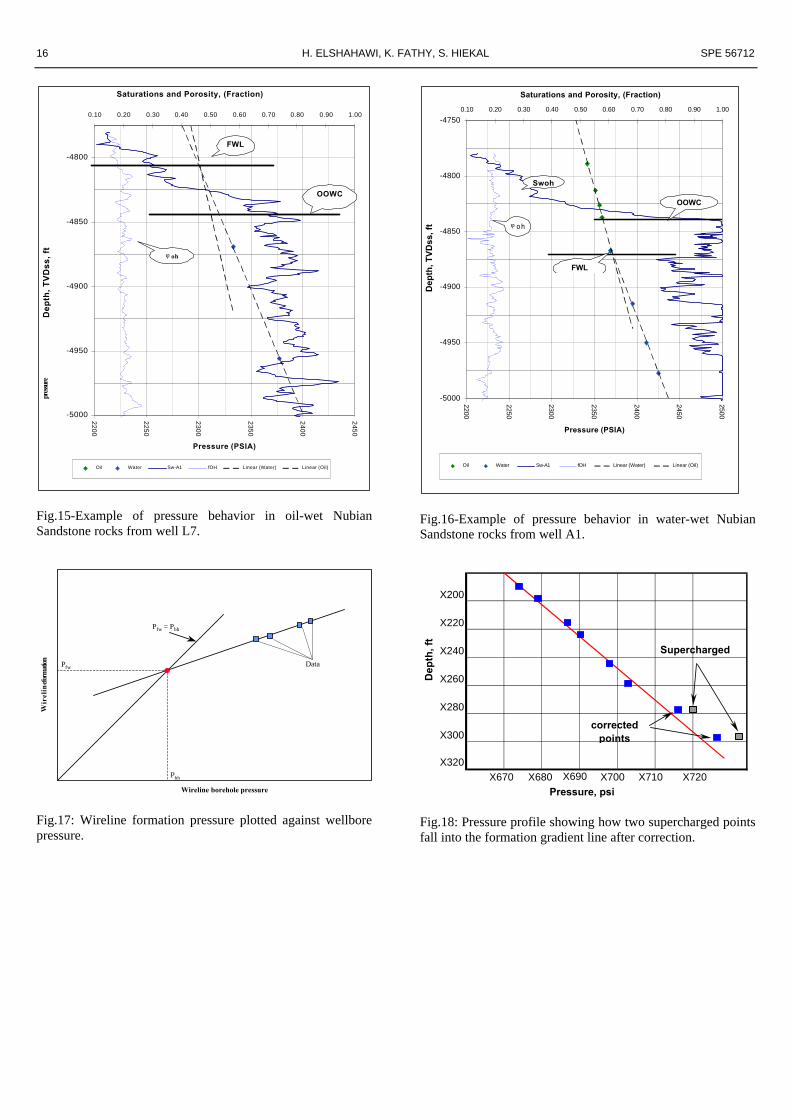
Fig. 15 and Fig.16 show how rock wettability was detectedin-situ in the mixed-wet Nubian Sandstone by its effect on thewireline formation pressure measurements (Hiekal at al.,1998). Fig.15 shows the OWC at a depth of 4835 ft-TVDss,20 ft-TVD below the FWL at 4815 ft-TVDss in the highporosity system of the reservoir with strong preference to beoil wet (example from well L7). On the other hand, Fig.16shows the OWC at a depth of 4835 ft-TVDss, 35 ft-TVDabove the FWL at 4870 ft-TVDss in the low porosity systemreservoir which has a strong affinity to be water-wet (examplefrom well A1).
The three fluid column modelIt should now be clear that it is not really accurate to assumethat the formation tester can, in all cases, see through theinvaded zone into the virgin zone. But how can one explainthat even when the measured gradient is shifted or scattered, itstill in many cases reflects the true formation fluid gradient?To be able to answer this question, it is best to think of asystem made up of three columns in partial communicationwith one another, with each having its own pressure gradient.These are the mud column, the invaded zone column, and theformation fluid column.
The mud column normally contains the highest densityfluid and is partially isolated by the mud cake from the annularflushed zone column, which is primarily composed of filtrate.The effectiveness of the mud-cake isolation varies with time,depth, and the amount of overbalance. A stable mud columncan be considered to be a pressure sink whose gradient cannotbe altered by flows into or out of the formation. At its outerboundary, the mud column is contact with the invaded zonecolumn. This invaded zone column contains primarily filtrate,which is less dense than mud, in addition to formation fluids atresidual or irreducible saturations. The static hydrostatic

8 H. ELSHAHAWI, K. FATHY, S. HIEKAL SPE 56712
gradient of this column is, therefore, that of the mud filtrate.At its outer boundary, the flushed zone column is in contactwith the formation fluid column. There is normally no sharpbarrier between the invaded zone and the formation, so theinterface between the two depends on the balance of viscousand capillary forces. The viscous forces depend on the rate offiltration through the mud-cake, while the capillary forces arecontrolled by, and in turn control, the saturations across theinterface. Like the mud column, the reservoir fluid column is apressure sink, and the invasion process does not affect itshydrostatic gradient.
Since the invaded zone column is in continuous contactwith the mud and the formation fluid, it clearly cannot be athydrostatic equilibrium. If the mud-cake is an effective seal,the invaded zone must come to equilibrium with the reservoirafter some time. In the case of oil-based mud invading a waterzone, the gradient of the water is impressed upon the filtrate sothat it is forced to float upwards as far as vertical permeabilityallows. The extra viscous pressure drop from this verticalmovement is superimposed onto the hydrostatic gradient of thefiltrate so as to yield the hydrostatic gradient of the formationfluid in the invaded zone. In some cases, the mud-cake maynot fully control the filtration process, leading to high rates offiltration, deep invasion, and Buckley-Leverett-type shock-front displacement in the invaded zone. Viscous forces wouldpredominate over capillary forces, and some isolation betweenthe invaded and reservoir columns may result. In this case, thefiltrate floats upwards, whilst trying to equilibrate with themud column. There would still be some pressure drop acrossthe mud-cake, however, so the measured formation pressurewould be lower than the mud pressure, often resulting in agradient that is somewhere between formation and mudgradients. This helps explain one of the most commonlyencountered formation pressure gradient anomalies, whereinthe gradient in the oil zone is steeper than normal.
A less commonly observed gradient anomaly is one inwhich the gradient across an oil-bearing zone of a water-wetreservoir drilled with water-based mud is steeper than normal.This may be related to capillary hysterisis effects since theinvasion of the water-based mud filtrate into the oil zone is animbibition process. Since it is possible for the imbibitioncapillary curve to become negative as the oil saturationapproaches residual, the water phase pressure can be higherthan that of the oil phase, producing a gradient that is toosteep.
SuperchargingAs a consequence of mud filtrate invasion in the immediatevicinity of the wellbore, the formation may exhibit pressureshigher than the actual formation pressure. This over-pressuretends to dissipate when a mud cake is established and furtherinvasion becomes negligible. Even if a mud cake is built,however, this overpressure may still exist at the time of thepressure measurement. This effect is called supercharging and
should not be confused with capillary or intrinsic formationover-pressures. Such confusion is common sincesupercharging is similar to capillary over-pressure effects inthe sense that both are inversely related to effectivepermeability. As a consequence of supercharging, allpermeable zones are locally, and often temporarily, over-pressured by the invading filtrate. Levels affected bysupercharging in either the oil or the water zones will appearto the right of the expected formation pressure line, withgradients tending to be more scattered as the mobility of themeasured phase decreases. In capillary transition zones, whereoften both oil and water phases are mobile, the total mobilityis reduced, leading to an increase in the possibility ofsupercharging. As the pressure difference between the mudcolumn and the formation increases with depth, and witheverything else being equal, supercharging could possibly leadto an apparent increase in gradient.
The primary factors affecting supercharging are the degreeof pressure differential across the sand-face, the extent of mudcake build-up and its effectiveness in preventing filtrate-fluidloss into the formation, and the total mobility of the formation.Fergusson and Koltz (1954) defined three stages of mudfiltrate invasion. These are the initial spurt loss leading to arapid buildup of mud cake; the dynamic filtration, whichoccurs when the mud cake attains an equilibrium thicknessand while mud is still circulated; and the static filtration whichtakes place after circulation of the mud has ceased. Halford(1983) reviewed the processes of mud filtrate invasion andmade some conclusions, which can be summarized as follows.Firstly, if filtration is governed by the mud cake, which is thecase except in very low permeability formations, then afterseveral hours, the dynamic rate converges to a constant rateequilibrium rate. Secondly, after about fifteen hours of staticfiltration, which is typical of the condition wherein formationtester surveys are run, that static loss rate may be consideredconstant. Thirdly, oil-based muds show lower dynamic andstatic loss rates compared to water-based muds. Despite thislatter conclusion, oil-based muds do not always form mudcakes, and dynamic filtrate invasion continues even during thewireline formation tester survey. In extreme cases, evenmoderately high permeability zones may appear superchargedat the time of the survey.
Correcting for wettability, capillary pressure, andsupercharging effects on the formation testerOne possible method of correcting for wettability and capillarypressure effects on wireline formation tester pressures is toconstruct the Leverett J-function for the reservoir from coresamples and transform it to reservoir fluid conditions. This ispossible because by definition of the leverett J-function,
J(Sw) = (6.848 Pc √(k/φ)lab)/(σ cosθ)lab
= (6.848 Pc √(k/φ)res)/(σ cosθ)res………………………………..(13)

SPE 56712 Capillary Pressure and Rock Wettability Effects on Wireline Formation Tester Measurements 9
The lab (core) capillary pressure data can thus be used totranslated to reservoir conditions as follows:
Pc)res = Pc)lab√((φres klab)/(φlab kresevoir))x((σcosθ)res/(σ cosθ)lab)………………...(14)
By knowing the invaded zone saturation, the amountcapillary pressure can then be computed. Thus, it is possible tocorrect the measured formation pressure at each point byadding (or subtracting) the capillary pressure corresponding tothe value of invaded zone saturation (Sxo) measured at thatpoint (Awad, 1982) such that
Pcorrected = Pmeasured + Pc(Sxo)………………………………..(15)
Better still, if a nuclear magnetic resonance (NMR) log isavailable, then the downhole capillary pressure correction canbe computed directly. Unfortunately, there are many cases inwhich neither core data nor NMR data is available. In thesecases, it is possible to derive drainage capillary curves byplotting the height above the OWC in the transition zone vs.the water saturation as computed from the openhole logs. Thistype of correction generally results in adjustment of thegradient towards the correct direction but may result in largescatter. This is due to the simplicity of this type of correction,which fails to take into account the vertical flow occurringwithin the invaded zone as detailed earlier. It is important torealize that without correction, the intersection of thehydrostatic gradients in a well drilled with OBM in a water-wet reservoir will indicate the top of the transition zone ratherthan the actual FWL. This is a potentially very usefulmeasurement in its own right as it indicates the highestproducible water level.
Amongst other things, the state of the art ModularDynamics Tester MDT offers convenient solutions toovercome the anomalies described earlier. For instance, theability to “pump out” mud filtrate enables the measurement offormation pressure before and after capillary pressure effectremoval, and hence allows the estimation of the amount ofcapillary pressure. The same facility also minimizessupercharging and reduces its disturbing effect on themeasured gradients. On the other hand, the flow identificationabilities of the MDT such as the flow line resistivity and theoptical fluid density can indicate the type and quantity of mudfiltrate as well as the moveable reservoir fluid, which wouldhelp establish and confirm and correct the measured pressuregradient.
To reduce the effects of supercharging, the formation testersurvey should be run as late as possible after a circulation ofthe well in order to maximize the time-dependent decay of therelatively large dynamic filtrate loss-rate. In fact, theusefulness of the widely used practice of routinely runningwiper trips prior to wireline formation tester surveys is ratherdubious, since these trips often only serve to stir up the mud
column and scrape off the mud cake, leading to increasedfiltration rates, increased supercharging effects, and greaterchances of getting differentially stuck. The true formationpressure can be obtained by applying a correction technique tocorrect the effects of supercharging in low permeabilityformation. This method can be applied by measuring Pbh
“wireline borehole pressure” and Pwf “wireline formationpressure” more than two times at the same point. By plottingPwf versus Pbh, the true formation pressure is obtained at thepoint where a line drawn through the data crosses a 45o linewith Pbh =Pwf as shown in Fig.17. This technique was appliedto correct the effect of supercharging in a low-permeabilityformation. Fig.18 shows the pressure profile obtained with theformation tester tool. Two pretest points were identified assupercharged. The pretests were repeated after applying 300 atthe mud column. The measured pressures changed at bothdepths, and the correction was computed according to thetechnique described above.
Conclusions
1. Wireline formation testers measure the pressure of thecontinuous phase present in the invaded region.
2. Conventional interpretation techniques assume that thispressure is identical to the pressure of the formation fluid,implying that the wireline tester measurement isunaffected by the invasion process. This in not true asproven by many field examples, particularly in OBM.
3. The concepts of free fluid level, fluid contacts, rockwettability, and pore fluid pressures are intimately related.
4. The effect of wettability and capillary pressure will makethe measured formation pressure either too high or toolow depending on the specific wetting fluid-drilling mud-formation fluid combination. This will result in shiftedgradient lines, altered gradient slopes, or greater scatter.
5. In a water-wet medium, the FWL is expected to occurbelow the OWC, while in an-oil wet medium, the FWL isexpected to occur above the OWC.
6. Capillary pressure effects can be corrected for, providedcore and intermediate zone saturation data are available.NMR data may supplement or replace these sources.
7. The formation tester contact will generally be off from theactual FWL. In a water-wet medium, the contact willgenerally appear too high compared to the FWL, while inan oil-wet medium, it will generally appear too lowcompared to the FWL. In the latter case, the measuredcontact will indicate the highest producible water level.
8. The new MDT offers several features that reduce theuncertainties arising from capillary and superchargingeffects. In addition to its fluid-identification features,these include the ability to pump out mud filtrate andformation fluid.

10 H. ELSHAHAWI, K. FATHY, S. HIEKAL SPE 56712
NomenclatureCMR: Continuous Magnetic Resonance Toolc.u.: Capture UnitFWL: Free Water LevelGOC: Gas Oil ContactJ(Sw): Leverett J-functionK: PermeabilityMDT: Modular Dynamics ToolOBM: Oil-based mudOOWC: Original Oil Water ContactOWC: Oil Water ContactPc: Capillary pressurePnw: Non-wetting phase pressurePD: Displacement PressurePw: Wetting phase pressurep.u.: Porosity Unitr: radius of curvatureRFT: Repeat Formation TesterROS: Remaining Oil SaturationSor: Residual Oil SaturationSOWC: Secondary Oil Water Contacts.u.: Saturation UnitSw: Water SaturationSwc: Connate Water SaturationSxo: Water Saturation in the flushed (invaded) zoneWBM: Water-based mudρ: Fluid densityσ: Interfacial tensionφ: Porosityθ: Angle of contact
References1- Awad, M.: “Phase Pressure Measurement by the RFT in
the Hydrocarbon Zone,” prepared for the 2nd WirelineInterpretation Symposium, Ridgefield, 12-15 July, 1982.
2- Schlumberger, RFT Essentials of Pressure TestInterpretation (1981).
3- Stewart, G. and Witman, M.: “Interpretation of thePressure Response of the Repeat Formation Tester,” SPE8362 (1979).
4- Ferguson, C.K. and Koltz, J.A.: “Fitration from MudDuring Drilling,” Trans. AIME (1954), Vol 201, pp. 29-42.
5- Bear, J.: Dynamics of Fluids in Porous Media, Elsevier,New York (1979).
6- Halford, F.R. “An Analysis of Supercharging Effects onOpenhole Wireline Formation Pressure Measurements,”M. Eng Thesis, Heriot-Watt University (1983).
7- Phelps, G.D., Stewart, G., and Peden, J.M.: “TheAnalysis of the Invaded Zone Characteristics and TheirInfluence on Wireline Log and Well Test Interpretation,”SPE 13287 (1984).
8- Leverett, M.C.: “Capillary Behaviour in Porous Solids,”Trans AIME (1941), Vol. 142.
9- Buckley, S.E. and Leverett, M.C.: “Mechanism of FluidDisplacement in Sands,” Trans AIME (1942), Vol. 146,
pp. 107-116.10- Hirasaki, G.J.: “Dependence of Waterflood Remaining
Oil Saturation on Relative Permeability, CapillaryPressure, and Reservoir Parameters in Mixed-WetTurbidite Sands,” SPE Reservoir Engineering, May1996.
11- Kaminsky, R. and Radk, C.J.: “water Films, Asphaltenes,and Wettability Alteration,” SPE/DOE IOR Symposium,Tulsa, Oklahoma, Paper No. 39087, 19-22 April 1998.
12- McCain, W.D. Jr.: The Properties of Petroleum Fluids,Pennwell Publishing Company, Tulsa, Oklahoma,Second Edition, (1993).
13- Schlumberger: Middle East Well Evaluation Review,November 7, 1989, pp. 36-39.
14- Salathiel, R.A.: “Oil Recovery by Surface Film DrainageIn Mixed-Wettability Rocks,” Journal of PetroleumTechnology, October, 1973.
15- Hiekal, S., Kamal, M., Hussein, A and Elshahawi, H.:“Time Dependence of Swept Zone Remaining OilSaturation In a Mixed-Wet Reservoir,” Paper presentedat SPWLA Japan, 24-25 September, 1998.
16- Wood A.R., Wilco, T.C., MacDonald, D.G., Flynn, J.J.,and Angert, P.F.: “Determining Effective Residual OilSaturation for Mixed Wettability Reservoirs: EndicottField, Alaska,” SPE 22903 (1991).
17- Chilingarian, G.V. and Yen, T.F.: “Some Notes onWettability and Relative Permeabilities of CarbonateRocks, Energy Sources,” Vol.7, No.1 (1983), pp. 67-75.
18- Trieber, L.E., Archer, D.L., and Owens, W.W. “ALaboratory Evaluation of the Wettability of Fifty Oil-Producing Reservoirs,” Soc. Pet. Eng. Journal (1972),pp. 531-540.
19- Raza, S.H., Trieber, L.E., and Archer,D.L.: “Wettabilityof Reservoir Rocks and its Evaluation,” ProducersMonthly (April 1968), pp. 2-7.
About the authorsHani Elshahawi presently (Mid 1999) works as a reservoirengineer and production technologist with SchlumbergerOilfield Services and is involved in the interpretation andmarketing support of cased hole logging services in the EastAfrica and Eastern Mediterranean regions. He received hisMSc in Petroleum Engineering from the University of Texasat Austin in 1997 and his BSc in Mechanical Engineering fromthe American University in Cairo in 1988.
Khaled Fathy presently works as a reservoir engineer withSchlumberger Geoquest Cairo and is responsible for dataprocessing of production logs, well tests, and corrosion logs.He received his BSc, from Cairo University, Egypt, 1996.
Salah A. Hiekal presently works as a senior reservoirengineer in IEOC. Prior to that he was a senior reservoirengineer with Suez Oil Company (SUCO). He received hisMSc, from Cairo University, 1998, and BSc from Suez CanalUniversity 1991, Egypt.
SPE 56712 Capillary Pressure and Rock Wettability Effects on Wireline Formation Tester Measurements 11
Water
Oil
Fig.1-Schematic of Pore Cross-section in a water-wetporous media, (grains rock are surrounded by thin film ofbrine and are not contacted by oil).
W ater
O il
Fig.2-Schematic of Pore Cross-section in an oil-wet porousmedia, (grains are surrounded by thin film of oil and arenot contacted by water).
Fig.3-In larger grains/pores, the water film ruptures, and oiland rock in direct contact, locally altering wettability topreferentially oil-wet.
Fig.4:-In smaller grains/pores, the water film covers thegrain surfaces completely, thus maintaining those grainswater-wet.
4770
4790
4810
4830
4850
4870
4890
0 0.2 0.4 0.6 0.8 1
S w , fraction
De
pth
, T
VD
ss,
ft
SwL7 (high porosity) SwC3 (high porosity) SwA1 (low porosity)
Fig.5-Water saturation versus depth profile for low porosity(water-wet) and high porosity (oil-wet) Nubian Sandstonerocks (after Hiekal et al., 1998).

12 H. ELSHAHAWI, K. FATHY, S. HIEKAL SPE 56712
4450
4650
4850
5050
5250
5450
0.00 0.05 0.10 0.15 0.20 0.25 0.30 0.35 0.40
Porosity, φ
De
pth
, T
VD
ss
. ft
0.00 0.10 0.20 0.30 0.40 0.50 0.60 0.70 0.80 0.90 1.00
Water Saturation
Porosity, Fraction Swoh, Fraction
OOWC
Porosity
Fig.6-Mixed-wettability example: Porosity & water saturationversus depth profiles for well L-7 (after Hiekal et al 1998).
0
0.05
0.1
0.15
0.2
0.25
0.3
0.35
0.4
0.45
0.5
0 0.1 0.2 0.3 0.4 0.5
Porosity, Fraction
Co
nn
ate
Wa
ter
Sa
tura
tio
n,
Fra
cti
on
Water
Wet
O il
Wet
Fig.7-Connate water saturation versus porosity profile(Multiple wells CPI log data 100 ft above OOWC in NubianSandstone)
Solid
r2
r1
Solid
Fig.8-Radii of curvatures for pendular rings around aspherical sand grain junction.
Fig.9-Drainage and imbibition capillary pressure curvesfor a water-wet system.
SPE 56712 Capillary Pressure and Rock Wettability Effects on Wireline Formation Tester Measurements 13
1-S or
S or
1-S wc
S wcS o
S w
1-S or
S or
1-S wc
S wc
1-S wc
1-S wc
S wc
S wc
1-S or
1-S or
S or
S or
OBMInvaded zone Virgin zoneIntermediate zone
WBMInvaded zone Virgin zoneIntermediate zone
WBMInvaded zone Virgin zoneIntermediate zone
WBMInvaded zone Virgin zoneIntermediate zone
WBMInvaded zone Virgin zoneIntermediate zone
OBMInvaded zone Virgin zoneIntermediate zone
OBMInvaded zone Virgin zoneIntermediate zone
OBMInvaded zone Virgin zoneIntermediate zone
Fig.10-d: Saturation Profile, Oil Zone & Water WetFig.10-c: Saturation Profile, Oil Zone & Water Wet
Fig.10-f: Saturation Profile, Water Zone & Oil Wet.Fig.10-e: Saturation Profile, Water Zone & Oil Wet.
Fig.10-h: Saturation Profile, Oil Zone & Oil WetFig.10-g: Saturation Profile, Oil Zone & Oil Wet.
Fig.10-b: Saturation Profile, Water Zone & Water WetFig.10-a: Saturation Profile, Water Zone & Water Wet
S w
S w
S w
S w
S w
S w
S w
S o
S o
S o
S o
S o
S o
S o
14 H. ELSHAHAWI, K. FATHY, S. HIEKAL SPE 56712
Pw
Po
Pw
Pw
P o
P w
Po
Po
Pw
P w
Po
Po
OBMInvaded zone Virgin zoneIntermediate zone
WBMInvaded zone Virgin zoneIntermediate zone
no oil phase
no water phase
OBMInvaded zone Virgin zoneIntermediate zone
OBMInvaded zone Virgin zoneIntermediate zone
OBMInvaded zone Virgin zoneIntermediate zone
WBMInvaded zone Virgin zoneIntermediate zone
WBMInvaded zone Virgin zoneIntermediate zone
WBMInvaded zone Virgin zoneIntermediate zone
Fig.11-g: Capllary Pressure Profile, OilZone & Oil Wet
Fig.11-h: Capllary Pressure Profile,Oil Zone & Oil Wet
Fig.11-e: Capllary Pressure Profile,Water Zone & Oil Wet
Fig.11-f: Capllary Pressure Profile,Water Zone & Oil Wet
Fig.11-c: Capllary Pressure Profile, OilZone & Water Wet
Fig.11-d: Capllary Pressure Profile, OilZone & Water Wet
Fig.11-b: Capllary Pressure Profile,Water Zone & Water Wet
Pw
Fig.11-a: Capllary Pressure Profile,Water Zone & Water Wet
Po
SPE 56712 Capillary Pressure and Rock Wettability Effects on Wireline Formation Tester Measurements 15D
ep
th
De
pt
h
True PressureMeasure Pressure
Wireline tester interpretation
Free water level
Pressure Pressure
Water Base Mud Oil Base Mud
True PressureMeasure Pressure
Free water level
Wireline tester interpretation
Pressure Pressure
Water Base Mud Oil Base Mud
De
pt
h
De
pt
h
Capillarythreshold
OWC
Sw (%)
Pc
00
Capillary curveReservoir
FWL
Oil
Dep
th
Transition zone
100Water
OWC
Sw (%)
Pc
0
Capillary curveReservoir
FWL
OilDe
pt
h Transitionzone
100
Water
Fig.12-a: Capillary pressure effects on pressuremeasurement in a water wet system
Fig.12-b: Capillary pressure effects on pressuremeasurement in an oil wet system
Fig.13-Fluid pressure, capillary pressure, and saturation distribution a water-wet reservoir
Fig.14-Fluid pressure, capillary pressure, and saturation distribution an oil-wet reservoir
irreducible watersaturation, water maybecome disconnected
irreducible watersaturation, water maybecome disconnected
16 H. ELSHAHAWI, K. FATHY, S. HIEKAL SPE 56712
-5000
-4950
-4900
-4850
-4800
22
00
22
50
23
00
23
50
24
00
24
50
Pressure (PSIA)
De
pth
, T
VD
ss
, ft
0.10 0.20 0.30 0.40 0.50 0.60 0.70 0.80 0.90 1.00
Saturations and Porosity, (Fraction)
Oil Water Sw-A1 fOH Linear (Water) Linear (Oil)
OOWC
FWL
φ oh
Fig.15-Example of pressure behavior in oil-wet NubianSandstone rocks from well L7.
Wireline borehole pressure
Wir
elin
e form
ation
pr
essu
re
Pfw = Pbh
Pfw
Pbh
Data
Fig.17: Wireline formation pressure plotted against wellborepressure.
-5000
-4950
-4900
-4850
-4800
-4750
2200
2250
2300
2350
2400
2450
2500
Pressure (PSIA)D
epth
, TV
Dss
, ft
0.10 0.20 0.30 0.40 0.50 0.60 0.70 0.80 0.90 1.00
Saturations and Porosity, (Fraction)
Oil Water Sw-A1 fOH Linear (Water) Linear (Oil)
OOWC
Swoh
FWL
φ oh
Fig.16-Example of pressure behavior in water-wet NubianSandstone rocks from well A1.
X200
X220
X240
X260
X280
X300
X320
Dep
th, f
t
Pressure, psiX670 X680 X690 X700 X710 X720
corrected points
Supercharged
Fig.18: Pressure profile showing how two supercharged pointsfall into the formation gradient line after correction.