capita capita pm and ozone analysis a. pm2.5 national maps b. visibility (pm2.5) trends c. natural...
TRANSCRIPT

CAPITA
CAPITA PM and Ozone Analysis
• A. PM2.5 National Maps
• B. Visibility (PM2.5) trends
• C. Natural (out of EPA jurisdiction) Events
• D. US-Canada Ozone Transport
• E. Planned National Analyses
CAPITA PM and Ozone Data Analyses

CAPITA
A National PM2.5 Concentration Maps
• PM2.5 concentration maps are useful for understanding the pollutant’s spatial pattern and identifying potential non-attainment areas of the PM2.5 NAAQS (annual average of 15 μg/m3 )
• Monitoring data provide information at specific points and are used as input in generating the maps
• The limited number of PM2.5 monitoring data are inadequate to generate meaningful maps. National PM2.5 maps are generated using an enhanced inverse distance squared method that incorporates:
• visibility and PM10 surrogate data to aid interpolation between PM2.5 monitors
•mountain and mixing height barriers to prevent the spreading of non-representative concentrations
•declustering to minimize biases from monitoring site clusters
•For further information see: http://capita.wustl.edu/Databases/UserDomains/SAPID/
CAPITA PM and Ozone Data Analyses

CAPITA
A1 Annual Average PM2.5 Concentrations (1994-96)
Visibility Aided PM2.5 PM10 Aided PM2.5
• In both maps, PM2.5 concentrations exceed 15 μg/m3 in the San Joaquin Valley and South Coast Basin of California, in the west, and Pittsburgh, St. Louis, Roanoke, and the Washington DC - New York City Metropolis.
• The visibility aided estimates indicate a larger region above 15 μg/m3 along the eastern seaboard. Additional areas above 15 μg/m3 are shown with PM10 aided estimates including Atlanta and eastern TN.
CAPITA PM and Ozone Data Analyses

CAPITA
A2 Pm2.5 National Maps - Application
• EPA Trends Report
• PM2.5 Criteria Document 2000
• NAS Report
CAPITA PM and Ozone Data Analyses

CAPITA
B Visibility Trends
• This is an update of the US visibility trends for the period 1980-95. Earlier visibility trend reports covered the 1960 - 1992 period.
• Data from 1996 and 1997 were excluded since these data were collected using the automated ASOS visibility measuring system.
• The trend analysis is focused on using the summer season (June, July, August), because this is the period during which the visibility degradation is the worst over most of the US
• For further information see U.S. Visibility Trends, 1960-1992
CAPITA PM and Ozone Data Analyses

CAPITA
B1 Visibility Trends 1980 - 95
• In the Eastern US, throughout the 1980-95 period, the 75th percentile BEXT exceeded 0.15 or had an average visibility of less than 10 miles.
• Most notable are the hazy regions on both sides of the Appalachian Mountains where the BEXT exceeds 0.2 1/km.
• Since the early 1980s the BEXT decreased 8-15% with the largest decreases in the Southern and Central regions.
Click on the images to view larger versions
CAPITA PM and Ozone Data Analyses

CAPITA
B2 75th and 90th Percentile Light Extinction Trends
Over the Eastern US, the 75th percentile Bext decreased ~8 percent over the 15 years. The largest decreases occurred in the Southeast where the Bext decreased 12% compared to 8% in the Northeast.
Trend StatisticsEastern US Northeastern US Southeastern US
75th %-ile 90th %-ile 75th %-ile 90th %-ile 75th %-ile 90th %-ile BEXT (1/km)
('80 - '95)0.015 0.042 0.014 0.042 0.024 0.053
Stnd Error (1/km) 0.0095 0.018 0.014 0.023 0.011 0.023/Error 1.58 2.29 1 1.83 2.14 2.32
Trend Confidencelimit (t distribution)
85% 95% 65% 90% 95% 95%
CAPITA PM and Ozone Data Analyses

CAPITA
B3 Visibility Trends - Applications
• Report on the Nation's Ecosystems by the Heinz Center. A White House initiative to create a ‘Report card’ on the health of our Nation’s ecosystems.
• EPA National Trends Report
• PM2.5 Criteria Document 2000
CAPITA PM and Ozone Data Analyses
CAPITA
C Natural Events (Out of EPA Jurisdiction)
• Dust storms and forest fires are major PM events that occur several times a year over different parts of the US.
• Many of these events originate outside the US, e.g. dust from Sahara and the Asian desserts and smoke from forest fires in Central America and Canada.
• Exceedances of the NAAQS caused by dust and smoke events are uncontrollable ‘acts of God’. Nevertheless, states are required to provide evidence that such events (outside their jurisdiction) have occurred.
• For this reason, control agencies need to be able to detect and document the impact of such events on their control region. The existing tools for such documentation are poorly developed.
• The natural PM events are illustrated by two extreme examples: Asian dust impacting on the West Coast and the Central American forest fire smoke impacting the Eastern US.
CAPITA PM and Ozone Data Analyses
CAPITA
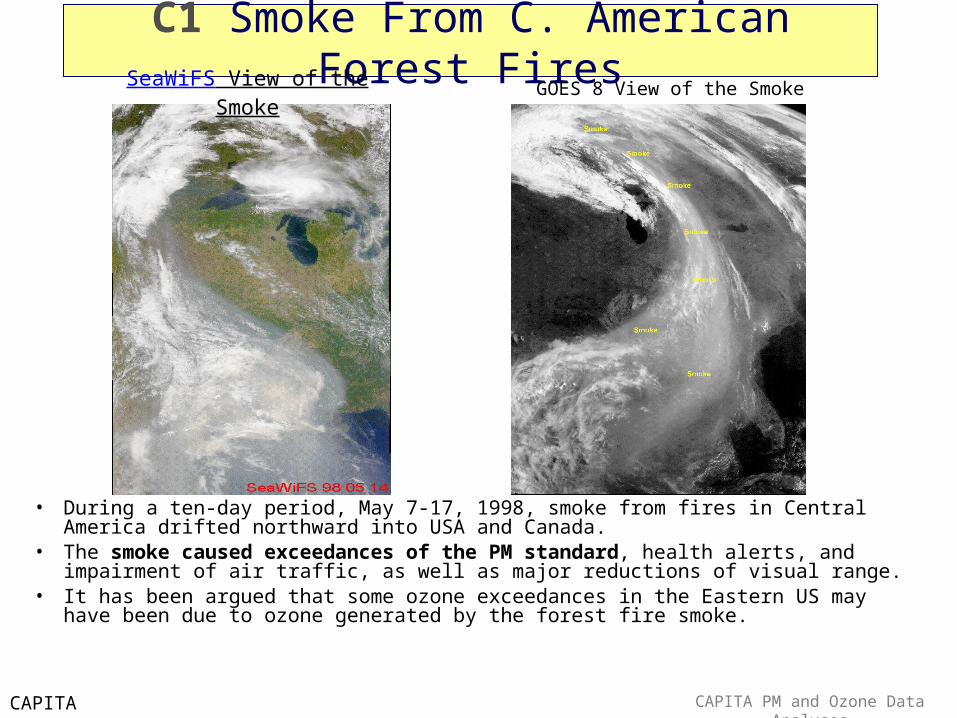
C1 Smoke From C. American Forest Fires
• During a ten-day period, May 7-17, 1998, smoke from fires in Central America drifted northward into USA and Canada.
• The smoke caused exceedances of the PM standard, health alerts, and impairment of air traffic, as well as major reductions of visual range.
• It has been argued that some ozone exceedances in the Eastern US may have been due to ozone generated by the forest fire smoke.
GOES 8 View of the SmokeSeaWiFS View of the Smoke
CAPITA PM and Ozone Data Analyses

CAPITA
C2 Asian Dust Over the West Coast
• In Vancouver and in Washington State the PM10 and PM2.5 concentrations reached 100 an 40 µg respectively.
• Based on public complaints and monitoring data, the State of Washington issued a ban on open burning on April 29.
CAPITA PM and Ozone Data Analyses

CAPITA
C3 Natural Events - Applications
• Used by OAQPS in the assessment of the requests by States for ozone exceedance waivers for smoke generated ozone.
• State agencies (Washington and Idaho) issued AQ advisories based on the above Chines Dust report
• PM2.5 Criteria Document 2000
CAPITA PM and Ozone Data Analyses

CAPITA
D Us-Canada Ozone Transport
• Following a request by J. Bachmann, OAQPS, this preliminary analysis for the US-Canada Air Quality Agreement was conducted.
• The purpose is to illustrate ozone transport across the national boundaries.
• The analysis methodology included:– O3 concentration stratified by wind direction – O3 concentration stratified by wind speed – Transport wind vectors under high and low ozone conditions
• For further information see Ozone Transport Over Eastern North America
CAPITA PM and Ozone Data Analyses

CAPITA
D1 At high wind speeds, > 6 m/s, higher concentrations appear at the downwind edges of the Eastern North American domain.
CAPITA PM and Ozone Data Analyses

CAPITA
D2 On high O3 days, the transport winds are slow with clockwise circulation around the south-center of the Eastern US.On low O3 days, swift transport winds are from outside the industrial Eastern North America.
Transport winds during high (90%-
ile) local ozone days.
Transport winds during low (10%-
ile) local ozone days. CAPITA PM and Ozone Data
Analyses

CAPITA
D3 Us-Canada Ozone Transport - Applications
• Canada/US Air Quality Agreement
CAPITA PM and Ozone Data Analyses

CAPITA
E Planned National PM Analyses
• PM Spatial and Temporal Pattern Analysis– Seasonal– Weekly
• PM Transport Climatology - relate transport to ambient concentrations and vice versa.
– Surface Winds– Forward Airmass Histories– Backward Airmass Histories
CAPITA PM and Ozone Data Analyses