capp 2010 forecast
TRANSCRIPT

Crude Oil Forecast, Markets & Pipelines 1
Crude OilForecast, Markets & Pipelines
June 2010

2 CANADIAN ASSOCIATION OF PETROLEUM PRODUCERS
Disclaimer:This publication was prepared by the Canadian Association of Petroleum Producers (CAPP). While it is believed that the information contained herein is reliable under the conditions and subject to the limitations set out, CAPP does not guarantee the accuracy or completeness of the information. The use of this report or any information contained will be at the user’s sole risk, regardless of any fault or negligence of CAPP.

Crude Oil Forecast, Markets & Pipelines i
EXECUTIVE SUMMARY The CAPP 2009 forecast exhibited a tempered rate of growth relative to prior year forecasts and was a reflection of the deferrals of many oil sands projects announced last year. This was the direct response by producer companies to the 2008-09 economic downturn and lower oil prices at the time. In contrast, the economic climate has recovered somewhat at the time of this year’s forecast. In the first quarter of 2010, WTI oil prices have increased to the US $70-85 per barrel range, a range in which oil sands projects currently become economic. In response, several companies are now actively developing phases of their projects that had previously been placed on hold.
Ultimately, the goal of this report is to provide industry with a timely and objective view of the changes in crude oil supply availability over the next 15 years. It is also meant to help develop an understanding of the major trends affecting industry.
20252023202120192017201520132011200920072005
Conventional HeavyConventional LightPentanes
Oil Sands Growth
Oil Sands Operating & In Construction
0
1,000
2,000
3,000
4,000
5,000
thousand barrels per day
Atlantic CanadaForecastActual
June ‘09 Forecast
Canadian Oil Sands & Conventional Production
Canadian Crude Oil Production and SupplyAt the beginning of each year, CAPP conducts a survey of all oil sands producers in order to form the basis of its annual long-term outlook for Canadian crude oil. This year’s expected forecast is referred to as the “Growth” Case. An additional case, known as the “Operating & In Construction” Case, is shown to provide a foundation to the expected case. This latter case represents the minimum potential growth from the oil sands as these projects are already built or are in construction. The forecast under both cases is summarized in the following table.
For the first few years of the outlook period, the latest Growth Case is similar to CAPP’s 2009 view. By the end of the period in 2025 the forecast shows a slightly higher supply outlook than previously forecasted due to the emergence of several new projects that were not part of last year’s survey.
Compared to the 2009 forecast, the Upgraded Light crude oil supply portion is lower since many companies have reconsidered building upgrading faciliites and producers anticipate using more upgraded crude oil as diluent.
Canadian Crude Oil Production
million b/d 2009 2015 2020 2025
Growth 2.72 3.29 3.88 4.34
Operating & In Construction
2.72 3.20 3.16 2.98
In the Operating & In Construction Case, production is forecast at only 3.0 million b/d by 2025 due to the decline in conventional production. The rate of decline in overall conventional production that has been exhibited in recent years is expected to slow somewhat. The use of newer technology in mature fields in Saskatchewan, Alberta and Manitoba is expected to increase light crude oil production from these provinces during the next few years. Of particular note, the industry optimism over the potential increased production from the Cardium oil plays in Alberta is similar to that generated by the Bakken formation in Saskatchewan over the last couple of years.

ii CANADIAN ASSOCIATION OF PETROLEUM PRODUCERS
Crude Oil Markets CAPP also surveyed refiners in Canada and the U.S. to determine both the current volumes of western Canadian crude oil received and any future plans to process additional supplies.
Based on the survey results, the traditional markets in the U.S. Midwest will continue to be well served by Canadian crude oil supplies. Demand in this market will continue to grow as additional heavy oil refining capacity in the region is added to take advantage of growing volumes of heavy western Canadian crude oil. However, growing volumes of Canadian heavy supply also means that new markets for these volumes must be found. The U.S. Gulf Coast is one such market. Western Canadian producers will be able to tap into more of this large market around 2013, once the Keystone XL Pipeline is in service. Growing Asian oil demand also represents a potential future market for Canadian crude oil production.
Crude Oil Pipelines and ExpansionsIn 2010, 885,000 b/d of new pipeline capacity exiting the Western Canada Sedimentary Basin was added and another 855,000 b/d has been approved that could go into service over the next few years. In addition, there are other projects being proposed that could add capacity. These pipeline projects will provide producers with increased access to traditional markets as well as access to the Gulf Coast and offshore West Coast markets. Such market diversity is important for producers who are investing large amounts of capital in order to grow crude oil production. The timing of the approved projects going into service, however, will mean that excess pipeline capacity out of the basin will exist until around 2022, when growth in crude oil supply is expected to reach over 4.0 million b/d.
PADD II
PADD I
PADD V
PADD III
62 [65]
107 [380+]
3,711
1,215 [1,788]
451 [512]
622
2,730
Non-US14
148 [193]
258 [280]
Supply
2009 - 2,4932015 - 3,275
1,394
8,928
398
PADD IV
238 [250]
613
2010 Total Refining Capacity
2009 ActualDemand
Additional Demand - 2015 Potential
Market Demand for Western Canadian Crude Oil – Actual 2009 vs 2015 Potential thousand barrels per day

Crude Oil Forecast, Markets & Pipelines iii
Portland
Montréal
Sarnia
PhiladelphiaChicago
Cushing
St. Paul
Salt Lake City
Houston
Edmonton
Anacortes
Burnaby
TransCanada Keystone& Cushing Extension
Enbridge Alberta Clipper
TransMountain
BP
Enbridge
Mid
Val
ley
Cap
line
Flanagan
Hardisty
Centurion Pipeline
Express
Platte
Enbridge (North Dakota) Expansion
Spearhead South Spearhead North
Superior
WoodRiver
ExxonMobil/Enbridge Pegasus
Clearbrook
2
3
1
Guernsey
TransCanadaKeystone XL
Kinder MorganTMX2 ExpansionTMX3 Expansion
5
Kitimat
6
Enbridge Gateway4
Kinder MorganTMX Northern Leg
Port Arthur
Mustang
Patoka
Canadian and U.S. Oil PipelinesEnbridge Pipelines, AB Clipper and connections to the U.S. MidwestKinder Morgan Express
Kinder Morgan Trans MountainTransCanada KeystoneProposed pipelines to the West Coast
Existing / Proposed pipelines to PADD III
Expansion to existing pipeline
Canadian & U.S. Crude Oil Pipelines - All Proposals

iv CANADIAN ASSOCIATION OF PETROLEUM PRODUCERS
TABLE OF CONTENTSEXECUTIVE SUMMARY i
LIST OF FIGURES AND TABLES v
1 INTRODUCTION 1
2 CRUDE OIL PRODUCTION AND SUPPLY FORECAST 2
2.1 Canadian Crude Oil Production 2
2.2 Western Canadian Crude Oil Production 3
2.2.1 Oil Sands 3
2.2.2 Conventional Crude Oil Production 5
2.3 Western Canadian Crude Oil Supply 6
2.4 Methodology 7
2.5 Production and Supply Summary 8
3 CRUDE OIL MARKETS 9
3.1 Canada 10
3.1.1 Western Canada 10
3.1.2 Ontario 10
3.1.3 Québec 10
3.2 United States 11
3.2.1 PADD I (East Coast) 11
3.2.2 PADD II (Midwest) 12
3.2.3 PADD III (Gulf Coast) 14
3.2.4 PADD IV (Rockies) 15
3.2.5 PADD V (West Coast) 15
3.3 Asia 16
3.4 Methodology 17
3.5 Markets Summary 17
4 CRUDE OIL PIPELINES 18
4.1 Existing Major Oil Pipelines Exiting Western Canada 19
4.2 Oil Pipelines to the U.S. Midwest 20
4.3 Oil Pipelines to the U.S. Gulf Coast 21
4.4 Oil Pipelines to the West Coast 22
4.5 Other Pipelines 23
4.6 Diluent Pipelines 23
4.7 Pipeline Summary 23
GLOSSARY 24
APPENDIX A: Acronyms, Abbreviations, Units and Conversion Factors 26
APPENDIX B: CAPP Canadian Crude Oil Production and Supply Forecast 2010 – 2025 27
APPENDIX C: Crude Oil Pipelines and Refineries 31

Crude Oil Forecast, Markets & Pipelines v
LIST OF FIGURES AND TABLESFiguresFigure 2.1 Canadian Oil Sands & Conventional Production 3
Figure 2.2 Growth Case - Western Canada Oil Sands & Conventional Production 4
Figure 2.3 Oil Sands Regions 4
Figure 2.4 Operating & In Construction - Western Canada Oil Sands & Conventional Production 5
Figure 2.5 Growth Case - Western Canada Oil Sands & Conventional Supply 7
Figure 2.6 Operating & In Construction - Western Canada Oil Sands & Conventional Supply 8
Figure 3.1 Market Demand for Western Canadian Crude Oil – 2009 Actual vs 2015 Potential 9
Figure 3.2 Western Canada: Forecast Western Canadian Crude Oil Receipts 10
Figure 3.3 Ontario: Forecast Western Canadian Crude Oil Receipts 10
Figure 3.4 Petroleum Administration for Defense Districts 11
Figure 3.5 2009 PADD I: Foreign Sourced Supply by Type and Domestic Crude Oil 11
Figure 3.6 2009 PADD II: Foreign Sourced Supply by Type and Domestic Crude Oil 12
Figure 3.7 PADD II (North): Forecast Western Canadian Crude Oil Receipts 12
Figure 3.8 PADD II (East): Forecast Western Canadian Crude Oil Receipts 13
Figure 3.9 PADD II (South): Forecast Western Canadian Crude Oil Receipts 14
Figure 3.10 2009 PADD III: Foreign Sourced Supply by Type and Domestic Crude Oil 14
Figure 3.11 PADD IV: Forecast Western Canadian Crude Oil Receipts 15
Figure 3.12 2009 PADD V: Foreign Sourced Supply by Type and Domestic Crude Oil 15
Figure 3.13 Washington: Forecast Western Canadian Crude Oil Receipts 16
Figure 4.1 Existing and Approved Canadian and U.S. Crude Oil Pipelines 18
Figure 4.2 Canadian & U.S. Crude Oil Pipelines - All Proposals 21
TablesTable 2.1 Canadian Crude Oil Production 2
Table 2.2 Western Canadian Crude Oil Production 3
Table 2.3 Western Canadian Crude Oil Supply 6
Table 3.1 Summary of Major Announced Refinery Upgrades in Eastern PADD II 13
Table 3.2 Summary of Major Announced Refinery Upgrades in PADD III 15
Table 3.3 Total Oil Demand in Major Asian Countries 16
Table 4.1 Capacity of Major Crude Oil Pipelines Exiting the WCSB 19
Table 4.2 Summary of Oil Pipelines to the U.S. Midwest 20
Table 4.3 Summary of Oil Pipelines to the U.S. Gulf Coast 22
Table 4.4 Summary of Oil Pipelines to the West Coast 23

1 CANADIAN ASSOCIATION OF PETROLEUM PRODUCERS
INTRODUCTION
Each year, CAPP develops a long-term outlook for Canadian crude oil production. Since 2007, this report has been expanded to include a market outlook and a comprehensive summary of the pipeline proposals that would allow growing volumes of Canadian crude oil to access new markets and expand deliveries to traditional markets. Ultimately, the goal of this report is to provide industry with a timely and objective view of the changes in crude oil supply availability over the next 15 years. The report is also meant to help develop an understanding of the major trends affecting industry.
1
The forecast incorporates the latest available information on economic and industry trends affecting crude oil production in Canada. The 2009 forecast exhibited a tempered rate of growth relative to prior year forecasts and was a reflection of the deferrals of many oil sands projects announced last year. This was the direct response by producers to the 2008-09 economic downturn and lower oil prices at the time. In contrast, the economic climate has recovered somewhat during the preparation of this latest forecast. In the first quarter of 2010, WTI oil prices increased to the US$70-85 per barrel range, a range which meets the required threshold for certain oil sands projects to be economic. In response, several companies are now actively developing phases of their projects that had previously been placed on hold.
For the initial part of the outlook period, this latest forecast is similar to CAPP’s 2009 forecast. By the end of the forecast period in 2025, the forecast shows a slightly higher supply outlook than previously forecasted due to the emergence of several new projects that were not part of last year’s survey. This improved outlook for the industry coincides with the new investments in oil sands projects by major Chinese companies. These investments will be a source of future production growth and are part of the reason for the slightly improved Canadian crude oil supply outlook from last year’s forecast. CAPP’s estimate of industry capital spending for oil sands development is $13 billion for 2010 compared to $11 billion spent in 2009.
The forecast for U.S. market demand is relatively unchanged from the 2009 report. The greatest demand for western Canadian crude oil in the U.S. is expected to come from refineries in PADD II, the traditional market for western Canadian crude oil. The completion of new pipeline capacity, however, will provide access to U.S. Gulf Coast refiners and is reflected in higher PADD III demand in the future.
The outline of the report is as follows:
• Chapter 1 provides an introduction to the report
• Chapter 2 discusses the latest crude oil production and supply forecast
• Chapter 3 summarizes the major potential crude oil markets
• Chapter 4 describes the existing major crude oil pipeline network and proposed expansions

Crude Oil Forecast, Markets & Pipelines 2
The latest forecast is based on a survey of all oil sands producers that CAPP conducted in early 2010. A 100 per cent response rate was obtained from CAPP member companies. Estimates based on publicly available information were used to include any of the projects by non-members for which the survey did not cover. From this data, CAPP adjusted the startup date and production profile for each project or expansion phase, as was necessary, to reflect its assessment of the outlook for the project and the historical performance trends of the industry. The forecasted year over year growth took into account the availability of capital and labour and the experience of the project operators. Producers were requested to use their own expectations for future crude oil prices in determining the production profile from their projects.
CAPP’s forecast of conventional production was established based on internal analysis and a series of informal discussions with various provincial government departments and agencies.
Table 2.1 Canadian Crude Oil Production
million b/d 2009 2015 2020 2025
Growth 2.72 3.29 3.88 4.34
Operating & In Construction 2.72 3.20 3.16 2.98
2.1 Canadian Crude Oil ProductionThe Western Canada Sedimentary Basin (WCSB) which underlies most of Alberta, and parts of Saskatchewan, British Columbia, Manitoba and the Northwest Territories is the primary source of Canadian crude oil production. In 2009, Canadian oil production was 2.7 million b/d with 2.5 million b/d sourced from western Canada.
In 2009, production in Atlantic Canada was 268,000 b/d, a decrease of almost 75,000 b/d from 2008 production that was primarily due to reduced production from the Terra Nova field and planned maintenance work at the White Rose field. Future declines in production from existing fields is expected to be tempered with increased production from satellite fields coming online in the near-term and then offset with the growth in production from Hibernia South and then the Hebron heavy oil project.
This year’s expected forecast is referred to as the “Growth” Case. An additional case which includes only projects currently “Operating” or “In Construction”, is shown to provide a foundation to the expected case (Figure 2.1). Table 2.1 shows that in the Growth Case, production is expected to reach 4.3 million b/d in 2025. Under the Operating & In Construction Case, production increases but then declines in the latter part of the forecast to 3.0 million b/d by 2025 primarily due to the fall in conventional production.
CRUDE OIL PRODUCTION AND SUPPLY FORECAST2
In Canada, crude oil is primarily produced from the western provinces, the Northwest Territories and Atlantic Canada. Oil sands production first surpassed conventional production in 2006. Since then, the oil sands deposits in Alberta continue to be the main focus of future oil production growth from western Canada. Conventional production from mature oil fields continues to decline. However; in recent years, the Bakken oil formation in Saskatchewan and now the Cardium oil formation in Alberta have generated significant interest. Production from Atlantic Canada contributed approximately 10 per cent of Canadian production in 2009. The Oil and Gas Journal has estimated Canada’s oil reserves at over 175 billion barrels - the second largest in the world.

3 CANADIAN ASSOCIATION OF PETROLEUM PRODUCERS
2.2 Western Canadian Crude Oil ProductionIn 2009, 2.4 million b/d of crude oil were produced from Western Canada with the majority of these volumes coming from the oil sands and the remaining portion recovered from conventional oil fields.
Table 2.2 shows the forecast for total western Canadian crude oil production in both cases. This latest forecast is similar to CAPP’s 2009 forecast for most of the outlook period. However, where growth was previously essentially flat during 2020 to 2025, this latest forecast shows a steady and continued growth (Figure 2.2). This growth reflects a change in the activity status of certain projects and a higher likelihood that they will be developed. The production forecast in the Operating & In Construction Case is higher than in the previous forecast with the inclusion of additional projects that are currently under active development (Figure 2.4).
Table 2.2 Western Canadian Crude Oil Production
million b/d 2009 2015 2020 2025
Growth 2.45 3.10 3.69 4.19
Operating & In Construction 2.45 3.01 2.97 2.83
2.2.1 Oil SandsOil sands production currently makes up 55 per cent of western Canada’s total crude oil production. In the Growth Case, production is expected to grow from over 1.3 million b/d in 2009 to approximately 2.2 million b/d in 2015 and to about 3.5 million b/d in 2025. Given signs of the beginning of economic recovery, oil sands producers are proceeding with a more balanced pace of development. Producers have returned many projects back to active development but remain mindful to establish a more controlled cost environment as they remain cautious with their estimates for future oil prices.
The exploration costs associated with oil sands production are relatively insignificant because the location of the resource is well known. However, the development costs are high. Costs associated with either open-pit mining techniques or steam injection to recover bitumen located further below the surface are higher than for conventional production. In addition, costs are being incurred to manage the effect of oil sands development on the environment as industry continues to look for ways to minimize its environmental footprint.
20252023202120192017201520132011200920072005
Conventional HeavyConventional LightPentanes
Oil Sands Growth
Oil Sands Operating & In Construction
0
1,000
2,000
3,000
4,000
5,000
thousand barrels per day
Atlantic CanadaForecastActual
June ‘09 Forecast
Figure 2.1 Canadian Oil Sands & Conventional Production

Crude Oil Forecast, Markets & Pipelines 4
Figure 2.3 Oil Sands Regions
Canada’s oil sands deposits are divided into three major regions in northern Alberta referred to as the Athabasca, Cold Lake and Peace River deposits (Figure 2.3). The Alberta Energy Resources and Conservation Board (ERCB) estimated at year-end 2008, that these areas contain remaining established reserves of 170 billion barrels.
Of the remaining established reserves in Alberta, 135 billion barrels, or 80 per cent, is considered recoverable by in situ methods and 35 billion barrels from surface mining. In situ recovery includes both primary methods, which are similar to conventional production, and methods whereby steam, water, or other solvents are injected into the reservoir to reduce the viscosity of the bitumen, allowing it to flow to a vertical or horizontal wellbore.
There are also smaller deposits in northwest Saskatchewan, next to the Athabasca oil sands deposit. The Saskatchewan Ministry of Energy and Resources has estimated 2.7 million hectares of potential land but the resource base has not been officially determined.
In 2009, over half of the total oil sands production was mined. Currently, all mined bitumen is upgraded as part of an overall integrated operation. However, bitumen production from the Imperial Kearl Lake mining project, which is slated to come online in 2012, will not be affiliated with its own upgrader. In addition, a recent update on the future expansion at Syncrude notes that bitumen production will exceed the upgrader’s processing capacity. Under current conditions where a narrow price differential exists between light and heavy crude oil, the economics of building new upgrading facilities are not favorable.
0
000
000
000
000
000
20252023202120192017201520132011200920072005
Actual Forecast
In Situ
Mining
Conventional HeavyConventional LightPentanes
thousand barrels per day
0
June ‘09 Forecast
5,000
4,000
3,000
2,000
1,000
Edmonton
Calgary
Lloydminster
Peace River
Fort McMurray Area of
Potential
Athabasca Deposit
Cold Lake Deposit
Peace River Deposit
Figure 2.2 Growth Case - Western Canada Oil Sands & Conventional Production

5 CANADIAN ASSOCIATION OF PETROLEUM PRODUCERS
Recovery of raw bitumen using in situ methods is set to surpass production from mining methods by 2016. Currently, of the in situ projects in operation, only the Long Lake Project operated by Nexen Inc. is coupled with upgrading facilities. Also, production from the Suncor Firebag and MacKay River projects are upgraded at Suncor’s facilities. Otherwise, the majority of in situ bitumen production is not upgraded prior to reaching markets.
The integrated mining and upgrading projects in operation are listed below:
• The Suncor Steepbank and Millennium Mine;
• The Syncrude Mildred Lake and Aurora Mine;
• The Athabasca Oil Sands Project (AOSP); and
• The CNRL Horizon Project, which produced its first oil in February 2009.
In 2010, production from the CNRL Horizon Project is expected to continue to ramp up as the project reaches design capacity. The expansion by Syncrude, the Shell Jackpine and the Imperial Kearl Lake Project, are the three major mining projects currently under construction.
In the Operating & In Construction Case, oil sands production is expected to grow from over 1.3 million b/d in 2009 to approximately 2.1 million b/d in 2015 and beyond (Figure 2.4). Please refer to Appendices B.1 and B.2 for detailed production data tables.
2.2.2 Conventional Crude Oil ProductionThe WCSB is a mature basin and conventional crude oil production has been declining for years. In 2009, overall conventional production was 946,000 b/d, which was almost 6 per cent lower than production in 2008. However, this decline rate is expected to slow with renewed interest in the Cardium oil formation in Alberta, which is causing optimism in the industry similar to that generated by the Bakken formation in Saskatchewan over the last several years.
As of 2008, the Alberta Geological Survey estimated that over 70 percent of the 1.9 billion barrels of initial established recoverable reserves in the Cardium oil formation was already produced. While the Cardium oil play is not a new discovery, the use of horizontal drilling combined with fracturing stimulation techniques, has dramatically increased the potential recovery factor in these fields.
thousand barrels per day
Actual Forecast
0
000
000
000
000
000
20252023202120192017201520132011200920072005
In Situ
Mining
Conventional HeavyConventional LightPentanes
0
1,000
2,000
3,000
4,000
5,000
June ‘09 Forecast
Figure 2.4 Operating & In Construction - Western Canada Oil Sands & Conventional Production

Crude Oil Forecast, Markets & Pipelines 6
In March 2010, the Alberta Government announced that effective January 2011, it would make permanent an incentive feature of its royalty system program that limits the royalty rate on new conventional oil wells for the first 50,000 barrels of production to five per cent. In addition, the government announced that the maximum royalty rate for conventional oil would be reduced at higher price levels from 50 per cent to 40 per cent. These fiscal initiatives should improve the attractiveness of developing conventional oil resources in Alberta and help to stimulate production from these resources.
Saskatchewan light crude oil production increased by a modest one per cent in 2009. This growth is attributed to the light oil production from the Bakken oil formation in south east Saskatchewan. The Bakken play is considered one of the most attractive conventional oil plays in Canada. The decline in heavy crude oil production in Saskatchewan has been offset somewhat by the production from the Lower Shaunavon field.
In Manitoba, the use of newer technology has also played a major role. In 2009, production rose nine per cent due mostly to the increased use of horizontal drilling wells that recover significantly more crude oil than traditional vertical wells. As a result, a higher production rate than previously forecast is expected to be maintained over the next few years.
2.3 Western Canadian Crude Oil SupplyThe bitumen produced from the oil sands is a form of heavy crude oil that is so viscous that it must be either converted into light crude oil, or diluted with lighter hydrocarbons in order to be transported by pipeline to market. The distinction between the various types of crude oil supplies is important since refineries are configured to process particular crude oil types. On a volumetric basis, supply is greater than production due to the inclusion of imported condensate needed to supplement the locally produced volumes of condensate used to dilute non-upgraded bitumen production for transport to market.
The CAPP forecast categorizes the various crude oil types that comprise western Canadian crude oil supply into four major categories: Conventional Light, Conventional Heavy, Upgraded Light and Bitumen Blend. The “Bitumen Blend” category includes upgraded heavy sour crude oil, bitumen diluted with upgraded light crude oil (also known as
“SynBit”) and bitumen diluted with condensate (also known as “Dilbit”). The most common form of Bitumen Blend is bitumen blended with a standard condensate such as pentanes plus, which is mainly recovered from processing natural gas, to create a type of crude oil that meets pipeline specifications for density and viscosity. An example of such a Dilbit would be Cold Lake crude, which has a density of about 930 kg/m3 (21° API) and a sulphur content of 3.6 per cent. Blending for dilbit requires a 70:30 bitumen to condensate ratio while blending for synbit changes the ratio to approximately 50:50.
Although the main source of diluent is natural gas condensate that is produced in western Canada, the needs of growing bitumen production exceeds this diluent supply. An average of over 60,000 b/d of diluent were imported into Alberta by rail in 2009. This latest forecast is not constrained by the availability of condensate imports. Imports are expected to increase once the Enbridge Southern Lights pipeline is in service in July 2010. The forecast assumes that demand for condensate imports will exceed the pipeline’s initial capacity of 180,000 b/d by 2015, so an expansion of this pipeline may be required.
Some producers have indicated their intention to use upgraded light crude oil as diluent instead of condensate. Conseqently, this latest forecast reflects a greater use of upgraded synthetic crude oil as a source of diluent than the 2009 forecast did. Thus for a given level of bitumen production, crude oil supply levels will be correspondingly lower than would be the case in the previous forecast where more imported condensate was anticipated to be used as diluent.
Table 2.3 Western Canadian Crude Oil Supply
million b/d 2009 2015 2020 2025
Growth 2.49 3.28 3.81 4.53
Operating & In Construction 2.49 3.17 3.13 3.00
Table 2.3 shows the projections for total western Canadian crude oil supply. Please refer to Appendices B.3 and B.4 for detailed data. In the Growth Case, Upgraded Light crude oil supply is projected to grow from about 653,000 b/d in 2009 to 896,000 b/d in 2015 and 1.2 million b/d by 2025.

7 CANADIAN ASSOCIATION OF PETROLEUM PRODUCERS
Figure 2.5 Growth Case - Western Canada Oil Sands & Conventional Supply
thousand barrels per day
* Bitumen Blend includes some volumes of upgraded heavy sour crude oil and bitumen blended with diluent or ugpraded crude oil.
Actual Forecast
0
1000
2000
3000
4000
5000
20252023202120192017201520132011200920072005
Conventional Light
Bitumen Blend*
Upgraded Light
Conventional Heavy
0
1,000
2,000
3,000
4,000
5,000
June '09 Forecast
The Upgraded Light crude oil supply includes the light crude oil volumes produced from:
• Upgraders that process conventional heavy oil, e.g., the Husky Upgrader at Lloydminister and the CCRL Upgrader in Regina;
• Integrated mining and upgrading projects, e.g., Suncor, Syncrude and CNRL operations;
• Integrated in situ projects, e.g., the Nexen Long Lake project;
• Offsite upgraders, e.g., the Athabasca Oil Sands Project; and
• One Merchant Upgrader
Compared to the 2009 forecast, the Upgraded Light crude oil supply is lower since many companies have reconsidered building upgrading facilities and more projects anticipate using more upgraded crude oil as diluent. Correspondingly, Bitumen Blend, which makes up the heavy crude oil supply from the oil sands, is forecast to increase from 970,000 b/d in 2009 to 1.7 million b/d in 2015 and up to 2.8 million b/d in 2025 (Figure 2.5).
In the Operating & In Construction Case, the limited growth projected from the oil sands projects can no longer offset the declines in conventional production by 2015 (Figure 2.6). The supply of Upgraded Light crude oil is forecast to grow from 653,000 b/d in 2009 to 940,000 b/d in 2015. Bitumen Blend is forecast to grow from 970,000 b/d in 2009 to 1.5 million b/d in 2015. From 2015 to the end of the forecast period, supply of both upgraded light crude oil and Bitumen Blend is essentially flat. In this case, there would be sufficient condensate imports available throughout the forecast period once the Enbridge Southern Lights Diluent Pipeline is in service.
2.4 MethodologyCAPP did not survey conventional crude oil producers but instead relied upon historical trends, recent announcements and discussions with provincial government representatives to derive its forecast.
From the results of the survey of oil sands producers, CAPP determined the amount of upgraded crude oil and bitumen that could potentially be available to the market.

Crude Oil Forecast, Markets & Pipelines 8
The following key assumptions have been used to determine available oil sands supply:
a) All bitumen must be blended with either condensate or upgraded light crude oil to meet pipeline specifications;
b) Condensate is the preferred diluent over upgraded light crude oil;
c) In July 2010, the Southern Lights Pipeline will provide additional diluent to western Canadian producers;
d) Prior to the in service of the Southern Lights Pipeline, railed imports will compensate for the shortfall of western Canadian condensate required by producers.
2.5 Crude Oil Production and Supply SummaryThe overall production forecast is similar to the 2009 outlook. The average annual growth rate in oil sands production is six per cent over the forecast period. The 2009 volumes of oil sands production of 1.3 million b/d is forecast to increase to 2.2 million b/d in 2015 then to 3.5 million b/d by 2025. Many oil sands producers that previously put projects on hold have now confirmed that
that they will proceed with these projects given the more favorable economic outlook. Other projects are also considered more likely to proceed given the support of new investment capital.
Some companies have redefined the scope of their projects and have excluded the building of upgrading facilities as light and heavy oil price differentials have narrowed. As a result of this and the anticipated greater use of Upgraded Light crude oil as a diluent, the supply from western Canada will be comprised of more heavy crude oil and less light crude oil volumes than previously forecast.
The use of newer technology is expected to increase light oil production in mature fields in Saskatchewan, Alberta and Manitoba during the next few years. Production from Atlantic Canada is expected to increase in 2017 once the Hebron Project is online.
0
000
000
000
000
000
20252023202120192017201520132011200920072005
Actual Forecast
Conventional Light
Bitumen Blend*
Upgraded Light
Conventional Heavy
* Bitumen Blend includes some volumes of upgraded heavy sour crude oil and bitumen blended with diluent or ugpraded crude oil.
0
1,000
2,000
3,000
4,000
5,000
thousand barrels per day
June '09 Forecast
Figure 2.6 Operating & In Construction - Western Canada Oil Sands & Conventional Supply

9 CANADIAN ASSOCIATION OF PETROLEUM PRODUCERS
3
The markets that hold the greatest potential to be supplied by western Canadian crude oil producers depends on a number of fundamental characteristics including: the availability of alternative sources of supply; the size of the market; and feedstock requirements. Thus, the location, size and the number of refineries in an area configured to process the types of crude oil produced in Canada are particularly relevant considerations. In early 2010, CAPP surveyed refineries in Canada and the U.S. to determine their current capability and future plans to process additional supplies from Canada (Figure 3.1).
CRUDE OIL MARKETS
PADD II
PADD I
PADD V
PADD III
62 [65]
107 [380+]
3,711
1,215 [1,788]
451 [512]
622
2,730
Non-US14
148 [193]
258 [280]
Supply
2009 - 2,4932015 - 3,275
1,394
8,928
398
PADD IV
238 [250]
613
2010 Total Refining Capacity
2009 ActualDemand
Additional Demand - 2015 Potential
In 2009, available crude oil supply from western Canada was 2.5 million b/d. Domestic demand for western Canadian crude oil was 709,600 b/d and the remaining supply of over 1.8 million b/d or 72 per cent was exported (Figure 3.1). Eastern PADD II (particularly, Illinois, Indiana, Michigan, Ohio and Minnesota) is the largest market for western Canadian
crude oil. The other primary markets are currently: British Columbia; Alberta; Saskatchewan; Ontario; PADD IV; California and Washington in PADD V. Once all approved pipeline projects are in service, western Canadian crude oil supplies will have an opportunity to capture a greater share of the large U.S. Gulf Coast refinery market.
Figure 3.1 Market Demand for Western Canadian Crude Oil – Actual 2009 vs 2015 Potential
thousand barrels per day

Crude Oil Forecast, Markets & Pipelines 10
3.1 CanadaCanadian refineries that have access to western Canadian crude oil have a total refining capacity of over one million b/d. In 2009, these refineries processed about 709,600 b/d of western Canadian crude oil. This is expected to increase to approximately 791,600 b/d by 2015 with planned refinery expansions.
3.1.1 Western Canada There are eight refineries located in western Canada with a total refining capacity of about 622,000 b/d. These refineries process western Canadian crude oil exclusively. In 2009, they received 451,100 b/d of crude oil and this is expected to increase to 511,700 b/d in 2015 (Figure 3.2). The Moose Jaw asphalt plant in Moose Jaw, Saskatchewan produces mostly asphalt while other refineries manufacture a wide range of petroleum products.
Figure 3.2 Western Canada: Forecast Western Canadian Crude Oil Receipts
Receipts of conventional light sweet crude oil are expected to be flat. Suncor’s (previously Petro-Canada’s) Edmonton refinery is expected to operate more efficiently over time as its conversion project was just completed in January 2009. The refinery is configured to process 100 per cent oil sands feedstock, which consists of mostly heavy crude oil. The increase in the use of light synthetic crude oil as feedstock in 2012 is related to plans for the Consumers’ Co-operatives refinery located in Regina to expand by 30,000 b/d.
3.1.2 OntarioThere are four refineries (excluding the Nova Chemical refinery and petrochemical complex in Sarnia) located in Ontario with a total refining capacity of 398,000 b/d. These refineries process western Canadian crude oil as well as crude oil (foreign imports and Atlantic Canada production) that is received by tankers via the Portland-to-Montréal Pipeline and, subsequently transported on the Enbridge Montréal-to-Sarnia Pipeline (Line 9). Ontario refineries have, for a number of years, selected their feedstock sources based on both availability and pricing.
According to Statistics Canada, Ontario refineries received 339,500 b/d of crude oil in 2009 from the following sources: Western Canada (258,500 b/d or 76 per cent); Eastern Canada (12,100 b/d or 4 per cent); United States (13,600 b/d or 4 per cent); Saudi Arabia (12,800 b/d or 4 per cent); the United Kingdom (10,500 b/d or 3 per cent); and other foreign sources (32,000 b/d or 9 per cent). Receipts of western Canadian crude oil are projected to remain flat for the forecast period (Figure 3.3).
Figure 3.3 Ontario: Forecast Western Canadian Crude Oil Receipts
3.1.3 QuébecQuébec had three refineries. In November 2009, Shell announced plans to close its refinery in Montréal and transform the facility into a terminal. The remaining Montréal refinery is owned by Suncor (previously Petro-Canada) and has a capacity of 130,000 b/d. The refinery in Québec City has a capacity of 265,000 b/d.
thousand barrels per dayTotal refining capacity = 622
0
100
200
300
400
500
600
Light SyntheticConventional Light SweetConventional Medium SourHeavy
2015201420132012201120102009
thousand barrels per dayTotal refining capacity = 398
0
50
100
150
200
250
300
350
400
Light SyntheticConventional Light SweetConventional Medium SourHeavy
2015201420132012201120102009

11 CANADIAN ASSOCIATION OF PETROLEUM PRODUCERS
The Montréal refinery can process crude from both eastern Canada and foreign sources received from the Portland-to-Montréal pipeline. In September 2009, Suncor announced that the previously proposed project for the addition of a 25,000 b/d coker at its refinery in Montréal has been cancelled. The reasons cited include a change of market conditions and the need to select the optimal investment opportunities from the many available following the Suncor and Petro-Canada merger.
3.2 United StatesThe United States, with a total refining capacity of almost 18 million b/d, is the world’s largest oil market. In 2009, Canada was by far the largest exporter of crude oil to the U.S., significantly ahead of other exporting countries including, Venezuela, Mexico and Saudi Arabia. Canada exported over 1.9 million b/d, which was equivalent to 22 per cent of total U.S. imports from foreign sources. Of this volume, 1.8 million b/d was sourced from Western Canada (Figure 3.1) The U.S. demand for western Canadian oil supply is expected to reach 2.7 million b/d in 2015. The bulk of this growth is expected to be heavy crude oil. Although overall U.S. crude oil demand is not expected to increase significantly, western Canadian crude oil should supply a growing share of this market. Declines in imports from other major suppliers to this market is expected due to either falling production or a focus on expanding into new export markets such as Asia, where significant oil demand is expected in the future.
Figure 3.4 Petroleum Administration for Defense Districts
The U.S. Department of Energy divides the 50 states in the U.S. into five Petroleum Administration for Defense Districts or PADDs (Figure 3.4). The PADDs were originally delineated during World War II for oil allocation purposes and remain the convention for describing U.S. oil markets.
3.2.1 PADD I (East Coast)PADD I is located along the east coast of the United States. There are 11 refineries in Georgia, New Jersey, Pennsylvania, Virginia and West Virginia with a total capacity of almost 1.4 million b/d. Refineries on the East coast are more vulnerable to closures due to age, location and easy access to petroleum products from European refineries. Notably, Sunoco and Valero both shut down their refineries during 2009, resulting in a loss of refining capacity of about 360,000 b/d. A combination of operational issues, maintenance shutdowns and refinery closures resulted in lower overall volumes of crude oil processed in PADD I in 2009 compared to 2008.
Figure 3.5 2009 PADD I: Foreign Sourced Supply by Type and Domestic Crude Oil
In 2009, imports of foreign crude oil by refineries in PADD I totaled 1.1 million b/d and over 60 per cent of these volumes were light crude (Figure 3.5). PADD I imported 211,800 b/d of crude oil from Canada. About 61,700 b/d came from western Canada and was primarily delivered by pipeline to the United refinery in Warren, Pennsylvania. Deliveries of western Canadian crude oil into this market is expected to remain flat through to 2015.
Domestic crude
Light Sweet*Light/Medium
Sour
Heavy
thousand barrels per dayTotal refining capacity = 1,394
211
242700
105
* Includes small volumes of Medium Sweet Source: EIA
PADD II:Midwest
PADD I:East Coast
PADD IV:Rockies
PADD V:West Coast, AK, HI
PADD III:Gulf Coast
AL
AK
AZ
AR
CACO
CT
DE
GA
ID
IL IN
IA
KSKY
LA
ME
MD
MA
MI
MN
MS
MO
MT
NE
NV
NH
NJ
NM
NY
ND
OH
OK
OR
PA
SD
TN
TX
UT
VT
VA
WA
WV
WI
HI
SC
NC
FL
RIWY

Crude Oil Forecast, Markets & Pipelines 12
3.2.2 PADD II (Midwest)PADD II is located in the U.S. Midwest and has historically been the single largest market for western Canadian crude oil, with a refining capacity of 3.7 million b/d. In 2009, PADD II refineries received almost 1.4 million b/d of foreign sourced crude oil and over half these volumes were heavy crude oil (Figure 3.6). Crude oil from western Canada totaled over 1.2 million b/d, making Canada the primary supplier.
Figure 3.6 2009 PADD II: Foreign Sourced Supply by Type and Domestic Crude Oil
The technological advancements used on the Bakken shale deposit in North Dakota can be largely credited for the state’s production growth in light oil in recent years. This increase in domestic production has reduced the need for crude oil imports. Current imports of heavy oil supplies from western Canada have already saturated this market. Although there are plans for some refineries to upgrade and increase their capacity for refining heavy crude oil, the increased growth in supplies of heavy western Canadian crude oil is expected to exceed the additional volumes that could be processed at refineries in this traditional market.
The U.S. Energy Information Administration further divides PADD II into three refining districts, which is used in the following discussion.
.
Northern PADD II
Northern PADD II consists of North Dakota, South Dakota, Minnesota and Wisconsin. There is one refinery in both North Dakota and Wisconsin and two refineries in Minnesota. These four refineries have a total refining capacity of 489,000 b/d. In 2009, imports into northern PADD II were 298,400 b/d and western Canadian crude oil accounted for almost all of it. Imports of western Canadian crude oil are expected to grow to 384,900 b/d by 2011 and remain flat afterwards (Figure 3.7). The Minnesota refineries owned by Flint Hills and Marathon Oil, have access to western Canadian crude oil supplies via the Minnesota Pipeline, which has a capacity of 465,000 b/d.
Figure 3.7 PADD II (North): Forecast Western Canadian Crude Oil Receipts
Domestic Crude
LightSweet*
Light/Medium Sour
Heavy
thousand barrels per dayTotal refining capacity = 3,711
804
243
1,757
331
* Includes small volumes of Medium Sweet Source: EIA
thousand barrels per dayTotal refining capacity = 489
0
50
100
150
200
250
300
350
400
450
500
Light SyntheticConventional Light SweetConventional Medium SourHeavy
2015201420132012201120102009

13 CANADIAN ASSOCIATION OF PETROLEUM PRODUCERS
Figure 3.8 PADD II (East): Forecast Western Canadian Crude Oil Receipts
Southern PADD II Southern PADD II has seven refineries located in Kansas and Oklahoma with a total refining capacity of 802,000 b/d. The two refineries in Tulsa, Oklahoma are counted as one since Holly acquired the Sinclair refinery in December 2009 with the intention to operate the two facilities on an integrated basis. The Enbridge Spearhead pipeline was expanded in April 2009 to 190,000 b/d. The capacity of this pipeline currently limits the volumes of crude oil that western Canadian producers are able to deliver into Cushing, Oklahoma. This constraint will be removed once TransCanada’s Keystone Extension is in service.
Cushing is a hub that receives crude oil predominantly from pipelines transporting offshore crude oil delivered by tanker to the U.S. Gulf Coast. This crude oil is then distributed by a number of pipelines exiting the hub which serve refineries throughout the PADD II and PADD III regions. Thus access to the Cushing hub offer western Canadian crude oil producers some opportunities to penetrate new markets through the connected pipeline network in the region.
In 2009, refineries in this market received about 67,800 b/d of western Canadian crude oil (Figure 3.9).
Eastern PADD IIEastern PADD II consists of Michigan, Illinois, Indiana, Kentucky, Tennessee and Ohio and has 14 refineries with a total refining capacity of 2.4 million b/d. In 2009, western Canadian crude oil accounted for 848,600 b/d or 86 per cent of the total foreign imports into the region. Some previously proposed expansions have been
cancelled but there are a number of active refiner upgrades that will result in higher runs of western Canadian heavy crude oil in the next several years. The majority of growth in western Canadian supplies will be heavy crude oil types, so these upgrades provide the opportunity for western Canadian crude oil to meet this new growth in demand (Figure 3.8). Table 3.1 summarizes the projects designed to process additional volumes of Canadian crude oil.
thousand barrels per dayTotal refining capacity = 2,420
0
200
400
600
800
1,000
1,200
1,400
1,600
1,800
2,000
Light SyntheticConventional Light SweetConventional Medium SourHeavy
2015201420132012201120102009
Table 3.1 Summary of Announced Refinery Upgrades in Eastern PADD II
Operator LocationCurrent Capacity (thousand b/d)
Scheduled In-Service Description
WRB Refining Roxana, IL 306 2011 Add a 65,000 b/d coker; increase total crude oil refining capacity by 50,000 b/d; increase heavy oil refining capacity to 240,000 b/d
BP Whiting, IN 400 2012 Construction of new coker and a new crude distillation unit
Marathon Detroit, MI 102 Mid 2012 Increase heavy oil processing capacity by 80,000 b/d and increase total crude oil refining capacity to 115,000 b/d
Valero Memphis, TN 195 2012 Cat-cracking unit upgrade
Crude Oil Forecast, Markets & Pipelines 14
Figure 3.9 PADD II (South): Forecast Western Canadian Crude Oil Receipts
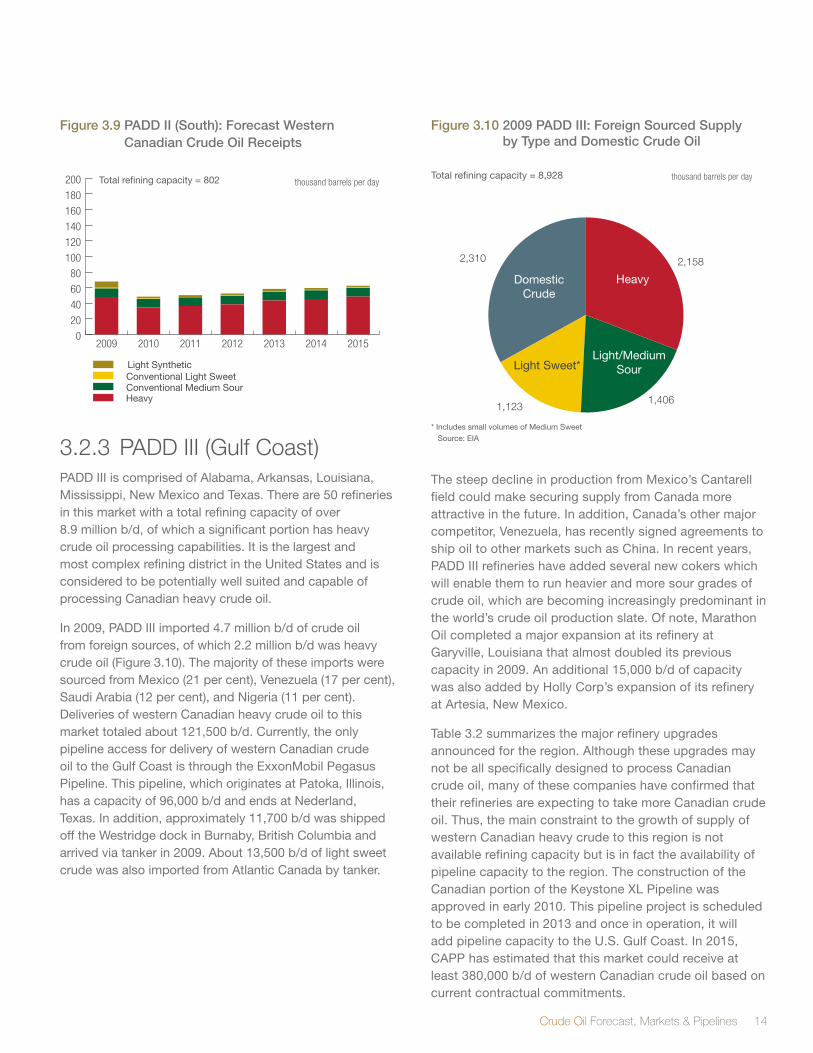
3.2.3 PADD III (Gulf Coast)PADD III is comprised of Alabama, Arkansas, Louisiana, Mississippi, New Mexico and Texas. There are 50 refineries in this market with a total refining capacity of over 8.9 million b/d, of which a significant portion has heavy crude oil processing capabilities. It is the largest and most complex refining district in the United States and is considered to be potentially well suited and capable of processing Canadian heavy crude oil.
In 2009, PADD III imported 4.7 million b/d of crude oil from foreign sources, of which 2.2 million b/d was heavy crude oil (Figure 3.10). The majority of these imports were sourced from Mexico (21 per cent), Venezuela (17 per cent), Saudi Arabia (12 per cent), and Nigeria (11 per cent). Deliveries of western Canadian heavy crude oil to this market totaled about 121,500 b/d. Currently, the only pipeline access for delivery of western Canadian crude oil to the Gulf Coast is through the ExxonMobil Pegasus Pipeline. This pipeline, which originates at Patoka, Illinois, has a capacity of 96,000 b/d and ends at Nederland, Texas. In addition, approximately 11,700 b/d was shipped off the Westridge dock in Burnaby, British Columbia and arrived via tanker in 2009. About 13,500 b/d of light sweet crude was also imported from Atlantic Canada by tanker.
Figure 3.10 2009 PADD III: Foreign Sourced Supply by Type and Domestic Crude Oil
The steep decline in production from Mexico’s Cantarell field could make securing supply from Canada more attractive in the future. In addition, Canada’s other major competitor, Venezuela, has recently signed agreements to ship oil to other markets such as China. In recent years, PADD III refineries have added several new cokers which will enable them to run heavier and more sour grades of crude oil, which are becoming increasingly predominant in the world’s crude oil production slate. Of note, Marathon Oil completed a major expansion at its refinery at Garyville, Louisiana that almost doubled its previous capacity in 2009. An additional 15,000 b/d of capacity was also added by Holly Corp’s expansion of its refinery at Artesia, New Mexico.
Table 3.2 summarizes the major refinery upgrades announced for the region. Although these upgrades may not be all specifically designed to process Canadian crude oil, many of these companies have confirmed that their refineries are expecting to take more Canadian crude oil. Thus, the main constraint to the growth of supply of western Canadian heavy crude to this region is not available refining capacity but is in fact the availability of pipeline capacity to the region. The construction of the Canadian portion of the Keystone XL Pipeline was approved in early 2010. This pipeline project is scheduled to be completed in 2013 and once in operation, it will add pipeline capacity to the U.S. Gulf Coast. In 2015, CAPP has estimated that this market could receive at least 380,000 b/d of western Canadian crude oil based on current contractual commitments.
thousand barrels per dayTotal refining capacity = 802
0
20
40
60
80
100
120
140
160
180
200
Light SyntheticConventional Light SweetConventional Medium SourHeavy
2015201420132012201120102009
DomesticCrude
Light Sweet*Light/Medium
Sour
Heavy
thousand barrels per dayTotal refining capacity = 8,928
2,158
1,123
2,310
1,406
* Includes small volumes of Medium Sweet Source: EIA

15 CANADIAN ASSOCIATION OF PETROLEUM PRODUCERS
3.2.4 PADD IV (Rockies)PADD IV includes the states of Colorado, Montana, Utah, Wyoming and Idaho. It has 14 refineries located in four of the five states (there are no refineries in Idaho), and has a total refining capacity of 613,700 b/d. Although PADD IV is smaller than the other core markets, it has been a stable market for western Canadian crude oil supply.
In 2009, PADD IV processed 238,000 b/d of Canadian crude oil or about 44 per cent of its feedstock requirements. Canada is the only source of foreign crude oil to this market. Throughout the forecast period, western Canadian crude oil receipts are forecast to remain relatively flat (Figure 3.11).
Figure 3.11 PADD IV: Forecast Western Canadian Crude Oil Receipts
3.2.5 PADD V (West Coast)PADD V includes the states of Alaska, Washington, Oregon, California, Nevada, Arizona and Hawaii. The majority of PADD V is geographically divided from the rest of the United States by the Rocky Mountains. It has very good access to tankers, and is located in close proximity to production from Alaska and California. Nonetheless, this market still depends on foreign imports for a large portion of its requirements (Figure 3.12).
Figure 3.12 2009 PADD V: Foreign Sourced Supply by Type and Domestic Crude Oil
For the purposes of the remainder of this report, the PADD V market region will focus only on Washington and California, as these states represent both the current demand and future prospects for western Canadian crude oil.
thousand barrels per dayTotal refining capacity = 613
0
100
200
300
400
500
600
Light Sweet*
Light/Medium SourHeavy
2015201420132012201120102009
*Includes small volumes of Medium Sweet
DomesticAlaska
OtherDomestic
Light Sweet*
Light/MediumSour
Heavy
thousand barrels per dayTotal refining capacity = 3,260
413
653
726248
* Includes small volumes of Medium Sweet Source: EIA
343
Table 3.2 Summary of Major Announced Refinery Upgrades in PADD III
Operator LocationCurrent Capacity (thousand b/d)
Scheduled In-Service Description
Hunt Refining Tuscaloosa, AL 52 2010 Increase capacity to 65,000 b/d
Valero St. Charles, LA 250 2012 New 45,000 b/d hydrocracker and 10,000 b/d expansions to the crude and coker units
Motiva Enterprises
Port Arthur, TX 285 2012 Increase capacity to over 600,000 b/d

Crude Oil Forecast, Markets & Pipelines 16
WashingtonThere are five refineries in Washington that have a combined capacity of 634,000 b/d. Alaska is still the primary source of feedstock for these refineries, however, Alaskan production continues to decline. As a result, these refiners are becoming increasingly dependent on imports from Canada and other countries. In 2009, these refineries received 191,000 b/d of foreign crude oil, sourced primarily from Canada (58 per cent), Angola (11 per cent) and Saudi Arabia (13 per cent).
In 2009, receipts of western Canadian crude were 101,000 b/d. These receipts are expected to remain constant throughout the forecast period (Figure 3.13). Given the small size of this niche market, further development of this market is limited.
Figure 3.13 Washington: Forecast Western Canadian Crude Oil Receipts
California
California has 17 refineries with a total refining capacity of 2.1 million b/d. Most of the refineries are located near the coast in the Los Angeles area and in the San Francisco Bay area. These refineries account for almost 95 per cent of the refining capacity in the state. These refineries are among the most sophisticated in the world, partly due to California having the strictest environmental requirements in the United States for refined petroleum products. They have the capability to process a wide variety of crude oil types and are designed to yield a higher proportion of light products, such as gasoline. The three refineries in Bakersfield are smaller and process local California crude oil; they would not be expected to receive Canadian crude.
Californian refineries receive the majority of their supplies from California and Alaska. In 2009, 693,000 b/d of crude oil was imported from foreign sources. The top three countries that supplied these imports were Saudi Arabia (24 per cent); Iraq (19 per cent); and Ecuador (17 per cent). Canada only accounted for about six per cent of foreign imports.
The rate of decline of California production has eased over recent years compared to historical trends but the California Energy Commission still expects production to fall by 2 to 3 per cent per year in the future. Alaskan crude production is supplied primarily to Alaska and Washington, with the balance going to California. As production in Alaska continues to decline, the California refineries will need to replace their domestic crude oil sources with more imports.
3.3 AsiaAsia is the second largest world oil consumer market after North America and has attracted significant interest over the last few years because of its rising demand for energy. China is the largest consumer of oil after the United States and economic growth rates are expected to be relatively strong compared to other countries. Table 3.3 shows oil demand from 2007 to 2010 in the major Asian countries. The International Energy Agency (IEA) forecasts that oil demand from China will grow by eight per cent in 2010 with the anticipation of continued growth in the longer term. There are a number of pipeline project proposals which could take western Canadian crude oil to the west coast that could support growth in demand in this market.
Table 3.3 Total Oil Demand in Major Asian Countries
million b/d 2007 2008 2009 2010
China 7.57 7.89 8.51 9.16
India 2.97 3.09 3.26 3.33
Japan 5.04 4.78 4.36 4.28
Korea 2.24 2.17 2.22 2.22
Source: International Energy Agency (IEA), May 2010
thousand barrels per dayTotal refining capacity = 634
0
100
200
300
400
500
600
Light Sweet*Light/Medium SourHeavy
2015201420132012201120102009
*Includes small volumes of Medium Sweet

17 CANADIAN ASSOCIATION OF PETROLEUM PRODUCERS
3.4 MethodologyCAPP did not put any constraints on the data submitted by refiners nor were any alternate cases prepared. Some assumptions were made based on discussions with refiners and publicly available information.
The CAPP survey categorizes western Canadian crude oil into four main types as follows:
1. Conventional Light Sweet (greater than 27° API and less than or equal to 0.5% sulphur) including condensates and pentanes plus;
2. Heavy (equal to or less than 27° API) including conventional heavy, synthetic sour and crude oil blends such as DilBit, SynBit and DilSynBit;
3. Conventional Medium Sour (greater than 27° API and greater than 0.5% sulphur); and
4. Light Sweet Synthetic
For the purposes of the historical data in this section of the report, the following crude types and definitions apply:
• Sweet: crude oil with a sulphur content of less than or equal to 0.5%
• Sour: crude oil with a sulphur content of greater than 0.5%
• Light: crude oil with an API of at least 30°
• Medium: crude oil with an API greater than 27° but less than 30°
• Heavy: crude oil with an API of 27° API or less
No differentiation is made between sweet and sour crude oil that falls in the heavy category because heavy crude oil is generally sour.
3.5 Markets SummaryCanadian crude oil supplies will continue to serve traditional markets. Demand in the U.S. Midwest market for Canadian crude will grow as heavy oil refining capacity in the region is added. However, growing volumes of Canadian heavy oil supply means that new markets for these volumes must be found. The U.S. Gulf Coast is one such market, and the Keystone XL Pipeline project, which is expected to be in service in 2013, will provide Canadian producers increased access to this market. Growing Asian oil demand also represents a potential future market for Canadian crude oil production.

Crude Oil Forecast, Markets & Pipelines 18
Pipelines are the most efficient method of transporting large volumes of crude oil over land. In recent years, expansion of the existing pipeline infrastructure has been required in order that growing volumes of western Canadian crude oil can serve traditional and new markets. In response, a number of pipeline expansions were completed in 2009 and two major additional pipelines will be operating by the end of 2010. Furthermore, additional capacity to major traditional markets and the U.S. Gulf Coast will be available once other scheduled pipeline projects are built and operating in the next few years. Given the forecasted growth in western Canadian crude oil supplies, there is expected to be significant excess capacity resulting from all these pipeline projects over most of the outlook period.
4 CRUDE OIL PIPELINES
Figure 4.1 Existing and Approved Canadian and U.S. Crude Oil Pipelines
Portland
Montréal
Sarnia
PhiladelphiaChicago
Cushing
St. Paul
Salt Lake City
Houston
Edmonton
Anacortes
Burnaby
TransCanada Keystone& Cushing Extension
Enbridge Alberta Clipper
TransMountain
BP
Enbridge
Mid
Val
ley
Cap
line
Flanagan
Hardisty
Centurion Pipeline
Express
Platte
Enbridge (North Dakota) Expansion
Spearhead South
Spearhead North
Patoka
Superior
WoodRiver
ExxonMobil/Enbridge Pegasus
Clearbrook
2
3
1
Guernsey
TransCanadaKeystone XL
Canadian and U.S. Oil PipelinesExisting pipelines
Approved pipelines
Mustang

19 CANADIAN ASSOCIATION OF PETROLEUM PRODUCERS
The existing pipeline network provides access to the primary markets for western Canadian crude oil which include: western Canadian refineries; Ontario, the U.S. Midwest; PADD IV; and the West Coast. There is also limited access to the U.S. Gulf Coast. The approved pipeline projects are primarily expansions into the U.S. Midwest and the Gulf Coast. There is also continuing interest in developing pipeline projects to the west coast to access other new offshore markets in the future. Figure 4.1 shows all existing and approved pipelines to date.
4.1 Existing Crude Oil Pipelines Exiting Western CanadaThere are five major pipelines that are directly connected to the Canadian supply hubs at Edmonton and Hardisty, Alberta – Enbridge Mainline, Kinder Morgan Trans Mountain, Kinder Morgan Express, Enbridge Alberta Clipper and the TransCanada Keystone pipeline. Linefill for the Alberta Clipper and Keystone pipelines have begun and both pipelines are scheduled to be in service before the end of the year. These pipelines will add 885,000 b/d of pipeline capacity out of western Canada (Table 4.1).
Table 4.1 Capacity of Major Crude Oil Pipelines Exiting the WCSB
Pipeline Crude TypeAnnual
Capacity (thousand b/d)
EnbridgeLight 1,072
Heavy 796
Express Light/heavy (35/65) 280
Trans Mountain Light/heavy (80/20) 300
AB Clipper (new) Heavy 450
Keystone (new) Light/heavy (25/75) 435
Total Capacity 3,333
Enbridge Pipelines
The Enbridge system delivers crude oil and other refined products from western Canada to markets in western Canada, the U.S. Midwest and Ontario. It also receives crude oil from U.S. pipelines in the upper Midwest for deliveries to markets in the U.S. Midwest and Ontario. In addition, it connects to various pipelines in the U.S. such as the Minnesota Pipeline and Spearhead Pipeline, the latter providing access to the Cushing, Oklahoma pipeline hub.
The North Dakota Pipeline connects to the Enbridge Lakehead Pipeline at Clearbrook, Minnesota and provides producers in Montana and North Dakota with access to markets in PADD II and Ontario. Increased production in these areas has resulted in a need for additional pipeline capacity. The pipeline was expanded by 51,600 b/d to 162,000 b/d in January 2010. Further expansions in two phases are being considered. Phase 1 is targetted for 2011 and would provide 25,000 to 30,000 b/d of incremental capacity. Phase 2 is targetted for in service by the end of 2012 or early 2013 and would bring total incremental capacity from both phases to 140,000 b/d.
The Minnesota Pipeline has a capacity of 300,000 b/d and is connected to the Enbridge system at Clearbrook, Minnesota. It transports crude oil from Canada to Minnesota refineries owned by Flint Hills in Rosemount and Marathon Oil in St. Paul. In 2008, a new pipeline - the MinnCan project, was built along most of the original Minnesota Pipeline route to bring additional crude oil supply from Canada to these refineries. The MinnCan project has a capacity of 165,000 b/d but can be expanded up to 350,000 b/d.
Downstream of Superior, Wisconsin, Enbridge has a capacity of 1.8 million b/d including 400,000 b/d of capacity added in 2009 via the Southern Access pipeline, which terminates at Flanagan, Illinois. Since Spearhead South and Spearhead North provide the only connections to Southern Access, the takeaway capacity of these two pipelines currently acts as a constraint. Spearhead South delivers light and heavy crude oil to Cushing, Oklahoma. It was expanded in May 2009 by 65,000 b/d to a capacity of 190,000 b/d. Spearhead North capacity is currently idled as Enbridge seeks to optimize its pipeline operations at a time of surplus capacity.

Crude Oil Forecast, Markets & Pipelines 20
Enbridge Alberta Clipper 1
The Alberta Clipper pipeline is an expansion of the Enbridge existing mainline system and extends from Hardisty, Alberta to Superior, Wisconsin with a connection to the Minnesota Pipeline at Clearbrook. The initial capacity of 450,000 b/d of heavy crude oil can be further expanded to 800,000 b/d. The pipeline began linefill in April 2010 which is expected to be completed by October.
Kinder Morgan Trans Mountain PipelineThe Trans Mountain system originates in Edmonton, Alberta and transports crude oil to the Vancouver area, including the Westridge dock for vessel or barge loadings, and to a pipeline that provides deliveries to refineries in Washington State.
The pipeline can currently transport about 300,000 b/d assuming 20 percent of the volumes are heavy crude oil. The actual available capacity varies depending on the amount of heavy crude oil transported. Currently, about 25 percent of the volumes shipped are heavy crude oil.
Trans Mountain is currently operating as a common carrier pipeline where shippers nominate for space on the pipeline without a contract. Under this system, if demand for services exceed pipeline capacity, all shipper requests for services are prorated, a process called apportionment. Kinder Morgan is proposing to offer up to 50,000 b/d of firm service for deliveries to the Westridge dock. Shippers with firm contracts would not be subject to apportionment.
Kinder Morgan Express-Platte PipelinesThe Express Pipeline ships crude oil from Hardisty, Alberta to PADD IV and has a capacity of 280,000 b/d. The pipeline is underpinned by 231,000 b/d of firm contracts, many of which expire in 2012. The remaining space being available for spot or “common carriage” shippers.
The Platte system connects to Express at Casper, Wyoming and extends to Guernsey, Wyoming then to Wood River, Illinois. Capacity from Guernsey to Wood River is about 145,000 b/d and because of strong demand, the pipeline has been operating under apportionment since January 2007. Therefore, Express does not operate at capacity due to downstream constraints on the Platte system.
TransCanada Keystone 2
The Keystone Pipeline, which has an initial capacity of 435,000 b/d, runs from Hardisty, Alberta to the terminals in Wood River and Patoka, Illinois. The pipeline is scheduled to be in service by July 2010.
4.2 Oil Pipelines to the U.S. Midwest The U.S. Midwest is the largest primary market for western Canadian crude oil. The two major market hubs from which crude oil is further distributed, are found at Wood River/Patoka in Illinois and at Cushing, Oklahoma. Once all approved projects are in service, there will be excess capacity to these markets (Figure 4.2).
Currently, access to these hubs is constrained by the capacity of the Platte system and capacity from the Enbridge system on Spearhead South and the Mustang pipeline. The Mustang pipeline has a heavy crude oil capacity of about 91,000 b/d, of which 88,000 b/d is committed capacity. Current pipeline constraints to these hubs will be alleviated as new projects, such as the Keystone Pipeline and Cushing Extension go into service (Table 4.2).
Table 4.2 Summary of Crude Oil Pipelines to the U.S. Midwest
Pipeline Originating Point End Point Status Capacity(thousand b/d)
Kinder Morgan Express-Platte Guernsey, WY Wood River, IL Operating 145
Enbridge Spearhead Flanagan, IL Cushing, OK Operating 190
ExxonMobil Mustang Lockport, IL Patoka, IL Operating 91
TransCanada Keystone Hardisty, AB Patoka, IL Linefill 435
TransCanada Keystone Extension KS/NE border Cushing, OK Approved - for 2011 155

21 CANADIAN ASSOCIATION OF PETROLEUM PRODUCERS
TransCanada Keystone and Cushing Extension
By the end of the year, the TransCanada Keystone Pipeline will provide an additional 435,000 b/d of capacity into Wood River/Patoka. Shortly thereafter, the Keystone system will be extended to Cushing, Oklahoma from the Nebraska/Kansas border, adding 155,000 b/d of capacity in 2011. Subsequently, the combined capacity from Hardisty, Alberta to either the Wood River/Patoka or Cushing markets would be 590,000 b/d.
4.3 Oil Pipelines to the U.S. Gulf CoastWestern Canadian crude oil currently has limited access to the U.S. Gulf Coast market through a small amount of capacity on the Pegasus Pipeline and spot vessel movements from the Trans Mountain Westridge dock. (Figure 4.2). However, the planned Keystone XL Pipeline in 2013, would alleviate pipeline constraints to this market for several years (Table 4.3).
ExxonMobil Pegasus Pipeline
In June 2009, the Pegasus Pipeline was expanded by 30,000 b/d to its current capacity of 96,000 b/d. This pipeline currently provides western Canadian crude oil producers with the only pipeline access to the U.S. Gulf Coast.
Figure 4.2 Canadian & U.S. Crude Oil Pipelines - All Proposals
Portland
Montréal
Sarnia
PhiladelphiaChicago
Cushing
St. Paul
Salt Lake City
Houston
Edmonton
Anacortes
Burnaby
TransCanada Keystone& Cushing Extension
Enbridge Alberta Clipper
TransMountain
BP
Enbridge
Mid
Val
ley
Cap
line
Flanagan
Hardisty
Centurion Pipeline
Express
Platte
Enbridge (North Dakota) Expansion
Spearhead South Spearhead North
Superior
WoodRiver
ExxonMobil/Enbridge Pegasus
Clearbrook
2
3
1
Guernsey
TransCanadaKeystone XL
Kinder MorganTMX2 ExpansionTMX3 Expansion
5
Kitimat
6
Enbridge Gateway4
Kinder MorganTMX Northern Leg
Port Arthur
Mustang
Patoka
Canadian and U.S. Oil PipelinesEnbridge Pipelines, AB Clipper and connections to the U.S. MidwestKinder Morgan Express
Kinder Morgan Trans MountainTransCanada KeystoneProposed pipelines to the West Coast
Existing / Proposed pipelines to PADD III
Expansion to existing pipeline

Crude Oil Forecast, Markets & Pipelines 22
TransCanada Keystone XL and Louisiana Access options 3
TransCanada received approval for the Canadian portion of the Keystone XL project in March 2010 and has targetted the pipeline to be in service by 2013. There is a possibility for access to the Gulf Coast to be available as early as 2012 by building the Cushing to U.S. Gulf Coast portion of the pipeline project first.
This pipeline would originate at Hardisty, Alberta and then connect to the Cushing Extension at the Nebraska/Kansas border and then to Port Arthur and Houston, Texas. The initial pipeline capacity would be 700,000 b/d; of which 380,000 b/d has been secured by long-term contracts. The pipeline could be further expanded to 1.5 million b/d.
Additional options being considered include access to Louisiana by either building new or using existing facilities from Patoka to New Orleans or building a new line from Port Arthur, Texas to New Orleans. Proposed project timing is uncertain due to the early stages of these proposals.
4.4 Oil Pipelines to the West CoastThe Trans Mountain Pipeline is currently the only pipeline route to markets off the West Coast. The dark blue lines on the map in Figure 4.2 show the existing and proposed pipelines going to the West Coast.
Kinder Morgan TMX2, TMX3 and Northern Leg Expansion 5 6
The TMX2 expansion could increase capacity by 80,000 b/dby 2015. The scope of TMX2 includes a new line from Edmonton, Alberta to Kamloops, British Columbia. TMX3 includes a new line to the Washington State refineries and a second berth at the Westridge dock. TMX3 could provide an additional 320,000 b/d of new capacity by 2016. These expansions would provide additional access to Vancouver, Washington State and other markets served by oil tankers and barges which load at its Westridge dock.
TMX Northern Leg is a pipeline with a capacity of 400,000 b/d, extending from its existing system near Rearguard, British Columbia to a deep water port facility at Kitimat, British Columbia that would accommodate Very Large Crude Carriers (VLCC) for delivery to PADD V or the Far East. Depending on regulatory approvals and industry support, the pipeline could be in service as early as 2015.
Enbridge Northern Gateway 4
The Northern Gateway Project includes the construction of a new 36-inch diameter pipeline from Edmonton, Alberta to a deep water port at Kitimat, British Columbia and is being designed to provide 525,000 b/d of crude oil export capacity. Crude oil would be loaded on tankers for delivery to PADD V and the Far East. Enbridge submitted an application to the National Energy Board at the end of May 2010.
Table 4.3 Summary of Crude Oil Pipelines to the U.S. Gulf Coast
Pipeline Originating Point End Point Status Capacity(thousand b/d)
ExxonMobil Pegasus Patoka, IL Nederland, TX Operating 96
TransCanada Keystone XL Hardisty, AB NE/KS border Approved - for 2013700TransCanada Keystone XL -
Cushing to Gulf Coast portionCushing, OK U.S. Gulf Coast Approved - for 2013
but 2012 possble
TransCanada Louisiana Access Option #1
Patoka, IL New Orleans, LA Proposed
TransCanada Louisiana Access Option #2
Port Arthur, TX New Orleans, LA Proposed

23 CANADIAN ASSOCIATION OF PETROLEUM PRODUCERS
4.5 Other ProposalsCanadian National (CN) Railways and Altex are jointly exploring a “Pipeline on Rail” strategy. This proposal could transport as little as 10,000 to 20,000 b/d of undiluted or under-diluted bitumen in heated railcars. Through connections to other railroads, CN can access the majority of U.S. Gulf Coast refineries. This rail solution would also be suitable for condensate imports. CN has indicated that if there was interest, there would be no upper limit to the volumes that could be transported via rail.
4.6 Diluent PipelinesThe diluent pipeline projects were developed in response to demand by western Canadian heavy crude oil producers for additional diluent supply in order to transport growing volumes of bitumen production.
Enbridge Southern LightsThe Southern Lights pipeline project includes a new diluent line which flows from Flanagan, Illinois (near Chicago) to Clearbrook, Minnesota, and the reversal of Enbridge’s existing Line 13 from Clearbrook to Edmonton, Alberta.
The initial capacity of the diluent import line is 180,000 b/d, of which 77,000 b/d is for committed shippers. It can be expanded to 330,000 b/d with minor looping and to over 400,000 b/d with full looping. The in service date for the pipeline is July 2010.
Joint Capline/Chicap Industry InitiativeThe owners of both Chicap and Capline are co-operating to enable the movement of a limited amount of diluent from the U.S. Gulf Coast to Chicago by mid 2010. The plan is for the Chicap Pipeline to connect to the Enbridge
Southern Lights Pipeline. Chicap runs from Patoka, Illinois to the Chicago market. Ultimate capacity on the pipeline is estimated to be 320,000 b/d operating in batched diluent and light crude oil service. Initial total capacity of the pipeline in 2010 will be about 50 percent of the ultimate capacity. Capline extends from St. James, Louisiana to Patoka and has a capacity of more than one million b/d. The level of diluent deliveries is not known at this time
Enbridge Northern Gateway DiluentAs part of its Northern Gateway crude oil pipeline project, Enbridge is proposing a 193,000 b/d diluent import pipeline that would extend from Kitimat, British Columbia to Edmonton, Alberta. An application to the National Energy Board was filed at the end of May 2010.
4.7 Pipeline SummaryIn 2010, 885,000 b/d of new pipeline capacity exiting the Western Canada Sedimentary Basin was added and another 855,000 b/d has been approved that could go into service over the next few years. In addition, there are other projects being proposed that could add additional capacity. These pipeline projects will provide producers with increased access to traditional markets as well as access to the Gulf Coast and offshore West Coast markets. Such market diversity is important for producers who are investing large amounts of capital in order to grow crude oil production. The timing of the approved projects going into service, however, will mean that excess pipeline capacity out of the basin will exist until around 2022, when growth in crude oil supply is expected to reach over four million b/d.
Table 4.4 Summary of Crude Oil Pipelines to the West Coast
Pipeline Originating Point End Point Status Capacity(thousand b/d)
Enbridge Northern Gateway Bruderheim, AB Kitimat, BC Proposed 525
Kinder Morgan TMX2 Edmonton, AB Kamloops, BC Proposed 80
Kinder Morgan TMX3 Kamloops, BC Sumas, BC Proposed 320
Kinder Morgan TMX Northern Leg Rearguard/Edmonton, AB
Kitimat, BC Proposed 400

Crude Oil Forecast, Markets & Pipelines 24
GLOSSARYAPI Gravity A specific gravity scale developed by the American Petroleum Institute (API) for measuring the
relative density or viscosity of various petroleum liquids.
Barrel A standard oil barrel is approximately equal to 35 Imperial gallons (42 U.S. gallons) or approximately 159 litres.
Bitumen A heavy, viscous oil that must be processed extensively to convert it into a crude oil before it can be used by refineries to produce gasoline and other petroleum products.
Bitumen Blend In this report, bitumen blend includes upgraded heavy sour crude oil, and bitumen to which light oil fractions (i.e. diluent or upgraded crude oil) have been added in order to reduce its viscosity and density to meet pipeline specifications.
Coker The processing unit in which bitumen is cracked into lighter fractions and withdrawn to start the conversion of bitumen into upgraded crude oil.
Condensate A mixture of mainly pentanes and heavier hydrocarbons. It may be gaseous in its reservoir state but is liquid at the conditions under which its volumes is measured or estimated.
Crude oil (Conventional) A mixture of pentanes and heavier hydrocarbons that is recovered or is recoverable at a well from an underground reservoir. It is liquid at the conditions under which its volumes is measured or estimated and includes all other hydrocarbon mixtures so recovered or recoverable except raw gas, condensate, or bitumen.
Crude Oil (heavy) Crude oil is deemed, in this report, to be heavy crude oil if it has an API of 27º or less. No differentiation is made between sweet and sour crude oil that falls in the heavy category because heavy crude oil is generally sour.
Crude Oil (medium) Crude oil is deemed, in this report, to be medium crude oil if it has an API greater than 27º but less than 30º. No differentiation is made between sweet and sour crude oil that falls in the medium category because medium crude oil is generally sour.
Crude oil (synthetic) A mixture of hydrocarbons, similar to crude oil, derived by upgrading bitumen from the oil sands.
Density The mass of matter per unit volume.
Dilbit Bitumen that has been reduced in viscosity through addition of a diluent (or solvent) such as condensate or naphtha.
Diluent Lighter viscosity petroleum products that are used to dilute bitumen for transportation in pipelines.
Extraction A process unique to the oil sands industry, in which bitumen is separated from their source (oil sands).
Feedstock In this report, feedstock refers to the raw material supplied to a refinery or oil sands upgrader.
Integrated mining A combined mining and upgrading operation where oil sands are mined from open pits. project The bitumen is then separated from the sand and upgraded by a refining process.
In Situ recovery The process of recovering crude bitumen from oil sands by drilling.
Merchant upgrader Processing facilities that are not linked to any specific extraction project but is designed to accept raw bitumen on a contract basis from producers.

25 CANADIAN ASSOCIATION OF PETROLEUM PRODUCERS
Oil Condensate, crude oil, or a constituent of raw gas, condensate, or crude oil that is recovered in processing and is liquid at the conditions under which its volume is measured or estimated.
Oil sands Refers to a mixture of sand and other rock materials containing crude bitumen or the crude bitumen contained in those sands.
Oil Sands Deposit A natural reservoir containing or appearing to contain an accumulation of oil sands separated or appearing to be separated from any other such accumulation. The ERCB has designated three areas in Alberta as oil sands areas.
Pentanes Plus A mixture mainly of pentanes and heavier hydrocarbons that ordinarily may contain some butanes and is obtained from the processing of raw gas, condensate or crude oil.
PADD Petroleum Administration for Defense District that defines a market area for crude oil in the U.S.
Refined Petroleum End products in the refining process (e.g. gasoline).Products
Specification Defined properties of a crude oil or refined petroleum product.
SynBit A blend of bitumen and synthetic crude oil that has similar properties to medium sour crude oil.
Upgrading The process that converts bitumen or heavy crude oil into a product with a lower density and viscosity.
West Texas Intermediate WTI is a light sweet crude oil, produced in the United States, which is the benchmark grade of crude oil for North American price quotations.

Crude Oil Forecast, Markets & Pipelines 26
Acronyms API American Petroleum Institute
CAPP Canadian Association of Petroleum Producers
CSS Cyclic Steam Stimulation
DRA Drag Reducing Agent
EIA Energy Information Administration
ERCB (Alberta) Energy & Resources Conservation Board
IEA International Energy Agency
PADD Petroleum Administration for Defense District
S sulphur
SAGD Steam Assisted Gravity Drainage
U.S. United States
WCSB Western Canada Sedimentary Basin
WTI West Texas Intermediate
Canadian Provincial AbbreviationsAB Alberta
BC British Columbia
MB Manitoba
NWT Northwest Territories
ON Ontario
QC Québec
Unitsb/d barrels per day
Conversion Factor1 cubic metre = 6.293 barrels (oil)
APPENDIX A ACRONYMS, ABBREVIATIONS, UNITS AND CONVERSION FACTORS
U.S. State AbbreviationsAL Alabama
AK Alaska
AZ Arizona
AR Arkansas
CA California
CO Colorado
CT Connecticut
DE Delaware
GA Georgia
ID Idaho
IL Illinois
IN Indiana
IA Iowa
KS Kansas
KY Kentucky
LA Louisiana
ME Maine
MD Maryland
MA Massachusetts
MI Michigan
MN Minnesota
MS Mississippi
MO Missouri
MT Montana
NE Nebraska
NV Nevada
NH New Hampshire
NJ New Jersey
NM New Mexico
NY New York
ND North Dakota
OH Ohio
OK Oklahoma
OR Oregon
PA Pennsylvania
SD South Dakota
TN Tennessee
TX Texas
UT Utah
VT Vermont
VA Virginia
WA Washington
WV West Virginia
WI Wisconsin

27 CANADIAN ASSOCIATION OF PETROLEUM PRODUCERS
AP
PE
ND
IX B
.1
CA
PP
Can
adia
n C
rude
Oil
Pro
duct
ion
Fore
cast
201
0 –
2025
thou
sand
bar
rels
per
day
Act
uals
F
orec
ast
CO
NV
EN
TIO
NA
L20
0520
0620
0720
0820
0920
1020
1120
1220
1320
1420
1520
1620
1720
1820
1920
2020
2120
2220
2320
2420
25
Ligh
t &
Med
ium
A
lber
ta37
436
034
734
731
630
429
428
427
626
826
025
224
523
723
022
522
121
721
220
820
4
B
.C.
3029
2623
2220
1918
1716
1615
1413
1312
1111
1010
9
S
aska
tche
wan
1,2
148
155
162
183
184
185
185
185
185
185
181
177
174
169
164
158
154
149
145
140
135
M
anito
ba
1419
2223
2627
2727
2626
2525
2424
2323
2222
2121
21
N
.W.T
.19
1918
1616
1514
1312
1211
1110
109
98
87
77
Tota
l Co
nv. L
ight
and
Med
ium
585
581
575
593
563
550
538
527
517
507
493
479
467
453
439
427
417
407
396
385
375
Hea
vy
A
lber
ta C
onv.
Hea
vy19
718
317
815
614
513
813
112
411
811
210
710
196
9187
8278
7471
6764
S
aska
tche
wan
Con
v. H
eavy
1,2
271
273
264
255
237
228
217
211
208
203
199
195
191
188
184
180
177
173
170
166
163
Tota
l Co
nven
tio
nal H
eavy
468
456
442
411
382
366
348
335
326
316
306
296
288
279
271
262
255
247
240
233
227
TO
TAL
CO
NV
EN
TIO
NA
L1,
053
1,03
71,
017
1,00
494
691
688
686
284
382
279
977
575
573
271
068
967
265
463
761
860
2
PE
NTA
NE
S/C
ON
DE
NS
AT
E16
016
617
316
916
115
715
415
114
814
514
214
114
013
813
713
513
413
313
113
012
9
OIL
SA
ND
S (B
ITU
ME
N &
U
PG
RA
DE
D C
RU
DE
OIL
)
O
il S
and
s M
inin
g 53
462
364
761
069
076
785
692
41,
015
1,04
31,
056
1,07
01,
079
1,11
11,
159
1,22
91,
277
1,32
71,
436
1,51
41,
529
O
il S
and
s In
Situ
439
494
536
584
657
716
793
888
952
1,02
21,
106
1,22
11,
311
1,44
21,
551
1,64
01,
724
1,77
21,
830
1,89
11,
931
TO
TAL
OIL
SA
ND
S97
21,
117
1,18
31,
193
1,34
81,
483
1,65
01,
813
1,96
62,
064
2,16
22,
291
2,39
02,
553
2,71
02,
868
3,00
03,
099
3,26
63,
405
3,46
1
WE
ST
ER
N C
AN
AD
A O
IL P
RO
DU
CT
ION
2,18
52,
319
2,37
32,
366
2,45
42,
556
2,69
02,
826
2,95
73,
032
3,10
43,
207
3,28
43,
422
3,55
63,
692
3,80
63,
886
4,03
44,
153
4,19
1
AT
LAN
TIC
CA
NA
DA
OIL
PR
OD
UC
TIO
N30
430
436
934
226
825
026
524
022
019
519
017
522
525
522
519
019
018
017
015
514
5
TO
TAL
CA
NA
DIA
N O
IL P
RO
DU
CT
ION
2,48
92,
623
2,74
22,
709
2,72
22,
806
2,95
53,
066
3,17
73,
227
3,29
43,
382
3,50
93,
677
3,78
13,
882
3,99
64,
066
4,20
44,
308
4,33
6
OIL
SA
ND
S R
AW
BIT
UM
EN
**
O
il S
and
s M
inin
g 62
676
978
472
482
591
21,
008
1,07
91,
172
1,20
41,
217
1,23
31,
287
1,37
31,
436
1,51
81,
572
1,62
61,
735
1,81
41,
830
O
il S
and
s In
Situ
439
494
536
584
665
721
805
901
964
1,03
41,
119
1,23
51,
328
1,46
11,
574
1,66
51,
750
1,79
81,
857
1,91
81,
958
TO
TAL
OIL
SA
ND
S1,
065
1,26
31,
320
1,30
71,
490
1,63
21,
813
1,98
02,
137
2,23
82,
336
2,46
82,
615
2,83
43,
010
3,18
33,
322
3,42
43,
592
3,73
23,
788
Not
es:
1. C
AP
P a
lloca
tes
Sas
katc
hew
an A
rea
III M
ediu
m c
rude
as
heav
y cr
ude.
Als
o 17
% o
f Are
a IV
is >
900
kg/
m3 .
2. C
AP
P h
as r
evis
ed fr
om th
e Ju
ne 2
007
repo
rt h
isto
rical
ligh
t/he
avy
ratio
for
Sas
katc
hew
an s
tart
ing
in 2
005.
** R
aw b
itum
en n
umbe
rs a
re h
ighl
ight
ed. T
he o
il sa
nds
prod
uctio
n nu
mbe
rs (a
s hi
stor
ical
ly p
ublis
hed)
are
a c
ombi
natio
n of
upg
rade
d cr
ude
oil a
nd b
itum
en a
nd th
eref
ore
inco
rpor
ate
yiel
d lo
sses
from
in
tegr
ated
upg
rade
r pr
ojec
ts. P
rodu
ctio
n fro
m o
ff-si
te u
pgra
ding
pro
ject
s ar
e in
clud
ed in
the
prod
uctio
n nu
mbe
rs a
s bi
tum
en.
Gro
wth
Ju
ne 2
010

Crude Oil Forecast, Markets & Pipelines 28
AP
PE
ND
IX B
.2
CA
PP
Can
adia
n C
rude
Oil
Pro
duct
ion
Fore
cast
201
0 –
2025
thou
sand
bar
rels
per
day
Act
uals
Fore
cast
CO
NV
EN
TIO
NA
L20
0520
0620
0720
0820
0920
1020
1120
1220
1320
1420
1520
1620
1720
1820
1920
2020
2120
2220
2320
2420
25
Ligh
t &
Med
ium
A
lber
ta37
436
034
734
731
630
429
428
427
626
826
025
224
523
723
022
522
121
721
220
820
4
B
.C.
3029
2623
2220
1918
1716
1615
1413
1312
1111
1010
9
S
aska
tche
wan
1,2
148
155
162
183
184
185
185
185
185
185
181
177
174
169
164
158
154
149
145
140
135
M
anito
ba
1419
2223
2627
2727
2626
2525
2424
2323
2222
2121
21
N
.W.T
.19
1918
1616
1514
1312
1211
1110
109
98
87
77
Tota
l Co
nv. L
ight
and
Med
ium
585
581
575
593
563
550
538
527
517
507
493
479
467
453
439
427
417
407
396
385
375
Hea
vy
A
lber
ta C
onv.
Hea
vy19
718
317
815
614
513
813
112
411
811
210
710
196
9187
8278
7471
6764
S
aska
tche
wan
Con
v. H
eavy
1,2
271
273
264
255
237
228
217
211
208
203
199
195
191
188
184
180
177
173
170
166
163
Tota
l Co
nven
tio
nal H
eavy
468
456
442
411
382
366
348
335
326
316
306
296
288
279
271
262
255
247
240
233
227
TO
TAL
CO
NV
EN
TIO
NA
L1,
053
1,03
71,
017
1,00
494
691
688
686
284
382
279
977
575
573
271
068
967
265
463
761
860
2
PE
NTA
NE
S/C
ON
DE
NS
AT
E16
016
617
316
916
115
715
415
114
814
514
214
114
013
813
713
513
413
313
113
012
9
OIL
SA
ND
S (B
ITU
ME
N &
U
PG
RA
DE
D C
RU
DE
OIL
)
O
il S
and
s M
inin
g 53
462
364
761
069
076
785
692
41,
015
1,03
91,
051
1,06
31,
068
1,06
81,
068
1,06
81,
068
1,06
81,
068
1,06
81,
068
O
il S
and
s In
Situ
439
494
536
584
657
716
793
888
945
984
1,02
01,
069
1,07
01,
077
1,08
61,
079
1,07
11,
064
1,05
51,
047
1,03
2
TO
TAL
OIL
SA
ND
S97
21,
117
1,18
31,
193
1,34
81,
483
1,65
01,
812
1,95
92,
024
2,07
12,
131
2,13
72,
144
2,15
32,
147
2,13
82,
131
2,12
22,
114
2,10
0
WE
STE
RN
CA
NA
DA
OIL
PR
OD
UC
TIO
N2,
185
2,31
92,
373
2,36
62,
454
2,55
62,
690
2,82
52,
950
2,99
13,
012
3,04
73,
032
3,01
43,
000
2,97
02,
944
2,91
82,
890
2,86
22,
830
ATLA
NTI
C C
AN
AD
A O
IL P
RO
DU
CTI
ON
304
304
369
342
268
250
265
240
220
195
190
175
225
255
225
190
190
180
170
155
145
TOTA
L C
AN
AD
IAN
OIL
PR
OD
UC
TIO
N2,
489
2,62
32,
742
2,70
92,
722
2,80
62,
955
3,06
53,
170
3,18
63,
202
3,22
23,
257
3,26
93,
225
3,16
03,
134
3,09
83,
060
3,01
72,
975
OIL
SA
ND
S R
AW
BIT
UM
EN
**
O
il S
and
s M
inin
g 62
676
978
472
482
591
21,
008
1,07
91,
172
1,20
01,
212
1,22
31,
228
1,22
81,
228
1,22
81,
228
1,22
81,
228
1,22
81,
228
O
il S
and
s In
Situ
439
494
536
584
665
721
805
900
957
997
1,03
21,
081
1,08
31,
090
1,09
81,
092
1,08
31,
077
1,06
71,
059
1,04
5
TO
TAL
OIL
SA
ND
S1,
065
1,26
31,
320
1,30
71,
490
1,63
21,
813
1,97
92,
130
2,19
72,
244
2,30
42,
311
2,31
82,
326
2,32
02,
311
2,30
52,
295
2,28
72,
273
Not
es:
1. C
AP
P a
lloca
tes
Sas
katc
hew
an A
rea
III M
ediu
m c
rude
as
heav
y cr
ude.
Als
o 17
% o
f Are
a IV
is >
900
kg/
m3 .
2. C
AP
P h
as r
evis
ed fr
om th
e Ju
ne 2
007
repo
rt h
isto
rical
ligh
t/he
avy
ratio
for
Sas
katc
hew
an s
tart
ing
in 2
005.
** R
aw b
itum
en n
umbe
rs a
re h
ighl
ight
ed. T
he o
il sa
nds
prod
uctio
n nu
mbe
rs (a
s hi
stor
ical
ly p
ublis
hed)
are
a c
ombi
natio
n of
upg
rade
d cr
ude
oil a
nd b
itum
en a
nd th
eref
ore
inco
rpor
ate
yiel
d lo
sses
from
inte
grat
ed u
pgra
der
proj
ects
. Pro
duct
ion
from
off-
site
upg
radi
ng p
roje
cts
are
incl
uded
in th
e pr
oduc
tion
num
bers
as
bitu
men
.
Op
erat
ing
& In
Co
nstr
uctio
n Ju
ne 2
010

29 CANADIAN ASSOCIATION OF PETROLEUM PRODUCERS
AP
PE
ND
IX B
.3
CA
PP
Wes
tern
Can
adia
n C
rude
Oil
Sup
ply
Fore
cast
201
0 –
2025
Ble
nded
Sup
ply
to
Tru
nk P
ipel
ines
and
Mar
kets
thou
sand
bar
rels
per
day
Act
uals
Fore
cast
CO
NV
EN
TIO
NA
L20
0520
0620
0720
0820
0920
1020
1120
1220
1320
1420
1520
1620
1720
1820
1920
2020
2120
2220
2320
2420
25
Tota
l Lig
ht a
nd M
ediu
m58
157
757
158
955
954
653
452
351
350
348
947
546
344
943
542
341
340
339
238
137
1
Net
Con
vent
iona
l Hea
vy t
o M
arke
t40
538
638
235
031
128
826
825
424
323
222
121
020
119
118
217
216
515
614
814
013
3
TO
TAL
CO
NV
EN
TIO
NA
L98
596
395
493
987
083
480
277
775
673
571
068
566
464
061
759
557
855
954
152
150
5
OIL
SA
ND
S
Up
grad
ed L
ight
(Syn
thet
ic)1
506
572
622
556
653
745
836
883
882
878
896
900
947
994
996
1,01
41,
143
1,17
61,
209
1,22
51,
206
Bitu
men
Ble
nd 2
686
795
834
937
970
986
1,11
81,
251
1,44
41,
564
1,66
91,
820
1,84
81,
941
2,11
22,
202
2,26
92,
365
2,56
62,
735
2,81
8
TO
TAL
OIL
SA
ND
S A
ND
U
PG
RA
DE
RS
1,19
21,
368
1,45
51,
493
1,62
21,
731
1,95
32,
134
2,32
62,
442
2,56
52,
720
2,79
52,
935
3,10
83,
216
3,41
23,
542
3,77
53,
961
4,02
4
Tota
l Lig
ht S
upp
ly1,
087
1,14
91,
193
1,14
51,
212
1,29
21,
370
1,40
61,
395
1,38
11,
385
1,37
51,
410
1,44
31,
430
1,43
71,
556
1,57
91,
602
1,60
71,
577
Tota
l Hea
vy S
upp
ly1,
091
1,18
21,
216
1,28
71,
281
1,27
41,
385
1,50
51,
687
1,79
61,
890
2,03
02,
049
2,13
32,
294
2,37
42,
434
2,52
12,
714
2,87
52,
951
WE
ST
ER
N C
AN
AD
A O
IL S
UP
PLY
2,17
82,
331
2,40
92,
432
2,49
32,
565
2,75
52,
911
3,08
23,
177
3,27
53,
405
3,45
93,
575
3,72
53,
811
3,99
04,
101
4,31
54,
482
4,52
8
Not
es:
1. I
nclu
des
upgr
aded
con
vent
iona
l.
2. In
clud
es: a
) im
port
ed c
onde
nsat
e b)
man
ufac
ture
d di
luen
t fro
m u
pgra
ders
and
c) u
pgra
ded
heav
y vo
lum
es c
omin
g fro
m u
pgra
ders
.
Gro
wth
Ju
ne 2
010

Crude Oil Forecast, Markets & Pipelines 30
AP
PE
ND
IX B
.4
CA
PP
Wes
tern
Can
adia
n C
rude
Oil
Sup
ply
Fore
cast
201
0 –
2025
Ble
nded
Sup
ply
to
Tru
nk P
ipel
ines
and
Mar
kets
thou
sand
bar
rels
per
day
Act
uals
Fore
cast
CO
NV
EN
TIO
NA
L20
0520
0620
0720
0820
0920
1020
1120
1220
1320
1420
1520
1620
1720
1820
1920
2020
2120
2220
2320
2420
25
Tota
l Lig
ht a
nd M
ediu
m58
157
757
158
955
954
653
452
351
350
348
947
546
344
943
542
341
340
339
238
137
1
Net
Con
vent
iona
l Hea
vy t
o M
arke
t40
538
638
235
031
128
826
825
424
323
222
121
020
119
118
217
216
515
614
814
013
3
TO
TAL
CO
NV
EN
TIO
NA
L98
596
395
493
987
083
480
277
775
673
571
068
566
464
061
759
557
855
954
152
150
5
OIL
SA
ND
S
Up
grad
ed L
ight
(Syn
thet
ic)1
506
572
622
556
653
745
836
883
889
910
940
922
920
916
910
916
924
929
936
942
955
Bitu
men
Ble
nd 2
686
795
834
937
970
986
1,11
81,
250
1,43
01,
491
1,52
11,
598
1,60
71,
617
1,63
21,
619
1,60
21,
590
1,57
21,
558
1,53
0
TO
TAL
OIL
SA
ND
S A
ND
U
PG
RA
DE
RS
1,19
21,
368
1,45
51,
493
1,62
21,
731
1,95
32,
133
2,31
92,
401
2,46
12,
520
2,52
72,
533
2,54
22,
534
2,52
52,
518
2,50
82,
500
2,48
5
Tota
l Lig
ht S
upp
ly1,
087
1,14
91,
193
1,14
51,
212
1,29
21,
370
1,40
61,
402
1,41
31,
429
1,39
71,
383
1,36
41,
345
1,33
81,
337
1,33
11,
329
1,32
31,
326
Tota
l Hea
vy S
upp
ly1,
091
1,18
21,
216
1,28
71,
281
1,27
41,
385
1,50
41,
674
1,72
31,
742
1,80
81,
808
1,80
91,
814
1,79
11,
766
1,74
61,
720
1,69
81,
663
WE
ST
ER
N C
AN
AD
A O
IL S
UP
PLY
2,17
82,
331
2,40
92,
432
2,49
32,
565
2,75
52,
910
3,07
53,
136
3,17
13,
205
3,19
03,
173
3,15
83,
129
3,10
33,
077
3,04
93,
021
2,98
9
Not
es:
1. I
nclu
des
upgr
aded
con
vent
iona
l.
2. In
clud
es: a
) im
port
ed c
onde
nsat
e b)
man
ufac
ture
d di
luen
t fro
m u
pgra
ders
and
c) u
pgra
ded
heav
y vo
lum
es c
omin
g fro
m u
pgra
ders
.
Op
erat
ing
& In
Co
nstr
uctio
n Ju
ne 2
010

31 CANADIAN ASSOCIATION OF PETROLEUM PRODUCERS
APPENDIX CCrude Oil Pipelines and Refineries
Vancouver to:Japan - 4,300 milesTaiwan - 5,600 milesS.Korea - 4,600 milesChina - 5,100 miles
San Francisco - 800 milesLos Angeles - 1,100 miles
Prince GeorgeHusky...............12
F
Port Arthur/Beaumont
Artesia Slaughter
CENTURION
SPEARHEAD
SOUTH
S
EXXONMOBIL
EXXONMOBIL
EXXONM
OBIL
EXXONMOBIL
KEYSTON
E
KEYSTON
E
VancouverChevron ...........55
Puget SoundBP ..................................230ConocoPhillips...........100Shell...............................145Tesoro ...........................120US Oil ............................. 39
San FranciscoChevron ...................240ConocoPhillips.......120Shell...........................165Tesoro .......................166Valero........................170
Great FallsMontana Refining..... 10
BillingsCHS ................................ 59ConocoPhillips........... 58ExxonMobil................. 58
Los AngelesBP ........................................ 265Chevron ............................. 270ConocoPhillips................. 139ExxonMobil....................... 150Tesoro ................................. 100Valero ................................. 135
EdmontonImperial...........................187Suncor .............................125Shell..................................100LloydminsterHusky.................................28Husky Upgrader.............82
ReginaCo-op Refinery/Upgrader .......................100Moose JawMoose Jaw Asphalt .....15
WyomingFrontier (Cheyenne)......................52Little America (Casper) ................25Sinclair Oil (Sinclair) ......................66Wyoming (Newcastle)..................14
Houston/Texas CityBP ....................................475ConocoPhillips.............247Deer Park .......................330ExxonMobil...................584Houston Refining .......268Marathon......................... 76Valero (2)........................390
Three RiversValero..............................100Corpus ChristiCITGO..............................165Flint..................................300Valero..............................315
Port Arthur/BeaumontExxonMobil................... 503Motiva............................. 285Valero.............................. 310Total................................. 175
El PasoWestern Refining .........125
OklahomaConocoPhillips (Ponca City)............... 187Holly (Tulsa x 2) ...................................... 125Valero (Ardmore) ......................................90Wynnewood...............................................70
Borger/McKeeWRB ..................................146Valero...............................170
Denver/Commerce CitySuncor ............................. 93
Salt Lake CityBig West ..............35Chevron ..............45Holly .....................31Tesoro ..................58
MandanTesoro ..............60 St. Paul
Flint Hills .............320Marathon.............. 74
McPhersonNCRA.......................................... 86El DoradoFrontier....................................130CoffeyvilleCoffeyville Resources .........115
SuperiorMurphy........
UpgradersSyncrude (Fort McMurray) .............465Suncor (Fort McMurray) ..................438Shell (Scotford)...................................155CNRL Horizon......................................135OPTI/Nexen Long Lake...................... 72
ArtesiaHolly ............100

Crude Oil Forecast, Markets & Pipelines 32
Saint John
For Information Contact: (403) 267-1141 / www.capp.ca
2009 Canadian Crude Oil Production 000 m3/d 000 b/d
British Columbia 6 34Alberta 309 1,947Saskatchewan 67 423Manitoba 4 26Northwest Territories 3 17
Western Canada 389 2,448Atlantic Canada 43 268Total Canada 432 2,716
Pipeline Tolls (US$ per barrel)Edmonton to Burnaby (Trans Mountain) 1.70 Anacortes (Trans Mountain) 1.95 Sarnia (Enbridge) 3.95 Chicago (Enbridge) 3.50 Wood River (Enbridge/Mustang/Capwood) 4.35 USGC (Enbridge/Mustang/ExxonMobil) 5.65Hardisty to Guernsey (Express/Platte) 1.50 Wood River (Express/Platte) 1.80 USGC (Express/Platte/MAP/ExxonMobil) 3.45USEC to Sarnia (Portland/Montreal/Enbridge) 2.55St. James to Wood River (Capline/Capwood) 1.00Freeport to Wood River (Seaway/Ozark) 1.50
Notes 1) Heavy crude adds 20-30% 2) Tolls rounded to nearest 5 cents 3) Tolls in effect July 1, 2010
Approved Crude Oil Pipelines
lanagan
Come by Chance
St. Charles
NewfoundlandNorth Atlantic .................. 115
Lake Charles/GaryvilleConocoPhillips...............239CITGO................................440Marathon.........................436Valero................................250
0
Saint JohnIrving....................300
HalifaxImperial............... 82
DetroitMarathon...................106ToledoBP-Husky ...................160Sunoco .......................160LimaHusky..........................160CantonMarathon..................... 78CatlettsburgMarathon...................212
New JerseyConocoPhillips...............238Valero................................185
Wood RiverWRB .....................................306RobinsonMarathon...........................206
MemphisValero...................195El DoradoLion......................... 70
..... 35
ChicagoBP ............................. 405ExxonMobil............ 238PDV .......................... 167
SarniaImperial............... 119Nova ........................80Shell.........................74Suncor ....................85NanticokeImperial............... 120
Montréal/QuébecSuncor .....................130Ultramar..................265
PhiladelphiaConocoPhillips (Trainer)............. 185Sunoco (Marcus Hook) ............... 178Sunoco (Philadelphia)................. 335
WarrenUnited ......... 70

33 CANADIAN ASSOCIATION OF PETROLEUM PRODUCERS
Calgary Office:
2100, 350 - 7 Avenue SW
Calgary, Alberta, Canada
T2P 3N9
Phone: 403-267-1100
Fax: 403-261-4622
St. John’s Office:
403, 235 Water Street
St. John’s, Newfoundland
and Labrador
Canada A1C 1B6
Phone: 709-724-4200
Fax: 709-724-4225
www.capp.ca
June 2010
2010 - 0015
The Canadian Association of Petroleum Producers (CAPP) represents companies, large and small, that explore for, develop and produce natural gas and crude oil throughout Canada. CAPP’s member companies produce about 90 per cent of Canada’s natural gas and crude oil. CAPP’s associate members provide a wide range of services that support the upstream crude oil and natural gas industry. Together CAPP’s members and associate members are an important part of a $110-billion-a-year national industry that provides essential energy products. CAPP’s mission is to enhance the economic sustainability of the Canadian upstream petroleum industry in a safe and environmentally and socially responsible manner, through constructive engagement and communication with governments, the public and stakeholders in the communities in which we operate.