capturing the multifaceted phenomena of … · abstract vulnerability and disaster risk assessment...
TRANSCRIPT
ORIGINAL PAPER
Capturing the multifaceted phenomena of socioeconomicvulnerability
Linda Sorg1 · Neiler Medina2 · Daniel Feldmeyer1 ·Arlex Sanchez2 · Zoran Vojinovic2 · Jörn Birkmann1 ·Alessandra Marchese3
Received: 24 July 2017 / Accepted: 31 January 2018 / Published online: 23 February 2018© The Author(s) 2018. This article is an open access publication
Abstract Vulnerability and disaster risk assessment has been evaluated from different
perspectives with focus on global or national scale. There is a lack of methodologies on
city scale, which are able to capture inner-city disparities with regard to socioeconomic
aspects. Therefore, the main objective was to develop a transparent and comprehensive
indicator-based approach which is flexible in terms of data availability and is not tied to a
specific case study side. This research proposes two flexible methodological approaches on
how to perform socioeconomic vulnerability assessment. Susceptibility, Coping and
Adaptation are the main elements of a modular hierarchical structure to capture the societal
sphere of vulnerability. The first method is completely based on official census data at
block scale. The second method is an expansion and includes data derived from a field
& Linda [email protected]
Neiler [email protected]
Daniel [email protected]
Arlex [email protected]
Zoran [email protected]
Jorn [email protected]
Alessandra [email protected]
1 Institute of Spatial and Regional Planning, University of Stuttgart, Pfaffenwaldring 7,70569 Stuttgart, Germany
2 Urban Water Systems, Environmental Engineering and Water Technology Department, UNESCO-IHE, Westvest 7, 2611 AX Delft, The Netherlands
3 GISIG – Geographical Information Systems International Group, Via Piacenza 54, 16138 Genoa,Italy
123
Nat Hazards (2018) 92:257–282https://doi.org/10.1007/s11069-018-3207-1

survey to add components of risk perception. The proposed methodologies were developed
and applied in the city of Genoa (Italy). The results are displayed spatially explicit on
maps. Furthermore statistical analysis, to reveal the driving forces which influence vul-
nerability, was performed. The census-based approach revealed that vulnerability is forced
along the river by the inherent susceptibility, as well as the lack of adaptation. The two
approaches can be used effectively in gaining different insights. The flexibility of the
framework proved to be suitable to the objective of the research. However, the values
computed in this research do not claim completeness, and the aim was to provide useful
information for stakeholders in decision making process to reduce vulnerability and risk.
Keywords Vulnerability assessment · Socioeconomic vulnerability · Susceptibility ·
Coping · Adaptation · Disasters
1 Introduction
There is a change in thinking needed from a solely perspective on hazards to the inherent
risk characteristic of social systems (UNISDR 2015). In the last 90 years exposure
increased despite introduction of natural hazard management strategies (Fuchs et al. 2017).
In order to understand the “social construction of risk” (Garschargen and Romero-Lankao
2013: 40) vulnerability is a key element (see e.g. Wisner et al. 2004; Adger 2006; Turner
et al. 2003, Cardona 2005). Vulnerability can be seen as a complex multifaceted system
(Birkmann 2013a; Maskrey 1993), which is not easily measurable (Adger 2006). However,
the quantification of vulnerability is less developed than the mapping and quantification of
hazards (Birkmann 2007). Natural disasters resulting from extreme hydrometeorological
events occur almost daily (see e.g. Vojinovic and van Teeffelen 2007; Price and Vojinovic
2008; Mynett and Vojinovic 2009), and they represent a particular challenge when it comes
to the assessment of hazards, vulnerabilities and risk. With numerical models it is possible
to explore the generation of flood hazards and to simulate effects of different scenarios
(Abbott and Vojinovic 2009). Next to the display of the hazard, the understanding and
decoding of drivers of vulnerability are crucial to capture the societal components in the
composition of risk (Wolf and McGregor 2013). Fuchs (2009: 348) stresses that a “broaderunderstanding of the concept of vulnerability is needed” to reduce risk induced by natural
hazards. In an analysis of paired flood events Kreibich et al. (2017) concluded that
reduction in losses of second events was mainly due to reduction in vulnerability.
Turner et al. (2003) express the need for a better understanding of vulnerability and
methods for its assessment. Furthermore they state that when it comes to coastal flood
vulnerability, the link of theoretical concepts and their practical use in decision making has
to be strengthened (ibid). Vojinovic (2015) highlights the requirement of a larger per-
spective and holistic approaches to assess risk and vulnerability to capture their
complexity. This comprehensive view is needed to trace the roots of urban flood risk
(Vojinovic and Abbott 2012). However, due to constraints related to real-world data it is
impossible to achieve this entirely (Turner et al. 2003). Turner et al. (2003) demand a
simplified, but consistent vulnerability assessment methodology.
The present paper deals with a flexible vulnerability assessment method which has been
developed within the EC-funded project “Preparing for Extreme and Rare events in coastal
regions” (PEARL, see e.g. Vojinovic et al. 2014 and Vojinovic 2015). The assessment on
258 Nat Hazards (2018) 92:257–282
123
city scale focusses on societal factors of vulnerability besides a primary focus on the
natural hazard.
In the context of this paper, risk is defined as the interaction of the natural hazard sphere
and the social sphere of vulnerability (Wisner et al. 2004; UNISDR 2012). PEARL
expands the definition of the term vulnerability as “the propensity or predisposition to beadversely affected” (IPCC 2012: 5) by further refining the terminology: The propensity of
being affected depends on the underlying concept of susceptibility, as well as on the ability
to recover from disastrous events and capacities to transformation.
The PEARL vulnerability assessment framework presented here consists of a quanti-
tative approach, using statistical data and an extended semiquantitative approach, which
enables to incorporate results from a household survey. This differentiation in the method
proved to be flexible considering the availability of data in different case study areas. In the
following the approach is introduced and applied to the city of Genoa, Italy.
2 Vulnerability assessment
The proposed methodology was developed to allow the combination of data from multiple
sources and knowledge bases. The PEARL project has various case study sites with dif-
ferent preconditions. The proposed methodology can be adjusted to different levels of
information to have a general assessment, based on standard census data, or an extended
assessment with incorporation of local survey data.
The following section introduces some of the current vulnerability assessment frame-
works (or, respectively, risk) of societies at different scales. It also reflects limitations of
current methods and highlights the needs for a progress beyond the state of art.
2.1 Current methods
Literature in the context of vulnerability differs in the spatial scale being contemplated and
in the type of hazard being analyzed. Recently, the number of publications related to the
measurement of risk and vulnerability has increased. Birkmann (2013a) provides an
extensive compilation of methodologies for different scales and levels.
There are methods for spatial vulnerability or risk assessments for different natural
hazards and climate change in general at country level worldwide (WorldRiskIndex, e.g.Welle and Birkmann 2015; Birkmann and Welle 2016) and to multiple stressors (O’Brien
et al. 2004). Moreover, there are assessment methods which incorporate socioeconomic
aspects for specific hazards, like heat waves and flooding (Depietri et al. 2013; Welle et al.
2014), flash floods (Karagiorgos et al. 2016), tsunamis (Jelınek et al. 2012; Birkmann et al.
2010), or with focus on flood risk in areas with cultural heritage (Vojinovic et al. 2015).
There are numerous indices on national level (see e.g. Brooks et al. 2005; Welle and
Birkmann 2015). However, taking a closer look at national level, cities are of major
concern due to the high concentration of people and infrastructure assets. Balica et al.
(2012) developed a Coastal City Flood Vulnerability Index, which is defined by exposure,
susceptibility and resilience. The index was calculated for nine cities and results in a
vulnerability value per city which makes the cities around the world comparable (despite
different kinds of exposure). There are various publications on the risk assessment to
tsunamis for the city of Cadiz, Spain (Birkmann et al. 2010; Jelınek et al. 2012), which
built on an adapted BBC framework (Bogardi, Birkmann, Cardona Framework developed
Nat Hazards (2018) 92:257–282 259
123

in 2004, for more details see Birkmann 2013b: 54). Here, vulnerability is measured based
on exposure, susceptibility and coping capacity. Karagiorgos et al. (2016) combine
physical and social vulnerability in the region of East Attica/Greece. Social vulnerability is
assessed by a composite index based on survey data exclusively.
In order to develop strategies on city level a detailed resolution is required. Depietri
et al. (2013) conducted a social vulnerability assessment to heat waves for the urban area of
Cologne, Germany. The vulnerability assessment is based on the MOVE framework
(Birkmann et al. 2013) and therefore encompassed the components of exposure, suscep-
tibility and lack of resilience. The assessment considers not solely statistical data but also
expert interviews, resulting in a broader set of drivers and elements of vulnerability for the
85 districts of Cologne. Another vulnerability index on city level was developed by Wolf
and McGregor (2013). It conceptualizes vulnerability to heat for the city of London, UK, as
a function of exposure and sensitivity. This comprises next to high temperature areas also
societal aspects like demographics, adaptive aspects, and e.g., the behavior of citizens.
In order to provide valuable information for decision makers “information on vulner-ability to heat [is required] at spatial resolutions finer than the regional or city scale” (Wolf
and McGregor 2013: 59). Wilhelmi and Hayden (2010) proposed a framework for the
analysis of local vulnerability to urban heat stress based on a multilayered, top-down and
bottom-up approach, based also on household data through interviews. The integration of
local practices and knowledge base is essential when aiming to strengthen climate change
adaptation (IPCC 2014) since “social capital influences households’ perception of andcoping with flood risks” (Babcicky and Seebauer 2016: 1017).
The local scale is the most effective and, respectively, valuable scale for decision
making processes (Wilhelmi and Hayden 2010). Wilhelmi and Morss (2013) state that the
vulnerability patterns within ostensible homogeneous urban areas and neighborhoods may
show significant variations.
The review discloses that there is a wide range of vulnerability and risk assessment
methods on global and national scale, as well as on the level of a city as a whole. In cases
where measures are available for city districts, the selection of indicators is rather limited
and closely tied to the specific case study area and its data.
This research aims to close this considerable gap and aims to capture inner-city dis-
parities with regard to socioeconomic aspects. One of the main advantages of the PEARL
vulnerability assessment framework is its flexibility in terms of data. As such it can be
applied in various case study areas and to different types of hazards. In addition, the index
structure allows the incorporation of data from various sources and therefore encourages
triangulation of knowledge.
2.2 PEARL vulnerability assessment framework
The PEARL vulnerability framework uses a robust index (called PeVI in the following) to
get a multifaceted picture of the current status of the societal component of vulnerability.
PeVI is based on a modular structure with three elements: Susceptibility, Coping and
Adaptation and was developed based on the methodology of the WorldRiskIndex (see e.g.
Welle and Birkmann 2015). However, it is adaptable and expandable to fit with local
contexts and requirements. The assessment is primarily based on the secondary data
available for social, environmental and economic indicators of vulnerability.
The PeVI aims to cover as many aspects as possible in order to have a proper insight
into the vulnerability of a city or a region under analysis.
260 Nat Hazards (2018) 92:257–282
123

Tab
le1
ComponentsofthePEARLVulnerabilityAssessm
ent(inputfrom
PEARLhousehold
survey
highlig
hted
inita
licsandunderlined)
SUSC
EPT
IBIL
ITY
COPI
NG
ADAPT
ATIO
N
1.D
EMO
GR
APH
Y
1.1.
Vul
nera
ble
Age
Gro
ups
1.2.
Elde
rly li
ving
alo
ne1.
3.Po
pula
tion
dens
ity
1.4.
Lang
uage
Abi
lity
/ Orig
in--
----
----
----
----
----
----
----
----
----
-----
----
----
----
----
----
-2.
HEA
LTH
2.1.
Num
ber o
f dis
able
d or
chr
onic
ally
ill p
erso
ns--
----
----
----
----
----
----
----
----
----
-----
----
----
----
----
----
-3.
POV
ERTY
AN
D IN
CO
ME
3.1.
Dep
ende
ncy
Rat
io3.
2.Sh
are
of p
opul
atio
n liv
ing
unde
r na
tiona
l po
verty
lin
e3.
3.U
nem
ploy
men
t rat
e--
----
----
----
----
----
----
----
----
----
-----
----
----
----
----
----
-4.
HO
USI
NG
4.1.
Bui
ldin
g co
nditi
ons
4.2.
Type
of b
uild
ing
5.G
OV
ERN
MEN
T A
ND
AU
THO
RIT
IES
5.1.
Crim
e ra
tes p
er X
pop
ulat
ion
5.2.
Turn
out a
t loc
al e
lect
ions
(%)
5.3.
Trus
t in
insti
tutio
ns5.
4.Pe
rfor
man
ce P
erce
ptio
n--
----
----
----
----
----
----
----
----
----
-----
----
----
----
----
----
----
----
----
-6.
SOC
IAL
NET
WO
RK
6.1.
Hou
seho
ld si
ze--
----
----
----
----
----
----
----
----
----
-----
----
----
----
----
----
----
----
----
-7.
ECO
NO
MIC
CO
VER
AG
E7.
1.H
ouse
hold
inco
me
7.2.
Insu
ranc
e (li
fe in
sura
nces
exc
lude
d)7.
3.Fi
nanc
ial B
acku
p--
----
----
----
----
----
----
----
----
----
-----
----
----
----
----
----
----
----
----
-8.
MED
ICA
L SE
RV
ICE
8.1.
Num
ber o
f phy
sici
ans /
hos
pita
l bed
s8.
2.A
cces
s to
med
ical
serv
ice
8.3.
Vac
cina
tion
cove
rage
8.4.
Med
ical
Ser
vice
s Per
cept
ion
----
----
----
----
----
----
----
----
----
-----
----
----
----
----
----
----
----
----
---
9.IM
MED
IATE
AC
TIO
N9.
1.M
ulti-
stor
ey b
uild
ings
----
----
----
----
----
----
----
----
----
-----
----
----
----
----
----
----
----
----
---
10.
INFO
RM
ATI
ON
10.1
.Acc
ess t
o ea
rly w
arni
ng a
nd e
vacu
atio
n in
form
atio
n10
.1.1
.Dis
sem
inat
ion
of e
arly
war
ning
10.1
.2.K
now
ledg
e of
eva
cuat
ion
10.1
.3.E
arly
War
ning
Lea
d tim
e pe
rcep
tion
10.2
.Int
erne
t acc
ess p
er X
hab
itant
s10
.3.S
mar
tpho
ne u
ser p
er X
hab
itant
s--
----
----
----
----
----
----
----
----
----
-----
----
----
----
----
----
----
----
----
-11
.A
WA
REN
ESS
/ PR
EPA
RED
NES
S11
.1.R
isk
Kno
wle
dge
11.2
.Inc
reas
ed P
repa
redn
ess
11.3
.Per
cept
ion
of P
repa
redn
ess
12.
EDU
CA
TIO
N A
ND
RES
EAR
CH
12.1
.Edu
catio
n Le
vel
/Pr
opor
tion
of p
eopl
e ho
ldin
g hi
gher
qua
lific
atio
n 12
.2.N
EETs
12.3
.Lite
racy
rate
----
----
----
----
----
----
----
----
----
-----
----
----
----
----
----
----
----
----
---
13.
GEN
DER
EQ
UIT
Y
13.1
.Gen
der
parit
y in
edu
catio
n (p
rimar
y, s
econ
dary
and
te
rtiar
y ed
ucat
ion)
13.2
.Gen
der p
arity
in a
nnua
l gro
ss p
ay (f
emal
e-m
ale)
----
----
----
----
----
----
----
----
----
-----
----
----
----
----
----
----
----
----
---
14.
ENV
IRO
NM
ENTA
L ST
ATU
S
14.1
.Air
qual
ity d
ata
14.2
.Gre
en in
frast
ruct
ure
14.3
.Clim
ate
Cha
nge
Perc
eptio
n--
----
----
----
----
----
----
----
----
----
-----
----
----
----
----
----
----
----
----
-15
.IN
VES
TMEN
TS
15.1
.Life
exp
ecta
ncy
15.2
.Flo
od p
rote
ctio
n m
easu
res
15.3
.Ris
k aw
aren
ess
15.4
.Enh
ance
men
t of E
arly
War
ning
Nat Hazards (2018) 92:257–282 261
123
The first element of PeVI is Susceptibility, which is defined as the current status of a
society and its likelihood to be harmed. It refers to the condition of exposed citizens and
infrastructure to a certain hazard. The susceptibility component for PeVI was defined by
four major components: Demography, Health, Poverty and Income and Housing (Table 1).
The second element used in the computation of the index is Coping, which is evaluated
by strengths and resources for direct actions which leads to a reduction in the consequences
of a hazardous event (Birkmann and Welle 2015). This not only implies knowledge about
local natural hazards and resources, but also the ability to react immediately when a
disaster strikes to minimize harming impacts. In this context coping includes the following
seven modules: Government and Authorities, Social Network, Economic Coverage, MedicalService, Immediate Action, Information and Awareness/Preparedness.
Finally, the third element of the PeVI represents adaptive capacities of a community.
Adaptation in contrast to coping, which is linked to the impacts, is closer related to change
(Birkmann 2011). In order to deal with negative impacts of future disasters, adaptive
capacities enable societies to transform. Therefore, adaptive capacities include medium to
long-term changes and a future-oriented view (Birkmann and Welle 2015). The following
four categories were used to represent Adaptation for the PeVI: Education and Research,Gender Equity, Environmental Status and Investments.
The respective components of Susceptibility, as well as Coping and Adaptation, arefurther subdivided to ensure high flexibility to different requirements (see Table 1). Data
sets are individually determined for each case study location with regard to local condi-
tions. Since the availability of data is case specific, the definition of indicators can alter,
both for inclusion or exclusion of new components. Whatever the case, the development of
the compound index needs to be as comprehensive as possible. Data collection includes
existing statistical data (e.g. census data, disaster loss data) at local and provincial levels.
Therefore, the scale of the assessment is highly dependent on the availability of data from
the case study area (Birkmann 2013a).
The PEARL vulnerability assessment has the purpose to display the composition of
relative vulnerability in a specific case study area. Hence, all calculated indicators consist
either of ratios, or are normalized between 0 and 100, and can only be seen with regard to
the respective spatial entity. There are several normalization methods that can be applied in
this context (e.g. OECD 2008). In the present research work the min–max normalization
method was used. An equal weight scheme was applied to increase transferability and
transparency but also to foster communication with stakeholders and decision makers
(Birkmann and Welle 2016; Karagiorgos et al. 2016; Cutter et al. 2010; Rød et al. 2012).
Due to the inherent characteristics of vulnerability it is not reasonable to define thresholds.
Since the aim was to illustrate disparities within a case study site, the quantile method was
used for spatial visualization.
2.2.1 Census-based vulnerability assessment framework
The content of Table 1 is based on the literature review and discussions among scientists
during several project workshops. The PeVI has been designed in a way that a general
analysis can be conducted by using census data. The census 2011 was the first joint
assessment of census data in the member states of the European Union. The scope of the
assessment can be altered and extended with regard to data availability. The indicators can
be adjusted based on local conditions, but the process of elaboration needs to be trans-
parent and reproducible.
262 Nat Hazards (2018) 92:257–282
123

2.2.2 Household survey enhanced vulnerability assessment framework
In addition to the PeVI based on census data an alternative and extended methodology was
performed in the project. The in-depth analysis of vulnerability was possible through the
inclusion of data from a household survey. The survey was carried out with the purpose of
gaining knowledge about local vulnerability patterns and household perception on flood
vulnerability and risks. Earlier research highlights the added value of the combination of
census-based methods with “mixed-methods” (Wilhelmi and Morss 2013: 59). Information
deriving from the household survey is highlighted in italics and underlined in Table 1.
3 Application to the city of Genoa
The proposed framework was applied and evaluated on the case study of Genoa, Italy.
After introducing general conditions for the case study, the location, data availability and
calculation of the indicators, as well as the PeVI, are presented and discussed.
3.1 Case study Genoa, Italy
Genoa is the Liguria county seat, situated in Northwestern Italy. It is located in the Gulf of
Genoa on the Ligurian Sea and is the sixth largest city in Italy with an estimated population
of 585.000 inhabitants and area of 240 km2 (Faccini et al. 2015b; Sacchini et al. 2012).
Genoa is one of Europe’s largest cities on the Mediterranean Sea, and the largest seaport in
Italy is located here. The PEARL project focusses on the last 5 km of the Bisagno, which is
one of the most problematic rivers of the region in terms of floods (Faccini et al. 2016).
The Bisagno river basin is set in an area with complex geomorphology and large elevation
changes upstream which are the driving forces for flooding-related issues in its downstream
urban area. The risk of flooding is further increased by the high degree of urbanization that
over the years considerably modified the natural path of the river. Around 1930, the last
1.3 km of the river (from Brignole railway station to the mouth) was covered in order to
construct buildings and streets. This resulted in a decrease in discharge capacity and
increase in flood occurrence in the urban area (Faccini et al. 2015c).
The combination effects among Bisagno river basin morphology, man-made modifi-
cations to urban area and locally generated extreme hydrometeorological events (heavy
precipitations, V-shaped storms) are the main causes of pluvial and flash floods that hit the
city along the years (Acquaotta et al. 2017). The vulnerability assessment focusses on the
flood event of October 2014. Besides this event, most recent flood events in Genoa city
took place in 2010 and 2011. After the Second World War notable events occurred in 1951,
1953, 1970 and 1992 (Faccini et al. 2015a; Faccini et al. 2015c). All events resulted in
displacement of people and high economic damage and in many cases also in fatalities.
3.2 Overview of data collection methods
Data collection methods included field surveys, as well as open access data bases and
official information sources (e.g. public administrations). An overview of these methods
and details of how there were used to assess vulnerability in Genoa are discussed in this
section.
Nat Hazards (2018) 92:257–282 263
123

3.2.1 Census data
Data for the underlying indicator calculation were extracted from publicly accessible
statistical data from the Italian National Institute of Statistics (ISTAT). The census ref-
erence date for the data obtained is October 9, 2011. The census data comprises personal
information, as well as building information. With regard to the underlying entity this
includes absolute values of residential population and information on age groups, level of
education, number of illiterates and employment status. The respective data can be further
divided by gender. In addition also information concerning the origin of the residential
population and household size can also be obtained. Building information comprises
aggregated values regarding the type of use, construction material and period, the number
of floors and rooms, as well as the classification of building conditions. Additional
information concerning Italian census data can be found in ISTAT (2016).
3.2.2 Household survey data collection
The household survey focusses on assessing vulnerability of a subsample of local popu-
lation living in areas affected by hydrometeorological disasters. The examined case study
area has been recently and recurrently affected by flood events.
Wilhelmi and Morss (2013) highlighted that there is a predominantly lack of data
concerning coping and adaptive capacity on local level. On the basis of the questions
covered in the survey the intention was to close this gap and to collect data with regard to
these capacities.
Ten local interviewers with background in environmental engineering or geomorphol-
ogy supported the researchers with the implementation of the survey. The extent of the
survey was selected based on the extent of the 2014 flood event in the Bisagno area. The
affected area was divided into ten sub-areas different in size but homogeneous in number
of inhabitants. These were defined by census data of population distribution, elaborated
with the support of GIS tools and related functionalities. Within each sub-area the inter-
viewed households were chosen randomly. A total of 500 persons took part in the
household survey. Spatial distribution of the survey is highlighted in Fig. 1 and referred to
as the area of the 2014 flood event.
3.2.3 Spatial information
In order to map the PeVI and its components geo-spatial data from Open Street Map, ESRI
ArcGIS, national open data servers and data sources from local administrations were
sourced. The most relevant data sets are listed below:
● city, region and country administrative boundaries,
● polygons representing the census administrative areas,
● outline of the Bisagno river catchment,
● outline of the 2014 flood event.
3.3 Application of the census-based vulnerability assessment framework
The structure of the census data for the city of Genoa has two main administrative areas of
interest: the census zones or polygons (SEZ—Sezioni di censimento), where each SEZ code
uniquely identifies each section of the 2011 census within the municipal area (ISTAT
264 Nat Hazards (2018) 92:257–282
123

2016) and the census areas (ACE—Area di censimento). ACE corresponds to a collection
of SEZ sections, and each polygon has one unique identifier within the municipality. The
PeVI was calculated on the smallest scale possible. In this case the analysis was carried out
on the basis of 3412 SEZ census sections. All computations for the indicators were done in
MS Excel, and the results were transferred to the corresponding geographical unit in GIS
using the Join functionality based on the unique SEZ identifier. The indicators of the PeVI
predominantly were calculated as ratios. “No Data” fields were filtered and excluded from
the computation of indicators. By applying this constraint the PeVI could be calculated for
a total of 3083 of SEZ areas.
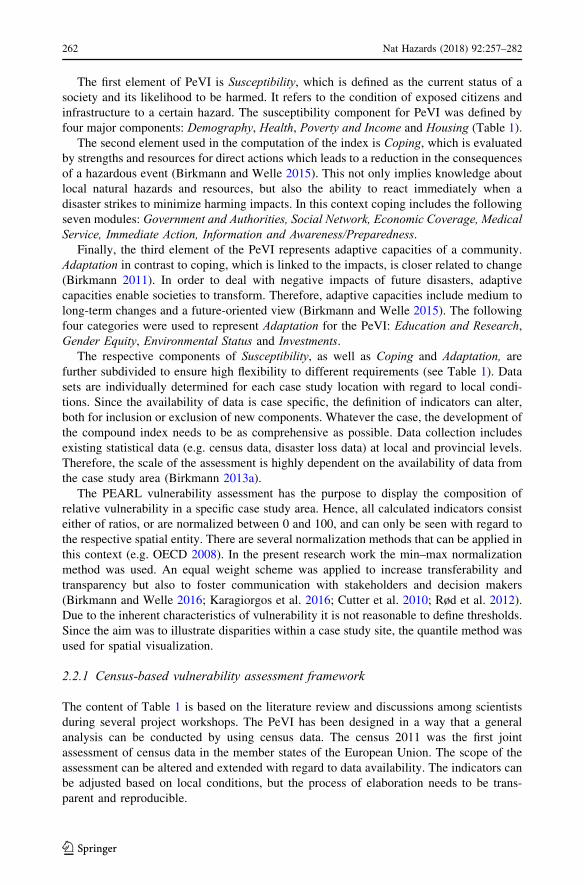
The analysis of the results obtained from SEZ areas was not conclusive and did not add
an additional value to the map and the subsequent interpretation process. On the contrary a
wide graphical dispersion of the results was obtained due to the level of detail and sta-
tistical differences between SEZ areas (see Fig. 2). It was considered that the
representation on SEZ level is unpractical for stakeholders and the decision making pro-
cess; therefore, the results of the PeVI were aggregated into the ACE areas, which in the
case of Genoa corresponds to a total of 40 units. This level of representation gives a more
clear view of the results. This process was done using the mean value as statistical variable
using ArcGIS.
3.3.1 Susceptibility
The following section discusses the composition of Susceptibility and describes the data
used for the calculation (Fig. 3). The respective indicators were carefully chosen based on
data availability and local and theoretical relevance (Wilhelmi and Morss 2013).
Fig. 1 Case Study Site Genoa, Italy
Nat Hazards (2018) 92:257–282 265
123
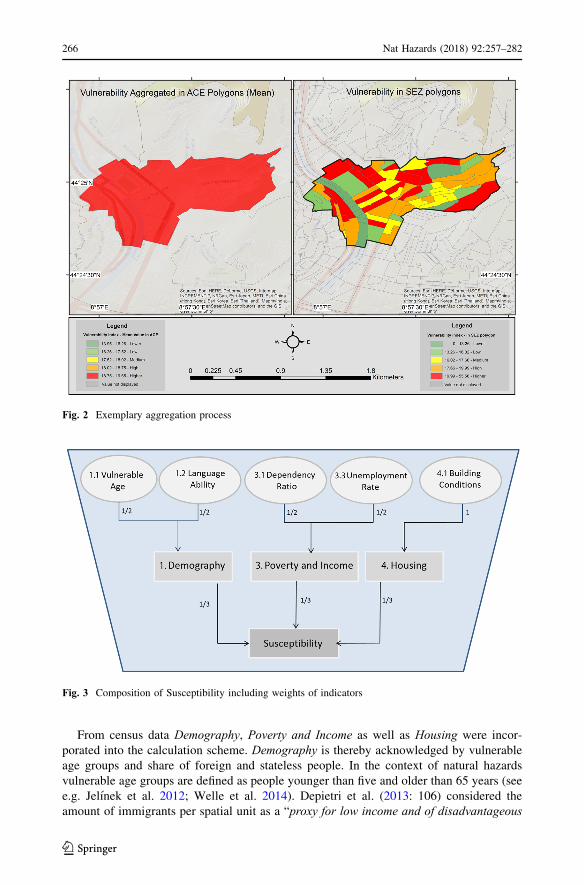
From census data Demography, Poverty and Income as well as Housing were incor-
porated into the calculation scheme. Demography is thereby acknowledged by vulnerable
age groups and share of foreign and stateless people. In the context of natural hazards
vulnerable age groups are defined as people younger than five and older than 65 years (see
e.g. Jelınek et al. 2012; Welle et al. 2014). Depietri et al. (2013: 106) considered the
amount of immigrants per spatial unit as a “proxy for low income and of disadvantageous
Fig. 3 Composition of Susceptibility including weights of indicators
Fig. 2 Exemplary aggregation process
266 Nat Hazards (2018) 92:257–282
123
condition due to difficulties in understanding warning messages”. Both indicators con-
tribute equally to Demography and therefore have a weight of one half (see Fig. 3).
Poverty and Income is measured on the one hand by the unemployment rate and on the
other hand by the dependency ratio. The dependency ratio is a measure which aims to
capture economic reliance of parts of the community on other parts and as such it is defined
as the sum of people younger than 15 years and older than 65 years. This is then divided by
the number of people at working age in between. A high dependency ratio indicates that
the working population group faces a major challenge to support the economically non-
active population (United Nations 2007). The unemployment rate for Genoa was calculated
by dividing the number of unemployed by the number of potential workers. More pre-
cisely, all persons are aged 15 or older, and the number of unemployed in this case includes
only the persons who are registered as seeking employment.
Due to different building conditions, individual buildings are more or less resilient
(Vojinovic et al. 2015). For the Genoa case study ISTAT (2016) provides necessary data
describing the conservation status of the building with four classes (very good/good/
medium/bad). The respective indicator was calculated by summing up the weighted dif-
ferent categories and dividing the sum by the total of residential buildings. Here the
category bad was applied with the highest weight, since this increases the Susceptibilityand consequently Vulnerability.
3.3.2 Coping
Vulnerability includes aspects which make people susceptible to the negative impacts of
natural hazards and factors which increase their ability to cope and adjust to them. For the
calculation purposes the lack of coping is taken into consideration, to assess negative
impacts on vulnerability.
Coping consists of two components: Social Network and Immediate Actions. Socialenvironment has a high impact on flood-risk behavior (Bubeck et al. 2013). Welle et al.
(2014) state that an increase in household size decreases vulnerability due to mutual help.
Following this line of arguments single households were weighted higher in the assessment
than larger households, since the assumption was that smaller households increase vul-
nerability. The individual households were multiplied with the respective weights, summed
up and divided by the total number of households.
Having a second floor to take refuge to is one way of an Immediate Action for getting to
safety and having the possibility to store belongings securely from the hazard. Since the
lack of coping is incorporated into the calculation scheme, the respective indicator is
computed by the number of single floor houses divided by the total number of houses.
Immediate Action and Social Network are weighted with one half (see Fig. 4).
3.3.3 Adaptation
In contrast to coping, adaptation processes include societal changes and mid- to long-term
transformation processes. Hence, the focus is orientated toward the future.
In Genoa, two pillars of adaptive capacities were calculated based on census data (see
Fig. 5).
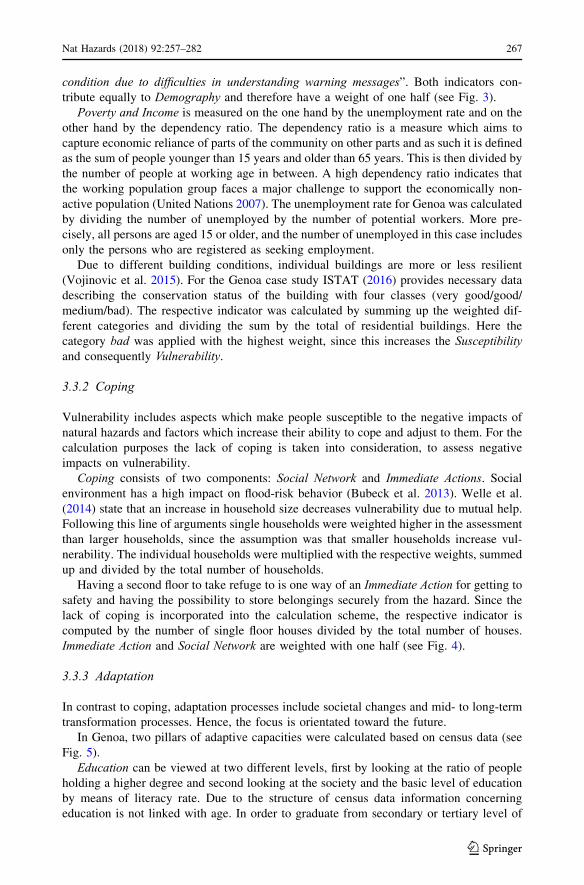
Education can be viewed at two different levels, first by looking at the ratio of people
holding a higher degree and second looking at the society and the basic level of education
by means of literacy rate. Due to the structure of census data information concerning
education is not linked with age. In order to graduate from secondary or tertiary level of
Nat Hazards (2018) 92:257–282 267
123
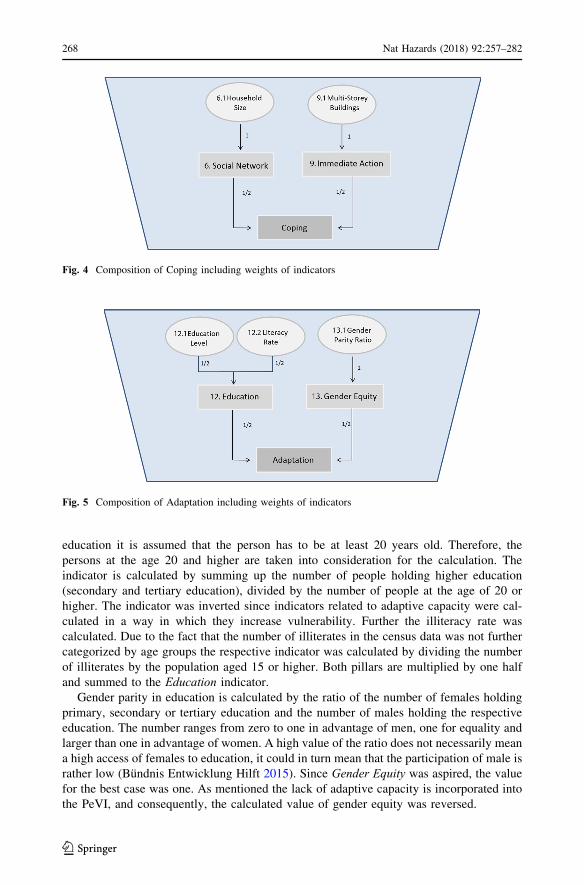
education it is assumed that the person has to be at least 20 years old. Therefore, the
persons at the age 20 and higher are taken into consideration for the calculation. The
indicator is calculated by summing up the number of people holding higher education
(secondary and tertiary education), divided by the number of people at the age of 20 or
higher. The indicator was inverted since indicators related to adaptive capacity were cal-
culated in a way in which they increase vulnerability. Further the illiteracy rate was
calculated. Due to the fact that the number of illiterates in the census data was not further
categorized by age groups the respective indicator was calculated by dividing the number
of illiterates by the population aged 15 or higher. Both pillars are multiplied by one half
and summed to the Education indicator.
Gender parity in education is calculated by the ratio of the number of females holding
primary, secondary or tertiary education and the number of males holding the respective
education. The number ranges from zero to one in advantage of men, one for equality and
larger than one in advantage of women. A high value of the ratio does not necessarily mean
a high access of females to education, it could in turn mean that the participation of male is
rather low (Bundnis Entwicklung Hilft 2015). Since Gender Equity was aspired, the valuefor the best case was one. As mentioned the lack of adaptive capacity is incorporated into
the PeVI, and consequently, the calculated value of gender equity was reversed.
Fig. 5 Composition of Adaptation including weights of indicators
Fig. 4 Composition of Coping including weights of indicators
268 Nat Hazards (2018) 92:257–282
123

3.3.4 Vulnerability Index
The aim of a vulnerability assessment is to get a comprehensive overview about the current
state of a system. The vulnerability map that results from this process allows to draw
conclusions at one glance, because every spatial entity is assigned to one value. The PeVI
was calculated by combining Susceptibility, Coping and Adaptation, where equal weights
were applied for each element. The availability of data concerning coping and adaptive
capacities was found to be rather limited in the case study area. For both indicators only
two of the initially proposed categories (Table 1) were taken into consideration. Figure 6
shows the structure of indicator development for the compound PeVI based on census data.
3.4 Application of the household survey enhanced vulnerability assessmentframework
The household survey enhanced PeVI comprises the combination of statistical data,
derived from census data (ISTAT 2016), geo-statistical data and information on household
level.
As in other research projects (e.g. Kuhlicke et al. 2011: 799) the collection of household
data was examined to also serve other work steps of the PEARL project with specific
purposes and guidelines. The purpose of the questionnaire was twofold: to engage local
stakeholders (Gourgoura et al. 2015) and to incorporate perception of the citizens into the
index. A high proportion of questions with quantitative information was incorporated
which can be categorized into three groups:
● Type (1): Questions on Likert Scale ranging from strongly agree to strongly disagree
● Type (2): Questions based on ratings from 0 to 10
● Type (3): Questions, which can be answered with yes or no.
As part of a workshop researchers agreed on three different schemes for the transfer of
answers to numbers. For Type (1) it is assumed that a level of strong agreement to a
statement (e.g., “The climate change is adversely affecting the Liguria region”) can be
captured with the value of “0,” while the level of strong disagreement is transferred into a
maximum value of “100”. All intermediary steps are assumed to be evenly spread over the
minimum and maximum value. For the questions of Type (2) the conversion into indices is
also following an even distribution from 0 to 100 based on the 10 classes of response
Fig. 6 Composition of the compound PEARL vulnerability index based on census data (Genoa)
Nat Hazards (2018) 92:257–282 269
123

options. For the Type (3) questions all answers in affirmance were transferred into a value
of “20,” while negations are assigned the value “80.”
The validation of data was performed by using two rank-based nonparametric test
methods for independent samples (Mann–Whitney U and Kruskal–Wallis H test). The
advantage of these methods is that the data does not require to be normally distributed.
Both tests can be applied for variables on ordinal scale. However, there are assumptions for
both methods that have to be met: The scale of the dependent variable has to be ordinal at
least, and the independent variable has to consist of two or more categorical independent
groups. Moreover, independence of observations has to be ensured. All respective
assumptions can be met for the underlying data.
Consequently, vulnerability and its respective indicators were calculated for 500
respondents, geo-referenced through the address of the household. A point shapefile in
ArcGIS was prepared using the addresses and geo-coding functionalities. For the cases
where no address was available a point shapefile was randomly created within the area that
was flooded in 2014 and it was used to undertake the computation. The household survey
results were coupled with indicators obtained from the census-based vulnerability
assessment in MS Excel, and all vulnerability indicators were then computed and incor-
porated into the ArcGIS shapefile of the household survey (building level). The next step
was to aggregate the vulnerability assessment from the point shapefile into the respective
polygon at SEZ level on the census data. This was done by applying the Spatial Joinfunctionality in ArcGIS to link each respondent of the survey with their associated SEZ
polygon. Once each point was given the attribute of the unique identifier (ID) for the SEZ
polygon an aggregation of points was performed based on the SEZ ID attribute using the
mean value. ArcGIS dissolved method was applied in this operation. In such SEZ polygons
including the mean values for each one of the SEZ polygon that contains household data
were obtained.
The following sections describe the process of incorporating household survey data for
the 2014 flooding event. The inclusion of household data modifies the mathematical
structure, and consequently the result and pattern of the PeVI. The PeVI is particularly
enhanced by the personal assessment of Coping and Adaptation of local respondents, and
this is evident from Table 1 and Fig. 7.
3.4.1 Susceptibility
Since no additional data from the household survey were incorporated into the calculation
of the susceptibility component, the procedure and results from the census-based PeVI and
the PeVI enhanced with survey data are identical (as discussed in Sect. 3.3.1).
3.4.2 Coping
The household survey contributed to an enriched depiction of coping capacities, adding to
the multi-dimensional picture of societal vulnerability. Information was used for the
development of five additional indicators related to Coping. These are Government andAuthorities, Economic Coverage, Medical Service, Information and Awareness/Prepared-ness. Next to these five indicators, two census-based indicators (refer to description in Sect.3.3.2) were used.
In terms of Government and Authorities, the data obtained from two survey questions
were incorporated. The first survey question addressed whether the inhabitants trust the
local administrative bodies, whereas the second survey question addressed the performance
270 Nat Hazards (2018) 92:257–282
123

of flood-risk management authorities. By applying equal weights the answers were com-
bined into the indicator. The Economic Coverage indicator looked on one hand at the
institutional situation to recover from losses by the insurance coverage and on the other
hand at the personal capacities by self-rating of financial resources. The Medical Serviceindicator was explored by the level of agreement to the question whether the supply with
hospitals, ambulances and rescue units in Genoa is satisfactory.
Another important aspect of Coping is information flow, especially the access to early
warning and evacuation information. Crucial parts of the information flow are dissemi-
nation time, knowledge of evacuation and lead time, which all three were considered
explicitly in the questionnaire and contributing one-third each to the Information indicator.
The last important addition to the census-based coping component was given by the
Awareness/Preparedness indicator. Here the flood risk knowledge was queried in addition
to whether the respondents believe that they are now better prepared for future flooding
events and a ranking of their perception of preparedness and expectance of damages.
Figure 7 illustrates the enrichment of the Coping indicator in the context of the overall
compound index of social vulnerability.
3.4.3 Adaptation
When it comes to future orientated adaptation processes, the attitude of people affected is
critical, as it determines whether or not someone is willing to invest or to take action. For
the calculation of Adaptation two additional indicators were developed based on the
household survey data.
Environmental Status was evaluated by the extent of approval to the statement that
climate change is affecting the Liguria region.
Parker and Priest (2012: 2928) name “human factors and related social issues” as
crucial for the success of early warning systems. For the Investments component the survey
queried the Enhancement of Early Warning. This was assessed by the level of agreement of
respondents to the statement: “If the early warnings distributed to the population would bemore precise and would reach me more directly I would follow them more than I do now”.
Adaptation supplemented by the household survey and combined with the census data
(Education and Research and Gender Equity) consists of four indicators, each adding one
quarter to the calculation of Adaptation.
Fig. 7 Composition of the compound PEARL vulnerability index with household survey input (Genoa)
Nat Hazards (2018) 92:257–282 271
123

3.4.4 Vulnerability Index
Since the incorporation of household survey results influence the structure and computation
of the indicators, the final calculation of Vulnerability using the enhanced methodology was
also affected. Figure 7 illustrates the modular structure of the compound index and visu-
alizes the valuable input of the household survey data to the PeVI.
4 Results and discussion
In this section the results obtained from the calculation of the compound vulnerability
index in Genoa are presented and discussed. As described above, the PeVI is the result of
the combination of Susceptibility, Coping and Adaptation. In the census-based vulnerabilityassessment carried out for the entire municipality of Genoa the SEZ polygons were
aggregated into ACE areas using the mean values. Based on five classes, the vulnerability
values of the entities were translated into a qualitative classification. The quantile method
represents each class equally in the map. This does not necessarily mean that a spatial
entity, which was addressed to the “lower” (green) group, is not vulnerable and does not
need any support. However, viewed relatively, it has a lower priority, with regard to the
other entities, when it comes, e.g., to investments concerning vulnerability mitigation.
The spatial analysis map for the census-based PeVI is given in Fig. 8. The highest
vulnerability value was calculated for the small polygon corresponding to the business and
trade area of the city. For this particular polygon the underlying Susceptibility also
achieved the maximum value and as such it was assigned as the red category. While the
Fig. 8 Result of the census-based PeVI
272 Nat Hazards (2018) 92:257–282
123

related Coping and Adaptation values are presented in the orange category, indicating a
high discrepancy in capacities. The western part of the harbor area also has higher vul-
nerability values, while the area of the airport is orange (high). Both areas have a relatively
sparse population.
Along the river course of the Polcevera, which, together with the Bisagno stream
represents one of the most flood prone areas of the city, the highest vulnerability category
was calculated. The area is located in a city district with a former industrial characteristic,
now densely populated, and is one of the most working-class zones in Genoa, with a high
rate of immigrates and low incomes. Here the underlying values of Coping are in the
middle range, while the maximum red categories were achieved for the lack of Adaptationand Susceptibility. Other red hot spots are located in the catchment area of the Bisagno. The
area is characterized by residential buildings, as well as commercial/industrial sites. The
Bisagno with its final reach predominantly covered by concrete poses a major threat to
flooding (Faccini et al. 2016). The areas flooded in 2014 are marked with yellow color in
the upper catchment, merge with a color gradient from yellow to red and then green color
in the lower parts. The green area in the lower parts has the lowest PeVI values with
underlying Susceptibility, Coping and Adaptation (all subindices, respectively, it the green
category) due to its residential usage and the generally good social and economic condi-
tions of its population. The green areas in the eastern part of the city are more prosperous
areas, with the main focus on tourism. The area in the eastern edge is a former fishing
village with a small touristic harbor. It shows predominantly very good Susceptibility and
Adaptation values, and therefore, the PeVI is marked with green color.
While the result of the census-based PeVI covers the entire city of Genoa, the extent of
the household survey enhanced PeVI focusses on the flooded area of the 2014 event. The
spatial unit used for the enhanced approach was SEZ, which influenced the vulnerability
values. Generally speaking, the mean aggregation process from SEZ into ACE smoothened
the PeVI. The range of vulnerability values is wider for the assessment on SEZ basis. The
color coding based on the quantile method relates to the areas covered by the survey
(Fig. 9). For the spatial display only the SEZs, where the survey was conducted, were taken
into consideration. Figure 9 depicts the PeVI enhanced by household survey input on the
right side, while the map on the left displays the census-based PeVI.Disparities are obvious at the first glance at both maps presented in Fig. 9. Hence,
Fig. 10 selects exemplary polygons, to give more clarity in those SEZ polygons with higher
differences. The SEZ with the ID ˈ2007ˈ can be referred to as an example. An increase in
both pillars Coping and Adaptation results in a change in category from the lowest to the
highest category. Based on the comparative approach of the quantile method the census
area´s PeVI is pulled down, in objection to the good census rating, by the subjective rating
of the inhabitants of the block. Compared to the other areas within the flood extent this
leads to the category of higher vulnerability. The main driving force behind this is people’s
negative rating of Climate Change and Investment. That puts a spotlight on the future
orientated development of the quarter. Similarly, SEZ with ID ˈ1945ˈ is also rated poorly
by its inhabitants concerning Coping and Adaptation, contributing equally to the PeVI.
Within Coping the relative worse ranking is forced on one hand by Economic Coverageand on the other hand by Awareness/Preparedness, indicating the expectation of financial
support in case of losses. The other indicators, especially Medical Service and Information,clearly reach higher satisfaction among the respondents. Concerning Adaptation there is a
general approval of the negative impacts of climate change but even surpassed by the
perception of Enhancement of early warning. To summarize in short, the perception of the
people outweighs the baseline of lower vulnerability (census based). The opposite dynamic
Nat Hazards (2018) 92:257–282 273
123

Fig. 9 Result of household survey enhanced PeVI and census-based PeVI
Fig. 10 Comparison of SEZ polygons with remarkable differences in both methodologies
274 Nat Hazards (2018) 92:257–282
123

of relative lower vulnerability based on household survey data shows lower perception of
vulnerability, although higher susceptibility to vulnerability based on the census data. For
instance SEZ ˈ2079ˈ improves its ranking from red to yellow by maintaining its vulnera-
bility score but improving relatively to the other SEZs.
Other areas which obviously change are the SEZs with the IDs ‘2273’, ‘2310’ and
‘2307’. All three improved their ranking. It is interesting to observe that this is less related
to the impact of Adaptation, but more connected to Coping, stating the peoples worry in
inappropriate short-term strategies and capacities. The SEZs ‘2267’ and ‘2253’ mark a hot
spot in vulnerability, building a cluster of high values. Local Morans I-Index categorizes
both as a cluster with statistical significant high values surrounded by high values. Again
the major concern pertains to the immediate action strategies.
Altogether, the results show a distinct spatial distribution and allow not only to identify
clusters, but also to explore all the different facets and aspect of societal vulnerability.
4.1 Validation of the census-based approach using sensitivity analysis
The construction and development of a compound index, in order to assess complex
matters to simplify them or to understand the broader picture, are challenging and require
to consider a multitude of needs (Saisana et al. 2005). The framework, especially in this
case, has to foster adaptability and transferability as straightforward as possible, but also
taking into account the complexity of the topic and demands in terms of data requirements
and mathematical construction. Important aspects of indicator construction are trans-
parency, robustness and traceability (Welle and Birkmann 2015). To ensure the quality of
PeVI the following part examines reliability, exploratory factor analysis and sensitivity
analysis.
Reliability analysis scrutinizes if the indicators or items are suitable to describe the
overall question: Vulnerability. Hence, the internal consistency and accordingly homo-
geneity of the items are tested. The most common measurement of reliability is the
Cronbach Coefficient alpha, having values from zero to one, raising the questions of an
adequate threshold concerning reliability. Depending on the literature and consulting
different disciplines values from 0.6 to 0.8 are recommended (OECD 2008). Calculating
Cronbach’s alpha for the vulnerability indicators taking the whole bundle of ten census
data input indicators into consideration the result displays a strong reliability with Cron-
bach’s alpha of 0.982. Another measurement of reliability is Guttman Lambda which
calculates a succession of six Guttman Lambdas for different versions of the model. The
highest value of the succession can be interpreted as the minimum reliability (Janssen and
Laatz 2013). Using the whole set of indicators the highest Guttman Lambda of the
sequence is the sixth with 0.998, showing strong reliability.
In order to conduct exploratory factor analysis (EFA) a commonly used criterion to test
the suitability of data for analysis is the Kaiser–Meyer–Olkin criterion (KMO). If the KMO
is lower than 0.5, the data are not suitable for EFA and it should not be proceeded, due to
the fact of little shared variance of the intercorrelation matrix. Values higher than 0.7 are
suitable and higher than 0.8 are good (Buhner 2006). Resulting in a KMO of 0.75, a
medium but still encouraging value to proceed is reached. To safeguard the robust outcome
of the EFA the unweighted least square extraction method is chosen (Zygmond and Smith
2014). Following the procedure described in “Handbook on Constructing Composite
Indicators” (OECD 2008) the eigenvalues of 0.952 for Susceptibility, 0.994 for Coping and
0.943 for Adaptation justify the implementation of equal weights of, respectively, one-third
to each of it. Extracting only one factor no rotation is carried out.
Nat Hazards (2018) 92:257–282 275
123

Creating a complex model of an even more sophisticated topic can result in an abstract
black box. Here sensitivity analysis is important to understand the response of the model,
generating an understanding and hence a range of trust. Saltelli (2002: 579) define sen-
sitivity analysis as “the study of how uncertainty in the output of a model (numerical orotherwise) can be apportioned to different sources of uncertainty in the model input”.According to the definition, the analysis distinguishes which input has significant impact
on the output and which variables do not. In general there is a distinction of global
sensitivity, where all parameters are varied at the same time and local sensitivity analysis,
where only one variable is changed and the others are kept constant. In contrast to the local
global sensitivity also takes into consideration the uncertainty inherent to each single input
factor and is therefore applied to PeVI. Typically for many compound indices a Monte
Carlo method is the common way of assessing sensitivity. The weakness here is the high
amount of computations and the computational effort needed. Moreover, the assumption of
independent indicators can hardly be expected entirely in the field of social science. The
advantage of using a Bayesian approach is to reduce the number of runs, while still
achieving reliable results due to the fact that the standard deviation connected to the
estimates is smaller (Oakley and O’Hagan 2004). This is attained by explaining each
variable as a function and adding Gaussian noise to the function which is normally dis-
tributed. Figure 11 displays the result of the sensitivity analysis and consists of three parts.
The left part shows the resulting curves of the sensitivity. The x-axis is hereby the original
input scaled from − 0.5 to 0.5 and the y-axis the variance of the indicators. Discussing the
curves a steep curve explains a strong effect on the output, whereas a flat or horizontal
curve can be seen as low impact and consequently the indicator would be open for dis-
cussion whether to include or not, due to the limited impact and explanatory power of the
variable. Following this line of argumentation all three indicators show strong impact on
vulnerability and hence their justification. Considering the middle and right graphs of
Fig. 11 Result of the sensitivity analysis for Susceptibility, Coping and Adaptation for the census-basedassessment
276 Nat Hazards (2018) 92:257–282
123

Fig. 11 the size of the boxplot is showing how the respective indicators are influencing the
PeVI, meaning an indicator with small box has a precise impact. All three indicators are
having a median higher than zero and consequently contributing and increasing the
statement of the overall indices. The right picture is showing the interaction of the
indicators.
4.2 Validation of the household survey enhanced approach using sensitivityanalysis
Incorporating the household survey into the model, it is important to reassess the perfor-
mance and behavior of the complex system. In order to achieve transparency, robustness
and traceability (Welle and Birkmann 2015) the model response needs to be understood.
The compound index achieves a lower reliability compared to the census data-based
approach but still showing good values with Cronbach’s alpha of 0,7 and Guttmans
Lambda of 0,83. Looking at the sensitivity two aspects are interesting. Coping capacity
increases its impact due to the merged and added data influence on the overall indicators.
Obvious change is represented by the boxplots in the middle and right component of
Fig. 12 having a much larger range, hence having a more diffused impact compared to the
much clearer impact of the PeVI based on census data only.
5 Conclusions
In this paper we examined the multifaceted phenomena of socioeconomic vulnerability by
deducting measurable proxy indicators from census data and a household survey of 500
flood-affected households. Prior studies have noted the importance of flexible
Fig. 12 Result of the sensitivity analysis for Susceptibility, Coping and Adaptation for the householdenhanced assessment
Nat Hazards (2018) 92:257–282 277
123

methodologies in order to deal with the ever evolving complexity of vulnerability and risk
in nowadays societies, especially when dealing with vulnerability to climate change and
flood-related disasters. Therefore, the aim of this research is to identify key elements that
contribute to the formation of vulnerability and risk in coastal cities and propose a flexible
framework to compute vulnerability by open standard data sets such as census data and
geo-spatial data. The proposed methodology was applied in a real case study to prove its
feasibility and statistical methods were used for its validation.
Based on the census-based results it is evident that the most flood prone areas with the
highest exposure and also have the highest vulnerability values. An example for this is the
areas along the Polcevera river course, which is a former industrial district and now
predominantly populated by working class and immigrants. Further the population density
is high. In the respective areas Susceptibility and Adaptation show values, which demand
for action. In contrast low vulnerability scores were calculated for prosperous areas in the
eastern part of the city. Here a former fishing village is located which serves as a touristic
hot spot nowadays.
Due to data limitations, uncertainties and other aspects it is not possible to capture the
totality of vulnerability, as a multifaceted coupled system (Turner et al. 2003). With the
calculation of an index only certain aspects of vulnerability can be taken into considera-
tion, depending on the selected factors. Although attempts were made to assess a wide
range of features, the result of the spatial vulnerability assessment is only one possible
depiction of a complex societal system. The limits of its validity might also be explained
by the fact that economical and technical factors can be measured easily, while the
inclusion of societal factors like, e.g., neighborhood support, is much more multifaceted.
The possibility to assess coping and adaptive capacities with census data is limited in
the Genoa case study. For both indicators only two of the initially proposed categories were
taken into consideration. Solely reducing social vulnerability on cold facts like age, gender
and education neglects the complexity of human nature. Driven by opinions, influenced by
friends and family and living in our own realities, Adaptation and Coping rely heavily on
the perceived threat shaping the willingness to follow instructions or implement safety
measures.
The framework developed in this research was enhanced by field data from a survey.
The household survey enhanced methodology compromises the perception of flood-
affected inhabitants on the present state and future development of the case study. It is
advisable to include these aspects in the computation of indices to reflect more adequately
the real-world patterns of a particular case study. Also, by incorporating local knowledge
in the process, communication and implementation of measures aiming to improve the
vulnerability situation might be facilitated with reference to the findings of the study. In
other words including survey data can be seen as a “self-assessment” of the people, which
enriches the vulnerability maps with the perception of the respondents. Both information
layers are crucial for people-centered risk management since they address different
dimensions and aspects of vulnerability. The findings indicate a general concern on
appropriateness of immediate action strategies.
The PeVI does not claim completeness, and the aim is to provide information and
alternative approaches for trade-offs in decision making processes. The approach goes
beyond a solely technical view on risk and bridges between different disciplines and
perspectives. Therefore, it is important to communicate vulnerability assessments with
stakeholders in terms of management, planning and the development of procedures and
adaptation strategies (see e.g. Balica et al. 2012; Rosenzweig et al. 2015). With reference
to the application in the Genoa pilot, results of the vulnerability assessment have been
278 Nat Hazards (2018) 92:257–282
123

presented and shared with local administrations. The aim of the discussion was to compare
and validate the findings with the perception of local stakeholders and other studies. By
scientific exchange the uptake of methodology and use of socioeconomic components
when dealing with risk reduction and urban resilience were encouraged. The external
validation by local authorities supported the findings of the study and the spatial distri-
bution of vulnerability within the city boarders of Genoa. Moreover, an internal validation
was done by statistical testing which justify the robustness, reliability and sensitivity of the
index.
All components of vulnerability and therefore the vulnerability itself are not static but
highly dynamic. Consequently, the display of vulnerability in a static map can only provide
a snapshot. The assessment as it is now can serve as a baseline scenario to monitor and
evaluate future assessments of vulnerability detecting changes triggered by internal and
external factors. Future research should focus on the development of an effective and
transparent monitoring system to detect spatiotemporal patterns in vulnerability. This
enables the identification of negative trends and avoidance of long-term deterioration of
vulnerability in endangered city districts by implementing tailor-made adaptation measures
leading to a climate resilient pathway.
Acknowledgements The research leading to these results has received funding from the European UnionSeventh Framework Programme (FP7/2007-2013) under Grant Agreement No. 603663 for the researchproject PEARL (Preparing for Extreme And Rare events in coastal regions). The paper reflects only theauthors’ views, and the European Union is not liable for any use that may be made of the informationcontained herein. The authors would like to acknowledge the valuable comments by three reviewers.
Open Access This article is distributed under the terms of the Creative Commons Attribution 4.0 Inter-national License (http://creativecommons.org/licenses/by/4.0/), which permits unrestricted use, distribution,and reproduction in any medium, provided you give appropriate credit to the original author(s) and thesource, provide a link to the Creative Commons license, and indicate if changes were made.
References
Abbott MB, Vojinovic Z (2009) Applications of numerical modelling in hydroinformatics. J Hydroinform11(3–4):308–319. https://doi.org/10.2166/hydro.2009.051
Acquaotta F, Faccini F, Fratianni S, Paliaga G, Sacchini A (2017) Rainfall intensity in the GenoaMetropolitan Area (Northern Mediterranean): secular variations and consequences. Weather. https://doi.org/10.1002/wea.3208
Adger WN (2006) Vulnerability. Glob Environ Change 16(3):268–281. https://doi.org/10.1016/j.gloenvcha.2006.02.006
Babcicky P, Seebauer S (2016) The two faces of social capital in private flood mitigation: opposing effectson risk perception, self-efficacy and coping capacity. J Risk Res 20(8):1017–1037. https://doi.org/10.1080/13669877.2016.1147489
Balica SF, Wright NG, van der Meulen F (2012) A flood vulnerability index for coastal cities and its use inassessing climate change impacts. Nat Hazards 64(1):73–105. https://doi.org/10.1007/s11069-012-0234-1
Birkmann J (2007) Risk and vulnerability indicators at different scales: applicability, usefulness and policyimplications. Environ Hazards 7(1):20–31. https://doi.org/10.1016/j.envhaz.2007.04.002
Birkmann J (2011) First- and second-order adaptation to natural hazards and extreme events in the contextof climate change. Nat Hazards 58(2):811–840. https://doi.org/10.1007/s11069-011-9806-8
Birkmann J (ed) (2013a) Measuring vulnerability to natural hazards: towards disaster resilient societies, vol2. United Nations University Press, New York
Birkmann J (2013b) Data, indicators and criteria for measuring vulnerability: theoretical bases andrequirements. In: Birkmann J (ed) Measuring vulnerability to natural hazards. Towards disaster resi-lient societies, vol 2. United Nations University Press, Tokyo, pp 80–106
Nat Hazards (2018) 92:257–282 279
123
Birkmann J, Welle T (2015) Assessing the risk of loss and damage: exposure, vulnerability and risk toclimate-related hazards for different country classifications. Int J Glob Warm. http://www.uni-stuttgart.de/ireus/publikationen/Birkmann_Welle_2015.pdf. Accessed May 2017
Birkmann J, Welle T (2016) The World Risk Index 2016: reveals the necessity for regional cooperation invulnerability reduction. J Extreme Events. https://doi.org/10.1142/S2345737616500056
Birkmann J, Teichmann KV, Welle T, Gonzalez M, Olabarrieta M (2010) The unperceived risk to Europe’scoasts: tsunamis and the vulnerability of Cadiz, Spain. Nat Hazards Earth Syst Sci 10(12):2659–2675
Birkmann J, Cardona OD, Carreno ML, Barbat AH, Pelling M, Schneiderbauer S, Kienberger S, Keiler M,Alexander D, Zeil P, Welle T (2013) Framing vulnerability, risk and societal responses: the MOVEframework. Nat Hazards 67(2):193–211. https://doi.org/10.1007/s11069-013-0558-5
Brooks N, Adger WN, Kelly PM (2005) The determinants of vulnerability and adaptive capacity at thenational level and the implications for adaptation. Glob Environ Change 15(2):151–163. https://doi.org/10.1016/j.gloenvcha.2004.12.006
Bubeck P, Botzen WJW, Kreibich H, Aerts JCJH (2013) Detailed insights into the influence of flood-copingappraisals on mitigation behaviour. Glob Environ Change 23(5):1327–1338. https://doi.org/10.1016/j.gloenvcha.2013.05.009
Buhner M (2006) Einfuhrung in die Test- und Fragebogenkonstruktion. 2. aktualisierte und erw. Aufl.Munchen, Boston u.a.: Pearson Studium (Psychologie)
Bundnis Entwicklung Hilft (2015) Annex to the WorldRiskIndex (2015) Indicator update for the World RiskIndex 2015. Alliance Development Works, Berlin
Cardona OD (2005) Indicators of disaster risk and risk management: main technical report. IDB/IDEAProgram of Indicators for Disaster Risk Management. National University of Colombia, Manizales.http://idea.unalmzl.edu.coS
Depietri Y, Welle T, Renaud FG (2013) Social vulnerability assessment of the Cologne urban area (Ger-many) to heat waves: links to ecosystem services. Int J Disaster Risk Reduct 6:98–117. https://doi.org/10.1016/j.ijdrr.2013.10.001
Cutter SL, Burton CG, Emrich CT (2010) Disaster resilience indicators for benchmarking baseline condi-tions. J Homel Secur Emerg Manag. https://doi.org/10.2202/1547-7355.1732
Faccini F, Luino F, Paliaga G, Sacchini A, Turconi L (2015a) Yet another disaster flood of the Bisagnostream in Genoa (Liguria, Italy): October the 9th–10th 2014 event. Rend Online Soc Geol It 35:128–131. https://doi.org/10.3301/ROL.2015.81
Faccini F, Luino F, Sacchini A, Turconi L, De Graff J (2015b) Geo-hydrological hazard and urbandevelopment in the Mediterranean area: an example from Genoa city (Italy). Nat Hazard Earth Syst Sci15:2451–2492. https://doi.org/10.5194/nhess-15-2631-2015
Faccini F, Luino F, Sacchini A, Turconi L (2015c) Flash flood events and urban development in Genoa(Italy): Lost in translation. In: Lollino G et al (eds) Engineering geology for society and territory, vol 5.Springer, Switzerland, pp 797–801. https://doi.org/10.1007/978-3-319-09048-1_155
Faccini F, Paliaga G, Piana P, Sacchini A, Watkins C (2016) The Bisagno stream catchment (Genoa, Italy)and its major floods (1822, 1970 and 2014): geomorphic and land use variations in the last threecenturies. Geomorphology 273:14–27. https://doi.org/10.1016/j.geomorph.2016.07.037
Fuchs S (2009) Susceptibility versus resilience to mountain hazards in Austria: paradigms of vulnerabilityrevisited. Nat Hazards Earth Syst Sci 9(2):337–352. https://doi.org/10.5194/nhess-9-337-2009
Fuchs S, Rothlisberger V, Thaler T, Zischg A, Keiler M (2017) Natural hazard management from a co-evolutionary perspective: exposure and policy response in the European Alps. Ann Am As Geogr 107(2):382–392. https://doi.org/10.1080/24694452.2016.1235494
Garschagen M, Romero-Lankao P (2013) Exploring the relationships between urbanization trends andclimate change vulnerability. Clim Change 133:37–52. https://doi.org/10.1007/s10584-013-0812-6
Gourgoura P, Blatgen T, Lykou A, Birkmann J, Makropoulos C (2015) Learning and action alliances: a toolfor flood risk governance in coastal area. The case of Rethymno, Crete. In: Conference paper for the14th international conference on environmental science and technology (CEST 2015)
IPCC [Intergovernmental Panel on Climate Change] (2012) Glossary of terms. In: Field CB, Barros V,Stocker TF, Qin D, Dokken DJ, Ebi KL, Mastrandrea MD, Mach KJ, Plattner G-K, Allen SK, TignorM, Midgley PM (eds) Managing the risks of extreme events and disasters to advance climate changeadaptation. A special report of working groups I and II of the Intergovernmental Panel on ClimateChange (IPCC). Cambridge University Press, Cambridge, pp 555–564
IPCC [Intergovernmental Panel on Climate Change] (2014) Climate change 2014: impacts, adaptation, andvulnerability. Summary for policy makers. IPCC, Geneva
ISTAT [Italian National Institute of Statistics] (2016) Descrizione dei dati geografici e delle variabilicensuarie per sezione di censimento Anni 1991, 2001, 2011. Versione definitive 25/02/2016
280 Nat Hazards (2018) 92:257–282
123
Janssen J, Laatz W (2013) Statistische Datenanalyse mit SPSS. Eine anwendungsorientierte Einfuhrung indas Basissystem und das Modul Exakte Tests. 8. Aufl. Springer, Berlin. https://doi.org/10.1007/978-3-642-32507-6
Jelınek R, Krausmann E, Gonzalez M, Alvarez-Gomez JA, Birkmann J, Welle T (2012) Approaches fortsunami risk assessment and application to the city of Cadiz, Spain. Nat Hazards 60(2):273–293.https://doi.org/10.1007/s11069-011-0009-0
Karagiorgos K, Thaler T, Heiser M, Hubl J, Fuchs S (2016) Integrated flash flood vulnerability assessment:insights from East Attica, Greece. J Hydrol 541(Part A):553–562. https://doi.org/10.1016/j.jhydrol.2016.02.052
Kreibich H, Di Baldassarre G, Vorogushyn S, Aerts JCJH, Apel H, Aronica GT, Aenbjerg-Nielsen K,Bouwer LM., Bubeck P, Caloiero T, Chinh DT, Cortes M, Gain AK, Giampa V, Kuhlicke C,Kundzewicz ZW, Llasat MC, Mard J, Matczak P, Mazzoleni M, Molinari D, Dung NV, Petrucci O,Schroter K, Slager K, Thieken AH, Ward PJ, Merz B (2017) Adaptation to flood risk-results ofinternational paired flood event studies. Earth’s Future, online first 26 July 2017
Kuhlicke C, Scolobig A, Tapsell S, Steinfuhrer A, de Marchi B (2011) Contextualizing social vulnerability.Findings from case studies across Europe. Nat Hazards 58(2):789–810. https://doi.org/10.1007/s11069-011-9751-6
Maskrey A (1993) Vulnerability accumulation in peripheral regions in Latin America: the challenge fordisaster prevention and management. In: Merriman PA, Browitt CW (eds) Natural disasters: protectingvulnerable communities. IDNDR, London
Mynett A, Vojinovic Z (2009) Hydroinformatics in multi-colours-part red: urban flood and disaster man-agement. J Hydroinform 11(3–4):166–180. https://doi.org/10.2166/hydro.2009.027
O’Brien K, Leichenko R, Kelkar U, Venema H, Aandahl G, Tompkins H et al (2004) Mapping vulnerabilityto multiple stressors: climate change and globalization in India. Glob Environ Change 14(4):303–313.https://doi.org/10.1016/j.gloenvcha.2004.01.001
Oakley J, O’Hagan A (2004) Probabilistic sensitivity analysis of complex models: a bayesian approach. J RStat Soc Ser B 66(3):751–769. https://doi.org/10.1111/j.1467-9868.2004.05304.x
OECD [Organisation for Economic Co-operation and Development] (2008) Handbook on constructingcomposite indicators. Methodology and user guide. OECD, Paris
Parker DJ, Priest SJ (2012) The fallibility of flood warning chains: can Europe’s flood warnings beeffective? Water Resour Manag 26(10):2927–2950. https://doi.org/10.1007/s11269-012-0057-6
Price RK, Vojinovic Z (2008) Urban flood disaster management. Urban Water 5(3):259–276. https://doi.org/10.1080/15730620802099721
Rød JK, Berthling I, Lein H, Lujala P, Vatne G, Bye LM (2012) Integrated vulnerability mapping for wardsin Mid-Norway. Local Environ 17(6–7):695–716
Rosenzweig C, Solecki W, Romero-Lankao P, Mehrotra S, Dhakal S, Bowman T, Ibrahim AS (2015)ARC3.2 summary for city leaders. Urban Climate Change Research Network. Columbia University,New York
Sacchini A, Ferraris F, Faccini F, Firpo M (2012) Environmental climatic maps of Liguria. J Maps 8(3):199–207. https://doi.org/10.1080/17445647.2012.703901
Saisana M, Saltelli A, Tarantola S (2005) Uncertainty and sensitivity analysis techniques as tools for thequality assessment of composite indicators. J R Stat Soc A 168(2):307–323. https://doi.org/10.1111/j.1467-985X.2005.00350.x
Saltelli A (2002) Sensitivity analysis for importance assessment. Risk Anal 22(3):579–590. https://doi.org/10.1111/0272-4332.00040
Turner BL, Kasperson RE, Matson PA, McCarthy JJ, Corell RW, Christensen L, Eckley N, Kasperson JX,Luers A, Martello ML, Polsky C, Pulsipher A, Schiller A (2003) A framework for vulnerabilityanalysis in sustainability science. Proc Natl Acad Sci 100(14):8074–8079. https://doi.org/10.1073/pnas.1231335100
UNISDR [United Nations International Strategy For Disaster Risk Reduction] (2004) Living with risk: Aglobal review of disaster reduction initiatives, vol 1. United Nations Publications, New York
UNISDR [United Nations International Strategy for Disaster Risk Reduction] (2015) Proposed updatedterminology on disaster risk reduction: a technical review, The United Nations office for disaster riskreduction. www.preventionweb.net/files/45462_backgoundpaperonterminologyaugust20.pdf. AccessedNovember 2016
United Nations (2007) Indicators of sustainable development. Guidelines and methodologies, vol 3. UnitedNations Publications, New York
Vojinovic Z (ed) (2015) Flood risk: the holistic perspective. From integrated to interactive planning for floodresilience. IWA Publishing, London
Nat Hazards (2018) 92:257–282 281
123

Vojinovic Z, Abbott MB (eds) (2012) Flood risk and social justice: from quantitative to qualitative flood riskassessment and mitigation. IWA Publishing, London
Vojinovic Z, Teeffelen JV (2007) An integrated stormwater management approach for small Islands intropical climates. Urban Water J 4(3):211–231. https://doi.org/10.1080/15730620701464190
Vojinovic Z, Hammond M, Golub D, Hirunsalee S, Weesakul S, Meesuk V et al (2015) Holistic approach toflood risk assessment in areas with cultural heritage. A practical application in Ayutthaya, Thailand.Nat Hazards 81(1):589–616. https://doi.org/10.1007/s11069-015-2098-7
Vojinovic Z, Abebe Y, Sanchez-Torres A, Medina N, Nikolic I, Manojlovic N, Makropoulos C, Pelling M(2014) Holistic flood risk assessment in coastal areas-the PEARL approach. CUNY Academic Works,New York City
Welle T, Birkmann J (2015) The World Risk Index: an approach to assess risk and vulnerability on a globalscale. J Extreme Events 2(1):1550003. https://doi.org/10.1142/S2345737615500037
Welle T, Depietri Y, Angignard M, Birkmann J, Renaud FG, Greiving S (2014) Vulnerability assessment toheat waves, floods, and earthquakes using the MOVE framework: test case Cologne, Germany. In:Birkmann J, Kienberger S, Alexander D (eds) Assessment of vulnerability to natural hazards. Elsevier,Philadelphia, pp 91–124. https://doi.org/10.1016/B978-0-12-410528-7.00005-9
Wilhelmi OV, Hayden MH (2010) Connecting people and place. A new framework for reducing urbanvulnerability to extreme heat. Environ Res Lett 5(1):14021. https://doi.org/10.1088/1748-9326/5/1/014021
Wilhelmi OV, Morss RE (2013) Integrated analysis of societal vulnerability in an extreme precipitationevent. A Fort Collins case study. Environ Sci Policy 26:49–62. https://doi.org/10.1016/j.envsci.2012.07.005
Wisner B, Blaikie P, Cannon T, Davies I (2004) At risk: natural hazards, people´s vulnerability anddisasters. Routledge, New York
Wolf T, McGregor G (2013) The development of a heat wave vulnerability index for London, UK. WeatherClim Extremes 1:59–68. https://doi.org/10.1016/j.wace.2013.07.004
Zygmond C, Smith MR (2014) Robust factor analysis in the presence of normality violations, missing data,and outliers: empirical question and possible solutions. Tutor Quant Methods Psychol 10(1):40–55.https://doi.org/10.20982/tqmp.10.1.p040
282 Nat Hazards (2018) 92:257–282
123