carbon dioxide emissions from the generation of...
TRANSCRIPT

Carbon Dioxide Emissionsfrom the Generation of Electric Power
in the United States
July 2000
Department of EnergyWashington, DC 20585
Environmental Protection AgencyWashington DC 20460
Department of Energy and Environmental Protection Agency/ Carbon Dioxide Emissions from theGeneration of Electric Power in the United Statesii
Contacts
This report was prepared jointly by the staff of the U.S.Department of Energy and the U.S. EnvironmentalProtection Agency. Questions about this publication, aswell as other energy inquiries may be directed to theNational Energy Information Center on (202) 586-8800.
Questions regarding specific information in the reportmay be directed as follows:
Electric Power Data and Carbon Dioxide EmissionEstimates:
Wiley Barbour (202-260-6972)e-mail: [email protected]
Channele Carner (202-426-1270)e-mail: [email protected]
Melvin Johnson (202-426-1172)e-mail: [email protected]
Rick Morgan (202-564-9143)e-mail: [email protected]
Roger Sacquety (202-426-1160)e-mail: [email protected]
Stephen Scott (202-426-1149)e-mail: [email protected]
Betty Williams (202-426-1269)e-mail: [email protected]
Projected Electricity Generation and Carbon DioxideEmissions:
Scott Sitzer (202-586-2308)e-mail: [email protected]
Voluntary Carbon-Reduction and Carbon-SequestrationPrograms:
Paul McArdle (202-586-4445)e-mail: [email protected]
Stephen Calopedis (202-586-1156)e-mail: [email protected]
Kate Narburgh (202-564-1846)e-mail: [email protected]
Environmental Effects of Federal Restructuring Legis-lation:
Tracy Terry (202-586-3383)e-mail: [email protected]

Department of Energy and Environmental Protection Agency/ Carbon Dioxide Emissions from theGeneration of Electric Power in the United States iii
ContentsPage
Introduction . . . . . . . . . . . . . . . . . . . . . . . . . . . . . . . . . . . . . . . . . . . . . . . . . . . . . . . . . . . . . . . . . . . . . . . . . . . . . . . . . . . . 1
Electric Power Industry CO2 Emissions and Generation Share by Fuel Type . . . . . . . . . . . . . . . . . . . . . . . . . . . . . . . . 1Coal . . . . . . . . . . . . . . . . . . . . . . . . . . . . . . . . . . . . . . . . . . . . . . . . . . . . . . . . . . . . . . . . . . . . . . . . . . . . . . . . . . . . . . . 3Petroleum . . . . . . . . . . . . . . . . . . . . . . . . . . . . . . . . . . . . . . . . . . . . . . . . . . . . . . . . . . . . . . . . . . . . . . . . . . . . . . . . . . 5Natural Gas . . . . . . . . . . . . . . . . . . . . . . . . . . . . . . . . . . . . . . . . . . . . . . . . . . . . . . . . . . . . . . . . . . . . . . . . . . . . . . . . 5Nonfossil Fuels . . . . . . . . . . . . . . . . . . . . . . . . . . . . . . . . . . . . . . . . . . . . . . . . . . . . . . . . . . . . . . . . . . . . . . . . . . . . . 6
Factors Contributing to Changes in CO2 Emissions and Generation . . . . . . . . . . . . . . . . . . . . . . . . . . . . . . . . . . . . . . . 6Economic Growth . . . . . . . . . . . . . . . . . . . . . . . . . . . . . . . . . . . . . . . . . . . . . . . . . . . . . . . . . . . . . . . . . . . . . . . . . . . 7Weather . . . . . . . . . . . . . . . . . . . . . . . . . . . . . . . . . . . . . . . . . . . . . . . . . . . . . . . . . . . . . . . . . . . . . . . . . . . . . . . . . . . 7Demand-Side Management . . . . . . . . . . . . . . . . . . . . . . . . . . . . . . . . . . . . . . . . . . . . . . . . . . . . . . . . . . . . . . . . . . . 7Fossil and Nonfossil Fuels for Electricity Generation . . . . . . . . . . . . . . . . . . . . . . . . . . . . . . . . . . . . . . . . . . . . . . 7Fuel Quality and Price . . . . . . . . . . . . . . . . . . . . . . . . . . . . . . . . . . . . . . . . . . . . . . . . . . . . . . . . . . . . . . . . . . . . . . . . 8Thermal Efficiencies of Power Plants . . . . . . . . . . . . . . . . . . . . . . . . . . . . . . . . . . . . . . . . . . . . . . . . . . . . . . . . . . . . 8Conclusion . . . . . . . . . . . . . . . . . . . . . . . . . . . . . . . . . . . . . . . . . . . . . . . . . . . . . . . . . . . . . . . . . . . . . . . . . . . . . . . . . 9
Comparison of Projected with Actual CO2 Emissions and Generation by Fuel Type . . . . . . . . . . . . . . . . . . . . . . . . . 9
Voluntary Carbon-Reduction and Carbon-Sequestration Programs . . . . . . . . . . . . . . . . . . . . . . . . . . . . . . . . . . . . . . 10
Environmental Effects of Federal Restructuring Legislation . . . . . . . . . . . . . . . . . . . . . . . . . . . . . . . . . . . . . . . . . . . . 12
Appendices
A. Presidential Directive . . . . . . . . . . . . . . . . . . . . . . . . . . . . . . . . . . . . . . . . . . . . . . . . . . . . . . . . . . . . . . . . . . . . . . . 15 B. Data Sources and Methodology . . . . . . . . . . . . . . . . . . . . . . . . . . . . . . . . . . . . . . . . . . . . . . . . . . . . . . . . . . . . . . . 17

Department of Energy and Environmental Protection Agency/ Carbon Dioxide Emissions from theGeneration of Electric Power in the United Statesiv
Tables Page
1. Summary of Carbon Dioxide Emissions and Net Generation in the United States, 1998 and 1999 . . . . . . . . . 22. Estimated Carbon Dioxide Emissions From Generating Units at U.S. Electric Plants by Census
Division, 1998 and 1999 . . . . . . . . . . . . . . . . . . . . . . . . . . . . . . . . . . . . . . . . . . . . . . . . . . . . . . . . . . . . . . . . . . . . . . 33. Percent of Electricity Generated at U.S. Electric Plants by Fuel Type and Census Division, 1998 and 1999 . . 44. Estimated Carbon Dioxide Emissions Rate From Generating Units at U.S. Electric Plants by
Census Division, 1998 and 1999 . . . . . . . . . . . . . . . . . . . . . . . . . . . . . . . . . . . . . . . . . . . . . . . . . . . . . . . . . . . . . . . 45. U.S. Electric Power Industry Projected and Actual Carbon Dioxide Emissions and Generation, 1999 . . . . . 106. Electric Power Sector Carbon Dioxide Emission Reductions, 1997 and 1998 . . . . . . . . . . . . . . . . . . . . . . . . . . 117. CO2 Emission Reductions and Energy Savings from EPA’s Voluntary Programs,
1998 and 1999 . . . . . . . . . . . . . . . . . . . . . . . . . . . . . . . . . . . . . . . . . . . . . . . . . . . . . . . . . . . . . . . . . . . . . . . . . . . . . 13
Figures
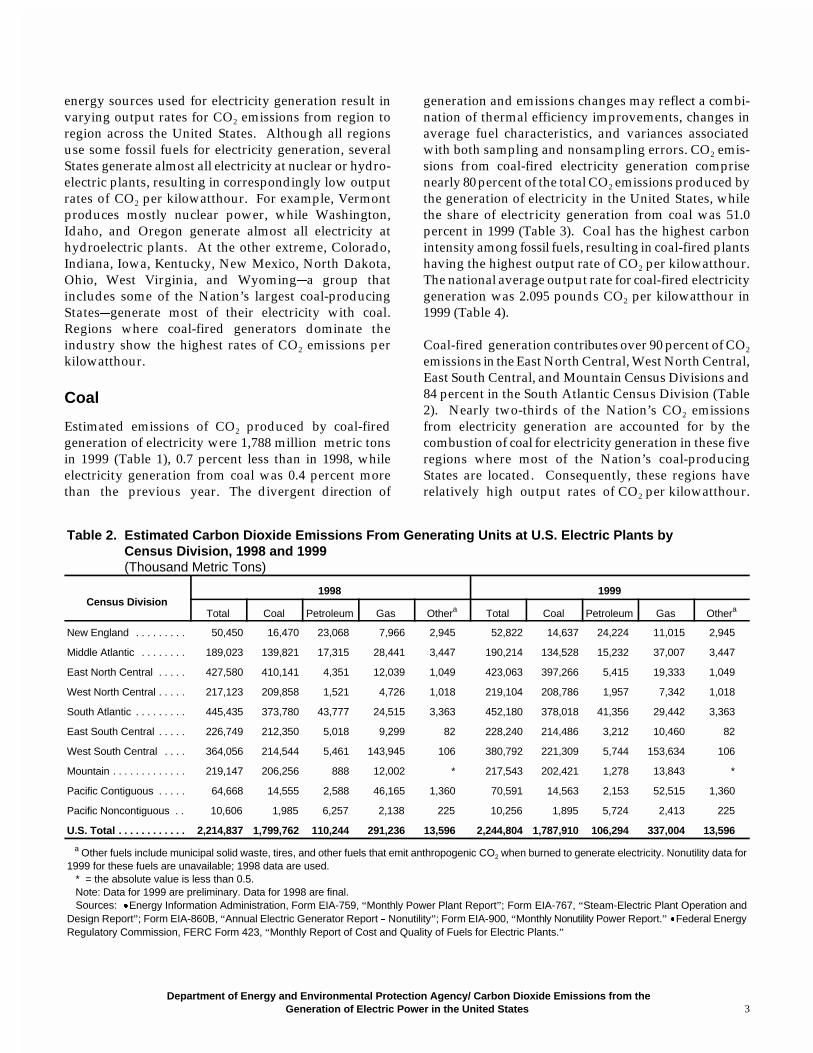
1. Census Regions and Divisions . . . . . . . . . . . . . . . . . . . . . . . . . . . . . . . . . . . . . . . . . . . . . . . . . . . . . . . . . . . . . . . . 5
Department of Energy and Environmental Protection Agency/ Carbon Dioxide Emissions from theGeneration of Electric Power in the United States 1
1 The Presidential directive required the first report by October 15, 1999, and thereafter the report is required by June 30. See AppendixA for the full text of the directive.
2 Data for 1999 are preliminary. Data for 1998 are final. Last year, 1998 data were preliminary and have been revised to final numbers.3 To convert metric tons to short tons, multiply by 1.1023. Carbon dioxide units at full molecular weight can be converted into carbon
units by dividing by 44/12.4 The average output rate is the ratio of pounds of carbon dioxide emitted per kilowatthour of electricity produced from all energy
sources, both fossil and nonfossil, for a region or the Nation.
Carbon Dioxide Emissions from theGeneration of Electric Power in the United States
Introduction
The President issued a directive on April 15, 1999,requiring an annual report summarizing the carbondioxide (CO2) emissions produced by the generation ofelectricity by utilities and nonutilities in the UnitedStates. In response, the U.S. Department of Energy(DOE) and the U.S. Environmental Protection Agency(EPA) jointly submitted the first report on October 15,1999. This is the second annual report1 that estimatesthe CO2 emissions attributable to the generation ofelectricity in the United States. The data on CO2
emissions and the generation of electricity were collectedand prepared by the Energy Information Administration(EIA), and the report was jointly written by DOE andEPA to address the five areas outlined in the PresidentialDirective.
� The emissions of CO2 are presented on the basis oftotal mass (tons) and output rate (pounds perkilowatthour). The information is stratified by thetype of fuel used for electricity generation andpresented for both regional and national levels. Thepercentage of electricity generation produced byeach fuel type or energy resource is indicated.
� The 1999 data on CO2 emissions and generation byfuel type are compared to the same data for theprevious year, 1998. Factors contributing to regionaland national level changes in the amount andaverage output rate of CO2 are identified anddiscussed.
� The Energy Information Administration’s mostrecent projections of CO2 emissions and generationby fuel type for 1999 are compared to the actual datasummarized in this report to identify deviations
between projected and actual CO2 emissions andelectricity generation.
� Information for 1998 on voluntary carbon-reducingand carbon-sequestration projects reported by theelectric power sector and the resulting amount ofCO2 reductions are presented. Included are pro-grams undertaken by the utilities themselves as wellas programs supported by the Federal governmentto support voluntary CO2 reductions.
� Appropriate updates to the Department of Energy’sestimated environmental effects of the Admin-istration’s proposed restructuring legislation areincluded.
Electric Power Industry CO2
Emissions and Generation Share byFuel Type
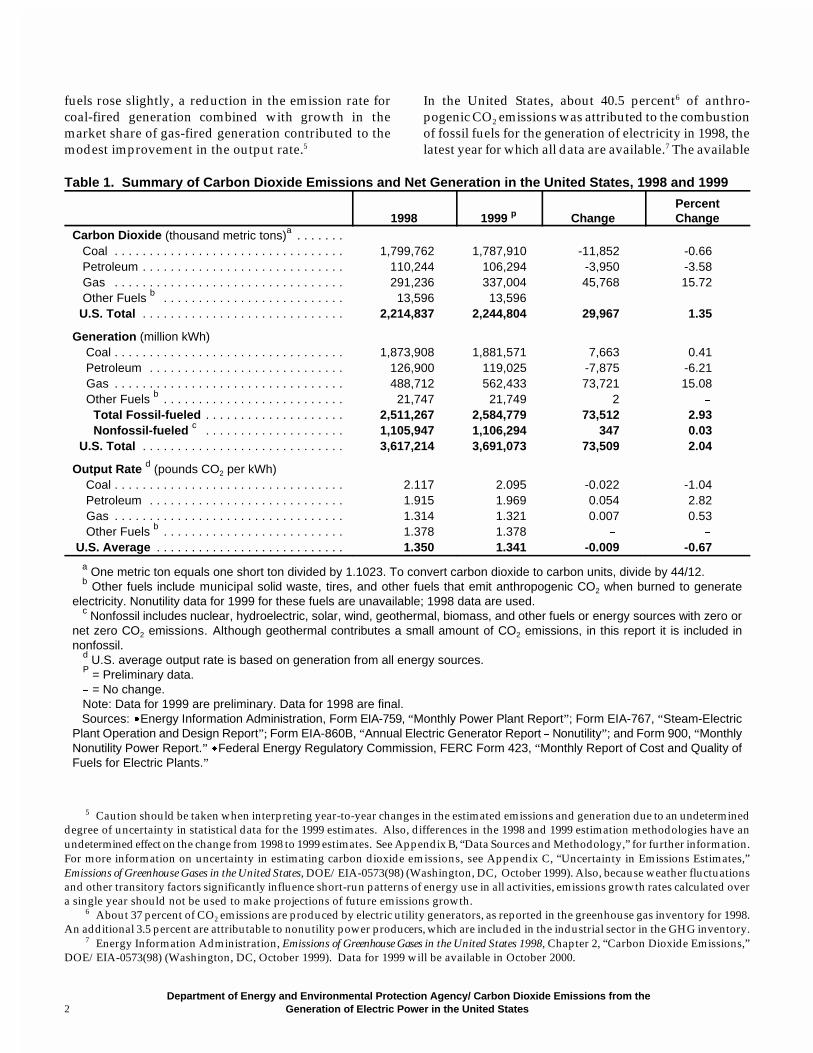
In 1999,2 estimated emissions of CO2 in the United Statesresulting from the generation of electric power were2,245 million metric tons,3 an increase of 1.4 percentfrom the 2,215 million metric tons in 1998. The estimatedgeneration of electricity from all sources increased by 2.0percent, going from 3,617 billion kilowatthours to 3,691billion kilowatthours. Electricity generation from coal-fired plants, the primary source of CO2 emissions fromelectricity generation, was nearly the same in 1999 as in1998. Much of the increase in electricity generation wasproduced by gas-fired plants and nuclear plants. The1999 national average output rate,4 1.341 pounds of CO2
per kilowatthour generated, also showed a slight changefrom 1.350 pounds CO2 per kilowatthour in 1998 (Table1). While the share of total generation provided by fossil
Department of Energy and Environmental Protection Agency/ Carbon Dioxide Emissions from theGeneration of Electric Power in the United States2
5 Caution should be taken when interpreting year-to-year changes in the estimated emissions and generation due to an undetermineddegree of uncertainty in statistical data for the 1999 estimates. Also, differences in the 1998 and 1999 estimation methodologies have anundetermined effect on the change from 1998 to 1999 estimates. See Appendix B, “Data Sources and Methodology,” for further information.For more information on uncertainty in estimating carbon dioxide emissions, see Appendix C, “Uncertainty in Emissions Estimates,”Emissions of Greenhouse Gases in the United States, DOE/EIA-0573(98) (Washington, DC, October 1999). Also, because weather fluctuationsand other transitory factors significantly influence short-run patterns of energy use in all activities, emissions growth rates calculated overa single year should not be used to make projections of future emissions growth.
6 About 37 percent of CO2 emissions are produced by electric utility generators, as reported in the greenhouse gas inventory for 1998.An additional 3.5 percent are attributable to nonutility power producers, which are included in the industrial sector in the GHG inventory.
7 Energy Information Administration, Emissions of Greenhouse Gases in the United States 1998, Chapter 2, “Carbon Dioxide Emissions,”DOE/EIA-0573(98) (Washington, DC, October 1999). Data for 1999 will be available in October 2000.
fuels rose slightly, a reduction in the emission rate forcoal-fired generation combined with growth in themarket share of gas-fired generation contributed to themodest improvement in the output rate.5
In the United States, about 40.5 percent6 of anthro-pogenic CO2 emissions was attributed to the combustionof fossil fuels for the generation of electricity in 1998, thelatest year for which all data are available.7 The available
Table 1. Summary of Carbon Dioxide Emissions and Net Generation in the United States, 1998 and 1999
1998 1999 p ChangePercentChange
Carbon Dioxide (thousand metric tons)a . . . . . . . Coal . . . . . . . . . . . . . . . . . . . . . . . . . . . . . . . . . 1,799,762 1,787,910 -11,852 -0.66 Petroleum . . . . . . . . . . . . . . . . . . . . . . . . . . . . . 110,244 106,294 -3,950 -3.58 Gas . . . . . . . . . . . . . . . . . . . . . . . . . . . . . . . . . 291,236 337,004 45,768 15.72 Other Fuels b . . . . . . . . . . . . . . . . . . . . . . . . . . 13,596 13,596 % % U.S. Total . . . . . . . . . . . . . . . . . . . . . . . . . . . . . 2,214,837 2,244,804 29,967 1.35
Generation (million kWh) Coal . . . . . . . . . . . . . . . . . . . . . . . . . . . . . . . . . 1,873,908 1,881,571 7,663 0.41 Petroleum . . . . . . . . . . . . . . . . . . . . . . . . . . . . 126,900 119,025 -7,875 -6.21 Gas . . . . . . . . . . . . . . . . . . . . . . . . . . . . . . . . . 488,712 562,433 73,721 15.08 Other Fuels b . . . . . . . . . . . . . . . . . . . . . . . . . . 21,747 21,749 2 % Total Fossil-fueled . . . . . . . . . . . . . . . . . . . . 2,511,267 2,584,779 73,512 2.93 Nonfossil-fueled c . . . . . . . . . . . . . . . . . . . . 1,105,947 1,106,294 347 0.03 U.S. Total . . . . . . . . . . . . . . . . . . . . . . . . . . . . . 3,617,214 3,691,073 73,509 2.04
Output Rate d (pounds CO2 per kWh) Coal . . . . . . . . . . . . . . . . . . . . . . . . . . . . . . . . . 2.117 2.095 -0.022 -1.04 Petroleum . . . . . . . . . . . . . . . . . . . . . . . . . . . . 1.915 1.969 0.054 2.82 Gas . . . . . . . . . . . . . . . . . . . . . . . . . . . . . . . . . 1.314 1.321 0.007 0.53 Other Fuels b . . . . . . . . . . . . . . . . . . . . . . . . . . 1.378 1.378 % % U.S. Average . . . . . . . . . . . . . . . . . . . . . . . . . . . 1.350 1.341 -0.009 -0.67
a One metric ton equals one short ton divided by 1.1023. To convert carbon dioxide to carbon units, divide by 44/12.b Other fuels include municipal solid waste, tires, and other fuels that emit anthropogenic CO2 when burned to generate
electricity. Nonutility data for 1999 for these fuels are unavailable; 1998 data are used. c Nonfossil includes nuclear, hydroelectric, solar, wind, geothermal, biomass, and other fuels or energy sources with zero ornet zero CO2 emissions. Although geothermal contributes a small amount of CO2 emissions, in this report it is included innonfossil. d U.S. average output rate is based on generation from all energy sources. P = Preliminary data. % = No change. Note: Data for 1999 are preliminary. Data for 1998 are final. Sources: �Energy Information Administration, Form EIA-759, “Monthly Power Plant Report”; Form EIA-767, “Steam-ElectricPlant Operation and Design Report”; Form EIA-860B, “Annual Electric Generator Report % Nonutility”; and Form 900, “MonthlyNonutility Power Report.” �Federal Energy Regulatory Commission, FERC Form 423, “Monthly Report of Cost and Quality ofFuels for Electric Plants.”
Department of Energy and Environmental Protection Agency/ Carbon Dioxide Emissions from theGeneration of Electric Power in the United States 3
energy sources used for electricity generation result invarying output rates for CO2 emissions from region toregion across the United States. Although all regionsuse some fossil fuels for electricity generation, severalStates generate almost all electricity at nuclear or hydro-electric plants, resulting in correspondingly low outputrates of CO2 per kilowatthour. For example, Vermontproduces mostly nuclear power, while Washington,Idaho, and Oregon generate almost all electricity athydroelectric plants. At the other extreme, Colorado,Indiana, Iowa, Kentucky, New Mexico, North Dakota,Ohio, West Virginia, and Wyoming&a group thatincludes some of the Nation’s largest coal-producingStates&generate most of their electricity with coal.Regions where coal-fired generators dominate theindustry show the highest rates of CO2 emissions perkilowatthour.
Coal
Estimated emissions of CO2 produced by coal-firedgeneration of electricity were 1,788 million metric tonsin 1999 (Table 1), 0.7 percent less than in 1998, whileelectricity generation from coal was 0.4 percent morethan the previous year. The divergent direction of
generation and emissions changes may reflect a combi-nation of thermal efficiency improvements, changes inaverage fuel characteristics, and variances associatedwith both sampling and nonsampling errors. CO2 emis-sions from coal-fired electricity generation comprisenearly 80 percent of the total CO2 emissions produced bythe generation of electricity in the United States, whilethe share of electricity generation from coal was 51.0percent in 1999 (Table 3). Coal has the highest carbonintensity among fossil fuels, resulting in coal-fired plantshaving the highest output rate of CO2 per kilowatthour.The national average output rate for coal-fired electricitygeneration was 2.095 pounds CO2 per kilowatthour in1999 (Table 4).
Coal-fired generation contributes over 90 percent of CO2
emissions in the East North Central, West North Central,East South Central, and Mountain Census Divisions and84 percent in the South Atlantic Census Division (Table2). Nearly two-thirds of the Nation’s CO2 emissionsfrom electricity generation are accounted for by thecombustion of coal for electricity generation in these fiveregions where most of the Nation’s coal-producingStates are located. Consequently, these regions haverelatively high output rates of CO2 per kilowatthour.
Table 2. Estimated Carbon Dioxide Emissions From Generating Units at U.S. Electric Plants byCensus Division, 1998 and 1999(Thousand Metric Tons)
Census Division1998 1999
Total Coal Petroleum Gas Othera Total Coal Petroleum Gas Othera
New England . . . . . . . . . 50,450 16,470 23,068 7,966 2,945 52,822 14,637 24,224 11,015 2,945
Middle Atlantic . . . . . . . . 189,023 139,821 17,315 28,441 3,447 190,214 134,528 15,232 37,007 3,447
East North Central . . . . . 427,580 410,141 4,351 12,039 1,049 423,063 397,266 5,415 19,333 1,049
West North Central . . . . . 217,123 209,858 1,521 4,726 1,018 219,104 208,786 1,957 7,342 1,018
South Atlantic . . . . . . . . . 445,435 373,780 43,777 24,515 3,363 452,180 378,018 41,356 29,442 3,363
East South Central . . . . . 226,749 212,350 5,018 9,299 82 228,240 214,486 3,212 10,460 82
West South Central . . . . 364,056 214,544 5,461 143,945 106 380,792 221,309 5,744 153,634 106
Mountain . . . . . . . . . . . . . 219,147 206,256 888 12,002 * 217,543 202,421 1,278 13,843 *
Pacific Contiguous . . . . . 64,668 14,555 2,588 46,165 1,360 70,591 14,563 2,153 52,515 1,360
Pacific Noncontiguous . . 10,606 1,985 6,257 2,138 225 10,256 1,895 5,724 2,413 225
U.S. Total . . . . . . . . . . . . 2,214,837 1,799,762 110,244 291,236 13,596 2,244,804 1,787,910 106,294 337,004 13,596
a Other fuels include municipal solid waste, tires, and other fuels that emit anthropogenic CO2 when burned to generate electricity. Nonutility data for1999 for these fuels are unavailable; 1998 data are used. * = the absolute value is less than 0.5. Note: Data for 1999 are preliminary. Data for 1998 are final. Sources: �Energy Information Administration, Form EIA-759, “Monthly Power Plant Report”; Form EIA-767, “Steam-Electric Plant Operation andDesign Report”; Form EIA-860B, “Annual Electric Generator Report % Nonutility”; Form EIA-900, “Monthly Nonutility Power Report.” �Federal EnergyRegulatory Commission, FERC Form 423, “Monthly Report of Cost and Quality of Fuels for Electric Plants.”

Department of Energy and Environmental Protection Agency/ Carbon Dioxide Emissions from theGeneration of Electric Power in the United States4
Table 3. Percent of Electricity Generated at U.S. Electric Plants by Fuel Type and Census Division,1998 and 1999(Percent)
Census Division 1998 1999
Coal Petroleum Gas Othera Nonfossil Coal Petroleum Gas Othera Nonfossil
New England . . . . . . . . . . . . 17.9 24.4 13.8 4.6 39.3 16.3 22.9 18.0 4.6 38.3
Middle Atlantic . . . . . . . . . . . 38.4 5.2 13.6 1.3 41.5 35.8 4.5 17.5 1.3 40.9
East North Central . . . . . . . . 76.3 0.8 3.8 0.4 18.8 72.0 0.7 4.4 0.4 22.5
West North Central . . . . . . . . 75.5 0.7 2.3 0.3 21.1 73.9 0.7 3.0 0.3 22.0
South Atlantic . . . . . . . . . . . . 55.3 7.2 6.6 0.7 30.2 55.5 6.7 7.8 0.7 29.2
East South Central . . . . . . . . 66.2 2.1 3.2 * 28.4 68.0 1.4 3.9 * 26.7
West South Central . . . . . . . 39.1 0.6 42.2 0.3 17.8 40.1 0.7 44.6 0.3 14.3
Mountain . . . . . . . . . . . . . . . . 67.9 0.2 6.8 0.1 25.0 67.5 0.3 8.1 0.1 24.1
Pacific Contiguous . . . . . . . . 4.3 0.7 23.1 0.4 71.4 4.2 0.5 26.2 0.4 68.7
Pacific Noncontiguous . . . . . 12.2 52.3 21.3 1.9 12.4 11.7 52.2 24.8 1.9 9.4
U.S. Total . . . . . . . . . . . . . . . 51.8 3.5 13.5 0.6 30.6 51.0 3.2 15.2 0.6 30.0
a Other fuels include municipal solid waste, tires, and other fuels that emit anthropogenic CO2 when burned to generate electricity. Nonutility data for1999 for these fuels are unavailable; 1998 data are used. * = the absolute value is less than 0.05. Note: Data for 1999 are preliminary. Data for 1998 are final. Sources: �Energy Information Administration, Form EIA-759, “Monthly Power Plant Report”; Form EIA-767, “Steam-Electric Plant Operation andDesign Report”; Form EIA-860B, “Annual Electric Generator Report % Nonutility”; Form EIA-900, “Monthly Nonutility Power Report.” �Federal EnergyRegulatory Commission, FERC Form 423, “Monthly Report of Cost and Quality of Fuels for Electric Plants.”
Table 4. Estimated Carbon Dioxide Emissions Rate From Generating Units at U.S. Electric Plants byCensus Division, 1998 and 1999(Pounds per Kilowatthour)
Census Division1998 1999
Total Coal Petroleum Gas Othera Total Coal Petroleum Gas Othera
New England . . . . . . . . . . . . . . 1.059 1.934 1.984 1.213 1.339 1.077 1.827 2.156 1.250 1.328
Middle Atlantic . . . . . . . . . . . . . 1.071 2.062 1.884 1.188 1.502 1.058 2.089 1.872 1.178 1.502
East North Central . . . . . . . . . . 1.680 2.113 2.244 1.239 1.124 1.579 2.061 2.759 1.630 1.131
West North Central . . . . . . . . . . 1.767 2.262 1.759 1.659 2.422 1.746 2.250 2.207 1.958 2.596
South Atlantic . . . . . . . . . . . . . . 1.334 2.026 1.821 1.113 1.377 1.342 2.019 1.822 1.115 1.372
East South Central . . . . . . . . . . 1.457 2.060 1.515 1.857 3.244 1.470 2.031 1.530 1.734 3.244
West South Central . . . . . . . . . 1.469 2.214 3.955 1.376 0.151 1.529 2.215 3.170 1.382 0.151
Mountain . . . . . . . . . . . . . . . . . . 1.572 2.179 2.802 1.257 0.005 1.542 2.128 3.036 1.214 0.005
Pacific Contiguous . . . . . . . . . . 0.417 2.158 2.396 1.287 2.140 0.435 2.152 2.419 1.238 2.108
Pacific Noncontiguous . . . . . . . 1.453 2.229 1.641 1.375 1.661 1.393 2.209 1.488 1.319 1.661
U.S. Average . . . . . . . . . . . . . . 1.350 2.117 1.915 1.314 1.378 1.341 2.095 1.969 1.321 1.378
a Other fuels include municipal solid waste, tires, and other fuels that emit anthropogenic CO2 when burned to generate electricity. Nonutility data for1999 for these fuels are unavailable; 1998 data are used. Note: Data for 1999 are preliminary. Data for 1998 are final. Sources: �Energy Information Administration, Form EIA-759, “Monthly Power Plant Report”; Form EIA-767, “Steam-Electric Plant Operation andDesign Report”; Form EIA-860B, “Annual Electric Generator Report % Nonutility”; Form EIA-900, “Monthly Nonutility Power Report.” �Federal EnergyRegulatory Commission, FERC Form 423, “Monthly Report of Cost and Quality of Fuels for Electric Plants.”

Department of Energy and Environmental Protection Agency/ Carbon Dioxide Emissions from theGeneration of Electric Power in the United States 5
Pacific Noncontiguous
Division
A K
K S
N E
SD
N D
M O
IA
M N
IL
FL
G A
VA
D EM D
W V
M S
TXLA
A RO K
A L
TN
K Y
W I
INO H PA N J
M I
H I
N Y
O R
C A
WA
South Atlan tic Division
West NorthCentral Division
New England Division
M A
R I
M idd le Atlantic Division
East South Central Divis ion
C T
VTM E
N H
East North Central Divis ion
West South Central Divis ion
ID
M T
A ZN M
C OU T
N V
W Y
Mountain Division
N C
SC
D C
Pacific Contiguous Division
:HVW 0LGZHVW 1RUWKHDVW
6RXWK
Figure 1. Census Regions and Divisions
Petroleum
CO2 emissions from petroleum-fired electricity genera-tion were 106 million metric tons in 1999, 3.6 percent lessthan in 1998. Generation of electricity from petroleum-fired plants decreased from 127 billion kilowatthours in1998 to 119 billion kilowatthours in 1999. CO2 emissionsfrom petroleum-fired electricity generation accountedfor 4.7 percent of the national total, while generationfrom petroleum plants was 3.2 percent of the Nation’stotal electricity generation. The national average outputrate for all petroleum-fired generation was 1.969 poundsCO2 per kilowatthour in 1999.
The New England Census Division generates about one-fourth of its electricity at petroleum-fired plants whichproduce approximately 45 percent of that region’s CO2
emissions. The Pacific Noncontiguous Census Divisiongenerates about one-half of its electricity at petroleum-fired plants, producing about one-half of the region’sCO2 emissions. The South Atlantic and Middle AtlanticCensus Divisions also use some petroleum for electricity
generation, particularly in Florida. The South AtlanticCensus Division contributes the largest share of CO2
emissions from petroleum-fired plants, 1.8 percent of theNation’s total CO2 emissions from all sources.
Natural Gas
Emissions of CO2 from the generation of electricity atnatural gas-fired plants were 337 million metric tons in1999. Natural gas-fired plants were the only fossil-fueledplants to substantially increase generation from 1998 to1999. Generation increased an estimated 15.0 percent,with CO2 emissions increasing a corresponding 15.7 per-cent. Emissions of CO2 from natural gas-fired plantsrepresented 15.0 percent of total CO2 emissions fromelectricity generation in 1999, while natural gas-firedelectricity generation accounted for 15.2 percent of totalgeneration. The output rate for CO2 from natural gas-fired plants in 1999 was 1.321 pounds CO2 per kilo-watthour. Natural gas is the least carbon-intensive fossilfuel.
Note: Map not to scale. Source: Adapted from U.S. Department of Commerce, Bureau of the Census, Statistical Abstract of the United States, 1998(Washington, DC, October 1998), Figure 1.

Department of Energy and Environmental Protection Agency/ Carbon Dioxide Emissions from theGeneration of Electric Power in the United States6
8 Capacity factor is the ratio of the amount of electricity produced by a generating plant for a given period of time to the electricitythat the plant could have produced at continuous full-power operation during the same period. Based on national level consumption andgeneration data presented in the Electric Power Monthly, and assuming a net summer nuclear capability of 99,000 MW, a 1-percent increasein the annual nuclear plant capacity factor (equivalent to 8,672,400 megawatthours of additional nuclear generation) translates into areduction in annual consumption of either 4.4 million short tons of coal, 14 million barrels of petroleum, or 92 billion cubic feet of gas, ormost likely a combination of each.
9 Energy Information Administration, Electric Power Annual 1999, Volume I, DOE/EIA-0348(99)/1 (Washington, DC, forthcoming).10 Energy Information Administration, Cost and Quality of Fuels for Electric Utility Plants, 1999, http://www.eia.doe.gov/
cneaf/electricity/cq/cq_sum.html.
The West South Central Census Division, which includesTexas, Oklahoma, and Louisiana, is where much of theNation’s natural gas-fired capacity is located. TheNortheast and Pacific Contiguous Census Divisions alsouse natural gas to generate a substantial portion of theirelectricity. About 40.4 percent of the West South CentralDivision’s CO2 emissions from the generation ofelectricity comes from gas-fired plants, representingapproximately 45.6 percent of all CO2 emissions fromnatural gas combustion for electricity generation in theNation. About three-fourths of the Pacific ContiguousCensus Division’s CO2 emissions are from natural gas-fired plants; however, most of that division’s electricitygeneration is produced at nonfossil-fueled plants, suchas hydroelectric and nuclear plants.
Nonfossil Fuels
Nonfossil-fueled generation from nuclear, hydroelectric,and other renewable sources (wind, solar, biomass, andgeothermal) represented about 30.0 percent of totalelectricity generation in 1999 and 30.6 percent in 1998.The use of nonfossil fuels and renewable energy sourcesto generate electricity avoids the emission of CO2 thatresults from the combustion of fossil fuels. Due to lowermarginal costs, nuclear and hydroelectric power genera-tion typically displace fossil-fueled electricity generation.
Nuclear plants increased their output by 8.1 percent in1999 as several plants in the East North Census Divisionreturned to service, contributing to a record capacityfactor of 86 percent for nuclear plants in 1999.8 Nuclearenergy provided 19.7 percent of the Nation’s electricityin 1999.9 Two-thirds of the Nation’s nuclear power isgenerated in the New England, East North Central,South Atlantic, and Middle Atlantic Census Divisions,which generate 27.6 percent, 21.0 percent, 26.0 percent,and 35.6 percent, respectively, of their electricity withnuclear power.
More than one-half of the Nation’s hydroelectric capa-city is located in the Pacific Contiguous Census Division,which includes California, Oregon, and Washington. Inthe Mountain Census Division, Idaho generates virtually
all of its electricity at hydroelectric plants. The avail-ability of hydroelectric power is affected by both theamount and patterns of precipitation. High snowpacklevels in the Northwest increased hydroelectric genera-tion in Washington and Oregon during 1999, despite thefact that on an annual basis both States received lessprecipitation in 1999 than they did in 1998. However,the remainder of the Nation experienced dry conditionsin 1999, decreasing the amount of hydroelectric poweravailable to displace fossil-fueled generation.10
Factors Contributing to Changes InCO2 Emissions and Generation
The primary factors that alter CO2 emissions from elec-tricity generation from year to year are the growth indemand for electricity, the type of fuels or energysources used for generation, and the thermal efficienciesof the power plants. A number of contributing factorsinfluencing the primary factors can also be identified:economic growth, the price of electricity, the amount ofimported electricity, weather, fuel prices, and theamount of available generation from hydroelectric, re-newable, and nuclear plants. Other contributing factorsinclude demand-side management programs that en-courage energy efficiency, strategies to control other airemissions to comply with the requirements for the CleanAir Act Amendments of 1990, and the installation ofnew capacity utilizing advanced technologies to increaseplant efficiency, such as combined-cycle plants andcombined heat and power projects. Annual changes inCO2 emissions are a net result of these complex andvariable factors.
As estimated in this report, the amount of anthropogenicCO2 emissions attributable to the generation of elec-tricity in the United States increased 1.4 percent since theprevious year. In 1999, fossil-fueled generation increasedby about 2.9 percent; however, almost all of the increasewas associated with natural gas, the least carbon-inten-sive fossil fuel. The increase in CO2 emissions from thecombustion of natural gas for electricity generation

Department of Energy and Environmental Protection Agency/ Carbon Dioxide Emissions from theGeneration of Electric Power in the United States 7
11 http://www.bea.doc.gov/bea/dn1.htm, Department of Commerce web site, accessed May 10, 2000.12 Retail sales by utilities grew 1.73 percent from 1998 to 1999. Retail sales by marketers in deregulated, competitive retail markets are
not included. The addition of an estimated 48 billion kilowatthours in retail marketer sales would result in an increase in electricityconsumption of 2.45 percent from 1998 to 1999.
13 Energy Information Administration, Electric Power Annual 1999, Volume I, DOE/EIA-0348(99)/1 (Washington, DC, forthcoming).14 DSM data for 1999 will be available in the latter part of 2000.
amounted to 46 million metric tons, while the CO2
emissions from the combustion of petroleum and coaldecreased 16 million metric tons.
The national average output rate declined from 1.350pounds of CO2 per kilowatthour in 1998 to 1.341 poundsCO2 per kilowatthour in 1999. The primary driver ofthis change was the decreased output rate for coal-firedelectricity generation, which went from 2.117 pounds ofCO2 per kilowatthour to 2.095 pounds of CO2 per kilo-watthour. A change in the output rate for coal-firedelectricity generation in the absence of significant changein non-emitting generation will have the greatest effecton the national average output rate of CO2 per kilo-watthour both because coal-fired generation dominatesthe industry and is the most carbon-intensive fuel.
Economic Growth
Economic factors influence the demand for electricpower. In 1999, a strong economy was measured by the4.2-percent increase in the Gross Domestic Product(GDP).11 Electricity consumption grew by 1.7 percent,12
while the average national price of electricity decreased2.1 percent, from 6.74 cents in 1998 to 6.60 cents in1999.13 Although the growing demand for electricity isprimarily met by a corresponding growth in generation,a small amount is met by imported power, primarilyfrom Canada.
Weather
Weather is another factor affecting the year-to-yearchanges in the demand for electricity. Both 1999 and1998 were record-breaking years in terms of warmweather in the United States. The availability of hydro-electric power to displace fossil-fueled power waslimited by dry conditions in much of the Nation, withthe exception of the Pacific Northwest States.
During the summer months, the demand for power forair conditioning is a major factor in setting record highpeak demands for some utilities. In 1999, electricitygenerating plants consumed almost as much coal as therecord amount consumed in 1998 and increased theirnatural gas consumption to meet the continuing highdemand for electricity in the summer of 1999.
Demand-Side Management (DSM)
Energy efficiency programs and DSM activities, such asimproving insulation and replacing lighting and appli-ances with more energy efficient equipment, can reducethe demand for electricity. The reductions in demandachieved by DSM programs contribute to avoided CO2
emissions. In 1998, 49.2 billion kilowatthours of energysavings were achieved by DSM activities at electricutilities, a decrease from 56.4 billion kilowatthours in1997. Declining levels of energy savings reflect, in part,lower utility spending on DSM programs. In 1998,utilities’ total expenditures on DSM were $1.4 billion, adecrease of 13.1 percent from the previous year, andnearly 50 percent below the 1994 spending level.14 Datafor 1999 are not yet available.
Fossil and Nonfossil Fuels for ElectricityGeneration
The fuel or energy source used to generate electricity isthe most significant factor affecting the year-to-yearchanges in CO2 emissions. Because hydroelectric andnuclear generation displace fossil-fueled generationwhen available, CO2 emissions increase when hydro-electric or nuclear power is unavailable and fossil-fueledgeneration is used as a replacement. Conversely, CO2
emissions can be reduced through a greater use ofnuclear, hydroelectric, and renewable energy forelectricity generation. Collectively, nonfossil-fueled elec-tricity generation by nuclear, hydroelectric, and renew-able energy sources that do not contribute to anthro-pogenic CO2 emissions remained almost unchanged in1999 as compared to 1998, with much of the increase innuclear generation being offset by an absolute decreasein hydroelectric power generation and other generationfrom fuels such as municipal solid waste, tires, and otherfuels that emit anthropogenic CO2 when burned togenerate electricity.
As stated previously, the amount of available hydro-electric power is affected by precipitation patterns. In1999, hydroelectric power generation was lower in allregions, except in the Northwestern States. Oregon,Idaho, and Washington typically generate more than 90percent of their power at hydroelectric plants and exportpower to California. Hydroelectric power generation

Department of Energy and Environmental Protection Agency/ Carbon Dioxide Emissions from theGeneration of Electric Power in the United States8
15 Heating value is measured in British thermal units (Btu), a standard unit for measuring the quantity of heat energy equal to thequantity of heat required to raise the temperature of 1 pound of water 1 degree Fahrenheit.
16 Boiler type and efficiency, capacity factor, and other factors also affect the number of kilowatthours that can be produced at aparticular plant.
17 The thermal efficiency is a ratio of kilowatthours of electricity produced multiplied by 3,412 Btu to the fuel consumed, measuredin Btu. This ratio is dependent on the estimated generation and fuel consumption for 1999. Uncertainty and an undetermined degree ofvariation in both generation and fuel consumption data for the nonutility sector may contribute to an apparent change in the ratio, whichshould be regarded as a preliminary value at this time.
increased in 1999 in these States, reducing the need forfossil-fueled generation and contributed to keeping CO2
emissions low in the Pacific Contiguous CensusDivision. Nationally, hydroelectric power generationdecreased by 3.6 percent in 1999.
Nuclear power generation increased by 8.1 percent to arecord level in 1999, which contributed to keeping CO2
emissions lower by displacing fossil-fueled generation,particularly in the East North Central Census Division.Several nuclear plants came back online in 1999, helpingto increase the average nuclear capacity factor to 86percent. An absolute increase in the amount of nuclearpower more than offset the loss of some hydroelectricpower in 1999.
Fuel Quality and Price
The amount of CO2 emissions from the combustion offossil fuels to generate electricity varies according to thequality of the fuels, defined by their carbon content andthe associated heating value (Btu).15 The Btu content offuels is a determinant of the number of kilowatthoursthat can be produced16 and carbon content is a deter-minant of the amount of CO2 released when the fuel isburned. Fossil fuels are categorized as either coal,natural gas and other gaseous fuels, or petroleum andpetroleum products. Coal-fired electricity generation hasthe highest output rate of CO2 per kilowatthourproduced, averaging 2.095 pounds per kilowatthour in1999. Petroleum-fired electricity generation averaged1.969 pounds per kilowatthour, and natural gas-firedelectricity generation had the lowest rate of 1.321pounds per kilowatthour. With coal-fired plants gen-erating the majority of electricity in the Nation andhaving the highest output rate, they produced thegreatest share of CO2 emissions from electricity gener-ation, approximately 80 percent of the total.
Some plants are capable of switching fuels to takeadvantage of the least expensive or the most availableresources. In 1998, the price of crude oil reached itslowest level since 1976, causing the price of petroleumdelivered to electric utilities to fall below that of naturalgas for the first time since 1993. This factor is important
when considering the capability of some electric plantsto burn the least expensive of these two fuels. As aresult of falling prices in 1998, petroleum-fired gen-eration was higher in 1998 than in 1997. However during1999, the price of petroleum began to increase, andgeneration from petroleum plants declined. Petroleumhas a higher output rate of CO2 than natural gas; there-fore, switching from petroleum to natural gas can havea beneficial effect on both the overall amount and outputrate of CO2 emissions.
In 1999, virtually all of the increase in fossil-fueled gen-eration was from natural gas-fired plants. Coal-firedelectricity generation was close to unchanged, whilepetroleum-fired electricity generation fell. Most of theincrease in CO2 emissions from gas-fired plants wasoffset by the decline in CO2 emissions from petroleum-and coal-fired plants.
Thermal Efficiencies of Power Plants
CO2 emissions from electric power generation areinfluenced by the efficiency with which fossil fuels areconverted into electricity. In a typical power plant,about one-third of the energy contained in the fuel isconverted into electricity, while the remainder is emittedas waste heat. Substantial improvements in generationefficiency can be achieved in the future through thereplacement of traditional power generators with moreefficient technologies, such as combined-cycle generatorsand combined heat and power (CHP) systems. In thesetypes of systems, waste heat is captured to produceadditional kilowatthours of electricity or displace energyused for heating or cooling. Both strategies result inlower CO2 emissions. The national average thermalefficiency of power generation from fossil fuels in 1999was estimated to be 32.54 percent, slightly higher thanthe previous year’s average of 32.42 percent.17
The average thermal efficiency of coal-fired plants wentfrom 33.15 percent to 33.54 percent in 1999. The im-provement in efficiency is also reflected in the nationalaverage output rate of pounds of CO2 per kilowatthour.The output rate for coal-fired plants decreased from2.117 pounds of CO2 per kilowatthour in 1998 to

Department of Energy and Environmental Protection Agency/ Carbon Dioxide Emissions from theGeneration of Electric Power in the United States 9
2.095 in 1999. Petroleum-fired plants and natural gas-fired plants showed slightly lower thermal efficiencies in1999, with a corresponding change in the output rate.The rate for petroleum-fired plants increased from 1.915to 1.969 pounds of CO2 per kilowatthour, and naturalgas-fired plants’ output rate increased from 1.314 to1.321 pounds of CO2 per kilowatthour.
Conclusion
The emission of CO2 by electric power plants is not con-trolled because no standards or required reductionscurrently exist. Some technology is available to limitCO2 emissions, but it is extremely expensive. Theoptions to limit the emission of CO2 from electricitygeneration are to encourage reduction of the overallconsumption of electricity through energy efficiency andconservation initiatives, to improve combustion effi-ciency at existing plants or install new units that employmore efficient technologies, such as combined-cycleunits and combined heat and power (CHP) systems, andto replace fossil-fueled generation with nonfossil-fueledalternatives, such as nuclear, hydroelectric, and otherrenewable energy sources.
Comparison of Projected withActual CO2 Emissions
and Generation by Fuel Type
Each year, the Energy Information Administration pre-pares the Annual Energy Outlook (AEO), which containsprojections of selected energy information. Projectionsfor electricity supply and demand data, including CO2
emissions and generation by fuel type, are made for thenext 20 years. To evaluate the accuracy and usefulnessof the forecast, a comparison was made between thelatest forecast for 1999 (from the AEO2000) and theestimated actual data for 1999 (Table 5). The near-termprojections in the AEO are based on a combination of thepartial-year data available when the forecast was pre-pared, the latest short-term forecast appearing in theShort-Term Energy Outlook, and the regional detail con-tained in the National Energy Modeling System (NEMS).Consequently, comparisons with the actual data for 1999are not a definitive indicator of the accuracy of thelonger-term projections appearing in the AEO. Never-theless, they do provide a useful preliminary gauge fortracking and measuring the projections against actualdata over time.
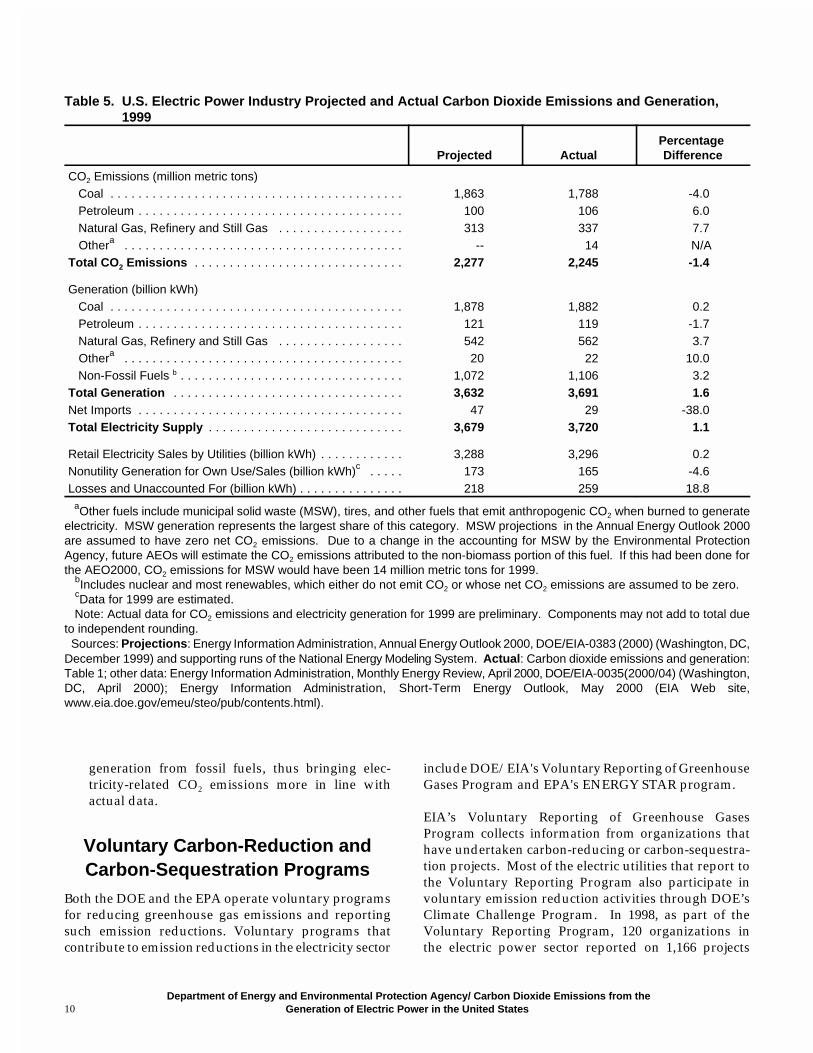
Total electricity-related CO2 emissions for fossil fuels in1999 were 1.4 percent below the projected emissionslevel, while the actual total generation from fossil fuelswas 0.9 percent above the projected generation level.The largest percentage difference between projected andactual generation by fuel (other than for “Other”) was fornatural gas-fired generation, which was 3.7 percenthigher than projected, but with a corresponding dif-ference in CO2 emissions of 7.7 percent. However, thelargest absolute difference between projected and actualCO2 emissions by fuel was for coal-fired generation,whose emissions were 75 million metric tons, or 4.0percent, below the projected level, even while generationwas 0.2 percent higher. Three primary factors contributeto the divergence in projected and actual CO2 emissions:
� Efficiency of generating units. Average generatingefficiencies for coal-fired capacity were higher in1999 than those assumed by NEMS, on the order ofabout 4 percent. On the other hand, the efficiency ofnatural gas-fueled capacity was about 4 percentlower than the NEMS assumptions. Because coal-fired units produce more than three times thegeneration of natural gas-fired generators, theimpact of the higher efficiencies of coal-burningcapacity outweighs the lower actual efficiencies fornatural gas capacity. Efficiencies for petroleum-based generation, a much smaller share of overallsupply, were 5.6 percent lower than the NEMSassumptions.
� Total generation requirements. Overall electricitygeneration was 1.6 percent higher in 1999 thanprojected. This was due to the combined effects ofhigher sales, lower imports, and higher losses forelectricity than expected. The incremental genera-tion requirements were met in part by highernatural gas-fired generation, as well as greaterreliance on nonfossil sources of electricity such asnuclear and renewables. To the extent that naturalgas-fired generation was above the forecast, higherCO2 emissions resulted.
� Increased nuclear and hydroelectric generation.Nuclear generation was 30 billion kilowatthours, or5.7 percent, above the projected levels in 1999. Thedifference was due primarily to improving per-formance of nuclear generating units, beyond thatassumed in the projections. Also, hydroelectricgeneration was 13 billion kilowatthours, or 4.3percent, above projections. Given the same overalllevel of generation, higher nuclear and hydroelectricprojections would have resulted in less projected
Department of Energy and Environmental Protection Agency/ Carbon Dioxide Emissions from theGeneration of Electric Power in the United States10
generation from fossil fuels, thus bringing elec-tricity-related CO2 emissions more in line withactual data.
Voluntary Carbon-Reduction andCarbon-Sequestration Programs
Both the DOE and the EPA operate voluntary programsfor reducing greenhouse gas emissions and reportingsuch emission reductions. Voluntary programs thatcontribute to emission reductions in the electricity sector
include DOE/EIA's Voluntary Reporting of GreenhouseGases Program and EPA's ENERGY STAR program.
EIA’s Voluntary Reporting of Greenhouse GasesProgram collects information from organizations thathave undertaken carbon-reducing or carbon-sequestra-tion projects. Most of the electric utilities that report tothe Voluntary Reporting Program also participate involuntary emission reduction activities through DOE’sClimate Challenge Program. In 1998, as part of theVoluntary Reporting Program, 120 organizations inthe electric power sector reported on 1,166 projects
Table 5. U.S. Electric Power Industry Projected and Actual Carbon Dioxide Emissions and Generation,1999
Projected ActualPercentage Difference
CO2 Emissions (million metric tons) Coal . . . . . . . . . . . . . . . . . . . . . . . . . . . . . . . . . . . . . . . . . . 1,863 1,788 -4.0 Petroleum . . . . . . . . . . . . . . . . . . . . . . . . . . . . . . . . . . . . . . 100 106 6.0 Natural Gas, Refinery and Still Gas . . . . . . . . . . . . . . . . . . 313 337 7.7 Othera . . . . . . . . . . . . . . . . . . . . . . . . . . . . . . . . . . . . . . . . -- 14 N/ATotal CO2 Emissions . . . . . . . . . . . . . . . . . . . . . . . . . . . . . . 2,277 2,245 -1.4
Generation (billion kWh) Coal . . . . . . . . . . . . . . . . . . . . . . . . . . . . . . . . . . . . . . . . . . 1,878 1,882 0.2 Petroleum . . . . . . . . . . . . . . . . . . . . . . . . . . . . . . . . . . . . . . 121 119 -1.7 Natural Gas, Refinery and Still Gas . . . . . . . . . . . . . . . . . . 542 562 3.7 Othera . . . . . . . . . . . . . . . . . . . . . . . . . . . . . . . . . . . . . . . . 20 22 10.0 Non-Fossil Fuels b . . . . . . . . . . . . . . . . . . . . . . . . . . . . . . . . 1,072 1,106 3.2Total Generation . . . . . . . . . . . . . . . . . . . . . . . . . . . . . . . . . 3,632 3,691 1.6Net Imports . . . . . . . . . . . . . . . . . . . . . . . . . . . . . . . . . . . . . . 47 29 -38.0Total Electricity Supply . . . . . . . . . . . . . . . . . . . . . . . . . . . . 3,679 3,720 1.1
Retail Electricity Sales by Utilities (billion kWh) . . . . . . . . . . . . 3,288 3,296 0.2Nonutility Generation for Own Use/Sales (billion kWh)c . . . . . 173 165 -4.6Losses and Unaccounted For (billion kWh) . . . . . . . . . . . . . . . 218 259 18.8
aOther fuels include municipal solid waste (MSW), tires, and other fuels that emit anthropogenic CO2 when burned to generateelectricity. MSW generation represents the largest share of this category. MSW projections in the Annual Energy Outlook 2000are assumed to have zero net CO2 emissions. Due to a change in the accounting for MSW by the Environmental ProtectionAgency, future AEOs will estimate the CO2 emissions attributed to the non-biomass portion of this fuel. If this had been done forthe AEO2000, CO2 emissions for MSW would have been 14 million metric tons for 1999. bIncludes nuclear and most renewables, which either do not emit CO2 or whose net CO2 emissions are assumed to be zero. cData for 1999 are estimated. Note: Actual data for CO2 emissions and electricity generation for 1999 are preliminary. Components may not add to total dueto independent rounding. Sources: Projections: Energy Information Administration, Annual Energy Outlook 2000, DOE/EIA-0383 (2000) (Washington, DC,December 1999) and supporting runs of the National Energy Modeling System. Actual: Carbon dioxide emissions and generation:Table 1; other data: Energy Information Administration, Monthly Energy Review, April 2000, DOE/EIA-0035(2000/04) (Washington,DC, April 2000); Energy Information Administration, Short-Term Energy Outlook, May 2000 (EIA Web site,www.eia.doe.gov/emeu/steo/pub/contents.html).
Department of Energy and Environmental Protection Agency/ Carbon Dioxide Emissions from theGeneration of Electric Power in the United States 11
18 The Voluntary Reporting of Greenhouse Gases Program is currently in the 1999 data reporting cycle; the most recent year for whichcomplete data are available is 1998. The 1997 and 1998 data in last year’s report were preliminary and have been revised in this report dueto subsequent completion of internal EIA review of those data. Emission reductions also include those reported by landfill methaneoperators.
19 The EIA also receives numerous reports on projects and emissions reductions from reporters outside the electric power sector. Inaddition, many reports submitted to the Voluntary Reporting Program (including electric power sector reports) include reductions ofgreenhouse gases other than carbon dioxide, such as methane and nitrous oxide and the high Global Warming Potential gases such asHFCs, PFCs and sulfur hexafluoride.
20 U.S. Department of Energy, Climate Challenge Fact Sheet (1998), and conversation with Larry Mansueti, August 10, 1999. See alsohttp://www.eren.doe.gov/climatechallenge/execsumm/execsumm.htm.
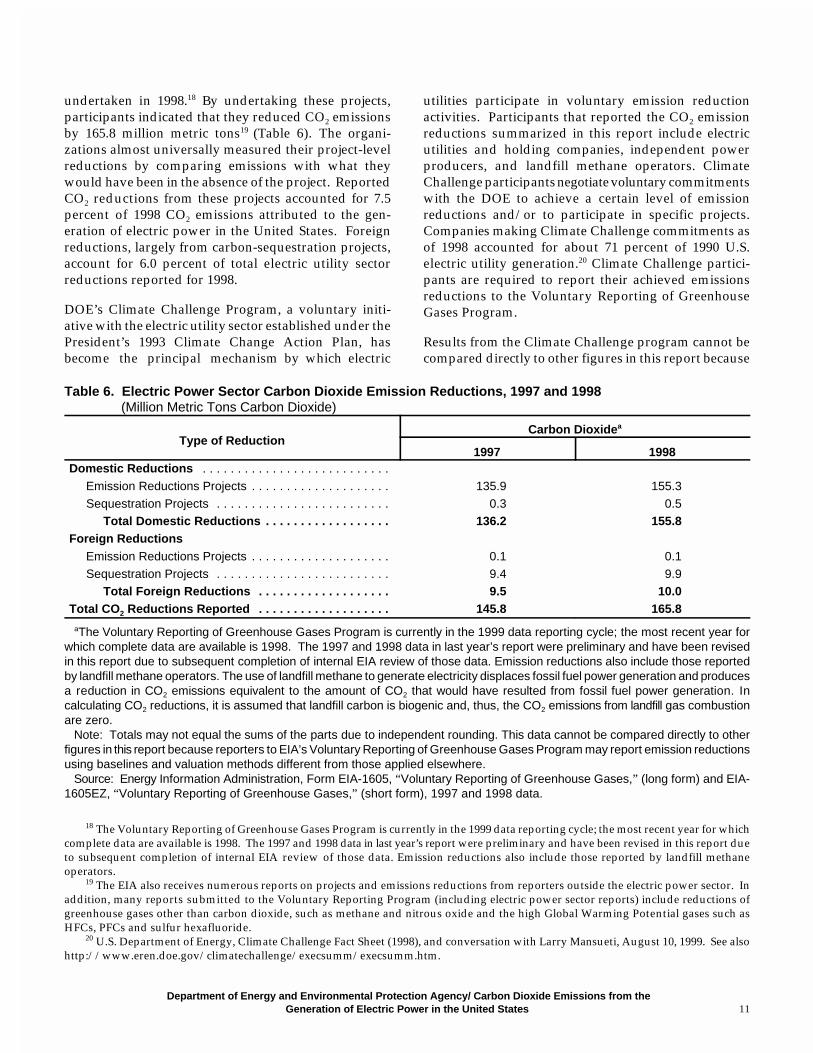
Table 6. Electric Power Sector Carbon Dioxide Emission Reductions, 1997 and 1998(Million Metric Tons Carbon Dioxide)
Type of ReductionCarbon Dioxidea
1997 1998Domestic Reductions . . . . . . . . . . . . . . . . . . . . . . . . . . .
Emission Reductions Projects . . . . . . . . . . . . . . . . . . . . 135.9 155.3
Sequestration Projects . . . . . . . . . . . . . . . . . . . . . . . . . 0.3 0.5 Total Domestic Reductions . . . . . . . . . . . . . . . . . . 136.2 155.8Foreign Reductions Emission Reductions Projects . . . . . . . . . . . . . . . . . . . . 0.1 0.1
Sequestration Projects . . . . . . . . . . . . . . . . . . . . . . . . . 9.4 9.9 Total Foreign Reductions . . . . . . . . . . . . . . . . . . . 9.5 10.0Total CO2 Reductions Reported . . . . . . . . . . . . . . . . . . . 145.8 165.8
aThe Voluntary Reporting of Greenhouse Gases Program is currently in the 1999 data reporting cycle; the most recent year forwhich complete data are available is 1998. The 1997 and 1998 data in last year’s report were preliminary and have been revisedin this report due to subsequent completion of internal EIA review of those data. Emission reductions also include those reportedby landfill methane operators. The use of landfill methane to generate electricity displaces fossil fuel power generation and producesa reduction in CO2 emissions equivalent to the amount of CO2 that would have resulted from fossil fuel power generation. Incalculating CO2 reductions, it is assumed that landfill carbon is biogenic and, thus, the CO2 emissions from landfill gas combustionare zero. Note: Totals may not equal the sums of the parts due to independent rounding. This data cannot be compared directly to otherfigures in this report because reporters to EIA’s Voluntary Reporting of Greenhouse Gases Program may report emission reductionsusing baselines and valuation methods different from those applied elsewhere. Source: Energy Information Administration, Form EIA-1605, “Voluntary Reporting of Greenhouse Gases,” (long form) and EIA-1605EZ, “Voluntary Reporting of Greenhouse Gases,” (short form), 1997 and 1998 data.
undertaken in 1998.18 By undertaking these projects,participants indicated that they reduced CO2 emissionsby 165.8 million metric tons19 (Table 6). The organi-zations almost universally measured their project-levelreductions by comparing emissions with what theywould have been in the absence of the project. ReportedCO2 reductions from these projects accounted for 7.5percent of 1998 CO2 emissions attributed to the gen-eration of electric power in the United States. Foreignreductions, largely from carbon-sequestration projects,account for 6.0 percent of total electric utility sectorreductions reported for 1998.
DOE’s Climate Challenge Program, a voluntary initi-ative with the electric utility sector established under thePresident’s 1993 Climate Change Action Plan, hasbecome the principal mechanism by which electric
utilities participate in voluntary emission reductionactivities. Participants that reported the CO2 emissionreductions summarized in this report include electricutilities and holding companies, independent powerproducers, and landfill methane operators. ClimateChallenge participants negotiate voluntary commitmentswith the DOE to achieve a certain level of emissionreductions and/or to participate in specific projects.Companies making Climate Challenge commitments asof 1998 accounted for about 71 percent of 1990 U.S.electric utility generation.20 Climate Challenge partici-pants are required to report their achieved emissionsreductions to the Voluntary Reporting of GreenhouseGases Program.
Results from the Climate Challenge program cannot becompared directly to other figures in this report because

Department of Energy and Environmental Protection Agency/ Carbon Dioxide Emissions from theGeneration of Electric Power in the United States12
21 See the 1997 Climate Change Action Report (the Submission of the United States of America under the United Nations FrameworkConvention on Climate Change), p. 100, for one such assessment.
22 TXU was formerly known as Texas Utilities, while FirstEnergy is the result of a merger between Ohio Edison and Centerior Energy(Cleveland Electric).
23 Other greenhouse gases include methane reductions from landfills and oil and natural gas systems, and sulfur hexafluoride (SF6),which has 23,900 times the global warming impact of carbon dioxide when released into the atmosphere.
24 The more than 40 companies referenced in last year’s report are participants in EEI’s UtiliTree program. Of these companies, 31reported their share of participation to the Voluntary Reporting of Greenhouse Gases Program for 1998.
the Climate Challenge program allows participants toreport emissions reductions using baselines and calcu-lation methods different from those applied elsewhere.For this reason, EIA keeps an accounting of reportssubmitted by Climate Challenge participants, but theUnited States counts only a fraction of these reportedreductions in comprehensive assessments of overallreductions in greenhouse gases.21
The largest reductions claimed for 1998 are from thesemajor U.S. electric utilities: the Tennessee ValleyAuthority (26.0 million metric tons of CO2), TXU (19.9million metric tons of CO2), Duke Energy (12.1 millionmetric tons of CO2), and FirstEnergy (10.6 million metrictons of CO2).22 These four companies accounted forabout 41.4 percent of the CO2 emissions reductionsreported in 1998 by the electric power sector. Each ofthese companies owns one or more nuclear powerplants, and the bulk of their reported reductions iscalculated by comparing either actual or additionalnuclear output from their plants with the emissions thatwould have occurred if the same quantity of electricityhad been generated using fossil fuels.
Electric power industry companies also reported onprojects reducing other greenhouse gases.23 Combiningall projects and all greenhouse gases, the electric powersector reporters claimed 176.9 million metric tons ofcarbon dioxide equivalent reductions in 1998.
Utilities also undertook a number of carbon-sequestra-tion projects. Although these projects do not directlyaffect CO2 emissions, they do offset utility CO2 emis-sions. Foreign carbon-sequestration projects from theelectric sector were reported to be 9.9 million metric tonsof CO2 in 1998, while domestic projects were reported tobe 0.5 million metric tons. These activities were domi-nated by three independent power producer subsidiariesof the AES Corporation, which reported 7.6 millionmetric tons of CO2 sequestration annually from threeprojects with activities in Belize, Bolivia, Ecuador, Peru,and Guatemala. These projects undertake tropical rainforest management, preservation, or reforestation.
In addition, more than 30 companies reported on theirpro-rated share of participation in the Edison Electric
Institute's UtiliTree program.24 The UtiliTree programis a carbon-sequestration mutual fund in which electricutilities purchase shares. UtiliTree uses the funds toparticipate in forest management and reforestationprojects in the United States and abroad.
The United States’ voluntary programs are reducingdomestic emissions of greenhouse gases in a number ofsectors across the economy through a range of partner-ships and outreach efforts. For example, the ENERGYSTAR Program, run by the EPA in partnership withDOE, reduces energy consumption in homes and officebuildings across the Nation. EPA and DOE setenergy-efficiency specifications for a range of productsincluding office equipment, heating and cooling equip-ment, residential appliances, televisions and VCRs, andnew homes. The ENERGY STAR label for buildings isbased on a performance rating system that allowsbuilding owners to evaluate the efficiency of theirbuildings relative to others. On average, buildings acrossthe country can improve efficiency by 30 percentthrough a variety of improvements. Manufacturer andretailer partners in the program may place the nationallyrecognized ENERGY STAR label on qualifying products.
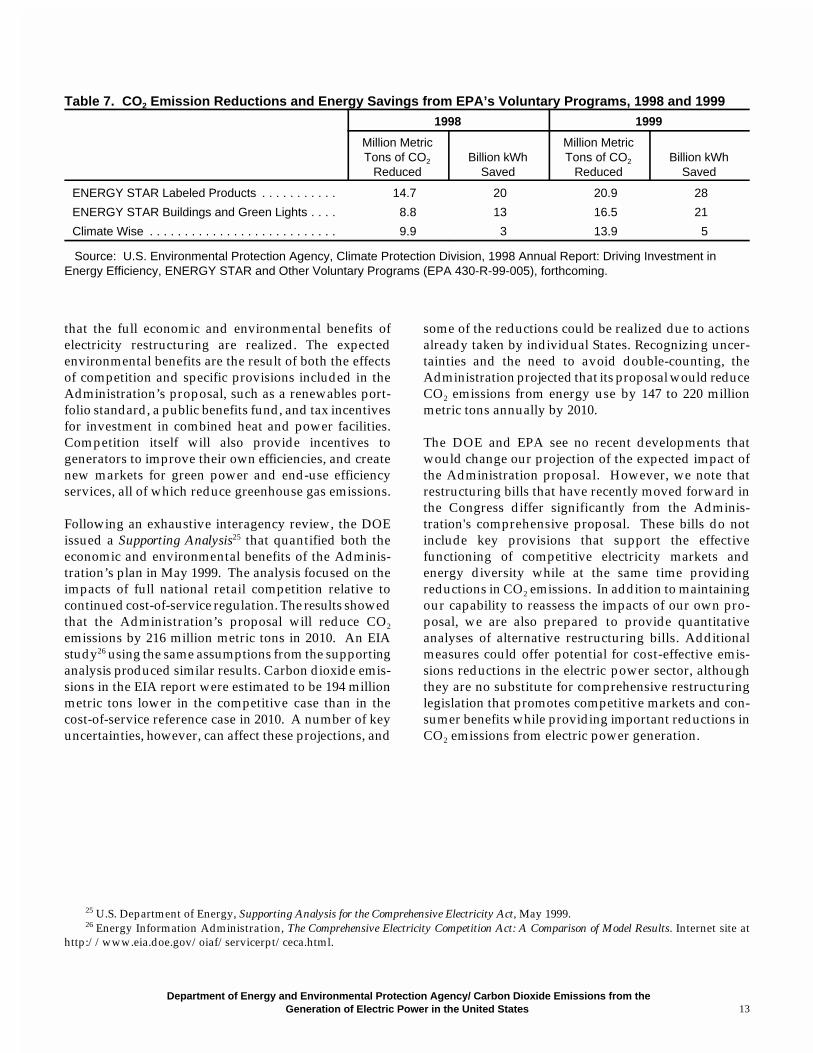
In the past several years, the ENERGY STAR label hasexpanded to include more than 30 products and nearly7,000 product models. In 1999, energy consumption wasreduced by approximately 28 billion kilowatthours as aresult of the program, reducing greenhouse gas emis-sions by nearly 21 million metric tons CO2 (Table 7).Through EPA’s ENERGY STAR Buildings and GreenLights Partnership, more than 15 percent of the squarefootage in U.S. buildings has undergone efficiencyupgrades resulting in electricity savings in excess of 21billion kilowatthours and emissions reductions of morethan 16 million metric tons CO2.
Environmental Effects of FederalRestructuring Legislation
In April 1999, the Administration submitted to Congressthe Comprehensive Electricity Competition Act (CECA),a bill to restructure the U.S. electricity industry andfoster retail competition. CECA was designed to ensure
Department of Energy and Environmental Protection Agency/ Carbon Dioxide Emissions from theGeneration of Electric Power in the United States 13
25 U.S. Department of Energy, Supporting Analysis for the Comprehensive Electricity Act, May 1999.26 Energy Information Administration, The Comprehensive Electricity Competition Act: A Comparison of Model Results. Internet site at
http://www.eia.doe.gov/oiaf/servicerpt/ceca.html.
Table 7. CO2 Emission Reductions and Energy Savings from EPA’s Voluntary Programs, 1998 and 19991998 1999
Million MetricTons of CO2
ReducedBillion kWh
Saved
Million MetricTons of CO2
ReducedBillion kWh
Saved
ENERGY STAR Labeled Products . . . . . . . . . . . 14.7 20 20.9 28
ENERGY STAR Buildings and Green Lights . . . . 8.8 13 16.5 21
Climate Wise . . . . . . . . . . . . . . . . . . . . . . . . . . . 9.9 3 13.9 5
Source: U.S. Environmental Protection Agency, Climate Protection Division, 1998 Annual Report: Driving Investment inEnergy Efficiency, ENERGY STAR and Other Voluntary Programs (EPA 430-R-99-005), forthcoming.
that the full economic and environmental benefits ofelectricity restructuring are realized. The expectedenvironmental benefits are the result of both the effectsof competition and specific provisions included in theAdministration’s proposal, such as a renewables port-folio standard, a public benefits fund, and tax incentivesfor investment in combined heat and power facilities.Competition itself will also provide incentives togenerators to improve their own efficiencies, and createnew markets for green power and end-use efficiencyservices, all of which reduce greenhouse gas emissions.
Following an exhaustive interagency review, the DOEissued a Supporting Analysis25 that quantified both theeconomic and environmental benefits of the Adminis-tration’s plan in May 1999. The analysis focused on theimpacts of full national retail competition relative tocontinued cost-of-service regulation. The results showedthat the Administration’s proposal will reduce CO2
emissions by 216 million metric tons in 2010. An EIAstudy26 using the same assumptions from the supportinganalysis produced similar results. Carbon dioxide emis-sions in the EIA report were estimated to be 194 millionmetric tons lower in the competitive case than in thecost-of-service reference case in 2010. A number of keyuncertainties, however, can affect these projections, and
some of the reductions could be realized due to actionsalready taken by individual States. Recognizing uncer-tainties and the need to avoid double-counting, theAdministration projected that its proposal would reduceCO2 emissions from energy use by 147 to 220 millionmetric tons annually by 2010.
The DOE and EPA see no recent developments thatwould change our projection of the expected impact ofthe Administration proposal. However, we note thatrestructuring bills that have recently moved forward inthe Congress differ significantly from the Adminis-tration's comprehensive proposal. These bills do notinclude key provisions that support the effectivefunctioning of competitive electricity markets andenergy diversity while at the same time providingreductions in CO2 emissions. In addition to maintainingour capability to reassess the impacts of our own pro-posal, we are also prepared to provide quantitativeanalyses of alternative restructuring bills. Additionalmeasures could offer potential for cost-effective emis-sions reductions in the electric power sector, althoughthey are no substitute for comprehensive restructuringlegislation that promotes competitive markets and con-sumer benefits while providing important reductions inCO2 emissions from electric power generation.

Department of Energy and Environmental Protection Agency/ Carbon Dioxide Emissions from theGeneration of Electric Power in the United States 15
Appendix A
Presidential Directive
April 15, 1999MEMORANDUM FOR THE
SECRETARY OF ENERGYADMINISTRATOR OF THE ENVIRONMENTAL PROTECTION AGENCY
SUBJECT: Report on Carbon Dioxide (CO2) Emissions
My Administration's proposal to promote retail competition in the electric power industry, if enacted, will help todeliver economic savings, cleaner air, and a significant down payment on greenhouse gas emissions reductions. Theproposal exemplifies my Administration's commitment to pursue both economic growth and environmental progresssimultaneously.
As action to advance retail competition proceeds at both the State and Federal levels, the Administration and theCongress share an interest in tracking environmental indicators in this vital sector. We must have accurate andfrequently updated data.
Under current law, electric power generators report various types of data relating to generation and air emissions tothe Department of Energy (DOE) and the Environmental Protection Agency (EPA). To ensure that this data collectionis coordinated and provides for timely consideration by both the Administration and the Congress, you are directedto take the following actions:
� On an annual basis, you shall provide me with a report summarizing CO2 emissions data collected during theprevious year from all utility and nonutility electricity generators providing power to the grid, beginning with 1998data. This information shall be provided to me no more than 6 months after the end of the previous year, and for1998, within 6 months of the date of this directive.
� The report, which may be submitted jointly, shall present CO2 emissions information on both a national andregional basis, stratified by the type of fuel used for electricity generation, and shall indicate the percentage ofelectricity generated by each type of fuel or energy resource. The CO2 emissions shall be reported both on the basisof total mass (tons) and output rate (e.g., pounds per megawatt-hour).
� The report shall present the amount of CO2 reduction and other available information from voluntarycarbon-reducing and carbon-sequestration projects undertaken, both domestically and internationally, by theelectric utility sector.
� The report shall identify the main factors contributing to any change in CO2 emissions or CO2 emission ratesrelative to the previous year on a national, and, if relevant, regional basis. In addition, the report shall identifydeviations from the actual CO2 emissions, generation, and fuel mix of their most recent projections developed bythe Department of Energy and the Energy Information Administration, pursuant to their existing authorities andmissions.
� In the event that Federal restructuring legislation has not been enacted prior to your submission of the report, thereport shall also include any necessary updates to estimates of the environmental effects of my Administration'srestructuring legislation.
� Neither the DOE nor the EPA may collect new information from electricity generators or other parties in order toprepare the report.
WILLIAM J. CLINTON

Department of Energy and Environmental Protection Agency/ Carbon Dioxide Emissions from theGeneration of Electric Power in the United States 17
Appendix B
Data Sources and Methodology
This section describes the data sources and methodologyemployed to calculate estimates of carbon dioxide (CO2)emissions from utility and nonutility electric generatingplants. Due to the report being submitted in June of2000, the annual census data, on which 1998 emissionestimates are based, are not yet available from the FormEIA-860B and Form EIA-767. The methodology em-ployed for estimating 1999 CO2 emissions in this reportare based on two monthly data collections, Form EIA-759 and Form EIA-900. The Form EIA-759 collectsmonthly generation and fuel consumption from allutility-owned generating plants, and the Form EIA-900collects generation and fuel consumption from nonutilityplants with a nameplate capacity of 50 megawatts (MW)or more. The 1999 estimates of CO2 emissions and netgeneration are preliminary estimates; final emissionsestimates based on annual census data will be publishedin the Electric Power Annual Volume II 1999, later thisyear.
Electric Utility Data Sources
The electric utility data are derived from several forms.The Form EIA-767, “Steam-Electric Plant Operation andDesign Report,” collects information annually for all U.S.power plants with a total existing or planned organic- ornuclear-fueled steam-electric generator nameplate ratingof 10 MW or larger. Power plants with a total generatornameplate rating of 100 MW or more must complete theentire form, providing among other data, informationabout fuel consumption and quality. Power plants witha total generator nameplate rating from 10 MW to lessthan 100 MW complete only part of the form, includinginformation on fuel consumption.
Form EIA-759, “Monthly Power Plant Report,” is a cutoffmodel sample of approximately 360 electric utilitiesdrawn from the frame of all operators of electric utilityplants (approximately 700 electric utilities) that generateelectric power for public use. The monthly data col-lection is from all utilities with at least one plant with anameplate capacity of 50 MW or more. For all utilityplants not included in the monthly sample, those withnameplate capacities less than 50 MW, monthly data arecollected annually. Form EIA-759 is used to collect data
on net generation; consumption of coal, petroleum, andnatural gas; and end-of-the-month stocks of coal andpetroleum for each plant by fuel-type combination.
The Federal Energy Regulatory Commission (FERC)Form 423, “Monthly Report of Cost and Quality of Fuelsfor Electric Plants,” is a monthly record of delivered-fuelpurchases, submitted by approximately 230 electricutilities for each electric generating plant with a totalsteam-electric and combined-cycle nameplate capacity of50 MW or more. FERC Form 423 collects data on fuelcontracts, fuel type, coal origin, fuel quality anddelivered cost of fuel.
Nonutility Data Sources
Form EIA-860B, “Annual Electric Generator Report %Nonutility,” (prior Form EIA-867, “Annual NonutilityPower Producer Report”) collects information annuallyfrom all nonutility power producers with a totalgenerator nameplate rating of 1 MW or more, includingcogenerators, small power producers, and other non-utility electricity generators. All facilities must completethe entire form, providing, among other data, infor-mation about fuel consumption and quality; howeverfacilities with a combined nameplate capacity of lessthan 25 MW are not required to complete Schedule V,“Facility Environmental Information,” of the FormEIA-860B.
Form EIA-900, “Monthly Nonutility Power PlantReport,” is a cutoff model sample of approximately 500nonutilities drawn from the frame of all nonutilityfacilities (approximately 2000 nonutilities) that haveexisting or planned nameplate capacity of 1 MW ormore. The monthly data collection comes from allnonutilities with a nameplate rating of 50 MW or more.A cutoff model sampling and estimation are employedusing the annual Form EIA-860B.
CO2 Coefficients
The coefficients for determining carbon released fromthe combustion of fossil fuels were developed by the
Department of Energy and Environmental Protection Agency/ Carbon Dioxide Emissions from theGeneration of Electric Power in the United States18
Energy Information Administration. A detailed discus-sion of the development and sources used is containedin the publication, Emissions of Greenhouse Gases in theUnited States, (DOE/EIA-0573), Appendix B. Thenonutility coefficients were developed to be consistentwith the utility coefficients.
Methodology for 1998
The methodology for developing the CO2 emissionestimates for steam utility plants and nonsteam utilityplants (calculations performed on a plant basis by fuel),as well as for nonutility plants (calculations performedon a facility basis by fuel), is as follows:
Steam Utility Plants
Form EIA-767, “Steam-Electric Plant Operation andDesign Report”Form EIA-759, “Monthly Power Plant Report” FERC Form 423, “Monthly Report of Cost and Quality ofFuels for Electric Plants”
Step 1. Sum of Monthly Consumption (EIA-767)times Monthly Average Btu Content (EIA-767) divided by Total Annual Consumption(EIA-767) = Weighted Annual Btu ContentFactor.
Step 2. Annual Consumption (EIA-767) timesWeighted Annual Btu Content Factor (Step1) = Annual Btu Consumption.
Step 3. Annual Btu Consumption (Step 2) times CO2
factors = Annual CO2 Emissions.
Step 4. Reduce Annual CO2 Emissions (Step 3) by 1percent to assume 99 percent burn factor.
Nonsteam Utility Plants
Form EIA-759, “Monthly Power Plant Report”FERC Form 423, “Monthly Report of Cost and Quality ofFuels for Electric Plants”
Step 1(a). If monthly EIA-759 and monthly FERC Form423 are available: Sum of Monthly Con-sumption (EIA-759) times Monthly AverageBtu Content (FERC Form 423) divided by
Total Annual Consumption = WeightedAnnual Btu Content Factor.
Step 1(b). If monthly EIA-759 is available, but notmonthly FERC Form 423: Sum of MonthlyConsumption (EIA-759) times AverageMonthly Btu Content (calculated from FERCForm 423) divided by Total AnnualConsumption = Weighted Annual BtuContent Factor.
Step 1(c). If only annual EIA-759 is available: AnnualConsumption (EIA-759) times AverageAnnual Btu Content (calculated from FERCForm 423) divided by Total AnnualConsumption = Weighted Annual BtuContent Factor.
Step 2. Annual Consumption (EIA-759) timesWeighted Annual Btu Content Factor (Step1) = Annual Btu Consumption.
Step 3. Annual Btu Consumption (Step 2) times CO2
Factors = Annual CO2 Emissions.
Step 4. Reduce Annual CO2 Emissions (Step 3) by 1percent to assume 99 percent burn factor.
Nonutility Plants
Form EIA-860B, “Annual Electric Generator Report %Nonutility”FERC Form 423, “Monthly Report of Cost and Quality ofFuels for Electric Plants”
Step 1. Annual Consumption (EIA-860B) timesAverage Annual Btu Content (EIA-860B)divided by Total Annual Consumption =Weighted Annual Btu Content Factor.
Step 2. Annual Consumption (EIA-860B) timesWeighted Annual Btu Content Factor (Step1) = Annual Btu Consumption.
Step 3. Annual Btu Consumption (Step 2) x CO2
Factors = Annual CO2 Emissions.
Step 4. Reduce Annual CO2 Emissions (Step 3) by 1percent to assume 99 percent burn factor.
Department of Energy and Environmental Protection Agency/ Carbon Dioxide Emissions from theGeneration of Electric Power in the United States 19
27 1998 Annual Consumption for cogenerators is adjusted to exclude fuel not used for generation of electricity.
Methodology for 1999
Utility Plants
Form EIA-767, “Steam-Electric Plant Operation andDesign Report”Form EIA-759, “Monthly Power Plant Report”FERC Form 423, “Monthly Report of Cost and Quality ofFuels for Electric Plants”
Step 1(a). If monthly EIA-759 and prior year annualEIA-767 are available: Sum of Monthly Con-sumption (EIA-759) times Monthly AverageBtu Content (EIA-767) divided by TotalAnnual Consumption (EIA-759) = WeightedAnnual Btu Content Factor.
Step 1(b). If prior year annual EIA-767 is not available,but monthly EIA-759 and monthly FERCForm 423 are available: Sum the MonthlyConsumption (EIA-759) times the MonthlyAverage Btu Content (FERC Form 423)divided by the Total Annual Consumption(EIA-759) = Weighted Annual Btu ContentFactor.
Step 1(c). If prior year annual EIA-767 and monthlyFERC Form 423 are not available, butmonthly EIA-759 is available: Sum theMonthly Consumption (EIA-759) times theAverage Monthly Btu Content (calculated atState level from FERC Form 423) divided bythe Total Annual Consumption (EIA-759) =Weighted Annual Btu Content Factor.
Step 1(d). If prior year annual EIA-767, monthly EIA-759 and monthly FERC Form 423 are notavailable, but only annual EIA-759 is avail-able: Annual Consumption (EIA-759) timesthe Average Annual Btu Content (calculatedat State level from FERC Form 423) dividedby the Total Annual Consumption (EIA-759)= Weighted Annual Btu Content Factor.
Step 2. Annual Consumption (EIA-759) times theWeighted Annual Btu Content Factor (Step1) = Annual Btu Consumption.
Step 3. Annual Btu Consumption (Step 2) times CO2
Coefficients (Emissions of Greenhouse Gases inthe United States) = Annual Gross CO2
Emissions.
Step 4. Reduce Annual Gross CO2 Emissions (Step3) by 1 percent to assume 99 percent burnfactor.
Nonutility Plants
Form EIA-900, “Monthly Nonutility Power Report”Form EIA-860B, “Annual Electric Generator Report %Nonutility”FERC Form 423, “Monthly Report of Cost and Quality ofFuels for Electric Plants”
Step 1(a). If monthly EIA-900 and prior year annualEIA-860B are available: Sum the MonthlyGeneration by Census Division and FuelType (EIA-900), and apply annual growthfactor model to estimate 1999 Annual Gener-ation. Divide 1999 Annual Generation by1998 Annual Generation (EIA-860B), subtract1, and multiply by 1998 Total AnnualConsumption27 (EIA-860B) = 1999 TotalAnnual Consumption. 1999 Total AnnualConsumption times Average Btu Content(EIA-860B for prior year) = 1999 Annual BtuConsumption.
Step 1(b). If monthly EIA-900 and FERC Form 423 for1998 are available: (sold utility plant tononutility in 1999): Annual Consumption(EIA-900) times the Average Btu Content(FERC Form 423) = 1999 Annual BtuConsumption.
Step 1(c). If only monthly EIA-900 is available (newnonutility plants): Annual Consumption(EIA-900) times the Average Btu Content(calculated at State level from FERC Form423) = 1999 Annual Btu Consumption.
Step 2. 1999 Annual Btu Consumption (Step 1) timesCO2 Coefficients (Emissions of GreenhouseGases in the United States) = Annual GrossCO2 Emissions.
Step 3. Reduce Annual Gross CO2 Emissions (Step2) by 1 percent to assume 99 percent burnfactor.