carbon footprint and emergy combination for eco-environmental assessment of cleaner heat production
TRANSCRIPT

at SciVerse ScienceDirect
Journal of Cleaner Production 47 (2013) 446e456
Contents lists available
Journal of Cleaner Production
journal homepage: www.elsevier .com/locate/ jc lepro
Carbon footprint and emergy combination for eco-environmentalassessment of cleaner heat production
Nadia Jamali-Zghal a, Nana Yaw Amponsah b, Bruno Lacarriere a, Olivier Le Corre a,*,Michel Feidt c
aGEPEA, Ecoles des Mines de Nantes, CNRS, UMR 6144, FrancebHendry County Sustainable Biofuels Center, University of Florida, USAc LEMTA, ENSEM-INPL, France
a r t i c l e i n f o
Article history:Received 24 February 2012Received in revised form17 September 2012Accepted 17 September 2012Available online 26 October 2012
Keywords:Natural gasBiomassEmergyCarbon footprintEnvironmentCriterion
* Corresponding author.E-mail address: [email protected] (O. Le Co
0959-6526/$ e see front matter � 2012 Elsevier Ltd.http://dx.doi.org/10.1016/j.jclepro.2012.09.025
a b s t r a c t
The aim of this paper is to study via environmental indicators to which extent, replacing fossil fuel withbiomass for heating is an environmentally friendly solution. The environmental impact of using biomassdepends mostly on the transportation process. Authors define the notion of maximum supply distance,beyond which biomass transportation becomes too environmentally intensive compared to a fossil fuelfired heating system.
In this work a carbon footprint analysis and an emergy evaluation, has been chosen to study thesubstitution of wood for natural gas. The comparative study seeks to examine, via the two approaches, twoheating systems: one is fired with wood, transported by trucks and the other one is fired with natural gastransported by pipelines. The results are expressed in terms of maximum supply distance of wood. In theemergy evaluation it represents themaximum supply distance permittingwood to bemore emergy savingthan natural gas. In the carbon footprint analysis, it represents the maximum supply distance permittingwood to be a carbon saving alternative to natural gas. Furthermore, the unification of carbon footprint andemergy evaluation permits to define, for both approaches, the minimum theoretical wood burner first lawefficiency that allows, CO2 or emergy to be saved, when there is no wood transport. In order to identify theimpacts of the main parameters of the study a sensitivity analysis has been carried out.
Thecase study investigated in thispaper showsthat there is a largegapbetween the results. Themaximumsupply distances calculated via carbon footprint and emergy evaluation are about 5000 km and 1000 km,respectively, anthe minimum theoretical wood burner efficiencies are about 5% and 54%, respectively.
� 2012 Elsevier Ltd. All rights reserved.
1. Introduction
Global warming and declining fossil fuel reserves pushed manyresearchers to find out alternative sources of energy. Notions ofbiofuel, bioenergy and biomass are commonly used, but in realitythey can be defined in different ways. In terms of microbiology,biomass, synonym of bioorganisms, is a source for methaneproduction (Nallathambi Gunaseelan, 1997), or hydrogen produc-tion (Ji et al., 2010). In this context, biofuel or bioenergy refers tobioorganisms digestion products. From energy point of view,biomass refers to contemporary plant matter formed by photo-synthetic capture of solar energy and stored as chemical energy(Frank and Smith, 1988). As well as, Schmidt et al. (2011) consider
rre).
All rights reserved.
biomass as forest biomass and agricultural biomass. Thus, biofuel orbioenergy can be considered as a renewable source of energy, only ifthe biomass harvest is replanted in the same period as it is com-busted (Demirbas, 2005; Cowi and Gardner, 2007). This is to ensurethat biomass is maintained on one hand and on the other hand,new plants absorb, whilst growing, all CO2 emitted by combustionto keep the carbon cycle in balance. Actually, only this kind ofbiomass ensures significant amounts of bioenergy, see Al-Mansourand Zuwala (2010). The review of Saidur et al. (2011) details thedifferent applications of biomass and identifies the efficiency ofeach technical conversion. The most expanded conversion ofbiomass is combustion, which is usually used for fossil fuelsubstitution such as natural gas, coal or oil.
It should be underlined, that fossil fuels cannot be accepted asbioenergy sources since it took millions of years to transform theoriginal biomatter, near the terrestrial magma (under great pressureand constant heat). On one hand, it is not possible to produce fossil

N. Jamali-Zghal et al. / Journal of Cleaner Production 47 (2013) 446e456 447
fuel as fast as it is consumed. On the other hand, the carbonreleased by fossil fuel has been stored millions of years ago andtherefore present fossil fuel combustion is increasing the CO2content in the atmosphere.
That is why fossil fuel substitution became a great topic forresearch over the last years. The studies can be classified under fivegroup headings:
- Technical aspect which involves the improvement of theconversion systems. Stehlík (2009) details a review on tech-nologies which deal with bioenergy conversion. The cleaningof the exhaust gases is also under study (Skodras et al., 2007).
- Economic aspect which evaluates the cost-effectiveness ofusing biomass. As such, De and Assadi (2009) and McIlveen-Wright et al. (2011) have studied the financial retrofit of a co-combustion plant (coal biomass).
- Policy actions that are required to intensify the development ofbiomass in energy applications. Schmidt et al. (2011) focusedtheir work on forest biomass in association with CO2 certifi-cations. Mirata et al. (2005) worked on the concept ofdistributed economy, notably in biomass sectors.
- Criteria of sustainable biomass production. A beneficialbiomass production includes low fossil fuel use, sustainablemanagement of agriculture soils and that the biomass cropsare not in competitionwith food crops. Hence, Mizsey and Racz(2010) have challenged bio-ethanol production versus biomass(corn) combustion per hectare, on the basis of the fossil fuelrequired during the global process (from cradle to the grave).
- Analysis methodology such as LCA (Salazar and Meil, 2009;Caserini et al., 2010), carbon footprint (Holden and Høyer,2005), greenhouse gases (Poudel et al., 2012) and emergy(represents the embodied energy and can be considered as anenergy footprint of a product. The fundamentals are explainedby Odum (1996). Numerous studies have been carried out tocompare these analytical methods (Sebastián et al., 2011).Carraretto et al. (2004) studied via emergy analysis and lifecycle assessment, the environmental impact and the pros andcons of biodiesel as alternative fuel in boilers and dieselengines. Ju and Chen (2011) calculated the CO2 emissions ofa typical biodiesel production chain and assessed the ecolog-ical performance of the production chain by means ofembodied energy analysis and emergy analysis. Ulgiati andBrown (2002) evaluated the requirement for environmentalservices to dilute and abate process emissions of electricityproduction. Finally, Nilsson (1997) investigated the feasibilityof using straw as a fuel in district heating plants by usingenergy, exergy and emergy approaches.
The substitution of biofuel for fossil fuels seems to be a greatcontribution to cleaner production. Particularly, because biofuelsare considered as carbon-neutral, burning biofuels only emit backto the environment the CO2 that the plants absorbed whilstgrowing. The production and transportation process of biofuels,however, may not be carbon-neutral and that is why, it is veryimportant to assess the limitation of biofuel to be a carbon-savingsource of energy. Thus, a sustainable economic and environ-mental development of biomass is intrinsically linked to a localcollection area. Eriksson (2008) in a paper highlighted the impact ofbiomass transport on the total cost and the associated CO2 impact.A similar study has also been applied to biofuels (Von Blottnitz andCurran, 2007). In the same research area, the supply chain approachcan contribute to the development of biomass applications (Lamet al., 2010; Gold and Seuring, 2011). The substitution potential ofbiofuels can be evaluated using footprint analysis, as they areeffective methods to measure sustainability (Stöglehner, 2003).
Definitions and units of environmental, social and economic foot-prints as well as diverse tools for footprint evaluation are presentedby �Cu�cek et al. (2012).
This work seeks to identify the environmental performance ofusing wood as a substitute for natural gas for producing thermalpower of a small heating network. Contrary to natural gas thecombustion of wood is considered as carbon-neutral. So, theenvironmental performance of a wood-fired heating systemdepends mostly on the mode and distance of wood transportation.An emergy evaluation and a carbon footprint analysis (Meunier,2002) have been chosen to assess the maximum supply distanceof wood. An original emergy versus carbon footprint diagram isdefined to visualize the eco-environmental performance varyingwith the transport distance of wood. In the second part, a unifica-tion of the emergy evaluation and carbon footprint has beenproposed. In the third and last part, a sensitivity analysis has beenperformed to determine the influence of different parameters onthe maximum supply distances, calculated via the two approaches.
2. Methodology
A simplified heat production process includes heat production,fuel transportation, labor and services. To investigate properly theenvironmental impact and eco-efficiency of heat production, it isessential to specify the heat consumption, the performance of theheating system, the properties of the fuel, the modes of transportused for fuel supply (for example, coal can be transported by rail,wood by trucks and natural gas by pipelines, it is also possible tocombine different modes of transport) and the labor and servicesrequired during the process.
The first law efficiency of the heating system has a significantimpact on fuel use, since high efficiency reduces fuel consumptionrequired to meet heating demand. A special care should be taken inchoosing the type and quality of fuel, since the fuel consumptionand the associated environmental impacts depend on the proper-ties of the fuel. More especially renewable and fossil fuels must beclearly distinguished. It is also crucial to identify the means oftransport, the sources of energy and the distance crossed to deliverthe fuel. Finally, the environmental impairments of all labor andservices needed during the process have to be taken into account.
A carbon footprint analysis and an emergy evaluation have beenused to realize the eco-environmental quality assessment of twoheating systems. These two environmental indicators have beenchosen to cover all relevant aspects of the heat production processthat may have an environmental impact. Carbon footprint analysispermits to measure the effect on the climate, in terms of theamount of CO2 emitted during heat production, while the emergyevaluation accounts for all forms of energy and resources used inthe process. Furthermore, the two approaches may be consideredas complementing each other and a unification of the two indica-tors is envisaged. The results of the comparative study dependmainly on the following parameters (see Fig. 1):
- The heat consumption Qth
- The first law efficiency of the heating system hb- The low heating value of the fuel LHVf
- The fuel consumption Qf- The supply distance of fuel D- The energy needed for fuel transportation Qe- And the energy consumed for labor and services Ql&s
For obtaining meaningful and significant results, it is veryimportant to define the framework of the comparative study suchas the time horizon and the boundaries of the heat productionprocess.

Fig. 1. Simplified process diagram of heat production.
N. Jamali-Zghal et al. / Journal of Cleaner Production 47 (2013) 446e456448
3. Case study
This paper proposes a comparative study between a wood-firedheating system and a natural gas fired heating system. The aim is toidentify the environmental performance and eco-efficiency ofusing biomass as a substitute for fossil fuels for heat production. Asa concrete example, the ecological sustainability of a projectlaunched in 2010 has been analyzed, which consists of buildinga central wood-fired heating plant in the district of Chantrerie(Nantes-France). The aim is to replace local natural gas heatingunits, in total, 25 natural gas boilers providing the space heating offive establishments (four institutions of higher education anda laboratory for veterinary tests) covering an area of 120 000 m2,which corresponds to an annual thermal consumption of aboutQth ¼ 42 800 GJth (average annual heat consumption of the campusover the past five years).
To provide a consistent basis for comparing the two heatingsystems, the same steps of heat production have been considered toassess the eco-environmental performance of each of them. In thecalculations, the construction of the two plants and maintenancework on the two heating systems are not taken into account.However the fuel production and transportation, labor and servicesrequired to operate each of the two heating systems have beenaccounted for. In the case of the natural gas fired heating system,the boiler is directly supplied by pipelines and there is no signifi-cant labor or services required to make the automatic systemwork.In the case of the wood-fired heating system, the wood is trans-ported by trucks. Human labor is needed for wood supply, ashcollection and functioning of the boiler. The system diagram andthe CO2 emissions of heat production via both a natural gas heatingunit and a wood-fired heating plant are detailed, respectively, inFigs. 2 and 3.
It has to bementioned that upstream emission factors have beenused to estimate the CO2 emissions of production and trans-portation for both diesel and natural gas. Wood combustion cannotbe considered as carbon-neutral unless the overall stock of forest ismaintained. Thus an upstream emission factor of wood has beenused to calculate the CO2 emissions of producing controlled forestbiomass. The same approach has been applied in choosing thetransformities for the emergy evaluation.
Fig. 2. System diagram of heat production via a natural gas heating system.
3.1. Model
In the general case, the annual fuel consumption qf [kg] ofa boiler is given by:
qf ¼ QthLHVf � hb
(1)
where Qth [MJ] is the average annual heat consumption, LHVf [MJ/kg] is the low heating value of the fuel and hb is the first law effi-ciency of the boiler.
In the case of a wood boiler, the low heating value of wood atconstant pressure LHVw is given by the equation (Telmo andLousada, 2011):
LHVw ¼ LHVwð0%Þ � ð100�MÞ100
� 0:02443�M (2)
where LHVw(0%) is the low heating value of dry wood (moisture-free) and M is the moisture content of wood.
Thus, the annual wood consumption of the boiler qw [kg] is:
qw ¼ 100� QthðLHVwð0%Þ � ð100�MÞ � 2:443�MÞ � hw
(3)
where hw is the first law efficiency of the wood boiler.In the case of natural gas boiler, the annual natural gas
consumption Qng [MJ] is given by:
Qng ¼ Qthhng
(4)
where hng is the first law efficiency of the natural gas boiler.
3.1.1. Carbon footprint analysisThe carbon footprint analysis permits to quantify all the CO2
emissions of the natural gas and wood fueled heating systems.
- The annual CO2 emission of the natural gas fueled heatingsystem COng b
2 [kgCO2] is given by:
COng b2 ¼ Qng �
�EFup ng þ EFcomb ng
�(5)
where EFup_ng is the upstream emission factor and EFcomb_ng is thecombustion emission factor of natural gas and Qng [MJ] is theannual consumption of natural gas.
- The annual CO2 emission of the wood fueled heating systemCOw b
2 [kgCO2] is given by:
COw b2 ¼ COw tr
2 þ COa tr2 þ COe tr
2 þ COw up2 (6)
where COw tr2 [kg CO2] is the CO2 emissions of wood transportation,
COa tr2 [kg CO2] is the CO2 emissions of ash collection, COe tr
2[kg CO2] is the CO2 emissions of the home-to-work travel of theemployees and COw up
2 [kg CO2] is the upstream emissions of wood.

Fig. 3. System diagram of heat production via a wood-fired heating system.
N. Jamali-Zghal et al. / Journal of Cleaner Production 47 (2013) 446e456 449
COw tr2 ¼ND�D� EFup dþEFcomb d � 3�MCO2
MC�FCw�ð1þgwÞ
� �(7)
COa tr2 ¼NC�d��EFup dþEFcomb d
�� 3�MCO2
MC�FCa�ð1þgaÞ
(8)
COe tr2 ¼ De �
�EFup d þ EFcomb d
� � 3�MCO2
MC� FCv (9)
COw up2 ¼ qw � LHVw � EFw up (10)
where ND is the number of wood deliveries during the heatingperiod (ND ¼ qw=C
w trmax , C
w trmax is the load capacity of the truck used
for wood delivery), D [km] is the transport distance of wood, EFup_dis the upstream emission factor of diesel, EFcomb_d is the combus-tion emission factor of diesel, ε is the oxidation factor, MCO2
=MC isthe ratio of the molecular weight of CO2 to the molecular weight ofcarbon, the ratio of average fuel consumption of the truck used forwood supply without charge FCw0 to average fuel consumption ofthe truck with charge FCw is gw ¼ FCw0=FCw, NC is the number ofash collection (NC ¼ a� qw=C
a trmax, a is the ash content and Ca tr
max isthe load capacity of the truck used for ash collection), d is thedistance crossed by the trucks to remove ash, FCa is the fuelconsumption of the truck used for ash collection,ga ¼ FCa0=FCa isthe ratio of average fuel consumption of the truck used for ashcollection with charge FCa0 to average fuel consumption of the
truck charge FCa, De is the annual distance travelled by theemployees to get to work and back again, FCv is the fuelconsumption of a passenger car and EFw_up is the upstream emis-sion factor of wood. The upstream and combustion emission factorsof natural gas, diesel and wood are given in Table 2.
The carbon saving performance of the wood fueled heatingsystem depends on the supply distance of wood and the loadcapacity of the truck. Hence, for a fixed load capacity Cw tr
max , themaximum transport distance Dcf
max allowing wood to be a carbonsaving alternative to natural gas is given by:
COng b2 ¼ COw b
2
�Dcfmax
�(11)
Thus, according to Eqs. (5) and (6):
Dcfmax¼
COngb2 �COa tr
2 �COe tr2 �COwup
2
ND��EFupdþEFcombd�� 3�MCO2
MC�FCw�ð1þgwÞ
(12)
3.1.2. Emergy evaluationThe emergy evaluation permits to assess the emergy flow of the
natural gas and wood fueled heating systems.
- The annual emergy flow of the natural gas fueled heatingsystem Eng_b [sej] is given by:

Table 1Parameters of the study.
Definition Item Unit Amount Ref.
Load capacity of truck(ash collection)
Ca trmax kg 7Eþ3 (Shunping
et al., 2010)Load capacity of truck
(wood delivery)Cw trmax kg 2Eþ3
� 50Eþ3(Shunpinget al., 2010)
Annual distancetravelled by the a
De km 13.2Eþ3 [e]
Crossed distance toremove ash
d km 50 [e]
Fuel consumption ofpassenger car
FCv L/km 0.092 (Shunpinget al., 2010)
Fuel consumption oftruck (wood delivery)
FCw L/km 0.168e0.318 (Shunpinget al., 2010)
Fuel consumption oftruck (ash collection)
FCa L/km 0.242 (Shunpinget al., 2010)
Average annual heatconsumption
Qth MJ 42.8Eþ6 Appendix A
Exergy of the producedheat
Exth MJ 8.25Eþ6 Appendix A
Low heating valueof diesel
LHVd MJ/L 36.5 (Yao et al.,2010)
Low heating value of drywood
LHVw
(0%)MJ/kg 19 (EPA, 2011)
Low heating valueof wood
LHVw MJ/kg 9.3e13.6 Appendix A
Moisture content of wood M w% 0.25e0.45 Appendix ARatio of molecular weight
of CO2 to the molecularweight of carbon
MCO2=MC [e] 44/12 (EPA, 2005)
Annual consumption ofnatural gas
Qng J 5.2Eþ13 Appendix A
Ash content of wood a [e] 0.02 Appendix ARatio of fuel consumption
of emptytruck to loaded truck(ash collection)
ga [e] 0.75 [e]
Ratio of fuel consumptionof empty truck to loadedtruck (wood delivery)
gw [e] 0.75 [e]
Oxidation factor of diesel ε [e] 0.99 (EPA, 2005)Efficiency of the
wood boilerhw [e] 0.5e0.75 Appendix A
Efficiency of the naturalgas boiler
hng [e] 0.82 Appendix A
Number of hours workedby the employeesb
hw h 5280 [e]
a 5.5 Full Time Employees, 6 months heating period, average daily work commuteof 20 km: De ¼ 5.5 � 6 � 20 � 20 ¼ 13.2Eþ3 km.
b 5.5 Full Time Employees, 6 months heating period, the number of hours workedby the employees: hw ¼ 5.5 � 6 � 20 � 8 ¼ 5270 h.
N. Jamali-Zghal et al. / Journal of Cleaner Production 47 (2013) 446e456450
Eng b ¼ Qng ��sng þ sng tr
�(13)
Table 3Solar transformities.
Item Unit Solar transformity(sej/unit) aBaseline15.2Eþ24sej/yr
Deductedfrom: Ref.
Wood biomass J 5.62Eþ4 (Odum, 1996)Natural gas J 7.73Eþ4 (Odum, 1996)Transport of
natural gasbJ 1.74Eþ4 (Romitelli, 1999)
where sng is the solar transformity of natural gas, sng_tr is the solartransformity of natural gas transport.
- The annual emergy flow of the wood fueled heating systemEw_b [sej] is given by:
Ew b ¼ Ew þ Ew tr þ Ea tr þ Ee tr þ Ehl (14)
Diesel J 1.07Eþ05 (Odum et al., 2000)
Table 2Emission factors.
Item Unit Amount Ref.
EFup_ng [kg CO2/MJ] 0.01 (ADEME, 2010)EFcomb_ng [kg CO2/MJ] 0.05 (ADEME, 2010)EFup_d [kg C/L] 0.08 (ADEME, 2010)EFcomb_d [kg C/L] 0.73 (ADEME, 2010)EFw_up [kg CO2/MJ] 0.0036 (ADEME, 2010)
where Ew [sej] is the emergy flow of wood, Ew_tr [sej] is the emergyflow of wood transportation, Ea_tr [sej] is the emergy flow of ashcollection, Ee_tr [sej] is the emergy flow of the home-to-work travelof the employees and Ehl is the emergy flow of human labor [sej].
Ew ¼ qw � LHVw � sw (15)
Ew tr ¼ ND� D� LHVd � sd � FCw � ð1þ gwÞ (16)
Ea tr ¼ NC� d� LHVd � sd � FCa � ð1þ gaÞ (17)
Ee tr ¼ De � LHVd � sd � FCv (18)
Ehl ¼ hw � shl (19)
where, sw is the solar transformity of wood, LHVd is the low heatingvalue of diesel, sd is the solar transformity of diesel, shl is the solartransformity of human labor and hw is the number of hours workedby the employees. The solar transformities of natural gas, natural gastransportation, wood, diesel and human labor are listed in Table 3.
From the emergy point of view, using wood as fuel is lessenvironmentally intensive than natural gas when the emergy flowof the natural gas fueled heating system Eng_b is greater than theemergy flow of the wood fueled heating system Ew_b. As Ew_b
depends on the distance crossed by the trucks which supply theboiler with wood, for a fixed load capacity Cw tr
max , the maximumpossible supply distance DE
max permitting wood fuel to be emergysaving compared to natural gas is given by:
Eng b ¼ Ew b
�DEmax
�(20)
Thus, according to Eqs. (13) and (14):
DEmax ¼ Eng b � Ew � Ea tr � Ee tr � Ehl
ND� LHVd � sd � FCw � ð1þ gwÞ (21)
3.2. Discussion
In Table 1, the load capacity of the trucks for wood delivery Cw trmax ,
the corresponding fuel consumption FCw, the low heating value ofwood LHVw, the moisture content of wood M and the efficiency ofthe wood boiler hw have been defined in value ranges, whichpermits to realize the sensitivity analysis of these parameters (formore details see Appendix A). In addition, it should be pointed outthat LHVw, M and hw are related in Eq. (3) and that the fuelconsumption varies with the load capacity of the truck.
Human laborb,c h 8.58Eþ13 (Odum, 1996)
a Baseline calculated by Brown and Ulgiati (2010).b Different methods exist to calculate transformities of labor and services, notably
by using the emergy/money ratio (see Sweeney et al., 2007). In this work, authorsused transformities of labor and services which refer to Brazil and the United Statesbecause they consider that their economic and technologic levels in this sector aresimilar to those in France.
c Human labor: ((1 � 131Eþ16 sej/ind/yr þ 4.5 � 28Eþ16 sej/ind/yr)/5,5)/(24 � 365) ¼ 5,33Eþ13 sej/h, 5.5 Full Time Employees: 1 Post collegeþ 4,5 Collegegrad.
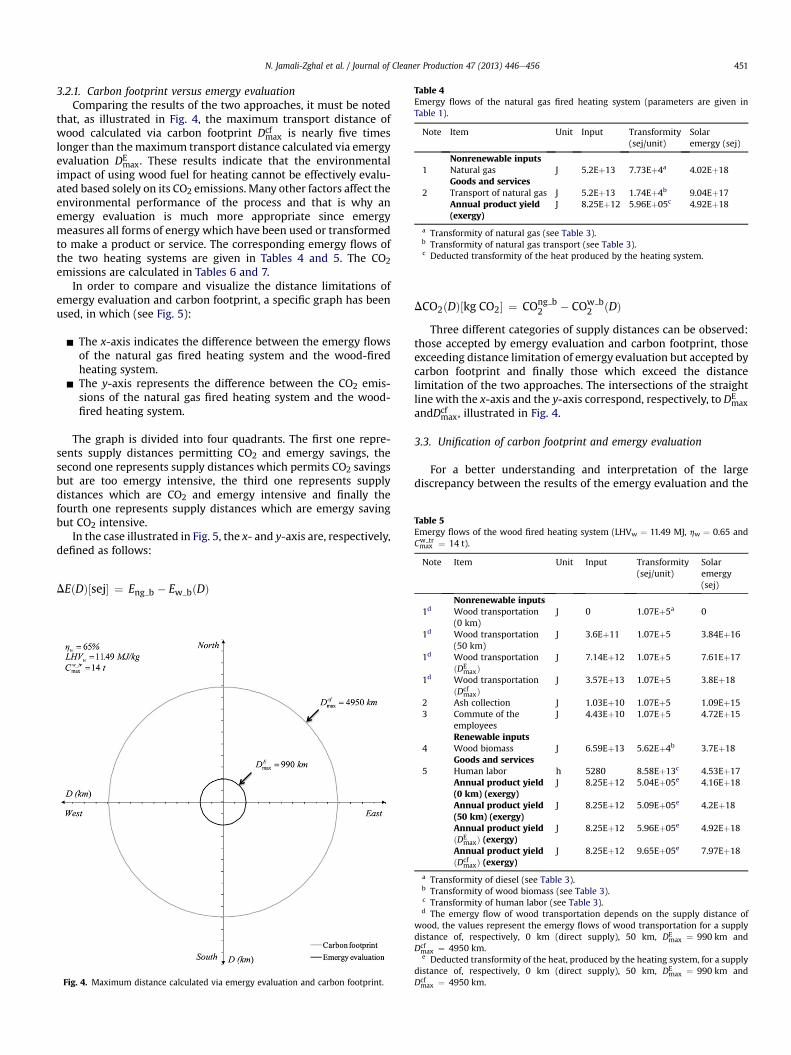
Table 4Emergy flows of the natural gas fired heating system (parameters are given inTable 1).
Note Item Unit Input Transformity(sej/unit)
Solaremergy (sej)
Nonrenewable inputs1 Natural gas J 5.2Eþ13 7.73Eþ4a 4.02Eþ18
Goods and services2 Transport of natural gas J 5.2Eþ13 1.74Eþ4b 9.04Eþ17
Annual product yield(exergy)
J 8.25Eþ12 5.96Eþ05c 4.92Eþ18
a Transformity of natural gas (see Table 3).b Transformity of natural gas transport (see Table 3).c Deducted transformity of the heat produced by the heating system.
Table 5Emergy flows of the wood fired heating system (LHVw ¼ 11.49 MJ, hw ¼ 0.65 andCw trmax ¼ 14 t).
Note Item Unit Input Transformity(sej/unit)
Solaremergy(sej)
Nonrenewable inputs1d Wood transportation J 0 1.07Eþ5a 0
N. Jamali-Zghal et al. / Journal of Cleaner Production 47 (2013) 446e456 451
3.2.1. Carbon footprint versus emergy evaluationComparing the results of the two approaches, it must be noted
that, as illustrated in Fig. 4, the maximum transport distance ofwood calculated via carbon footprint Dcf
max is nearly five timeslonger than themaximum transport distance calculated via emergyevaluation DE
max. These results indicate that the environmentalimpact of using wood fuel for heating cannot be effectively evalu-ated based solely on its CO2 emissions. Many other factors affect theenvironmental performance of the process and that is why anemergy evaluation is much more appropriate since emergymeasures all forms of energy which have been used or transformedto make a product or service. The corresponding emergy flows ofthe two heating systems are given in Tables 4 and 5. The CO2emissions are calculated in Tables 6 and 7.
In order to compare and visualize the distance limitations ofemergy evaluation and carbon footprint, a specific graph has beenused, in which (see Fig. 5):
- The x-axis indicates the difference between the emergy flowsof the natural gas fired heating system and the wood-firedheating system.
- The y-axis represents the difference between the CO2 emis-sions of the natural gas fired heating system and the wood-fired heating system.
The graph is divided into four quadrants. The first one repre-sents supply distances permitting CO2 and emergy savings, thesecond one represents supply distances which permits CO2 savingsbut are too emergy intensive, the third one represents supplydistances which are CO2 and emergy intensive and finally thefourth one represents supply distances which are emergy savingbut CO2 intensive.
In the case illustrated in Fig. 5, the x- and y-axis are, respectively,defined as follows:
DEðDÞ½sej� ¼ Eng b � Ew bðDÞ
Fig. 4. Maximum distance calculated via emergy evaluation and carbon footprint.
DCO2ðDÞ½kg CO2� ¼ COng b2 � COw b
2 ðDÞThree different categories of supply distances can be observed:
those accepted by emergy evaluation and carbon footprint, thoseexceeding distance limitation of emergy evaluation but accepted bycarbon footprint and finally those which exceed the distancelimitation of the two approaches. The intersections of the straightline with the x-axis and the y-axis correspond, respectively, to DE
maxandDcf
max, illustrated in Fig. 4.
3.3. Unification of carbon footprint and emergy evaluation
For a better understanding and interpretation of the largediscrepancy between the results of the emergy evaluation and the
(0 km)1d Wood transportation
(50 km)J 3.6Eþ11 1.07Eþ5 3.84Eþ16
1d Wood transportationðDE
maxÞJ 7.14Eþ12 1.07Eþ5 7.61Eþ17
1d Wood transportationðDcf
maxÞJ 3.57Eþ13 1.07Eþ5 3.8Eþ18
2 Ash collection J 1.03Eþ10 1.07Eþ5 1.09Eþ153 Commute of the
employeesJ 4.43Eþ10 1.07Eþ5 4.72Eþ15
Renewable inputs4 Wood biomass J 6.59Eþ13 5.62Eþ4b 3.7Eþ18
Goods and services5 Human labor h 5280 8.58Eþ13c 4.53Eþ17
Annual product yield(0 km) (exergy)
J 8.25Eþ12 5.04Eþ05e 4.16Eþ18
Annual product yield(50 km) (exergy)
J 8.25Eþ12 5.09Eþ05e 4.2Eþ18
Annual product yieldðDE
maxÞ (exergy)J 8.25Eþ12 5.96Eþ05e 4.92Eþ18
Annual product yieldðDcf
maxÞ (exergy)J 8.25Eþ12 9.65Eþ05e 7.97Eþ18
a Transformity of diesel (see Table 3).b Transformity of wood biomass (see Table 3).c Transformity of human labor (see Table 3).d The emergy flow of wood transportation depends on the supply distance of
wood, the values represent the emergy flows of wood transportation for a supplydistance of, respectively, 0 km (direct supply), 50 km, DE
max ¼ 990 km andDcfmax ¼ 4950 km.e Deducted transformity of the heat, produced by the heating system, for a supply
distance of, respectively, 0 km (direct supply), 50 km, DEmax ¼ 990 km and
Dcfmax ¼ 4950 km.

Fig. 5. Eco-environmental performance varying with supply distances.
Table 6CO2 emissions from the natural gas fired heating system (parameters are given inTable 1).
Note Item Unit Input Emissionfactor(kgCO2/unit)
CO2 emission(kgCO2)
Nonrenewableinputs
1 Natural gas J 5.2Eþ13 5E�8a 2.60Eþ06Goods andservices
2 Transport ofnatural gas
J 5.2Eþ13 1E�8b 5.20Eþ05
Annual productyield (exergy)
8.25Eþ12 3.78E�07c 3.12Eþ06
a Emission factor of natural gas combustion (see Table 2).b Upstream emission factor of natural gas (see Table 2).c Deducted emission factor of the heating system.
N. Jamali-Zghal et al. / Journal of Cleaner Production 47 (2013) 446e456452
carbon footprint, the possibility of a relationship between the twoapproaches has been investigated.
According to Eqs. (12) and (21) the distance ratio DEmax=D
cfmax can
be expressed as:
DEmax
Dcfmax
¼ K � hw � hEmin
hw � hcfmin
!(22)
where K,hEmin and hcfmin are defined as follows:
K ¼�EFup d þ EFcomb d
�� 3�MCO2
MCLHVd � sd
;
hEmin ¼Qth�
�a
Ca trmax�LHVw
�d�LHVd�sd�FCa�ð1þgaÞþsw�
�Eng b�Ee tr�Ehl
�and
hcfmin ¼Qth��
a
Ca trmax�LHVw
�d��EFup dþEFcomb d�� 3
�
�MCO2MC�FCa�ð1þgaÞþEFwup�
COng b2 �COe tr
2
�
Table 7CO2 emissions from the wood fired heating system (LHVw ¼ 11.49 MJ, hw ¼ 0.65 and Cw
m
Note Item Unit
Nonrenewable inputs1c Wood transportation (0 km) L1c Wood transportation (50 km) L1c Wood transportation ðDE
maxÞ L1c Wood transportation ðDcf
maxÞ L2 Ash collection L3 Commute of the employees L
Renewable inputs4 Wood biomass J
cAnnual product yield (0 km) (exergy) JcAnnual product yield (50 km) (exergy) JcAnnual product yield ðDE
maxÞ (exergy) JcAnnual product yield ðDcf
maxÞ (exergy) J
a Emission factor of diesel per [kgCO2/L].b Upstream emission factor of wood biomass (see Table 2).c The CO2 emissions of wood transportation depend on the supply distance of wood, th
respectively, 0 km (direct supply), 50 km, DEmax ¼ 990 km and Dcf
max ¼ 4950 km.d Deducted emission factor of the heating system, for a supply distance of, respectivel
It can be seen that, in the case of this study, the ratio DEmax=D
cfmax
varies only with the low heating value of wood LHVw and theefficiency of the wood boiler hw, since all the other parameters arefixed. This means that the ratio DE
max=Dcfmax is constant for any wood
fired heating system where the efficiency of the boiler hw and thelow heating value of the wood LHVw are given. In addition, itpermits to deduce directly Dcf
max from DEmax and vice versa (see
Fig. 6). This points to the fact that the carbon footprint method canbe considered as a part of emergy evaluation method, since it onlymeasures the CO2 emissions of the systemwhile emergy evaluationconsiders all the energy required directly and indirectly by thesystem.
Furthermore, it should be noticed that for a wood boiler effi-ciency hw lower than hEmin, D
Emax becomes negative. It means that
from an emergy point of view, substitution of wood for natural gasis no longer sustainable. Similarly, for a wood boiler efficiency hw
trax ¼ 14 t).
Input Emission factor(kg CO2/unit)
CO2 emission (kg CO2)
0 2.94a 09.88Eþ03 2.94 2.91Eþ041.96Eþ05 2.94 5.75Eþ059.79Eþ05 2.94 2.88Eþ062.82Eþ02 2.94 8.28Eþ021.21Eþ03 2.94 3.57Eþ03
6.59Eþ13 3.6E�9b 2.37Eþ058.25Eþ12 2.93E�08d 2.41Eþ058.25Eþ12 3.28E�08d 2.71Eþ058.25Eþ12 9.90E�08d 8.17Eþ058.25Eþ12 3.78E�07d 3.12Eþ06
e values represent the CO2 emissions of wood transportation for a supply distance of,
y, 0 km (direct supply), 50 km, DEmax ¼ 990 km and Dcf
max ¼ 4950 km.

Fig. 8. Maximum distances varying with low heating value of wood.Fig. 6. The distance ratio varying with the efficiency of the wood boiler.
N. Jamali-Zghal et al. / Journal of Cleaner Production 47 (2013) 446e456 453
lower than hcfmin, Dcfmax becomes negative and hence, substitution of
wood for natural gas is no longer carbon saving.
3.4. Sensitivity analysis
The following sensitivity analysis consists of identifying theimpacts of different parameters such as the efficiency of the woodboiler, the lowheatingvalueofwood, the load capacity of trucks usedto transport wood and finally the distance crossed to remove ash.
3.4.1. Impact of wood boiler efficiencyAccording to Eqs. (12) and (21), for a fixed load capacity Cw tr
maxand low heating value of wood LHVw the variation ofDcf
max and DEmax
with the wood boiler efficiency are given by:
vDcfmax
vhw¼ COngb
2 �COetr2
Qth
Cwtrmax�LHVw
��EFupdþEFcombd�� 3�MCO2
MC
�FCw�ð1þgwÞ (23)
Fig. 7. Maximum distances varying with efficiency of wood burner.
vDEmax
vhw¼ Eng b � Ee tr � Ehl
Qth
Cw trmax � LHVw
� LHVd � sd � FCw � ð1þ gwÞ(24)
Since vDcfmax=vhw and vDE
max=vhw are positive constants, themaximum distances Dcf
max and DEmax are, as illustrated in Fig. 7,
linear increasing functions of wood burner efficiency. According toEq. (1), the higher the efficiency of the burner the lower the woodconsumption to provide heat demands for the campus and there-with greater distances are acceptable for wood supply. The inter-section of the x-axis with the line of maximum supply distancescalculated via emergy evaluation represents the minimum theo-retical wood burner efficiency hEmin that allows emergy to be saved.
3.4.2. Impacts of low heating value of woodAccording to Eqs. (12) and (21), for a fixed load capacity Cw tr
maxand wood boiler efficiency hw the variation of Dcf
max and DEmax as
a function of low heating value of wood are given by:
vDcfmax
vLHVw¼
COngb2 �COetr
2 �Qth�EFwup
hwQth
Cwtrmax�hw
*�EFupdþEFcombd
�� 3�MCO2
MC�FCw�ð1þgwÞ
(25)
vDEmax
vLHVw¼
Eng b � Ee tr � Ehl �Qth � sw
hwQth
Cw trmax � hw
� LHVd � sd*FCw � ð1þ gwÞ
(26)
Since vDcfmax=vLHVw and vDE
max=vLHVw are positive constants,the maximum distances Dcf
max and DEmax are, as shown in Fig. 8,
linear increasing functions of low heating value of wood. In reality,as shown in Eq. (2), high moisture content of wood M lowers theheat value LHVw and hence a higher quantity of wood is needed toprovide the heat demand. The rise of wood consumption impliesa higher number of wood deliveries ND and shorter acceptablesupply distances of wood.

Fig. 9. Maximum distances varying with load capacity of trucks.
Table 9Relative errors of transformities.
Relative error Value
ssng 6.46E�01ssd 9.16E�02ssw 4.86E�01sshl 5.95E�02
N. Jamali-Zghal et al. / Journal of Cleaner Production 47 (2013) 446e456454
3.4.3. Impacts of load capacity of trucksFor a givenwood consumption, the increase of Cw tr
max reduces thenumber of wood deliveries ND and according to Eqs. (12) and (21),greater distances for supplying the burner with wood are possible.Thus, as shown in Fig. 9, themaximum accepted supply distances ofwood, Dcf
max and DEmax increase with the load capacity of truck Cw tr
max .
3.4.4. Impact of distance crossed to remove ashThe ash quantity during the heating period is negligible
compared to the wood consumption Qw of the burner (a is about2%), that is why the distance crossed to remove ash does not affectconsiderably the calculation of acceptable wood supply distancesDcfmax andDE
max.
3.4.5. Uncertainty analysis of emission factors and transformitiesEmission factors and transformities are very sensitive to several
factors (time, region, resources, production process, utilization.)and it is quite difficult to find out the appropriate value that has tobe used. That is why the relative error for 10% of change of all theemission factors and transformities, used in this work, has beencalculated, see Tables 8 and 9.
The relative error is defined as:
sx ¼ DDD0
¼
����vDvx � ðx� x0Þ����
D0
with:
8<:
x˛EFi; sj
; i ¼ fNatural gas;wood;dieselg;j ¼ fNatural gas;wood;diesel;human laborg
x� x0 ¼ 10%� x0
Table 8Relative errors of emission factors.
Relative error Value
sEFng 1.08E�01sEFd 9.10E�02sEFw 8.24E�03
It can be noticed that for coherent results of carbon footprintanalysis the emission factors of fossil fuel should be carefullychosen, as they are important CO2 creators. To realize a meaningfulemergy evaluation special care must be taken in choosing thetransformities of the fuel used for heat production, whether fossilfuel or biomass.
4. Conclusion
This paper discusses the feasibility conditions of using biomassas a substitute for fossil fuel. Authors used a carbon footprintanalysis and emergy evaluation to assess the maximum supplydistance of biomass that permits biomass to be, according to theapproach, a CO2 or emergy saving alternative to fossil fuel.
As the emergy evaluation takes into account both the impact offossil fuel as well as carbon footprint, the unification of the twoapproaches has been applied. This permits to define, for each of thetwo approaches, the minimum theoretical wood burner efficiencythat allow, according to the approach, CO2 or emergy saving, whenthere is no wood transport (the wood burner is constructed in theforest). In addition, it permits to relate, for any wood boiler withknown characteristics, the maximum acceptable supply distancesof the two approaches Dcf
max and DEmax. This makes it possible to
deduce the maximum supply distance of one approach from theother.
In the case study, a project launched in 2010 has been analyzed,which consists of building a central wood-fired heating plant inthe zone of Chantrerie (Nantes-France), to replace local naturalgas heating units. The results show that the maximum supplydistance and the minimum theoretical wood burner first lowefficiency calculated via carbon footprint are, respectively, about5000 km and 5%. Whereas the maximum supply distance and theminimum theoretical wood burner first low efficiency calculatedvia emergy evaluation, are about 1000 km and 54%. These resultsdo not surprise because contrary to carbon footprint, whichmeasures only the CO2 emissions of the process, the emergyconcept is based on the principle of memorizing all the availableenergy that has been required directly or indirectly to makea product or service.
The sensitivity analysis reveals that the eco-environmentalefficiency of wood as a substitute for natural gas depends mainlyon the performance of the heating system (efficiency of the woodboiler), the quality of wood (moisture content of wood) and the fuelconsumption of the trucks transporting the wood. The uncertaintyanalysis of the emission factors and transformities indicates thatspecial care should be taken in choosing the emission factors offossil fuels (in this case natural gas and diesel) and the trans-formities of the fuels used to fire the heating system (whether it isfossil fuel or biomass).
The methodology proposed in this paper is appropriate to studythe environmental impacts of all types of fossil fuel substitution bybiomass. For finer judgments, however, one must not lose sight ofthe generic advantages and disadvantages of using biomass insteadof fossil fuels. Biomass represents a locally produced inexhaustiblesource of energy, emphasizing job creation and permitting

Table A.2Parameters of the wood fired heating system.
Definition Item Unit Amount
Low heating value of wood LHVw MJ/kg 11.5Moisture content of wood M w% 35Ash content of wood a e 0.02Global efficiency of the
heating systemhw e 0.65
Social impact e e 5.5 Full TimeEmployeea
a 1 Post collegeþ 4,5 College grad.
N. Jamali-Zghal et al. / Journal of Cleaner Production 47 (2013) 446e456 455
countries to reduce their fossil fuel dependency. Unfortunately, theproduction of biomass is quite costly and energy intensive,requiring large agricultural areas. Besides its complicated produc-tion conditions, until now, the energy efficiency of processes usingbiomass is generally lower than those using fossil fuels.
Appendix A
The following figure describes the average thermal need of thefive establishments varying with seasons. It represents an annualthermal consumption of about Qth ¼ 42 800 GJth. These results arebased on the real heat consumption of the five establishments overthe past five years.
Fig. A.1. Average thermal need.
- Natural gas fired heating system: The heating of the fiveestablishments is provided by 25 natural gas boilers witha thermal capacity of 13 MWth, distributed over 13 boilerrooms. For each establishment, the annual heating need andthe natural gas consumption of the last five years have beenstudied to identify the average heat consumption and theglobal efficiency of the heating system (see Table A.1).
- Wood fired heating system: Awood fueled boiler was installedto replace the natural gas heating system. The boiler is con-nected to a heating network, which transports the heat to thebuildings by 3 km long pipes and 13 distribution stations. Theboiler consumes about 3900 tons of wood per year (50% woodwaste from sawmills and 50% wood chips). The characteristicsof the boiler and the used fuel (see Table A.2) have been thebasis for the sensitivity analysis of this paper.
Table A.1Parameters of the natural gas fired heating system.
Definition Item Unit Amount
Average annual heatconsumption
Qth MJ 42.8Eþ6
Exergy of produced heata Exth MJ 8.25Eþ6Average annual natural
gas consumptionQng MJ 5.2Eþ7
Global efficiency of theheating system
hng e 0.82
a The total heat production of the system is about 4.28Eþ13 J, using a Carnotefficiency of 0.19 (ambient temperature is 20 �C and temperature of hot water is90 �C) the exergy of the produced heat is 8.25Eþ12 J.
References
ADEME (Agence de l’environnement et de la maîtrise de l’énergie), Ministry of envi-ronment and energy, 2010. Emission Factor Guide (accessed 27.01.12). <http://www.associationbilancarbone.fr/le-bilan-carbone%C2%AE/telechargements>.
Al-Mansour, F., Zuwala, J., 2010. An evaluation of biomass co-firing in Europe.Biomass and Bioenergy 34, 620e629.
Brown, M.T., Ulgiati, S., 2010. Updated evaluation of exergy and emergy driving thegeobiosphere: a review and refinement of the emergy baseline. EcologicalModelling 221, 2501e2508.
Carraretto, C., Macor, A., Mirandola, A., Stoppato, A., Tonon, S., 2004. Biodiesel as alter-native fuel: experimental analysis and energetic evaluations. Energy 29, 2195e2211.
Caserini, S., Livio, S., Giugliano, M., Grosso, M., Rigamonti, L., 2010. LCA of domesticand centralized biomass combustion: the case of Lombardy (Italy). Biomass andBioenergy 34, 474e482.
Cowi, A.L., Gardner, W.D., 2007. Competition for the biomass resource: greenhouseimpacts and implications for renewable energy incentive schemes. Biomass andBioenergy 31, 601e607.
De, S., Assadi, M., 2009. Impact of cofiring biomass with coal in power plants ea techno-economic assessment. Biomass and Bioenergy 33, 283e293.
Demirbas, A., 2005. Potential applications of renewable energy sources, biomasscombustion problems in boiler power systems and combustion related envi-ronmental issues. Progress in Energy and Combustion Science 31, 171e192.
EPA, U.S. Environmental Protection Agency, 2005. Emission Facts, Average CO2Emissions Resulting from Gasoline and Diesel Fuel. EPA, U.S. EnvironmentalProtection Agency.
EPA, U.S. Environmental Protection Agency, 2011. Material Characterization Paper,Final Rulemaking: Identification of Nonhazardous Secondary Materials that areSolid Waste, Traditional Fuels and Key Derivatives. EPA, U.S. EnvironmentalProtection Agency.
Eriksson, L.N., 2008. Comparative analyses of forest fuels in a life cycle perspectivewith a focus on transport systems resources. Conservation and Recycling 52,1190e1197.
Frank, J.R., Smith, W.H., 1988. Introduction to methane from biomass: a systemsapproach. In: Smith, W.H., Frank, J.R. (Eds.), Methane from Biomass. A SystemsApproach. Elsevier Applied Science, London, UK.
Gold, S., Seuring, S., 2011. Supply chain and logistics issues of bio- energy produc-tion. Journal of Cleaner Production 19, 32e42.
Holden, E., Høyer, K.G., 2005. The ecological footprints of fuels. TransportationResearch Part D 10, 395e403.
Ji, C.F., Legrand, J., Pruvost, J., Chen, Z.A., Zhang, W., 2010. Characterization ofhydrogen production by Platymonas subcordiformis in torus photobioreactor.International Journal of Hydrogen Energy 35, 7200e7205.
Ju, L.P., Chen, B., 2011. Embodied energy and emergy evaluation of a typical bio-diesel production chain in China. Ecological Modelling 222, 2385e2392.
Lam, H.L., Varbanov, P., Klemes, J., 2010. Minimising carbon footprint of regionalbiomass supply chains. Resources, Conservation and Recycling 54, 303e309.
McIlveen-Wright, D.R., Huang, Y., Rezvani, S., Mondol, J.D., Redpath, D.,Anderson, M., Hewitt, N.J., Williams, B.C., 2011. A techno-economic assessmentof the reduction of carbon dioxide emissions through the use of biomass co-combustion. Fuel 90, 11e18.
Meunier, F., 2002. Co- and tri-generation contribution to climate change control.Applied Thermal Engineering 22, 703e718.
Mirata, M., Nilsson, H., Kuisma, J., 2005. Production systems aligned with distrib-uted economies: examples from energy and biomass sectors. Journal of CleanerProduction 13, 981e991.
Mizsey, P., Racz, L., 2010. Cleaner production alternatives: biomass utilisationoptions. Journal of Cleaner Production 18, 767e770.
Nallathambi Gunaseelan, V., 1997. Anaerobic digestion of biomass for methaneproduction: a review. Biomass and Bioenergy 13, 83e114.
Nilsson, D., 1997. Energy, exergy and emergy analysis of using straw as fuel indistrict heating plants. Biomass and Bioenergy 13, 63e73.
Odum, H.T., 1996. Environmental Accounting, Emergy and Environmental DecisionMaking, vol. 194. John Wiley, New York, USA, p. 232.
Odum, H.T., Brown, M.T., Brandt-Williams, S., 2000. Introduction and global budget.In: Handbook of Emergy Evaluation. The Center for Environmental Policy,Environmental Engineering Sciences, Gainesville, Florida, Folio 1, USA.

N. Jamali-Zghal et al. / Journal of Cleaner Production 47 (2013) 446e456456
Poudel, B.C., Sathre, R., Bergh, J., Gustavsson, L., Lundstrom, A., Hyvonen, R.,2012. Potential effects of intensive forestry on biomass production and totalcarbon balance in north-central Sweden. Environmental Science & Policy 15,106e124.
Romitelli, M.S., 1999. Emergy analysis of the new BoliviaeBrazil gas pipeline. In:Proceedings of the First Biennial Emergy Analysis Research Conference. TheCenter for Environmental policy, Gainsville, Florida, USA.
Saidur, R., Abdelaziz, E.A., Demirbas, A., Hossain, M.S., Mekhilef, S., 2011. A reviewon biomass as a fuel for boilers. Renewable and Sustainable Energy Reviews 15,2262e2289.
Salazar, J., Meil, J., 2009. Prospects for carbon-neutral housing: the influence ofgreater wood use on the carbon footprint of a single-family residence. Journalof Cleaner Production 17, 1563e1571.
Schmidt, J., Leduc, S., Dotzauer, E., Schmid, E., 2011. Cost-effective policyinstruments for greenhouse gas emission reduction and fossil fuelsubstitution through bioenergy production in Austria. Energy Policy 39,3261e3280.
Sebastián, F., Royo, J., Gómez, M., 2011. Cofiring versus biomass-fired power plants:GHG (greenhouse gases) emissions savings comparison by means of LCA (lifecycle assessment) methodology. Energy 36, 2029e2037.
Shunping, J., Baohua, M., Shuang, L., Qipeng, S., 2010. Calculation and analysis oftransportation energy consumption level in China. Journal of TransportationSystems Engineering and Information Technology 10 (1), 22e27.
Skodras, G., Palladas, A., Kaldis, S.P., Sakellaropoulos, G.P., 2007. Cleaner co-combustion of ligniteebiomassewaste blends by utilising inhibitingcompounds of toxic emissions. Chemosphere 67, 191e197.
Stehlík, P., 2009. Contribution to advances in waste-to-energy technologies. Journalof Cleaner Production 17, 919e931.
Stöglehner, G., 2003. Ecological footprint e a tool for assessing sustainable energysupplies. Journal of Cleaner Production 11, 267e277.
Sweeney, S., Cohen,M.J., King,D., Brown,M.T., 2007. Creationof a global emergydatabasefor standardized national emergy synthesis. In: Bardi, E. (Ed.), Emergy Synthesis 4:Proceedings of the 4th Biennial Emergy Research Conference. The Center for Envi-ronmental Policy, University of Florida, Gainsville, Florida, USA, pp. 483e497.
Telmo, C., Lousada, J., 2011. Heating values of wood pellets from different species.Biomass and Bioenergy 35, 2634e2639.
Ulgiati, S., Brown, M.T., 2002. Quantifying the environmental support for dilutionand abatement of process emissions: the case of electricity production. Journalof Cleaner Production 10, 335e348.
Von Blottnitz, H., Curran, M.A., 2007. A review of assessments conducted on bio-ethanol as a transportation fuel from a net energy, greenhouse gas, and envi-ronmental life cycle perspective. Journal of Cleaner Production 15, 607e619.
Yao, M.,Wang, H., Zhang, Z., Yue, Y., 2010. Experimental study of n-butanol additive andmulti-injectiononHDdieselengineperformanceandemissions. Fuel89,2191e2201.
�Cu�cek, L., Kleme�s, J.J., Zdravko, K., 2012. A review of footprint analysis tools formonitoring impacts on sustainability. Journal of Cleaner Production 34, 9e20.