carbonaceous aerosols contributed by traffic and solid fuel burning
TRANSCRIPT

Atmos. Chem. Phys., 11, 1603–1619, 2011www.atmos-chem-phys.net/11/1603/2011/doi:10.5194/acp-11-1603-2011© Author(s) 2011. CC Attribution 3.0 License.
AtmosphericChemistry
and Physics
Carbonaceous aerosols contributed by traffic and solid fuel burningat a polluted rural site in Northwestern England
D. Liu 1, J. Allan1,2, B. Corris1, M. Flynn1, E. Andrews3,4, J. Ogren4, K. Beswick1, K. Bower1, R. Burgess1,T. Choularton1, J. Dorsey1, W. Morgan1, P. I. Williams1,2, and H. Coe1
1School of Earth, Atmospheric and Environmental Sciences, The University of Manchester, Oxford Road,Manchester, M13 9PL, UK2National Centre for Atmospheric Science, The University of Manchester, Oxford Road, Manchester, M13 9PL, UK3Cooperative Institute for Research in Environmental Sciences, University of Colorado, Boulder, CO 80309, USA4Earth System Research Laboratory, NOAA, Boulder, CO 80305, USA
Received: 15 October 2010 – Published in Atmos. Chem. Phys. Discuss.: 28 October 2010Revised: 27 January 2011 – Accepted: 9 February 2011 – Published: 18 February 2011
Abstract. The experiment presented in this paper was con-ducted at the Holme Moss site, which is located in thesouthern Pennines region in Northwestern England duringNovember–December 2006. The strong southwesterly windduring the experimental period, which enhanced the transportof urban pollutants from the conurbations of Greater Manch-ester and Liverpool, in addition to the seasonally increasednearby residential heating activities, made this site a recep-tor for pollutants from a range of sources. A factor analysisis applied to the mass spectra of organic matter (OM) mea-sured by the Aerodyne Aerosol Mass Spectrometer (AMS)to attribute the pollutant sources. Besides the oxygenated or-ganic aerosol (OOA), this site was found to contain a consid-erable fraction of primary organic aerosols (POA, mass frac-tion 50–70% within total mass of OM). The POA sources areattributed to be traffic emission and solid fuel burning, whichare identified as hydrocarbon-like organic aerosol (HOA) andsolid fuel organic aerosol (SFOA) respectively. There werestrongly combined emissions of black carbon (BC) particlesfrom both sources. The refractory BC component (rBC) wascharacterized by a single particle soot photometer. This sitebegan to be influenced during the late morning by fresh traf-fic emissions, whereas solid fuel burning became dominantfrom late afternoon until night. A covariance analysis ofrBC and POA was used to derive source specific emissionfactors of 1.61 µgHOA/µgrBC and 1.96 µgHOA/µgrBC. Theabsorbing properties of aerosols were characterized at mul-tiple wavelengths (λ), and a stronger spectral dependence
Correspondence to:D. Liu([email protected])
of absorption was observed when this site was significantlyinfluenced by solid fuel burning. The rBC was estimatedto contribute 3–16% of submicron aerosol mass. The sin-gle scattering albedo atλ = 700 nm (SSA700 nm) was signif-icantly anti-correlated with the rBC mass fraction, but alsoassociated with the BC mixing state. The BC incorpora-tion/removal process therefore may play a role in modulatingthe radiative properties of aerosols at the site under the influ-ence of fresh sources. Given that traffic and residential com-bustion of solid fuels are significant contributors of carbona-ceous aerosols over Europe, these results provide importantsource-specific information on modeling the anthropogeniccarbonaceous aerosols.
1 Introduction
Particles have long been known to significantly influenceair quality and climate and to originate from a variety ofsources. Primary aerosols are emitted directly into the at-mosphere but undergo transformation in the atmosphere dur-ing transport. Secondary material is added both as ad-ditional mass to existing particles and through the forma-tion of secondary aerosols. Recent studies on the sourceattribution of sub-micron aerosols have been primarily fo-cused on the investigation of the organic fraction as individ-ual organic compounds can be used as markers for certainsources (Rogge et al., 1993). The Aerodyne Aerosol MassSpectrometer (AMS) provides detailed information on themass spectra of aerosols with high time resolution (Cana-garatna et al., 2007). The organic aerosol (OA) mass spec-tra obtained from AMS measurements is often incorporated
Published by Copernicus Publications on behalf of the European Geosciences Union.

1604 D. Liu et al.: Carbonaceous aerosols contributed by traffic and solid fuel burning
into analysis mechanisms to identify the general classesof OA. Techniques such as Multiple Component Analysis(MCA, Zhang et al., 2005, 2007) have been used to sepa-rate the measured signal as either hydrocarbon-like or oxy-genated organic aerosol (HOA or OOA), which are broadlyattributed to primary organic aerosol (POA) or secondary or-ganic aerosol (SOA), respectively. A more recent methodol-ogy, positive matrix factorization (PMF, Paatero, 1997) hasbeen applied to a variety of polluted environments to identifysources that are beyond the classifications of HOA and OOA,for example, the OOA can be further distinguished accord-ing to the extent of its oxidization (Lanz et al., 2007; Ulbrichet al., 2009) and volatility (Huffman et al., 2009), and thebroadly classified HOA (or POA) can be further attributed todifferent sources (Lanz et al., 2007; Allan et al., 2010).
Besides the OA, black carbon aerosol (BC) also con-tributes to carbonaceous particulate mass, furthermore BC ishighly light absorbing (Bond and Bergstrom, 2006) and hasbeen revealed to significantly perturb the radiative balanceof the solar-earth system causing a range of regional impacts(Ramanathan and Carmichael, 2008). The relationship be-tween BC and OA has been widely used to diagnose the age-ing of sources as BC is conserved after emission other thanthrough wet removal, whilst SOA greatly increases the OAmass with time (Chu 2005 and references therein). The emis-sion of BC is concurrent with the other combustion species,such as HOA and trace gasses (e.g. CO, NOx). However,fresh OA undergoes gas phase repartitioning (Robinson et al.,2007) and is photochemically processed becoming more ox-idized with time (Ng et al., 2010) and less volatile (Huffmanet al., 2009) as distance from the source increases (Jimenez etal., 2009). Ageing of aerosol often changes the hygroscopic-ity of the particles, thus affecting their atmospheric lifetimeby modifying the efficiency of wet removal. However theinformation is still sparse with respect to the modificationof BC hygroscopic properties (Koch et al., 2009). Recently,studies on the evolution and ageing time of BC in the atmo-sphere became possible by examining its mixing state utiliz-ing the single particle photometer instrument (SP2, manufac-tured by Droplet Measurement Technologies, Boulder, USA;e.g. Schwarz et al., 2006). A better understanding of the BCmixing state is of great importance for modeling its lifetimein the atmosphere.
The previous thermo-optical measurements of BC intro-duce ambiguities in the models of BC as a result of system-atic instrument uncertainties and the variety of BC defini-tions which are related to specific measurement techniques(Andreae and Gelencser, 2006; Bond and Bergstrom, 2006).In addition, the characteristics of BC are not widely treatedas source specific in the modeling community, although BChas been observed to show different properties when emit-ted from different sources (Schwarz et al., 2008). The mainsources of carbonaceous aerosols in Europe are emissionsfrom traffic and residential combustion of solid fuels (Kupi-ainen and Klimont, 2007) and it is their emission and spatial
and temporal variation that lead to the largest uncertainties inmodeling the BC over Europe (Tsyro et al., 2007).
The contribution from residential combustion is higherduring the winter time due to the usage of domestic heating,whereas the seasonal variation is small for vehicle emissionsources. In a pan-European study, the northwest of England(in common with similar large urban areas) has been demon-strated to be a large source of carbonaceous aerosols (Tsyroet al., 2007). The pollutants in central Manchester duringthe winter and autumn seasons have been found to containsignificant contributions from traffic emissions and biomassburning, such as would be emitted by solid fuel burning (Al-lan et al., 2010).
This study is based on measurements made at a pollutedrural site, Holme Moss, which is located in the southern Pen-nines region in Northwestern England, approximately 30 kmto the northeast of the city of Manchester. The experimentwas conducted during November–December 2006, when theambient temperature was low and localized residential heat-ing sources were prevalent. The synoptic cyclonic flows re-sulted in strong south-westerly flow during the experiment,allowing the transport of pollutants from the Greater Manch-ester conurbation (population approximately 2.5 millions).As a result, this site tended to be influenced by combinedsources. PMF analysis is applied to the mass spectra of or-ganic aerosols measured by the AMS to attribute the OA andthis characterization was used to investigate the physical andoptical properties of BC from the different sources.
2 Experimental
2.1 Site description and meteorological conditions
The Holme Moss site is positioned in the rural southernPennines of Northern England at an altitude of 525 m a.s.l.(geographical coordinate 53.53◦ N, 1.86◦ W), approximately30 km to the northeast of the city of Manchester (Fig. 1).The site is described in detail by Beswick et al. (2003).The experimental period lasted from 7 November 2006 to4 April 2006, during which time the locally monitored windspeed was 10 to 15 m s−1, and the wind direction was fromthe southwest for 90% of the time (Fig. 1). This led to effi-cient transport of urban pollutants from the Greater Manch-ester conurbation to the site. In addition, the site is inclose proximity to several small towns, where the burning ofwood, coke, coal and anthracite for domestic space heatingis widespread in the winter (NAEI, 2009), although the solidfuel burning that produces smoke is legislated against in mostmetropolitan areas in the UK, which includes most GreaterManchester areas (Smoke Control Areas, 2009). This meantthe site was significantly influenced by primary pollutantsfrom combined sources. The weak incident solar radiation,the low temperature in the winter, as well as the frequentcloud cover, made photochemical processing less efficientduring the experimental period.
Atmos. Chem. Phys., 11, 1603–1619, 2011 www.atmos-chem-phys.net/11/1603/2011/

D. Liu et al.: Carbonaceous aerosols contributed by traffic and solid fuel burning 1605
Fig. 1. (A) The approximate location of the Greater Manchester conurbation area and Holme Moss site are shown in the UK map (downloadfrom http://edc.usgs.gov/) marked with black solid dot and cross respectively.(B) The detailed map of the Greater Manchester conurbationarea (download fromhttp://maps.google.co.uk/) showing the primary arterial roads. The Holme Moss sampling station is marked as redletter A on the upper right side of this map.(C) The wind rose shows the frequency distribution of hourly averaged wind direction and speedthroughout the experimental period.
2.2 Instrumentation, sampling and dataanalysis methodology
2.2.1 Sampling inlet
The inlet system was comprised of a plastic stack with aheight of ∼ 10 m, the inner diameter of which was about21.4 cm, through which a total flow of∼ 1000 L min−1 waspulled. A 2.44 m long stainless steel tube with an innerdiameter of approximately 4.7 cm was used to subsample150 L min−1 isokinetically from the centreline of the flowinside the stack. This inlet system has been previously de-scribed by Sheridan et al. (2001), who quotes a collectionefficiency for particles between 0.01 and 1 µm of over 95%.The loss rate rises to 10% for particles larger than 10 µm.A 5 µm impactor is used to prevent the sampling of largeraerosols and cloud droplets, thus when cloud is present at thesite the sampled particles are interstitial aerosol rather than
droplet residuals. Downstream of the impactor the airflowis isokinetically split between the instrumentation located intemperature controlled container laboratories.
2.2.2 Physiochemical properties of aerosols
Non-refractory particle composition
The time resolved chemical mass loadings and distributionsof key submicron non-refractory components of the aerosolwere measured by an Aerodyne compact Time of FlightAerosol Mass Spectrometer (cToF-AMS) (Canagaratna etal., 2007; Drewnick et al., 2005). In addition the cToF-AMSdelivers time series of component mass spectra. Positive ma-trix factorization (PMF) was used to investigate the organicmass spectral profiles. PMF seeks to represent the measureddata by a linear superposition of a number of unchangingmass spectral profiles as factors, and the contribution from
www.atmos-chem-phys.net/11/1603/2011/ Atmos. Chem. Phys., 11, 1603–1619, 2011

1606 D. Liu et al.: Carbonaceous aerosols contributed by traffic and solid fuel burning
each profile to the measured data as a function of time can bedetermined (Paatero, 1997; Lanz et al., 2007). The profilesof factors represent mass spectra and the changing contribu-tions capture the variation of mass loadings to determine thevarying relative contributions from each type which may belinked to a source.
The PMF analysis performed as part of this work used thePMF Evaluation Toolkit (PET), as introduced by Ulbrich etal. (2009). The organic matrix was extracted using the frag-mentation table method described by Allan et al. (2004) andthe error model of Allan et al. (2003) was used. Rather thanuse downweighting, the predicted contributions to the watersignal (principallym/z= 18) were removed before processingand mass concentrations scaled up accordingly afterwards.As with all PMF analysis, a degree of ambiguity exists dueto the finite number of factors chosen and rotational free-dom between the different solutions. Similar criteria to thoseused by Allan et al. (2010) were employed in the selectionof an optimal solution set, whereby solutions were tested ac-cording to the uniqueness of factors and numerical stabilityof the solutions. In the absence of sufficient external datato constrain rotationality between solutions, the value of theFPEAK parameter was selected based on the uniqueness ofthe time series derived and the optimum Q value found. Fulldetails on the selection of the solution are contained withinthe supplementary material.
Optical properties
An integrating nephelometer (Model 3563, TSI, Shoreview,MN, USA.) was used to measure the total scattering coeffi-cient (σsp) at 450, 550 and 700 nm simultaneously (Andersonet al., 1996), from which the data was corrected for trunca-tion errors following the procedures recommended by Ander-son and Ogren (1998). The absorption coefficient (σap) wasdetermined using a three-wavelength Particle Soot Absorp-tion Photometer (PSAP) atλ = 467, 530 and 660 nm (Radi-ance Research, Seattle, WA, USA). The data were correctedfor the scattering artifact and departures from manufacturerdefaults (e.g., spot size and flow rate) according to Bond etal. (1999). The spectral dependence of absorbing propertiesis investigated by calculating the absorptionAngstrom coef-ficient (aap) as expressed by Eq. (1):
aap =ln (σ660 nm/σ467 nm)
ln (467/660)(1)
The optical absorption of bulk aerosols was also moni-tored with a Model 5012 Multi-Angle Absorption Photome-ter (MAAP) at λ = 670 nm (Thermo Fisher Scientific Inc.,Waltham, MA, USA) The MAAP simultaneously measuredthe transmission and back scattering of a light beam througha glass fibre filter onto which the aerosol is sampled con-tinuously. σap is obtained from a radiative transfer schemewhich corrects for artefacts caused by the interaction of thelight with the filter material and off-axis detection at multiple
angles is used to correct for the effect of scattering (Pet-zold and Schonlinner, 2004). Theσap presented in this pa-per is corrected to standard temperature and pressure (STP;273.15 K, 1013.25 hPa).
Refractory BC particles (rBC)
The physical properties of single refractory BC parti-cles (rBC) were characterized by the single particle soot pho-tometer (SP2). This instrument uses an intra-cavity Nd:YAGlaser at 1064 nm to determine the size of a single particleby light scattering and quantify its rBC mass by detectionof the incandescence radiation if the particle absorbs at thelaser wavelength (Stephens et al., 2003; Baumgardner et al.,2004). In this study, the incandescence signal was calibratedusing commercially available standard glassy carbon spheres(supplied by Alpha Aesar, Inc.,Ward Hill, Massachusetts,with density 1.42 g cm−3), which were size-selected usinga differential mobility analyzer (DMA) upstream of the SP2down to single particle mass loadings of about 12 fg (mo-bility diameter 250 nm). Mono-dispersed polystyrene latexspheres of known sizes were used to calibrate the scatteringsignal. The operation, calibration and data analysis meth-ods for the Manchester SP2 instrument during the experi-ment are described by Liu et al. (2010), and the instrumentconfiguration in this study is identical to the descriptions inthat paper. The instrument determined rBC mass between6–240 fg during this experiment, which is equivalent to thediameter range of 190–650 nm assuming the particle to be asolid sphere with density of 1.9 gcm−3 (Bond and Bergstrom,2006). To account for the rBC mass below the SP2 lower de-tection limit, previous studies have estimated the total rBCby extrapolating the mass size distribution based on a singlelognormal mode (Schwarz et al., 2006). This methodologyhas also been applied for our instrument, which is describedin detail in Liu et al. (2010), where about 40–60% mass ofthe entire rBC population has been detected by the SP2. Themass of rBC presented in this paper has been corrected forthese effects. Scattering particles were optically sized be-tween 220–720 nm diameter.
The SP2 is capable of providing information on the mix-ing state of rBC by measurement of the delay time betweenthe scattering and incandescence signals that is commonlyreferred to as the coating evaporation time. The SP2 can alsobe used to estimate the rBC mass fraction within a singleparticle for a coated rBC (Liu et al., 2010). A thicker coatingon an rBC particle tends to increase the time delay and de-crease the rBC mass fraction. In this study, a frequency dis-tribution of delay times and mass fractions of detected rBCparticles displayed a bimodal distribution. The minimum be-tween the two modes was observed to occur at a time delayof 4.6±0.2 µs and a rBC mass fraction of 0.75 with approx-imate coating thickness of 50±15 nm. Particles with timedelays in excess of this value and mass fraction less thanthis threshold are termed as thickly-coated BC. The mixing
Atmos. Chem. Phys., 11, 1603–1619, 2011 www.atmos-chem-phys.net/11/1603/2011/

D. Liu et al.: Carbonaceous aerosols contributed by traffic and solid fuel burning 1607
6
5
4
3
2
1
0
SP
2 volu
me co
ncen
tration
(µm
3cm-3)
11/11/2006 16/11/2006 21/11/2006Date and Time
14
12
10
8
6
4
2
0
Vo
lum
e C
on
cen
trat
ion
s(u
m3 cm
-3)
140
120
100
80
60
40
20
0Sca
tter
ing
co
effi
cien
t (M
m-1
)
12x103
10
8
6
4
2
0
CN
(cm
-3)
12
10
8
6
4
2
0
To
tal sub
-micro
n aero
sol m
ass(µg
m-3)
Volume concentrations measured by: DMPS AMS
Fig. 2. The time series (from top to bottom) of CN concentration with the right axis showing the total sub-micron aerosol mass loading; thesubmicron scattering coefficient measured by nephelometer (atλ = 550 nm) with the right axis showing the SP2 optically measured volumeconcentration; the total volume concentrations derived from AMS (by assuming densities of 1.27 and 1.77 g cm−3 for organics and inorganicaerosol respectively) and DMPS measurement.
efficiency of BC is defined as the number fraction of thickly-coated BC particles.
The total mass of submicron aerosol is calculated as thesum of AMS measured non-refractory aerosol mass (sul-fate + nitrate + ammonia + chloride + organic) and SP2 mea-sured refractory BC mass. In addition to the instrumentsabove, a Differential Mobility Particle Sizer (DMPS) wasused to measure the aerosol mobility diameter between 25–740 nm, as fully described by Williams (1999). A Condensa-tion Particle Counter (CPC, TSI 3010 model) measured thecondensation nucleus (CN) concentration of all sub-micronaerosols with a diameter greater than 10 nm.
3 Results
3.1 Total aerosol loadings
The AMS volume concentration (down to about aerody-namic diameter 60–70 nm) was derived from the measurednon-refractory aerosol mass by assuming densities of 1.27and 1.77 g cm−3 for organics and inorganic aerosol respec-tively (Cross et al., 2007). The differential mobility parti-cle sizer (DMPS) measured mobility diameter at 25–740 nm,from which the volume concentration was estimated assum-ing spherical aerosols. The SP2 optically sizes the scatteringparticles between 220–720 nm diameter. Figure 2 summa-rizes the volume concentrations measured by the differentinstruments, total mass of submicron aerosols and CN. Thetime series of volume concentrations for each instrument andthe total aerosol mass are well correlated withσsp measured
by the nephelometer (r2 > 0.7). The AMS volume is equalto or less than the DMPS volume owing to the insensitivityof the AMS to refractory particles that cannot be vaporizedat∼ 600◦C, such as BC or some refractory organic aerosols.
At this site, a diurnal variation of pollution was expecteddue to the local variability in emissions. The diurnal evolu-tion of the aerosol is shown in Fig. 3. The CN population wasdramatically elevated from 10:00 until 20:00 and reducedduring the night. The total aerosol mass and aerosol scatter-ing coefficient both showed a much weaker diurnal variationas compared to the CN. This is because the smaller Aitkenmode particles, i.e. freshly formed through nucleation pro-cesses, dominate the aerosol number (e.g. Kittelson, 1998)but contribute little to the total mass and are less efficient atlight scattering compared to the larger accumulation modeparticles. The enhancement of CN from 10:00–20:00 and itscorrelation with BC indicates fresh sources contributing tothe particle load at the site.
3.2 Source attribution by PMF analysis
3.2.1 Classification of PMF factors
Figure 4a shows the mass spectra for the retrieved threefactors from PMF analysis. The Oxygenated OrganicAerosol (OOA) is identified as such due to its strong peakat m/z44 (Zhang et al., 2005). This type of organic aerosolhas been widely reported as “type 1” OOA, representing agedsecondary organic aerosols (Lanz et al., 2007; McFiggans etal., 2005). The Hydrocarbon-like Organic Aerosol (HOA)agrees with previously reported mass spectra associated with
www.atmos-chem-phys.net/11/1603/2011/ Atmos. Chem. Phys., 11, 1603–1619, 2011

1608 D. Liu et al.: Carbonaceous aerosols contributed by traffic and solid fuel burning
A
B
C
Fig. 3
Fig. 3. The diurnal variations (from top to bottom) of CN (cm−3),total submicron aerosol mass (µg m−3) and sub-micron scatteringcoefficient (Mm−1). The upper and lower edges of the box denotethe 25% and 75% percentiles respectively. The lines in the middleof box and cross markers indicate the median and average values re-spectively, with error bars explaining the 10% and 90% percentiles.
vehicle exhaust emissions (Canagaratna et al., 2004; Schnei-der et al., 2005), showing the largest peak atm/z43 and 57, inaddition to the characteristic peaks at 41, 43, 55 and 57 withweak signal at 44. The factor Solid Fuel Organic Aerosol(SFOA) has somem/zsignals similar to HOA (55, 57, 69,71) and a notable signal atm/z60, a typical indicator of lev-oglucosan, which is the thermal decomposition product ofcellulose. The levoglucosan is often a typical tracer for theorganic aerosol from biomass burning (Jordan et al., 2006;
Table 1. A summary of Pearson correlation coefficient (r2) betweendifferent components of the organic particles and other particulatecomponents.r2 values over 0.50 are highlighted in bold.
r2 OOA HOA SFOA
NO3 0.64 0.38 0.26SO4 0.53 0.15 0.22Total inorganic 0.73 0.30 0.29rBC 0.30 0.60 0.52
0.72(bilinear fitting)
Simoneit, 2002) as has been evidenced via the AMS mea-surement in both ambient and laboratory spectra (Capes etal., 2008; Schneider et al., 2006; Alfarra et al., 2007). A re-cent study by Allan et al. (2010) investigating the primary or-ganic aerosols in the two UK cities Manchester and Londonattributes the urban sources as vehicle emission (HOA), solidfuel burning (SFOA) and cooking organic aerosol (COA).There is little evidence of COA at the Holme Moss site butboth SFOA and HOA are significant factors that have dis-tinctly different diurnal profiles due to the location of thesample site relative to the sources. It is possible that there areother minor contributions to primary organic aerosol (POA)but these were not resolved by the PMF analysis.
3.2.2 Interpretations of PMF factors
Primary aerosols
In common with other studies (Zhang et al., 2007 and ref-erences therein), the factors HOA and SFOA can be inter-preted as POA (POA mass = HOA mass + SFOA mass) andshould therefore be correlated with other primary combus-tion emissions, such as BC; whereas the OOA has a signatureof secondary aerosols, which has been revealed to have cor-relations with aerosol attributed to secondary species, suchas sulphate and nitrate. Figure 4b shows the time series forthe three PMF factors and identifies species that temporallycorrelate with the organic factors. Table 1 summarizes andindicates the high correlations in bold text. There is a posi-tive correlation between rBC mass and both HOA and SFOA,with Pearson correlation coefficients 0.60 and 0.52. A bilin-ear function is used to fit the rBC mass simultaneously withboth HOA and SFOA as expressed in Eq. (1):
fBC(HOA,SFOA) = a[HOA]+b[SFOA]+c (2)
a = 0.62±0.014 µgrBC/µgHOA or 1.61 µgHOA/µgrBCb = 0.51±0.009 µgrBC/µgHOA or 1.96 µgHOA/µgrBCc = 0.025r2(BC-HOA-SFOA) = 0.72
Atmos. Chem. Phys., 11, 1603–1619, 2011 www.atmos-chem-phys.net/11/1603/2011/

D. Liu et al.: Carbonaceous aerosols contributed by traffic and solid fuel burning 1609
0.100.080.060.040.020.00
BB
OA
10080604020 m/z
0.12
0.08
0.04
0.00H
OA
0.30
0.20
0.10
0.00
OO
A
57
6971
55
55
29
57
69
43
27
29
43
60
44
A
1.0
0.8
0.6
0.4
0.2
0.0
rBC
mass lo
adin
g(µ
g/m
3)
11/11/2006 16/11/2006 21/11/2006 26/11/2006 01/12/2006Date and Time
1.00.80.60.40.20.0
6
4
2
0
Mass lo
adin
g o
f nitrate
or su
lfate
1.00.80.60.40.20.0
Org
anic
mas
s lo
adin
g(u
gm
-3)
2.01.51.00.50.0
1.2
0.8
0.4
0.0
OOA
HOA
SFOA
Nitrate Sulfate
POA
B
Fig. 4. (A) Results of PMF analysis, showing the time series and mass spectra for the three factor solution. The factors are identified asOOA, HOA and SFOA.(B) From top to bottom: time series of OOA along with the nitrate and sulfate shown on the right y-axis; POA (thesum of HOA and SFOA) with rBC mass loading shown on the right y-axis; HOA and SFOA.
Using bilinear fitting improves the correlation coefficientwith rBC (0.72) compared to that with the individual fac-tors. This is a strong indication that the rBC loadings haveboth urban transport pollution and solid fuel burning sources.The emission factors of 0.62± 0.014 µgrBC/µgHOA and0.51±0.009 µgrBC/µgSFOA are derived from this bilinearregression. The rBC emitted along with HOA (rBCHOA) orSFOA (rBCSFOA) can therefore be estimated by the emissionrates derived here.
The diurnal cycles of primary aerosols are shown in Fig. 5.The morning peak of HOA occurs between 10:00 and 12:00with average loading of 0.2 µg m−3, in a similar manner tothe diurnal cycle in total CN. Allan et al. (2010) reporteda HOA morning peak loading of 4.6 µg m−3 between 07:00
and 09:00 in the urban area of Manchester coinciding withthe traffic rush hour. Compared to the Manchester results,the HOA peak loading in the Holme Moss site was consid-erably lower and the morning occurrence of the peak urbanpollution at the Holme Moss site, was delayed for about 1–2hours. This is consistent with advection times from Manch-ester urban centre (∼ 25 km) according to the average localwind speeds (10–13 m s−1) and direction during the exper-iment. The average mass loading and the morning peak ofHOA are both significantly reduced at weekends (grey linesin Fig. 5a), which would be expected given the reduced traf-fic.The majority of previous urban studies showed a re-duced pollution loading after the morning rush hour peak
www.atmos-chem-phys.net/11/1603/2011/ Atmos. Chem. Phys., 11, 1603–1619, 2011

1610 D. Liu et al.: Carbonaceous aerosols contributed by traffic and solid fuel burning
A
B
C
Fig.5
Fig. 5. Average diurnal cycles (from top to bottom) of HOA, SFOAand rBC mass. The black and grey lines show the entire datasetand weekend only data respectively. The grey lines show the me-dian value associated with the error bars denoting 25% and 75%percentiles. The markers on the black line have the same meaningas in Fig. 3.
concentration due to elevated boundary layer heights and in-creased mixing volume typical of later in the day (e.g. Allanet al., 2010; Baumgardner et al., 2007; Kondo et al., 2006).In this study, the HOA loading reduced only slightly afterthe morning peak and significantly increased to 0.18 µg m−3
between 16:00–18:00, comparable in magnitude to the morn-ing peak at the Holme Moss site. These differences are likely
to be due to meteorological differences experienced over thecomplex terrain.
The SFOA loading at the Holme Moss site (Fig. 5b) tendedto rise significantly from 16:00 and began to decrease aftermidnight. This diurnal trend is similar to the Manchesterurban results (Allan et al., 2010), because in the winter mostburning for space heating occurs in the late evening. The lackof a delay suggests the SFOA observed at this site is fromlocal towns rather than Greater Manchester. The nocturnalinversion at night will trap the pollutants and further increasethe pollutant concentration, as the high outliers in Fig. 5bshow.
Wood is commonly used as a space heating fuel in theUK (NAEI, 2009). Although the solid fuel burning thatproduces smoke is legislated against in most metropolitanareas in the UK, which includes most of Greater Manch-ester (Smoke Control Areas, 2009), the practice of seasonalburning smoking fuels such as wood in open fires is stillwidespread in the rural areas surrounding Manchester includ-ing those around Holme Moss site. Other solid fuels such ascoal, anthracite and smokeless fuels are also strong contrib-utors (NAEI, 2009), warranting the term of SFOA for theorganic aerosol produced from this sector.
The diurnal variability of rBC loadings (Fig. 5c) clearlyshows contributions from both HOA and SFOA, exhibit-ing double peaks. The maximum morning loading of150±30 ng m−3 occurred at 11:00–13:00 and was coinci-dent with the HOA peak. The evening peak occurred be-tween 18:00 and 21:00, and had a peak loading of 270±
50 ng m−3. The earlier part of this evening peak was coin-cident with the peak in HOA and hence was likely to arisefrom vehicle emission and the latter was coincident with thepeak in the organic matter from solid fuel burning.
Secondary aerosols
The OOA represents the contribution of aged, oxidised sec-ondary organic material to the particulate mass, and haspreviously been shown to be correlated with inorganic sec-ondary species such as nitrate and sulfate (Lanz et al., 2007;Zhang et al., 2007). However, correlations between OOAand inorganic secondary species will depend on the relativesimilarities of distribution of precursor emissions and forma-tion processes. The OOA in this study correlates significantlywith total measured inorganic particulate mass (r2
= 0.73,Table 1), and is better correlated with nitrate (r2
= 0.64) thansulfate (r2
= 0.53). Allan et al. (2010) observed that theOOA showed a higher correlation with nitrate than sulphatewhen the OOA was less oxidized, especially in the wintertime, which may explain the greater correlation of OOA withnitrate than sulfate in this study, given the low photochemicalactivity and a lack of volatile organic precursors during theexperimental period.
Atmos. Chem. Phys., 11, 1603–1619, 2011 www.atmos-chem-phys.net/11/1603/2011/

D. Liu et al.: Carbonaceous aerosols contributed by traffic and solid fuel burning 1611
A
B
C
Fig. 6
Fig. 6. Average diurnal cycles (from top to bottom) of OOA, nitrateand sulphate.
The OOA shows no obvious diurnal variability (Fig. 6),indicating that it represents the regional background as hasbeen observed in other studies (Lanz et al., 2007; Ulbrichet al., 2009). The mean value of sulfate concentration ishigher than the median value, indicating the presence of ele-vated sulfate was intermittent. The nitrate has large outliersat night, as the ammonium nitrate equilibrium with its pre-cursor gases ammonia and nitric acid is heavily modulatedby temperature and humidity (Morino et al., 2006; Morgan etal., 2010). Note that unlike some previous studies, the OOAcould not be separated into low- and semi-volatile compo-nents (Jimenez et al., 2009). In common with the winter
and autumn studies presented by Allan et al. (2010), thiswas probably because there was not a large enough varia-tion in temperature experienced (6±2.5◦C) to separate thetwo components.
3.3 The optical properties of aerosols
This site was under the influence of both urban outflow andresidential solid fuel burning, and hence substantial amountsof absorbing particles were present. Besides the highlyabsorbing BC (Bond and Bergstrom, 2006), some organicaerosols, known as brown carbon, will also contribute signif-icantly to light absorption when present in high abundance,especially under the influence of biomass burning (Andreaeand Geleneser, 2006, and references therein). Given thatHolme Moss received considerable particulate matter fromsolid fuel burning sources, the absorption by brown carboncould also be an important constituent of measured light ab-sorption.
The presence of brown carbon introduces a bias in BCmass determinations by absorption methods at shorter wave-lengths which are variable depending on the abundance ofabsorbing organic matter (Andreae and Geleneser, 2006;Lack et al., 2008). The picture is further complicated be-cause of the different spectral dependence of absorption forBC and organic carbon. Organic carbon absorption increasessharply towards lower wavelengths, making their absorptionin the UV potentially more significant than that of BC. It istherefore preferable to characterize absorption using multi-ple λs in environments with high loadings of both BC andbrown carbon.
The absorbing properties during this study were charac-terized at multipleλs (PSAP 467 nm, 530 nm, 660 nm andMAAP 670 nm), as shown in Fig. 7a, and are unsurprisinglyhighly correlated (r2 > 0.93). In common with previousstudies (Bond and Bergstrom 2006 and references therein),light absorption by aerosol particles is inversely correlatedwith λ, however the spectral dependence may vary in time.Absorbing organic carbon in particles from solid fuel sourceshave previously been seen to be considerably more importantthan organic carbon from vehicular sources and hence ab-sorption may have a greater spectral dependence when thissource type is dominant (e.g. Kirchstetter et al., 2004). Fig-ure 7b shows frequency distributions ofaap during periodswhen the environment is less influenced by solid fuel burn-ing (SFOA/HOA< 2.5) and when solid fuel dominates overvehicular sources (SFOA/HOA> 2.5). During periods dom-inated by vehicular sources of OA, the median value ofaapwas 1.1, whereas it increased considerably under the influ-ence of solid fuel burning, peaking at between 1.4–1.5.
www.atmos-chem-phys.net/11/1603/2011/ Atmos. Chem. Phys., 11, 1603–1619, 2011

1612 D. Liu et al.: Carbonaceous aerosols contributed by traffic and solid fuel burning
40
30
20
10
0
Ab
sorp
tio
n c
oef
fici
ent
(Mm
-1)
11/11/2006 16/11/2006 21/11/2006 26/11/2006 01/12/2006Date and Time
3
2
1
0
Ab
sorp
tio
n A
ng
strö
m c
oef
fici
ent
15
10
5
0
SF
OA
/HO
A
PSAP 467nm PSAP 530nm PSAP 660nm MAAP 670nm
A
0.14
0.12
0.10
0.08
0.06
0.04
0.02
0.00
No
rmal
ized
occ
ure
nce
3210Absorption Angström coefficient
SFOA/HOA >2.5 <2.5
B
Fig. 7. (A) Time series of (from top to bottom): SFOA/HOA ratio; the absorptionAngstrom coefficient; the absorption coefficients measuredat differentλ by the PSAP and MAAP instruments.(B) Frequency distributions ofaap for data during periods of increased solid fuel sourceinfluence (SFOA/HOA> 2.5), and enhanced influence from urban traffic emissions (SFOA/HOA< 0.25).
4 Discussion
4.1 Physiochemical properties of aerosols and ageing
The BC mixing efficiency, defined as the number fraction ofthickly coated BC (Sect. 2.2), exhibited a minimum value of0.18±0.05 around 10:00. The dominance of thinly coatedBC particles indicates little processing has occurred. Theminimum in BC mixing efficiency coincides with the in-crease of CN and HOA concentration (Fig. 8) resulting fromfresh urban sources. The BC mixing efficiency maintainedan increasing trend throughout the average diurnal cycle, andreached a maximum (0.31±0.08) at midnight when the sur-face temperature was low. The shallow nocturnal bound-ary layer may have decoupled the site from the contributingsources.
The OOA and HOA factors derived from the PMF anal-ysis of the organic mass spectral data have been shown tobe representative of secondary and primary organic aerosolrespectively (Ulbrich et al., 2009), and the OOA fraction in-creases with distance from sources as particles become aged(Jimenez et al., 2009). The lowest OOA/POA ratio in thisstudy coincided with the period of lowest BC mixing effi-ciency, and was significantly elevated from late afternoon.The OOA/POA at this site ranged from 0.5–1.7, which islower than the average value of OOA/POA for urban regions(1.7) reported by Zhang et al. (2007). This is not inconsis-tent, as Holme Moss is close to the main sources in Manch-ester and photochemical processing in wintertime is typicallymuch slower than in summer when many of the studies usedin the Zhang et al. (2007) study took place. Moreover, theOOA/HOA measured is higher than the value (0.8) reportedby Allan et al. (2010), who studied the environment close to
the Manchester urban sources and was also conducted in thewinter time, indicating some atmospheric processing of theorganic aerosol occurred during transport. The OOA/POAis lower than OOA/HOA (1.1–3.5) as the SFOA also con-tributes some fraction of POA, but follows a similar trendto OOA/HOA. The OOA/POA is also higher than the value(0.4) observed in the Manchester urban study (Allan et al.,2010).
The organic mass/rBC mass ratio (OM/rBC) was relativelystable at around 3.5±0.4 through the daytime and evening,and then significantly increased to 5.6±0.6 between 01:00and 07:00 a.m. In past studies, the OC/EC (elemental carbon)ratio has been widely characterized based on the measure-ment from the field analyzer designed by Sunset Laboratory(Turpin et al., 1990). The OC/EC ratio has been long usedas an indicator for the formation of secondary organics (e.g.Turpin and Huntzicker 1995). In this study, the analogousratio of OM/rBC is reported and higher OM/rBC ratio dur-ing the night clearly demonstrates a strong degree of particleageing.
The geometric mean mobility diameter (Dgm) calculatedfrom DMPS measured size range (25–740 nm) showed low-est values around 10:00, and an increase at midnight (Fig. 8).The fresh urban sources contain a large fraction of smallerparticles in the Aitken mode (Kittelson, 1998), and the sizewill increase as the particles become more aged.
In summary, the pollutants measured at the site fromaround 10:00 were characteristic of fresher sources. Be-tween 10:00 and 13:00, the concentrations of pollutantsincreased significantly, and the high contribution to the OAfrom HOA identifies the main source to be urban outflow.The aerosols during this period were less atmosphericallyprocessed and included elevated amounts of fresh BC
Atmos. Chem. Phys., 11, 1603–1619, 2011 www.atmos-chem-phys.net/11/1603/2011/

D. Liu et al.: Carbonaceous aerosols contributed by traffic and solid fuel burning 1613
2.0
1.5
1.0
0.5
OO
A/P
OA
2015105Hours of day
0.40
0.30
0.20
0.10
BC
mix
ing
eff
icie
ncy
96
92
88
84
RH
(%)
70
65
60
55
DM
PS
Dg
m (n
m)
5
4
3
2
1
OO
A/H
OA
10
8
6
4
2
OM
/rB
C
Fig. 8. From top to bottom, average diurnal variations of rBC coresize, geometric mean diameter of DMPS, RH, OM/rBC, OOA/POAwith OOA/HOA on the right axis and BC mixing efficiency. Thelines show the median value associated with the error bars denoting25% and 75% percentiles.
particles (i.e., low OM/rBC) (Fig. 8). In contrast, theaerosols sampled during the night contained less of a con-tribution from nearby sources, and the particles were moreaged and atmospherically processed. This likely resultedfrom nocturnal decoupling of air in a shallow surface layerover the Manchester area preventing advection of pollutionto the downwind hilltop site. The higher relative humidityduring this period may have further enhanced the ageingprocesses (Fig. 8). The particles during this period weremore typical of an aged regional background.
Unlike previous urban studies (Zhang et al., 2008; Allan etal., 2010), where primary organic aerosol particles are typi-cally dominated by HOA and peak in the early morning andduring the late afternoon, there was a substantial contributionfrom solid fuel burning throughout the evening period whichled to enhanced loadings due to SFOA between 19:00 andmidnight.
It is interesting to note that both BC mixing state andOOA/POA, which reflect the particle ageing process, contin-ued to increase throughout the afternoon and evening despiteadditional significant fresh sources of solid fuel burning con-tributing in the late afternoon. Changes in the depth of theboundary layer, transport to the site and humidity during theday may all affect atmospheric processing times during theday and may contribute to the enhanced OOA/POA through-out the afternoon/evening period. However, the increasedBC mixing efficiency and OOA/POA observed in the late af-ternoon may also partly result from different source specificcharacteristics. For example, Schwarz et al. (2008) reportedthat the BC mixing state was considerably higher for biomassburning than urban emissions. The organic aerosols emittedfrom wood burning have been shown to have a considerablyhigh degree of oxygenation (Weimer et al., 2008; Dinar et al.,2006). The enhanced initial BC mixing state and OOA/POAfrom the source of solid fuel burning may partly explain theaerosol properties seen in the late afternoon.
We have shown that this site was influenced by multi-ple sources and we have investigated the extent to whichthe characteristics of primary aerosols from different sourcescan be individually identified. The emission factors of1.61 µgHOA/µgC or 1.96 µgSFOA/µgC are deduced by a bi-linear regression as discussed above. Lanz et al. (2007) re-ported a POA/BC of 1.1±0.1 in summer at an urban back-ground site in Zurich, Switzerland, where the POA was froma combination of sources including traffic, wood burning,charbroiling and a minor component derived from food cook-ing. A ratio of HOA/BC 1.41±0.22 was reported by Zhanget al. (2005) in Pittsburgh in the northeast of US The otherreported values of POA/BC include a model based value of1.4 (Yu et al., 2004) and a further study based on emissioninventories that derived a value of 1.2 (Cabada et al., 2002).The source specific POA/BC emission factors are rarely re-ported in previous studies. The HOA/BC and SFOA/BC re-ported in this study are generally comparable to the previ-ously reported POA/BC, but are slightly higher. This mightbe due to systematic differences in quantifying the BC mass,as most of the previous studies measured the BC mass usingOC/EC method (Turpin et al., 1990) rather than quantifyingthe refractory BC mass as was done in this study. This studyshows a higher OA/BC emission factor for solid fuel burn-ing than urban emission, which is consistent with the resultsby Clarke et al. (2007), who studied freshly formed plumesfrom biomass burning and urban emission from an aircraftplatform, observing a higher fraction of organic materials inthe biomass burning plumes.
www.atmos-chem-phys.net/11/1603/2011/ Atmos. Chem. Phys., 11, 1603–1619, 2011
1614 D. Liu et al.: Carbonaceous aerosols contributed by traffic and solid fuel burning
4.2 Aerosol optical properties
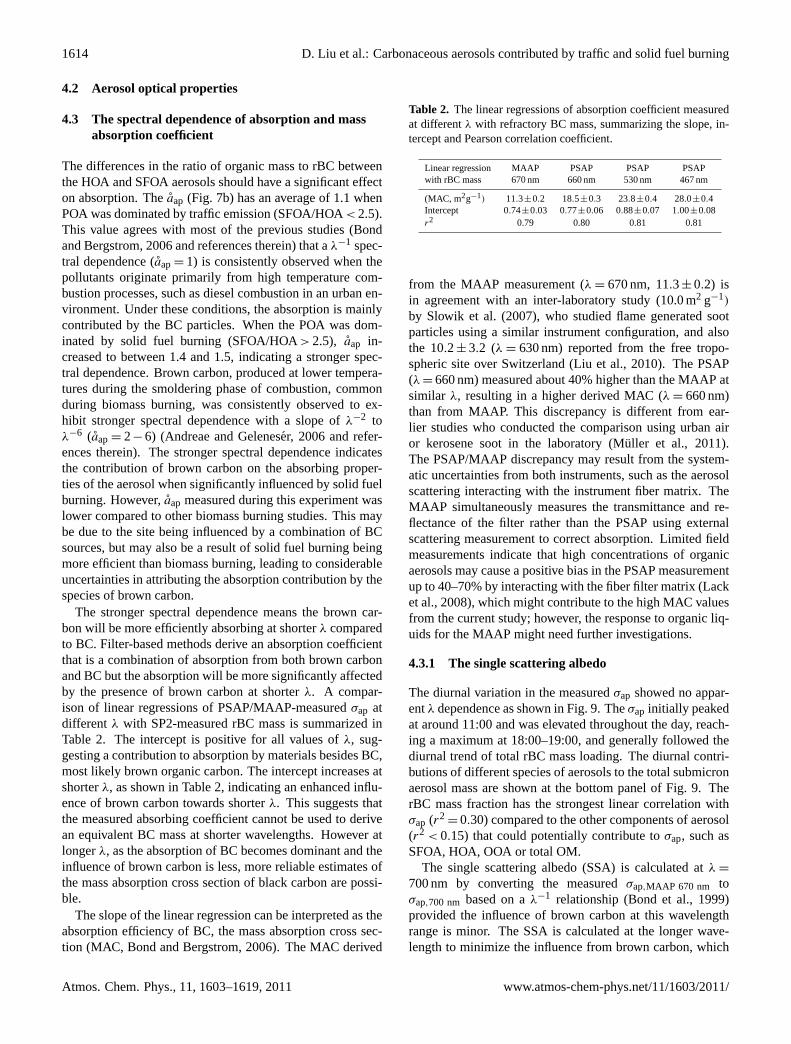
4.3 The spectral dependence of absorption and massabsorption coefficient
The differences in the ratio of organic mass to rBC betweenthe HOA and SFOA aerosols should have a significant effecton absorption. Theaap (Fig. 7b) has an average of 1.1 whenPOA was dominated by traffic emission (SFOA/HOA< 2.5).This value agrees with most of the previous studies (Bondand Bergstrom, 2006 and references therein) that aλ−1 spec-tral dependence (aap= 1) is consistently observed when thepollutants originate primarily from high temperature com-bustion processes, such as diesel combustion in an urban en-vironment. Under these conditions, the absorption is mainlycontributed by the BC particles. When the POA was dom-inated by solid fuel burning (SFOA/HOA> 2.5), aap in-creased to between 1.4 and 1.5, indicating a stronger spec-tral dependence. Brown carbon, produced at lower tempera-tures during the smoldering phase of combustion, commonduring biomass burning, was consistently observed to ex-hibit stronger spectral dependence with a slope ofλ−2 toλ−6 (aap= 2−6) (Andreae and Geleneser, 2006 and refer-ences therein). The stronger spectral dependence indicatesthe contribution of brown carbon on the absorbing proper-ties of the aerosol when significantly influenced by solid fuelburning. However,aap measured during this experiment waslower compared to other biomass burning studies. This maybe due to the site being influenced by a combination of BCsources, but may also be a result of solid fuel burning beingmore efficient than biomass burning, leading to considerableuncertainties in attributing the absorption contribution by thespecies of brown carbon.
The stronger spectral dependence means the brown car-bon will be more efficiently absorbing at shorterλ comparedto BC. Filter-based methods derive an absorption coefficientthat is a combination of absorption from both brown carbonand BC but the absorption will be more significantly affectedby the presence of brown carbon at shorterλ. A compar-ison of linear regressions of PSAP/MAAP-measuredσap atdifferent λ with SP2-measured rBC mass is summarized inTable 2. The intercept is positive for all values ofλ, sug-gesting a contribution to absorption by materials besides BC,most likely brown organic carbon. The intercept increases atshorterλ, as shown in Table 2, indicating an enhanced influ-ence of brown carbon towards shorterλ. This suggests thatthe measured absorbing coefficient cannot be used to derivean equivalent BC mass at shorter wavelengths. However atlongerλ, as the absorption of BC becomes dominant and theinfluence of brown carbon is less, more reliable estimates ofthe mass absorption cross section of black carbon are possi-ble.
The slope of the linear regression can be interpreted as theabsorption efficiency of BC, the mass absorption cross sec-tion (MAC, Bond and Bergstrom, 2006). The MAC derived
Table 2. The linear regressions of absorption coefficient measuredat differentλ with refractory BC mass, summarizing the slope, in-tercept and Pearson correlation coefficient.
Linear regression MAAP PSAP PSAP PSAPwith rBC mass 670 nm 660 nm 530 nm 467 nm
(MAC, m2g−1) 11.3±0.2 18.5±0.3 23.8±0.4 28.0±0.4Intercept 0.74±0.03 0.77±0.06 0.88±0.07 1.00±0.08r2 0.79 0.80 0.81 0.81
from the MAAP measurement (λ = 670 nm, 11.3± 0.2) isin agreement with an inter-laboratory study (10.0 m2 g−1)
by Slowik et al. (2007), who studied flame generated sootparticles using a similar instrument configuration, and alsothe 10.2± 3.2 (λ = 630 nm) reported from the free tropo-spheric site over Switzerland (Liu et al., 2010). The PSAP(λ = 660 nm) measured about 40% higher than the MAAP atsimilar λ, resulting in a higher derived MAC (λ = 660 nm)than from MAAP. This discrepancy is different from ear-lier studies who conducted the comparison using urban airor kerosene soot in the laboratory (Muller et al., 2011).The PSAP/MAAP discrepancy may result from the system-atic uncertainties from both instruments, such as the aerosolscattering interacting with the instrument fiber matrix. TheMAAP simultaneously measures the transmittance and re-flectance of the filter rather than the PSAP using externalscattering measurement to correct absorption. Limited fieldmeasurements indicate that high concentrations of organicaerosols may cause a positive bias in the PSAP measurementup to 40–70% by interacting with the fiber filter matrix (Lacket al., 2008), which might contribute to the high MAC valuesfrom the current study; however, the response to organic liq-uids for the MAAP might need further investigations.
4.3.1 The single scattering albedo
The diurnal variation in the measuredσap showed no appar-entλ dependence as shown in Fig. 9. Theσap initially peakedat around 11:00 and was elevated throughout the day, reach-ing a maximum at 18:00–19:00, and generally followed thediurnal trend of total rBC mass loading. The diurnal contri-butions of different species of aerosols to the total submicronaerosol mass are shown at the bottom panel of Fig. 9. TherBC mass fraction has the strongest linear correlation withσap (r2
= 0.30) compared to the other components of aerosol(r2 < 0.15) that could potentially contribute toσap, such asSFOA, HOA, OOA or total OM.
The single scattering albedo (SSA) is calculated atλ =
700 nm by converting the measuredσap,MAAP 670 nm toσap,700 nm based on aλ−1 relationship (Bond et al., 1999)provided the influence of brown carbon at this wavelengthrange is minor. The SSA is calculated at the longer wave-length to minimize the influence from brown carbon, which
Atmos. Chem. Phys., 11, 1603–1619, 2011 www.atmos-chem-phys.net/11/1603/2011/

D. Liu et al.: Carbonaceous aerosols contributed by traffic and solid fuel burning 1615
0.12
0.10
0.08
0.06
0.04
Mas
s fr
acti
on
s
2015105Hours of day
6
4
2Ab
sorp
tio
n
coef
fici
ent
(Mm
-1)
0.35
0.30
0.25
OM
mass fractio
n
0.90
0.85
0.80
0.75
0.70
SS
A70
0nm
0.12
0.08
0.04rBC
mas
s
load
ing
(µg
m-3
)
OOA HOASFOArBC Total OM
530nm467nm
660nm
670nm
rBC contributed by HOA BBOA
Fig. 9. Panels from top to bottom: rBC mass contributed by trafficand solid fuel burning; the single scattering albedo (SSA) atλ =
700 nm derived from the nephelometer (λ = 700 nm) and MAAP(λ = 670 nm) measurements; the absorption coefficients at differentλ; the diurnal variations in the mass fractions of OOA, HOA, SFOA,rBC and OM (on the right axis). The lines show the median value,and the error bars associated with SSA700 nmdenote the 25% and75 percentiles.
is typically greater at shorter wavelengths. In Sect. 4.2.1the MAC values calculated using the MAAP at 670 nm weremore consistent with literature values than those of the PSAPat 660 nm. Given this, we will present the SSA derived onlyfrom the MAAP measurements in this section. It is shownthat the diurnal cycle of SSA is significantly modulated byσap – the two lowest values of SSA700 nm (0.79±0.06 and0.75± 0.05) correspond to the first and second maxima inσap. The BC mass fraction is anti-correlated with the SSA asexpected, given thatσap is mainly modulated by the BC massfraction. The derived contributions to rBC from SFOA andHOA sources are shown in the top panel of Fig. 9. The morn-ing minimum in SSA was predominately a result of BC fromurban emission whereas the late afternoon minimum SSAwas derived from a combination of traffic and solid fuel burn-ing. The SSA reached a maximum during the night, whenaged particles were dominant and the rBC mass fraction waslow.
A modelling study by Tsyro et al. (2007) reported a var-ied EC mass fraction of 3–15% in PM2.5 across Europe us-ing the 2002–2004 emission inventory, and simulated highermass fraction in the populated residential or commercial re-gions, which agrees well with the observations in this study.Although both the BC mass andσap at this site are lower bya factor of about 5 compared to the urban study conducted inMexico City (Baumgardner et al., 2007), the BC mass frac-tion of between 0.03 and 0.16 reported in this study is consis-tent with that measured in Mexico City (0.03–0.25). Further-more, the range of SSA reported in this study (0.74–0.98)also falls within a similar range to that reported by Baum-gardner et al. (2007) (0.72–0.91). This suggests the SSA issignificantly modulated by the BC mass fraction rather thanthe absolute loadings of BC.
Figure 10a shows the relationship between the SSA700 nmand rBC mass fraction for the whole data set. SSA is anti-correlated with rBC mass fraction. There is also evidencethat SSA is associated with BC mixing state. It is shownthat the majority of the BC particles with mixing efficiency> 0.28 (the red dots) have an rBC mass fraction of< 0.05,and an SSA700 nm of > 0.78 (Fig. 10b). These particleswere mainly observed during the night, when the contribu-tion from fresh emissions was at its minimum and the aerosolpopulation was dominated by the regional background. Thevariation of SSA from 0.78–0.99 during this time shows littledependence on the rBC mass fraction.
Figure 10a also shows that the lower values of SSA700 nm(< 0.76) are associated with the particles with BC mass frac-tion > 0.05 and lower BC mixing efficiency (< 0.22). Theseparticles were largely influenced by fresh sources from bothtraffic emission and solid fuel burning. However, a fractionof BC particles with lower mixing efficiency had a higherSSA, leading to a wide range of SSAs for a given BC mixingefficiency (Fig. 10b). These particles may have experiencedcloud/precipitation scavenging processes during which BCparticles with substantial coatings were preferably wet re-moved. When the BC mixing efficiency< 0.22, the SSAis very dependent on the BC mass fraction, suggesting theimportance of BC incorporation/removal on modulating theSSA700 nm.
5 Summary
This study characterizes sub-micron, carbonaceous aerosolsat a hill top site, Holme Moss, immediately downwind ofa major conurbation in the UK during the wintertime of2006 using a series of in-situ measurements. Non-refractoryaerosol component mass was measured using an AerodyneAerosol Mass Spectrometer. Refractory black carbon (rBC)mass was measured using a Single Particle Soot Photome-ter (SP2) which was also able to characterize the extentto which black carbon particles were mixed with coated
www.atmos-chem-phys.net/11/1603/2011/ Atmos. Chem. Phys., 11, 1603–1619, 2011

1616 D. Liu et al.: Carbonaceous aerosols contributed by traffic and solid fuel burning
1.0
0.9
0.8
0.7
0.6
0.5
SS
A70
0nm
0.60.40.20.0BC mixing efficiency
0.10
0.08
0.06
0.04
rBC
mass fraction
B
Fig. 10. (A)SSA700 nmcorrelated with rBC mass fraction colouredwith BC mixing efficiency;(B) SSA700 nmcorrelated with BC mix-ing efficiency coloured with rBC mass fraction.
material. These data were used to probe the impact varia-tions in sources had on the optical properties of the aerosol.
Positive matrix factorization was applied to the time se-ries of the particle organic mass spectra measured by theAMS. This demonstrated that besides the organic aerosol thatwas secondary in nature (oxygenated organic aerosol, OOA),there was a significant contribution of primary organicaerosols (POA). PMF identified two factors which were in-terpreted to be primary: traffic combustion related aerosols(hydrocarbon-like organic aerosol, HOA) and the solid fuelburning particles (solid fuel organic aerosol, SFOA), the lat-ter resulting from residential space heating. The diurnalvariability of the aerosol components and derived factors
indicated this site began to be influenced by fresh urban out-flow from the upwind city of Manchester in the late morningand the more localized sources of solid fuel burning becamesignificant from late afternoon through the early part of thenight.
The concentrations of rBC aerosols were associated withthe emission of POA from both sources, showing two peaksin the diurnal cycle of 150± 30 ng m−3 in the late morn-ing and 270± 50 ng m−3 in the late afternoon. Schaap etal. (2004) modeled rBC concentrations and showed BC con-centrations ranged from 50 ng m−3 in remote regions to morethan 1000 ng m−3 over densely populated urban areas overEurope, consistent with our data. A bilinear fit of the HOAand SFOA to the rBC time series was used to attribute thecontribution of the different sources to the total rBC. Emis-sion factors of 1.61 µgHOA/µgC and 1.96 µgSFOA/µgC werederived for traffic emission and solid fuel burning respec-tively. Similar differences in the absorbing properties werealso observed during periods when one or the other sourcedominated. The peak in the absorbingAngstrom coeffi-cient was higher (1.4–1.5) when solid fuel sources dominatedthe primary aerosol compared to traffic-related sources (1.1).This is consistent with previous studies showing that biomassburning emissions frequently contain a substantial amount ofbrown carbon particles that absorb the light more efficientlyat shorter wavelength (Andreae and Geleneser 2006, and ref-erences therein). This highlights the importance of incorpo-rating the measurement of absorbing organic carbon into theglobal models, as suggested by Koch et al. (2009).
The rBC mass contributed 3–16% of the total measuredsubmicron aerosol mass in this study. The SSA atλ =
700 nm was shown to be significantly influenced by and anti-correlated to the mass fraction of rBC. Given the highest con-tributions to the BC in Europe are from motor vehicles andresidential combustion of solid fuels (Schaap et al., 2004;Kupiainen and Klimont, 2007), the emissions from thesesources are likely to provide the largest uncertainty in theEuropean BC budget (Tsyro et al., 2007). It is therefore im-portant to provide information on the spatial and temporalvariations of BC from both transport and residential combus-tion sources to constrain models and evaluate regional radia-tion budgets.
Periods when the fraction of rBC with significant coatingwas enhanced were observed to be largely associated withperiods of higher SSA, and most of these particles were ob-served at night and resulted from the regional backgroundand were aged. The fraction of rBC particles with thickcoatings decreased significantly during periods dominated byfresh sources, when the SSA was only weakly dependent onthe rBC mixing efficiency but showed a strong dependenceon the BC mass fraction. Changes in the BC wet scaveng-ing rate have a noticeable effect on the modeled concentra-tion (Vignati et al., 2010) over Europe, leading to an uncer-tainty of 5–25% on concentrations for most of the regionsand 30–40% in remote areas (Tsyro et al., 2007). However,
Atmos. Chem. Phys., 11, 1603–1619, 2011 www.atmos-chem-phys.net/11/1603/2011/
D. Liu et al.: Carbonaceous aerosols contributed by traffic and solid fuel burning 1617
the dependence of the atmospheric removal of BC on its mix-ing state is at present insufficiently understood (Koch et al.,2009). Measurements of BC mixing state such as those con-ducted in this work may provide insights into BC removalprocesses associated with the radiative forcing effects in thefuture.
Supplementary material related to thisarticle is available online at:http://www.atmos-chem-phys.net/11/1603/2011/acp-11-1603-2011-supplement.pdf.
Acknowledgements.The work was supported by the Natural Envi-ronment Research Council ADIENT project NE/E011101/1. TheNERC National Centre for Atmospheric Science (NCAS) Facilityfor Ground Atmospheric Measurements (FGAM) supported someof the instrumentation. Funding for E. Andrews and J. Ogren toparticipate in this project was supplied by DOE’s ASP programunder grant# DE-A102-05ER63996. DOE’s Pacific NorthwestNational Laboratory, under the auspices of the ASP program, alsoloaned some of the instruments used during the project.
Edited by: A. Petzold
References
Alfarra, M. R., Prevot, A. S. H., Szidat, S., Sandradewi, J., Weimer,S., Lanz, V. A., Schreiber, D., Mohr, M., and Baltensperger, U.:Identification of the mass spectral signature of organic aerosolsfrom wood burning emissions, Environ. Sci. Technol., 41, 5770–5777,doi:10.1021/Es062289b, 2007.
Allan, J. D., Alfarra, M. R., Bower, K. N., Williams, P. I., Gal-lagher, M. W., Jimenez, J. L., McDonald, A. G., Nemitz, E.,Canagaratna, M. R., Jayne, J. T., Coe, H., and Worsnop, D.R.: Quantitative sampling using an aerodyne aerosol mass spec-trometer – 2. Measurements of fine particulate chemical compo-sition in two UK Cities, J. Geophys. Res.-Atmos., 108, 4091,doi:10.1029/2002JD002359, 2003.
Allan, J. D., Coe, H., Bower, K. N., Alfarra, M. R., Delia, A.E., Jimenez, J. L., Middlebrook, A. M., Drewnick, F., Onasch,T. B., Canagaratna, M. R., Jayne, J. T., and Worsnop, D. R.:A generalised method for the extraction of chemically resolvedmass spectra from aerodyne aerosol mass spectrometer data, J.Aerosol. Sci., 35, 909–922, 2004.
Allan, J. D., Williams, P. I., Morgan, W. T., Martin, C. L., Flynn,M. J., Lee, J., Nemitz, E., Phillips, G. J., Gallagher, M. W., andCoe, H.: Contributions from transport, solid fuel burning andcooking to primary organic aerosols in two UK cities, Atmos.Chem. Phys., 10, 647–668,doi:10.5194/acp-10-647-2010, 2010.
Anderson, T. L., Covert, D. S., Marshall, S. F., Laucks, M. L.,Charlson, R. J., Waggoner, A. P., Ogren, J. A., Caldow, R., Holm,R. L., Quant, F. R., Sem, G. J., Wiedensohler, A., Ahlquist, N. A.,Bates, T. S.: Performance Characteristics of a High-Sensitivity,Three-Wavelength, Total Scatter/Backscatter Nephelometer. J.Atmos. Oceanic Technol., 13, 967-986, 1996.
Andreae, M. O. and Gelencser, A.: Black carbon or brown car-bon? The nature of light-absorbing carbonaceous aerosols, At-
mos. Chem. Phys., 6, 3131–3148,doi:10.5194/acp-6-3131-2006,2006.
Baumgardner, D., Kok, G., and Raga, G.: Warming of the Arcticlower stratosphere by light absorbing particles, Geophys. Res.Lett., 31, L06117,doi:10.1029/2003GL018883, 2004.
Baumgardner, D., Kok, G. L., and Raga, G. B.: On the diur-nal variability of particle properties related to light absorbingcarbon in Mexico City, Atmos. Chem. Phys., 7, 2517–2526,doi:10.5194/acp-7-2517-2007, 2007.
Beswick, K. M., Choularton, T. W., Inglis, D. W. F., Dore, A. J., andFowler, D.: Influences on long-term trends in ion concentrationand deposition at Holme Moss, Atmos. Environ., 37, 1927–1940,2003.
Bond, T. C.: Spectral dependence of visible light absorption bycarbonaceous particles emitted from coal combustion, Geophys.Res. Lett., 28, 4075–4078, 2001.
Bond, T. C., Anderson, T. L., and Campbell, D.: Calibration andintercomparison of filter-based measurements of visible light ab-sorption by aerosols, Aerosol Sci. Tech., 30, 582–600, 1999.
Cabada, J. C., Pandis, S. N., and Robinson, A. L.: Sources of atmo-spheric carbonaceous particulate matter in Pittsburgh, Pennsyl-vania, J. Air Waste Manag. Assoc., 52(6), 732–741, 2002.
Canagaratna, M. R., Jayne, J. T., Jimenez, J. L., Allan, J. D., Al-farra, M. R., Zhang, Q., Onasch, T. B., Drewnick, F., Coe, H.,Middlebrook, A., Delia, A., Williams, L. R., Trimborn, A. M.,Northway, M. J., DeCarlo, P. F., Kolb, C. E., Davidovits, P., andWorsnop, D. R.: Chemical and microphysical characterizationof ambient aerosols with the aerodyne aerosol mass spectrome-ter, Mass Spectrom. Rev., 26, 185–222, 2007.
Capes, G., Johnson, B., McFiggans, G., Williams, P. I., Haywood,J., and Coe, H.: Aging of biomass burning aerosols over westAfrica: Aircraft measurements of chemical composition, mi-crophysical properties, and emission ratios, J. Geophys. Res.-Atmos., 113, D00C15,doi:10.1029/2008jd009845, 2008.
Chu, S.: Stable estimate of primary OC/EC ratios in the EC tracermethod, Atmos. Environ., 39, 8, 1383–1392, 2005.
Clarke, A., McNaughton, C., Kapustin, V., Shinozuka, Y., Howell,S., Dibb, J., Zhou J., Anderson, B., Brekhovskikh, V., Turner, H.,Pinkerton, M.: Biomass burning and pollution aerosol over NorthAmerica: Organic components and their influence on spectraloptical properties and humidification response, J. Geophys. Res.,112, D12S18,doi:10.1029/2006JD007777, 2007.
Cross, E. S., Slowik, J., Davidovits, P., Allan, J., Worsnop, D.,Jayne, J., Lewis, D., Canagaratna, M., and Onasch, T.: Labora-tory and ambient particle density determinations using light scat-tering in conjunction with aerosol mass spectrometry, AerosolSci. Tech., 41(4), 343–359, 2007.
Dinar, E., Mentel, T. F., and Rudich, Y.: The density of humic acidsand humic like substances (HULIS) from fresh and aged woodburning and pollution aerosol particles, Atmos. Chem. Phys., 6,5213–5224,doi:10.5194/acp-6-5213-2006, 2006.
Drewnick, F., Hings, S., DeCarlo, P., Jayne, J. T., Gonin, M., Fuhrer,K., Weimer, S., Jimenez, J. L., Demerjian, K. L., Borrmann, S.,and Worsnop, D. R.: A New Time-of-Flight Aerosol Mass Spec-trometer (TOF-AMS) – Instrument Description and First FieldDeployment, Aerosol Sci. Tech., 39, 7, 637–658, 2005.
Huffman, J. A., Docherty, K. S., Mohr, C., Cubison, M. J., Ul-brich, I. M., Ziemann, P. J., Onasch, T. B., and Jimenez, J. L.:Chemically-resolved volatility measurements of organic aerosol
www.atmos-chem-phys.net/11/1603/2011/ Atmos. Chem. Phys., 11, 1603–1619, 2011

1618 D. Liu et al.: Carbonaceous aerosols contributed by traffic and solid fuel burning
from different sources, Environ. Sci. Technol., 43, 5351–5357,doi:10.1021/es803539d, 2009.
Jimenez, J. L., Canagaratna, M. R., Donahue, N. M., Prevot, A. S.H., Zhang, Q., Kroll, J. H., DeCarlo, P. F., Allan, J. D., Coe,H., Ng, N. L., Aiken, A. C., Docherty, K. S., Ulbrich, I. M.,Grieshop, A. P., Robinson, A. L., Duplissy, J., Smith, J. D., Wil-son, K. R., Lanz, V. A., Hueglin, C., Sun, Y. L., Tian, J., Laak-sonen, A., Raatikainen, T., Rautiainen, J., Vaattovaara, P., Ehn,M., Kulmala, M., Tomlinson, J. M., Collins, D. R., Cubison, M.J., E., Dunlea, J., Huffman, J. A., Onasch, T. B., Alfarra, M. R.,Williams, P. I., Bower, K., Kondo, Y., Schneider, J., Drewnick,F., Borrmann, S., Weimer, S., Demerjian, K., Salcedo, D., Cot-trell, L., Griffin, R., Takami, A., Miyoshi, T., Hatakeyama, S.,Shimono, A., Sun, J. Y., Zhang, Y. M., Dzepina, K., Kimmel,J. R., Sueper, D., Jayne, J. T., Herndon, S. C., Trimborn, A.M., Williams, L. R., Wood, E. C., Middlebrook, A. M., Kolb,C. E., Baltensperger, U., and Worsnop, D. R.: Evolution of Or-ganic Aerosols in the Atmosphere, Science, 326, 1525–1529,doi:10.1126/science.1180353, 2009.
Jordan, T. B., Seen, A. J., and Jacobsen, G. E.: Levoglucosan as anatmospheric tracer for wood smoke, Atmos. Environ., 40, 5316–5321,doi:10.1016/j.atmosenv.2006.03.023, 2006.
Kirchstetter, T. W., Novakov, T., and Hobbs, P. V.: Evidencethat the spectral dependence of light absorption by aerosols isaffected by organic carbon, J. Geophys. Res., 109, D21208,doi:10.1029/2004JD004999, 2004.
Kittelson, D. B.: Engines and nanoparticles: A review, J. AerosolSci., 29, 575–588, 1998.
Koch, D., Schulz, M., Kinne, S., McNaughton, C., Spackman, J.R., Balkanski, Y., Bauer, S., Berntsen, T., Bond, T. C., Boucher,O., Chin, M., Clarke, A., De Luca, N., Dentener, F., Diehl, T.,Dubovik, O., Easter, R., Fahey, D. W., Feichter, J., Fillmore, D.,Freitag, S., Ghan, S., Ginoux, P., Gong, S., Horowitz, L., Iversen,T., Kirkevag, A., Klimont, Z., Kondo, Y., Krol, M., Liu, X.,Miller, R., Montanaro, V., Moteki, N., Myhre, G., Penner, J. E.,Perlwitz, J., Pitari, G., Reddy, S., Sahu, L., Sakamoto, H., Schus-ter, G., Schwarz, J. P., Seland, Ø., Stier, P., Takegawa, N., Take-mura, T., Textor, C., van Aardenne, J. A., and Zhao, Y.: Evalu-ation of black carbon estimations in global aerosol models, At-mos. Chem. Phys., 9, 9001–9026,doi:10.5194/acp-9-9001-2009,2009.
Kondo, Y., Komazaki, Y., Miyazaki, Y., Moteki, N., Takegawa, N.,Kodama, D., Deguchi, S., Nogami, M., Fukuda, M., Miyakawa,T., Morino, Y., Koike, M., Sakurai, H., and Ehara, K.: Temporalvariations of elemental carbon in Tokyo, J. Geophys. Res., 111,D12205,doi:10.1029/2005JD006257, 2006.
Kupiainen, K. and Klimont, Z.: Primary emissions of fine car-bonaceous particles in Europe, Atmos. Environ., 41, 2156–2170,2007.
Lack, D. A., Cappa, C. D., Covert, D. S., Baynard, T., Massoli,P., Sierau, B., Bates, T. S., Quinn, P. K., Lovejoy, E. R., andRavishankara, A. R.: Bias in filter-based aerosol light absorptionmeasurements due to organic aerosol loading: Evidence fromambient measurements, Aerosol Sci. Technol., 42, 1033–1041,doi:f10.1080/02786820802389277, 2008.
Lanz, V. A., Alfarra, M. R., Baltensperger, U., Buchmann, B.,Hueglin, C., and Prevot, A. S. H.: Source apportionment ofsubmicron organic aerosols at an urban site by factor analyti-cal modelling of aerosol mass spectra, Atmos. Chem. Phys., 7,
1503–1522,doi:10.5194/acp-7-1503-2007, 2007.Liu, D., Flynn, M., Gysel, M., Targino, A., Crawford, I., Bower,
K., Choularton, T., Juranyi, Z., Steinbacher, M., Huglin, C., Cur-tius, J., Kampus, M., Petzold, A., Weingartner, E., Baltensperger,U., and Coe, H.: Single particle characterization of black car-bon aerosols at a tropospheric alpine site in Switzerland, Atmos.Chem. Phys., 10, 7389–7407,doi:10.5194/acp-10-7389-2010,2010.
McFiggans, G., Alfarra, M. R., Allan, J., Bower, K., Coe, H., Cu-bison, M., Topping, D., Williams, P., Decesari, S., Facchini, C.,and Fuzzi, S.: Simplification of the representation of the organiccomponent of atmospheric particulates, Faraday Discuss., 130,341–362, 2005.
Morgan, W. T., Allan, J. D., Bower, K. N., Esselborn, M., Har-ris, B., Henzing, J. S., Highwood, E. J., Kiendler-Scharr, A.,McMeeking, G. R., Mensah, A. A., Northway, M. J., Osborne,S., Williams, P. I., Krejci, R., and Coe, H.: Enhancement of theaerosol direct radiative effect by semi-volatile aerosol compo-nents: airborne measurements in North-Western Europe, Atmos.Chem. Phys., 10, 8151–8171,doi:10.5194/acp-10-8151-2010,2010.
Morino, Y., Kondo, Y., Takegawa, N., Miyazaki, Y., Kita, K.,Komazaki, Y., Fukuda, M., Miyakawa, T., Moteki, N., andWorsnop, D. R.: Partitioning of HNO3 and particulate nitrateover tokyo: Effect of vertical mixing, J. Geophys. Res.-Atmos.,111, D15215,doi:10.1029/2005jd006887, 2006.
Muller, T., Henzing, J. S., de Leeuw, G., Wiedensohler, A.,Alastuey, A., Angelov, H., Bizjak, M., Collaud Coen, M., En-gstrom, J. E., Gruening, C., Hillamo, R., Hoffer, A., Imre, K.,Ivanow, P., Jennings, G., Sun, J. Y., Kalivitis, N., Karlsson, H.,Komppula, M., Laj, P., Li, S.-M., Lunder, C., Marinoni, A., Mar-tins dos Santos, S., Moerman, M., Nowak, A., Ogren, J. A., Pet-zold, A., Pichon, J. M., Rodriquez, S., Sharma, S., Sheridan,P. J., Teinila, K., Tuch, T., Viana, M., Virkkula, A., Weingart-ner, E., Wilhelm, R., and Wang, Y. Q.: Characterization and in-tercomparison of aerosol absorption photometers: result of twointercomparison workshops, Atmos. Meas. Tech., 4, 245-268,doi:10.5194/amt-4-245-2011, 2011.
National atmospheric emissions inventory (NAEI): available at:http://www.naei.org.uk, last access: 4 August 2009.
Ng, N. L., Canagaratna, M. R., Zhang, Q., Jimenez, J. L., Tian,J., Ulbrich, I. M., Kroll, J. H., Docherty, K. S., Chhabra, P. S.,Bahreini, R., Murphy, S. M., Seinfeld, J. H., Hildebrandt, L.,Donahue, N. M., DeCarlo, P. F., Lanz, V. A., Prevot, A. S. H.,Dinar, E., Rudich, Y., and Worsnop, D. R.: Organic aerosolcomponents observed in Northern Hemispheric datasets fromAerosol Mass Spectrometry, Atmos. Chem. Phys., 10, 4625–4641,doi:10.5194/acp-10-4625-2010, 2010.
Paatero, P.: Least squares formulation of robust non-negative factoranalysis, Chemometr. Intell. Lab., 37, 23–35, 1997.
Petzold, A. and Schonlinner, M.: Multi-angle absorption photome-try – a new method for the measurement of aerosol light absorp-tion and atmospheric black carbon, J. Aerosol Sci., 35, 421–441,2004.
Ramanathan, V. and Carmichael, G.: Global and regional cli-mate changes due to black carbon, Nature Geosci., 1, 221–227,doi:10.1038/ngeo156, 2008.
Robinson, A. L., Donahue, N. M., Shrivastava, M. K., Weitkamp,E. A., Sage, A. M., Grieshop, A. P., Lane, T. E., Pierce, J. R., and
Atmos. Chem. Phys., 11, 1603–1619, 2011 www.atmos-chem-phys.net/11/1603/2011/

D. Liu et al.: Carbonaceous aerosols contributed by traffic and solid fuel burning 1619
Pandis, S. N.: Rethinking organic aerosols: Semivolatile emis-sions and photochemical aging, Science, 315, 1259–1262, 2007.
Rogge, W. F., Hildemann, L. M., Mazurek, M. A., Cass, G. R., andSimoneit, B. R. T.: Sources of fine organic aerosol, Environ. Sci.Technol., 27(4), 636–651,doi:10.1021/es00041a007, 1993.
Schaap, M., Van Der Gon, H. A. C. D., Dentener, F. J., Visschedijk,A. J. H., Van Loon, M., ten Brink, H. M., Putaud, J.-P., Guil-laume, B., Liousse, C., and Builtjes, P. J. H.: Anthropogenicblack carbon and fine aerosol distribution over Europe, J. Geo-phys. Res., 109, D18207,doi:10.1029/2003JD004330, 2004.
Schneider, J., Hock, N., Weimer, S., and Borrmann, S.: Nucleationparticles in diesel exhaust: Composition inferred from in situmass spectrometric analysis, Environ. Sci. Technol., 39, 6153–6161, 2005.
Schneider, J., Weimer, S., Drewnick, F., Borrmann, S., Helas, G.,Gwaze, P., Schmid, O., Andreae, M. O., and Kirchner, U.: Massspectrometric analysis and aerodynamic properties of varioustypes of combustion-related aerosol particles, Int. J. Mass Spec-trom., 258, 37–49,doi:10.1016/j.ijms.2006.07.008, 2006.
Schwarz, J. P., Gao, R. S., Fahey, D. W., Thomson, D. S., Watts, L.A., Wilson, J. C., Reeves, J. M., Baumgardner, D. G., Kok, G.L., Chung, Schulz, S. M., Hendricks, J., Lauer, A., Karcher, B.,Slowik, J. G., Rosenlof, K. H., Thompson, T. L., Langford, A. O.,Lowenstein, M., and Aikin, K. C.: Single-particle measurementsof midlatitude black carbon and light-scattering aerosols from theboundary layer to the lower stratosphere, J. Geophys. Res., 111,D16207,doi:10.1029/2006JD007076, 2006.
Schwarz, J. P., Gao, R. S., Spackman, J. R., Watts, L. A., Thomson,D. S., Fahey, D. W., Ryerson, T. B., Peischl, J., Holloway, J. S.,Trainer, M., Frost, G. J., Baynard, T., Lack, D. A., de Gouw,J. A., Warneke, C., and Del Negro, L. A.: Measurement of themixing state, mass, and optical size of individual black carbonparticles in urban and biomass burning emissions, Geophys. Res.Lett., 35, L13810,doi:10.1029/2008GL033968, 2008.
Sheridan, P. J., Delene, D. J., and Ogren, J. A.: Four years of con-tinuous surface aerosol measurements from the Department ofEnergy’s Atmospheric Radiation Measurement Program South-ern Great Plains Cloud and Radiation Testbed site, J. Geophys.Res., 106, 20735-20747,doi:10.1029/2001JD000785, 2001.
Simoneit, B. R. T.: Biomass burning – a review of organic tracersfor smoke from incomplete combustion, Appl. Geochem., 17,129–162, 2002.
Slowik, J. G., Cross, E., Han, J., Davidovits, P., Onasch, T. B.,Jayne, J. T., Williams, L. R., Canagaratna, M. R., Worsnop, D.R., Chakrabarty, R. K., Arnott, W. P., Schwarz, J. P., Gao, R. S.,Fahey, D. W., and Kok, G. L.: An intercomparison of instrumentsmeasuring black carbon content of soot particles, Aerosol Sci.Technol., 41, 295-314,doi:10.1080/02786820701197078, 2007.
Smoke control areas:http://www.uksmokecontrolareas.co.uk, lastaccess: 6 April 2009.
Stephens, M., Turner, N., and Sandberg, J.: Particle identificationby laser-induced incandescence in a solidstate laser cavity, Appl.Optics, 42, 3726–3736, 2003.
Tsyro, S., Simpson, D., Tarrason, L., Klimont, Z., Kupiainen,K., Pio, C., and Yttri, K. E.: Modeling of elemental car-bon over Europe, J. Geophys. Res.-Atmos., 112, D23S19,doi:10.1029/2006JD008164, 2007.
Turpin, B. J. and Huntzicker, J. J.: Identification of Secondary Or-ganic Aerosol Episodes and Quantitation of Primary and Sec-ondary Organic Aerosol Concentrations during Scaqs, Atmos.Environ., 29, 3527–3544, 1995.
Turpin, B. J., Cary, R. A., and Huntzicker, J. J.: An in situ,time-resolved analyzer for aerosol organic and elemental carbon,Aerosol Sci. Technol., 12(1), 161–171, 1990.
Ulbrich, I. M., Canagaratna, M. R., Zhang, Q., Worsnop, D. R., andJimenez, J. L.: Interpretation of organic components from Posi-tive Matrix Factorization of aerosol mass spectrometric data, At-mos. Chem. Phys., 9, 2891–2918,doi:10.5194/acp-9-2891-2009,2009.
Vignati, E., Karl, M., Krol, M., Wilson, J., Stier, P., and Cavalli, F.:Sources of uncertainties in modelling black carbon at the globalscale, Atmos. Chem. Phys., 10, 2595–2611,doi:10.5194/acp-10-2595-2010, 2010.
Weimer, S., Alfarra, M. R., Schreiber, D., Mohr, M., Prevot, A. S.H., and Baltensperger, U.: Organic aerosol mass spectral signa-tures from wood-burning emissions: Influence of burning con-ditions and wood type, J. Geophys. Res.-Atmos., 113, D10304,doi:10.1029/2007jd009309, 2008.
Williams, P. I.: Construction and Validation of a DMPS for AerosolCharacterization, PhD thesis, Department of Physics, Manch-ester, UK, UMIST, 1999.
Yu, S., Dennis, R. L., Bhave, P. V., and Eder, B. K.: Primary andsecondary organic aerosols over the United States: estimates onthe basis of observed organic carbon (OC) and elemental carbon(EC), and air quality modeled primary OC/EC ratios, Atmos. En-viron., 38(31), 5257–5268, 2004.
Zhang, Q., Worsnop, D. R., Canagaratna, M. R., and Jimenez, J.L.: Hydrocarbon-like and oxygenated organic aerosols in Pitts-burgh: insights into sources and processes of organic aerosols,Atmos. Chem. Phys., 5, 3289–3311,doi:10.5194/acp-5-3289-2005, 2005.
Zhang, Q., Jimenez, J. L., Canagaratna, M. R., Allan, J. D., Coe,H., Ulbrich, I., Alfarra, M. R., Takami, A., Middlebrook, A.M., Sun, Y. L., Dzepina, K., Dunlea, E., Docherty, K., De-Carlo, P. F., Salcedo, D., Onasch, T., Jayne, J. T., Miyoshi,T., Shimono, A., Hatakeyama, S., Takegawa, N., Kondo, Y.,Schneider, J., Drewnick, F., Borrmann, S., Weimer, S., Demer-jian, K., Williams, P., Bower, K., Bahreini, R., Cottrell, L.,Griffin, R. J., Rautiainen, J., Sun, J. Y., Zhang, Y. M., andWorsnop, D. R.: Ubiquity and dominance of oxygenated speciesin organic aerosols in anthropogenically-influenced NorthernHemisphere midlatitudes, Geophys. Res. Lett., 34, L13801,doi:10.1029/2007GL029979, 2007.
www.atmos-chem-phys.net/11/1603/2011/ Atmos. Chem. Phys., 11, 1603–1619, 2011