regional modeling of carbonaceous aerosols over europe
TRANSCRIPT

HAL Id: hal-00518382https://hal.archives-ouvertes.fr/hal-00518382
Submitted on 3 Aug 2021
HAL is a multi-disciplinary open accessarchive for the deposit and dissemination of sci-entific research documents, whether they are pub-lished or not. The documents may come fromteaching and research institutions in France orabroad, or from public or private research centers.
L’archive ouverte pluridisciplinaire HAL, estdestinée au dépôt et à la diffusion de documentsscientifiques de niveau recherche, publiés ou non,émanant des établissements d’enseignement et derecherche français ou étrangers, des laboratoirespublics ou privés.
Distributed under a Creative Commons Attribution - NonCommercial| 4.0 InternationalLicense
Regional modeling of carbonaceous aerosols overEurope-focus on secondary organic aerosols
Bertrand Bessagnet, Laurent Menut, Gabriele Curci, Alma Hodzic, BrunoGuillaume, Catherine Liousse, Sophie Moukhtar, Betty Pun, Christian
Seigneur, Michael Schulz
To cite this version:Bertrand Bessagnet, Laurent Menut, Gabriele Curci, Alma Hodzic, Bruno Guillaume, et al.. Re-gional modeling of carbonaceous aerosols over Europe-focus on secondary organic aerosols. Journalof Atmospheric Chemistry, Springer Verlag, 2009, 61 (3), pp.175-202. �10.1007/s10874-009-9129-2�.�hal-00518382�

Regional modeling of carbonaceous aerosolsover Europe—focus on secondary organic aerosols
Bertrand Bessagnet · Laurent Menut · Gabriele Curci · Alma Hodzic ·
Bruno Guillaume · Catherine Liousse · Sophie Moukhtar · Betty Pun ·
Christian Seigneur · Michaël Schulz
Abstract In this study, an improved and complete secondary organic aerosols (SOA)chemistry scheme was implemented in the CHIMERE model. The implementationof isoprene chemistry for SOA significantly improves agreement between long
B. Bessagnet (B)INERIS, Institut National de l’Environnement Industriel et des Risques,Parc technologique ALATA, 60550 Verneuil en Halatte, Francee-mail: [email protected]
L. MenutInstitut P.-S. Laplace, Laboratoire de Météorologie Dynamique,Ecole Polytechnique, 91128 Palaiseau, France
G. CurciCETEMPS, Università degli Studi dell’Aquila,via Vetoio, 67010 Coppito - L’Aquila, Italy
A. HodzicNCAR, National Center for Atmospheric Research,3450 Mitchell Lane, Boulder, 80301, CO, USA
B. Guillaume · C. LiousseLA/OMP, Laboratoire d’Aérologie / Observatoire Midi-Pyrénées,14, avenue Edouard Belin, 31400 Toulouse, France
S. MoukhtarCentre for Atmospheric Chemistry, York University,4700 Keele Street, Toronto, Canada
B. Pun · C. SeigneurAtmospheric & Environmental Research, 2682 Bishop Drive,Suite 120, San Ramon, CA 94583, USA
M. SchulzLaboratoire des Sciences du Climat et de l’Environnement,IPSL/CEA-CNRS-UVSQ, 91190 Gif-sur-Yvette, France
1

series of simulated and observed particulate matter concentrations. While simulatedorganic carbon concentrations are clearly improved at elevated sites by adding theSOA scheme, time correlation are impaired at low level sites in Portugal, Italy andSlovakia. At several sites a clear underestimation by the CHIMERE model is noticedin wintertime possibly due to missing wood burning emissions as shown in previousmodeling studies. In Europe, the CHIMERE model gives yearly average SOAconcentrations ranging from 0.5 µg m−3 in the Northern Europe to 4 µg m−3 overforested regions in Spain, France, Germany and Italy. In addition, our work suggeststhat during the highest fire emission periods, fires can be the dominant source ofprimary organic carbon over the Mediterranean Basin, but the SOA contributionfrom fire emissions is low. Isoprene chemistry has a strong impact on SOA formationwhen using current available kinetic schemes.
Keywords Secondary organic aerosols · Modeling · Isoprene · Monoterpenes ·
Elemental carbon · Organic carbon
1 Introduction
Particulate matter (PM) pollution control is one of the main challenges highlightedby the Thematic Strategy on Air Pollution (CAFE as Clean Air For Europe),adopted by the European Commission in October 2005, under its 6th EnvironmentalAction Program (Decision No 1600/2002/EC of the European Parliament and of theCouncil of July 22, 2002 laying down the Sixth Community Environment ActionProgramme). The CAFE strategy states that particulate matter (and especially fineparticles with diameter smaller than and equal to 2.5 µm - PM2.5) is responsible todayfor an average reduction of life expectancy of about 8 months in Europe: recentepidemiological studies highlight the role of the smallest part of these particles onhealth (Schlesinger 2006; Lee et al. 2007; Heinrich and Slama 2007). Fine particles arecomposed of a large fraction of organic and elemental carbon (OC and EC) that canbe directly injected in the atmosphere (Putaud et al. 2004; Van Dingenen et al. 2004).The so-called secondary organic aerosols (SOA) are formed by chemical reactions ofvolatile organic compounds (VOCs) in the atmosphere including monoterpenes andisoprene emitted by vegetation (Kroll and Seinfeld 2008; Surratt et al. 2006). Whilein winter domestic wood burning emissions are the main sources of OC with sizableadditional contribution from fossil fuel combustion, SOA mainly originating fromnon fossil sources largely contribute to OC in summer. Based on the CARBOSOLmeasurements (Pio et al. 2007; Legrand and Puxbaum 2007; Gelencsér et al. 2007),non fossil sources were expected to represent 63–76% of the total carbon (TC =
OC + EC). Moreover, 50–80% of OC is water soluble and suggests that OC has tobe considered in discussing the role of clouds on climate over Europe (Gelencséret al. 2007; Pio et al. 2007). Humic-like substances (HULIS) are other contributorsof water soluble compounds (3–7%) and are directly emitted by biomass burning andpossibly formed by chemical reactions in the atmosphere (Mayol-Bracero et al. 2002;Graber and Rudich 2006; Lukács et al. 2007; Schmidl et al. 2008; Altieri et al. 2008).Most OC is contained in oligomeric or polymeric matter (Legrand and Puxbaum2007). OC directly emitted by the decomposition of vegetative debris is another
2

source of the organic coarse size fraction (Puxbaum et al. 2003), a contribution of6% was attributed in remote background sites (Bauer et al. 2002). In the frame ofthe CARBOSOL campaign, the modeled EC and OC concentration fields of theEMEP model were compared to measurements. OC was generally underpredictedin most of the sites certainly due to missing wood burning contributions. The modelunderpredicted TC in the southern Europe mainly due to a lack of SOA (Simpsonet al. 2007). For EC, the largest uncertainties probably lie in EC emissions fromresidential wood/fossil combustion possibly associated with both emission factorsand spatial and temporal variation (Tsyro et al. 2007). During a specific modelingintercomparison exercise, a potential large underestimation of carbonaceous speciesconcentrations has been recently reported in Eastern Germany due to underesti-mated sources in Eastern Europe (Stern et al. 2008). Over the United States, therole of isoprene in secondary organic aerosol formation has been extensively studied(Dommen et al. 2006; Kroll et al. 2006; van Donkelaar et al. 2007; Zhang et al.2007). Previous studies suggest a high sensitivity to the values of the enthalpy ofvaporization used in models (Zhang et al. 2007; Henze and Seinfeld 2006). Anothersurvey showed for secondary organic carbon a 30% maximum contribution to thetotal secondary carbon at a southeastern US location (Kleindienst et al. 2007).
Objectives of the study The CHIMERE model was previously validated on PM10,sulfate, nitrate and ammonium components (Bessagnet et al. 2004, 2005; Vautard etal. 2005; Hodzic et al. 2005). In this work, a new SOA scheme has been implementedin CHIMERE, a new emission inventory for biogenic VOC emissions MEGAN hasalso been used. Our work is the first one focussing over Europe by accounting forterpene chemistry including isoprene for SOA formation at high resolution. One ofthe first work on SOA modeling in Europe was done by Schell et al. (2001) withthe SORGAM model. Most of the recent modeling studies did not focus on Europeand/or used low horizontal resolutions with global models (Liao et al. 2007; Tsikaridisand Kanakidou 2007). For instance, in our research field, the most recent relevantmodeling study over Europe with the EMEP model did not account for isoprenechemistry for SOA formation (Simpson et al. 2007). Our work complements theknowledge on SOA modeling in Europe and proposes new insights. A first evaluationof the CHIMERE model is proposed for carbonaceous species by using OC andEC observations from the CARBOSOL and EMEP available data for year 2003.This year was characterized by huge fire emissions in the southern Europe. SOAissued from fire emissions are accounted for in this work. Our work investigates thecontribution of fire emissions on OC concentrations.
2 Usual identified gaps in SOA modeling
SOA modeling remains highly uncertain and too simple, they need to be improvedby adding aqueous and heterogeneous pathways, as well as taking into accountthe multi-step oxidation processes and their dependence on the NOx regime (Punand Seigneur 2007). One important weakness was identified to be the estimate ofbiogenic precursor emissions. A first step towards improving our SOA knowledgeis improvements of the biogenic emission inventories (Simpson et al. 2007; Arneth
3
et al. 2008). Another improvement is the quality of meteorological data feeding themodel. For instance, an underestimation of temperatures implies three kind of issues:(i) an underestimation of total SOA formation because of kinetic rates favored byhigh temperature, (ii) an underestimation of SOA concentrations because of lowerbiogenic emissions, and (iii) an overestimate of gas to particle transfert of semi-volatile SOA. Another work (Shrivastava et al. 2006) suggests that particle emissionfactors could be underestimated because they are calculated at given temperature,relative humidity and dilution ratio in order to avoid artefacts during the samplingprocess. In so doing, a non negligible fraction, the so-called SVOCs (semi-volatileVOCs), may have not been taken into account in current gas and particle emissioninventories when these data are applied for modeling “real” atmospheres. Moreover,recent studies pointed out the possible role of primary SVOCs in SOA formation(Robinson et al. 2007; Donahue et al. 2006; Schauer et al. 2002). These precursorsevaporate during the emission dilution process and could be converted into theparticulate phase after oxidation. The exact physical and chemical pathways tosecondary organic aerosol for most parent hydrocarbons are still uncertain andduring the last ten years, the condensation/sorption process has been adopted inmodels (Pankow 1994; Bowman et al. 1997). Nucleation bursts were observed inrather clean environments such as boreal forest (Kavouras et al. 1998), and in urbanareas, assuming co-nucleation effects with sulfuric acid (Fan et al. 2006). If in ur-ban areas absorption certainly dominates, the issue is still open over forested andremote areas (Svendby et al. 2008; Wexler and Johnston 2008; Bonn and Moortgat2002; Holmes 2007). In clean environment (Arctic), a high amount of dicarboxylicacids such as glutaric, malonic, succinic and glutaric acid was discovered in coarseparticles (Kerminen et al. 1999). These acids were observed in coarse urban andsuburban aerosols corroborating the possible condensation/sorption of semi-volatilespecies onto pre-existing coarse particles in summer (Jaffrezo et al. 2005) or thepossible role of in-cloud processes (Hsieh et al. 2007; Oliveira et al. 2007). Then,the way of modeling gas to particle conversion will have a strong impact on particleconcentrations and compositions. Implementing nucleation processes for SOA inchemistry transport models (not yet available) could shift mass distributions towardssmaller particles.
3 The chemistry transport model CHIMERE
3.1 General description
Given a set of NOx, SOx, NH3, PM, VOCs and CO emissions, the CHIMERE modelcalculates the concentrations of 44 gas-phase and aerosol species (Schmidt et al. 2001;Bessagnet et al. 2004). In this study, a version of CHIMERE for a domain coveringthe western Europe is used: from 14oW to 28oE in longitude and from 35oN to 58.2oNin latitude, with a constant horizontal resolution of 0.4o
× 0.4o. The vertical gridcontains 15 layers from surface to 500 hPa. Improvements have successively beenbrought in previous studies (Vautard et al. 2003, 2005). The model documentationcan be found on the web server http://euler.lmd.polytechnique.fr/chimere. For bothozone and PM10, the model has undergone extensive intercomparisons on aerosol
4

concentrations at European and city scales (Vautard et al. 2007; Van Loon et al.2007; Schaap et al. 2009).
Anthropogenic gas emissions are taken from the EMEP inventory (Vestreng2003). Three particulate model species are considered, PPM (primary particlematerial) that contains only mineral dust anthropogenic in origin, OC and EC.Coarse particles from the EMEP inventory is the only PPM source. Primary OCand EC assumed to be in the fine mode are issued from a specific inventorydiscussed in the next section. Calculation of model species emissions that are usedby the CHIMERE Chemistry Transport Model, is made in several steps. The spatialemission distribution from the original grid to the CHIMERE grid is performed usingan intermediate fine grid with a 0.083o resolution issued from the GLCF dataset(Hansen et al. 2000). Soil types are known on the fine grid allowing for a betterapportionment of the emissions according to urban, rural, maritime and continentalareas. Standard time variation profiles are applied to get hourly emissions fromannual data, as required by the model. The other modeled species are sulfate, nitrate,ammonium, secondary organic aerosol, sea-salt (considered as inert here) and dust.The particle size distribution ranges from about 40 nm to 10 µm and is distributedinto 8 bins. The 8 bins used are defined between the following intervals: 0.039, 0.078,0.156, 0.312, 0.625, 1.25, 2.5, 5, 10 µm. The gas/particle partitioning of the ensembleSulfate/Nitrate/Ammonium is treated by the code ISORROPIA (Nenes et al. 1998)implemented in CHIMERE. For the main gas and aerosols, boundary conditions areissued from a 5-year climatology (2001–2005) of the global model LMDzT-INCA.For aerosol boundary conditions, only elemental and organic carbon, desert dust andsulfate are taken into account. The LMDzT-INCA model contains a multi-modalaerosol distribution (Textor et al. 2006; Schulz et al. 2006), and uses the AeroComemissions (Dentener et al. 2006). Organic and elemental carbon are described asbelonging to a soluble and insoluble accumulation mode, where ageing processestransfer constantly insoluble matter into the soluble aerosol mode.
3.2 Meteorology
The CHIMERE model is driven on a hourly base by the meteorological model MM5for the dynamical parameters (wind, temperature, humidity, pressure). In orderto be consistent with the PREVAIR operational forecast system using MM5 andCHIMERE, the current MM5 configuration (Dudhia 1993) was chosen to be thesame as the one used and validated during the last 3 years for the daily forecast(Honoré et al. 2008). The MM5 vertical grid contains 32 levels ranging from surfaceto 10 hPa. The horizontal resolution is 54 km over a domain encompassing theeuropean CHIMERE domain. The meteorological boundary conditions as well asthe nudging four-dimensional data assimilation (FDDA) are performed with the six-hourly ECMWF analysis meteorological fields.
Temperature is one of the most important variable for SOA formation. Figure 1displays a comparison of MM5 simulated 2-m temperatures against observationsin summertime. Whereas the time evolution is fairly reproduced, a negative biasis observed in all the cities. The lowest temperatures are mainly affected by thisnegative bias. The maximum temperatures are the most underestimated in Milan,for Madrid the predicted 2-m temperatures agree well with observations. Such biasesare often reported in MM5 simulations (Jiménez et al. 2006; Hogrefe et al. 2001).
5

Paris Madrid
Jul. 1 Jul. 15 Aug. 1 Aug. 15 Aug. 31
Date
0
10
20
30
40
2 m
eter
s T
emp
erat
ure
(T
2M
)in
˚C
Obs. max. T2M
Obs. min. T2M
Mod. max. T2M
Mod. min. T2M
Jul. 1 Jul. 15 Aug. 1 Aug. 15 Aug. 31
Date
0
10
20
30
40
2 m
eter
s T
emp
erat
ure
(T
2M
)in
˚C
Obs. max. T2M
Obs. min. T2M
Mod. max. T2M
Mod. min. T2M
Frankfurt Milan
Jul. 1 Jul. 15 Aug. 1 Aug. 15 Aug. 31
Date
0
10
20
30
40
2 m
eter
s T
emp
erat
ure
(T
2M
)in
˚C
Obs. max. T2M
Obs. min. T2M
Mod. max. T2M
Mod. min. T2M
Jul. 1 Jul. 15 Aug. 1 Aug. 15 Aug. 31
Date
0
10
20
30
40
2 m
eter
s T
emp
erat
ure
(T
2M
)in
˚C
Obs. max. T2M
Obs. min. T2M
Mod. max. T2M
Mod. min. T2M
Fig. 1 Evaluation of MM5 predictions for daily minimum and maximum 2-m temperatures inJuly–August 2003. Stations are: Paris (49.00oN,2.52oE), Madrid (40.43oN,−3.68oE), Frankfurt(50.12oN,8.68oE), Milan (45.46oN,9.16oE)
Temperatures were particularly high during the 2003 heat wave in Western Europe,between 35 and 40oC for the maximum temperature within the first decade of August2003. The specific warming process was enhanced by very low soil moisture (Blacket al. 2004). The coarse resolution of the model can explain a part of the bias, whencomparing to surface measurements in sites such as Frankfurt and Milan. Theseurbanized areas are surrounded by mountains or near great lakes, the model willgive an averaged view of the meteorology, certainly not representative of the citylocated inside the corresponding model cell.
3.3 Anthropogenic OC and EC emissions over Europe
A particular effort has been put on primary OC (OCp) and EC emission inven-tories emitted by fossil fuel and biofuel combustion (traffic, industry, residentialsources), which are key elements in EC and OC modeling. These emissions thatare traditionally obtained by bottom-up approaches, are still hampered by severeuncertainties resulting from large differences in the choice of emission factors. Twomajor different approaches for deriving global fossil fuel and biofuel EC and OCpemission inventories are currently available (Junker and Liousse 2008; Bond et al.2004), with the main difference between Junker and Liousse (2008) and Bond et al.(2004) being in technology differentiations. In the following, JUNKER2008 is theinventory described in Junker and Liousse (2008) and BOND2004 the one describedin Bond et al. (2004). At the European scale, detailed inventories are given forEC and OCp emissions in (Schaap et al. 2004). Thus, in BOND2004 each fossilfuel was considered as a detailed list of combustion technologies and emission
6

controls with associated emission factors (EF). In JUNKER2008, for each fuel, twoparameters characterize the emissions: (i) the activity sector (domestic, industrial,traffic), and (ii) the national level of development (with three levels: developed,semi-developed and developing countries). In each of these methods, the part ofuncontrolled emissions is differently handled which is the origin of their largestdifferences. Higher estimated emissions may be found for the major fuels (coal,diesel, peat, lignite, coke) in JUNKER2008 than in BOND2004, with more controlledemissions in BOND2004 than in JUNKER2008. Harmonization between these twoinventory types is in progress at a global scale. A technology-splitting approach hasbeen adopted with the same considerations of emission controls as in Schaap et al.(2004) and in BOND2004, while keeping EF values estimated from JUNKER2008.With such a configuration, both newer combustor types and “large emitters” thatstill exist in Europe, are taken into account. The IIASA (International Institutefor Applied Systems Analysis, http://www.iiasa.ac.at) fuel dataset (Klimont et al.2002) are used, covering 35 European countries excluding Russia and Ukraine andincluding informations on controlled and uncontrolled fractions of fuel use, whichdepend on emission control set up. Waste burning is not included. Emission factors(EF) for EC and OCp are obtained from Junker and Liousse (2008), using a proxywhen EF values are not well known. Variation of ratio EC versus total particulatematter is the usual proxy used to derive unknown EF values. This proxy is based onthe relationships between EC/OCp and CO/CO2 ratios. It is noteworthy that animproved spatial distribution of EC and OCp emissions than in previous inventoriesis used with traffic and domestic emissions scaled on rural and urban populationdensities, but industrial emissions spatialized according to their real geographicalpositions and magnitudes. A comparison between this inventory with Schaap et al.(2004) is proposed in Guillaume et al. (2007). In both inventories, EC from browncoal and hard coal fuels dominates while slowly replaced by diesel, the relativeimportance of wood contribution is comparable. Fuel consumption is generally inagreement. Main differences occur in the relative importance of controlled and un-controlled fractions of fuel use and in brown and hard coal emission factors selectedfor industrial and domestic sectors. Emission factors in Schaap et al. (2004), basedon BOND2004, values are smaller than those in Guillaume et al. (2007). Industrialemissions (especially power plant emissions) are more controlled in Schaap et al.(2004) than in the inventory used in this work. These differences are particularlyimportant for Poland emissions, much higher in this inventory than in Schaap et al.(2004). Same differences exist for domestic emissions while traffic emissions arecomparable. Finally, this European EC inventory is about 1.5 times higher than inSchaap et al. (2004), while in agreement with the European zoom of JUNKER2008inventory. Both inventories have been tested in ORISAM-TM4 global transportmodel (Guillaume et al. 2007, 2008). Following these results, EC and OCp Europeanemission inventories for year 2000 and built with a 25 km × 25 km resolution, havebeen selected in our study. These emissions are extrapolated to the CHIMEREresolution.
3.4 Fire emissions
In the past decade, wildfires have devastated vast areas of forest and agriculturallands across Europe. In 2003 alone, more than 650,000 ha of forest area and about
7

45,000 ha of agricultural land have been destroyed in Europe, which released intothe atmosphere large amount of smoke particles and trace gases (such as CO, CO2,VOCs, NO, NO2, etc...). The 2003 wildfire emissions contributed significantly tothe enhancement of carbonaceous aerosol concentrations and perturbations of thesurface radiative balance. In order to accurately assess the effects of wildfires on theatmospheric chemistry and radiative budget, the amount of emitted species needsto be quantified. In this study, and in the same way than in Hodzic et al. (2007),daily wildfire emissions of particulate matter and trace gases together with theirgeographic locations were estimated based on satellite information including (i)the location and date of the fire event, (ii) the area burned, (iii) the fuel loadingfactors (mass of biomass per area), (iv) the fraction of biomass fuel burned, and (v)the emission factors. These parameters have been determined by combining dataavailable from several satellite products according to the methodology described inWiedinmyer et al. (2006). The VOC speciation prescribed in EPA (1993) was used.A detailed description of the emission dataset is given in Hodzic et al. (2007).
3.5 SOA modeling in CHIMERE
A specific SOA module has been used for this study, the complete chemicalscheme implemented in CHIMERE includes biogenic and anthropogenic precursors(Table 1). Biogenic precursors include API (α-pinene and sabinene), BPI (β-pinene and δ3-carene), LIM (limonene), TPO (myrcene and ocimene) and ISO
Table 1 Gas phase chemical scheme for SOA formation in CHIMERE
Reactions Kinetic rates (molecules cm−3 s−1)
TOL+OH → 0.004×AnA0D + 0.001×AnA1D 1.81×10⁻¹²exp(355/T)
+ 0.084×AnBmP + 0.013×AnBlP
TMB+OH → 0.002×AnA0D + 0.002× AnA1D 9.80×10⁻⁹/T
+ 0.001×AnA2D + 0.088×AnBmP + 0.006×AnBlP
NC4H10+OH → 0.07×AnBmP 1.36×10⁻¹²exp(190/T)−2
API+OH → 0.30×BiA0D + 0.17×BiA1D + 0.10×BiA2D 1.21×10⁻¹¹exp(444/T)
API+O3 → 0.18×BiA0D + 0.16×BiA1D + 0.05×BiA2D 1.01×10⁻¹⁵exp (−732/T)
API+NO3 → 0.80×BiBmP 1.19×10⁻¹²exp(490/T)
BPI+OH → 0.07×BiA0D + 0.08×BiA1D + 0.06×BiA2D 2.38×10⁻¹¹exp(357/T)
BPI+O3 → 0.09×BiA0D + 0.13×BiA1D + 0.04×BiA2D 1.50×10⁻¹⁷
BPI+NO3 → 0.80×BiBmP 2.51×10⁻¹²
LIM+OH → 0.20×BiA0D + 0.25×BiA1D + 0.005×BiA2D 1.71×10⁻¹⁰
LIM+O3 → 0.09×BiA0D + 0.10×BiA1D 2×10⁻¹⁶
TPO+OH → 0.70×BiA0D + 0.075×BiA1D 5.10×−8/T
TPO+O3 → 0.50×BiA0D + 0.055×BiA1D 7.50×10⁻¹⁴/T
TPO+NO3 → 0.70×BiA0D + 0.075×BiA1D 4.30×10⁻⁹/T
ISO+OH → 0.232×ISOPA1 + 0.0288×ISOPA2 2.55×10⁻¹¹exp(410/T)
The surrogate SOA compounds consist of six hydrophilic species that include an anthropogenicnon-dissociative species (AnA0D), an anthropogenic once-dissociative species (AnA1D), an an-thropogenic twice-dissociative species (AnA2D), a biogenic non-dissociative species (BiA0D), abiogenic once-dissociative species (BiA1D) and a biogenic twice-dissociative species (BiA2D), threehydrophobic species that include an anthropogenic species with moderate saturation vapor pressure(AnBmP), an anthropogenic species with low saturation vapor pressure (AnBlP) and a biogenicspecies with moderate saturation vapor pressure (BiBmP), and two surrogate compounds for theisoprene oxidation products (ISOPA1, ISOPA2). T is the temperature in K.
8

(isoprene). Anthropogenic precursors include TOL (benzene, toluene and othermono-substituted aromatics), TMB (Trimethylbenzene and other poly-substitutedaromatics), and NC4H10 (higher alkanes). SOA formation is represented accordingto a single-step oxidation of the relevant precursors and gas-particle partitioningof the condensable oxidation products. The gas-particle partitioning formulationhas been described in detail in Pun et al. (2006). The overall approach consistsin differentiating between hydrophilic SOA that are most likely to dissolve intoaqueous inorganic particles and hydrophobic SOA that are most likely to absorbinto organic particles. The dissolution of hydrophilic SOA is governed by Henry’slaw whereas the absorption of hydrophobic particles is governed by Raoult’s law.The large number of condensable organic compounds is represented by a set ofsurrogate compounds that cover the range of physico-chemical properties relevantfor aerosol formation, i.e., water solubility and acid dissociation for hydrophiliccompounds and saturation vapor pressure for hydrophobic compounds. These sur-rogate compounds were selected by grouping identified particulate-phase molecularproducts with similar properties. The molecular weight of each surrogate compoundis determined based on its structure and functional groups. The Henry’s law constantor the saturation vapor pressure of the surrogate species is derived from the averageproperties of the group. Other properties are estimated using the structure of eachsurrogate compound. Enthalpy of vaporization are given in brackets (kJ mol−1)for each SOA compounds: AnA0D (88), AnA1D(88), AnA2D(88), BiA0D(88),BiA1D(88), BiA2D(109), AnBmP(88), AnBlP(88), BiBmP(175). The full name ofcompounds are given in Table 1 caption. The absorption process in CHIMEREis implemented as in Bowman et al. (1997). A dynamical approach is adopted todescribe the gas/particle conversion since the model time-step is about 5 min andusing the approach described in Bowman et al. (1997), the characteristic time formass transfer can exceed 20 min for coarse particles.
Ji =1
τi
(
Gi − Geqi
)
(1)
Ji (µg m−2 s−1) is the absorption or desorption flux of species i, τi (s) is a characteristictime of the mass transfer that depends on particle size and the chemical propertiesof species i, Gi is the bulk gas-phase concentration of species i and G
eqi is the gas-
phase concentration of species i at thermodynamic equilibrium (i.e., at the surface ofthe particle). The equilibrium gas-phase concentrations are functions of the particlechemical composition, temperature and, for hydrophilic species, relative humidity, asdescribed in Pun et al. (2006).
The base SOA module was tested against smog chamber data (Odum et al. 1997)for anthropogenic compounds and for biogenic compounds (Griffin et al. 1999)and was shown to satisfactorily reproduce SOA formation for those compounds(Pun et al. 2006). In this study, higher alkanes and isoprene were added to theoriginal chemical mechanism. The formation of SOA from higher alkanes followsthe formulation used in Zhang et al. (2007) for the stoichiometric SOA yield andit is assumed that the SOA species can be represented by a hydrophobic surrogatecompound with a moderate saturation vapor pressure. The formation of SOA fromthe oxidation of isoprene by hydroxyl radicals is represented with two surrogateproducts and follows the formulation prescribed in Kroll et al. (2006); Zhang et al.(2007).
9

3.6 Implementation of the MEGAN biogenic inventory
The previous biogenic inventory used in CHIMERE was based on Simpson’s algo-rithms (Simpson et al. 1995; Moukhtar et al. 2005). Forests were assumed to have auniform tree distribution within each country. Moreover, the gas emission potentialsproposed in Simpson et al. (1995) are based on branch scale measurements only.Here, the new MEGAN model (Guenther et al. 2006, v. 2.04) is implemented, it ex-ploits most recent measurements by combining gridded and canopy scale approaches,that are more appropriate for use in CTMs since they estimate the effective burdenof gases that mix and react in the boundary layer. Estimates of biogenic VOCs fromvegetation and NO emissions are calculated as:
ERi = EFi × γi(T, PPF D, LAI) × ρi (2)
where ERi (µg m−2 h−1) is the emission rate of species i, EFi (µg m−2 h−1) is anemission factor at canopy standard conditions, γi (unitless) is an emission activityfactor that accounts for deviations from canopy standard conditions, and ρi is a factorthat accounts for production/loss within canopy. The canopy standard conditionsrelevant for this study are defined as: air temperature (T) of 303 K, photosyntheticphoton flux density (PPFD) of 1500 µmol m−2 s−1 at the top of the canopy, leafarea index (LAI) of 5 m2 m−2 and a canopy with 80% mature, 10% growing and10% old foliage. The MEGAN model parameterizes the bulk effect of changingenvironmental conditions using three time-dependent input variables specified at topof the canopy: temperature (T), radiation (PPFD), and foliage density (LAI). Theproduction/loss term within canopy is assumed to be unity (ρ = 1). The equation canthen be expanded as:
ERi = EFi × γT,i × γPPFD × γLAI (3)
The MEGAN model provides input EF and LAI data over a global grid, herefaterprojected on the CHIMERE model grid. The current available choice for EFs isrestricted to following species: isoprene, α-pinene, β-pinene, myrcene, sabinene,limonene, δ3-carene, ocimene, and nitrogen oxide. Sesquiterpene emissions are notcalculated. EF’s are static and refer to years 2000–2001. They are obtained summingup over several plant functional types (e.g. broadleaf and needle trees, shrubs,etc...). LAI database is given as a monthly mean product derived from MODISobservations, referred to base year 2000. Hourly emissions are calculated using 2-mtemperature and short-wave radiation from MM5 model. The optimal choice for thiswork is the 150" resolution product proposed in the MEGAN inventory.
Figure 2 shows the differences for August 2003 between the new inventoryMEGAN implemented in CHIMERE and the former approach based on the Simp-son’s algorithms (Simpson et al. 1995). Large differences everywhere in Europeare observed for monoterpene emissions with lower emissions using the MEGANalgorithms. The differences are consistent to what recently reported in Arneth et al.(2008) and represent the uncertainty related to BVOC emission calculations incurrent models. Isoprene emissions are higher with MEGAN in Poland, Spain, Italyand Portugal and lower in Greece, United Kingdom and North Africa.
10

(a) Total Monoterpenes(former algorithm) (b)
-
50
100
150
200
250
300
350
400
450
500
550
600
650
700
750
800
850
900
950
1000
- 35º
40º
45º
50º
55º
35º
40º
45º
50º
55º
35º
40º
45º
50º
55º
35º
40º
45º
50º
55º
50
100
150
200
250
300
350
400
450
500
550
600
650
700
750
800
850
900
950
1000
(c) Isoprene (former algorithm) (d) Isoprene (MEGAN)
50
100
200
300
400
500
600
700
800
900
1000
1200
1400
1800
2000
2400
2800
3200
3600
50
100
200
300
400
500
600
700
800
900
1000
1200
1400
1800
2000
2400
2800
3200
3600
Total Monoterpenes (MEGAN)
10º 0º 10º 20º - - 10º 0º 10º 20º
- - 10º 0º 10º 20º- - 10º 0º 10º 20º
4000
0
0 0
4000
0
Fig. 2 Biogenic emissions (monoterpenes and isoprene) for August 2003 (in kg km−2) calculatedwith the former algorithm in CHIMERE and the new MEGAN inventory (a–d)
4 Model results and comparisons with observational data
4.1 Observational data
Three kind of observation databases are used in this study.
(1) The CARBOSOL database as described in Pio et al. (2007); Legrand andPuxbaum (2007) provides EC, OC observations available on a weekly basis,about 50 samples per site were analyzed. Chemical analyses are made forparticles smaller than and equal to 2.5 µm.
(2) The dataset issued from the EMEP 2002–2003 campaign provides a daily sam-ple per week with only EC and OC analyses (Yttri et al. 2007) (about 25 samplesper site). Analyses on particles smaller than and equal to 10 µm were performedusing the thermal-optical transmission (TOT) instrument from Sunset Lab Inc.,operating according to a NIOSH derived temperature program, more detailscan be found in Yttri et al. (2007).
(3) The routine measurements at the EMEP sites (http://www.emep.int) providedaily average PM10 concentrations (particle diameter smaller than and equal to10 µm). To get a site in a french forestry region the station list is completed withthe specific site of Périgueux managed by the french air quality network.
11

The coordinates and locations in Europe of all stations used in this study aredescribed in Table 2 and Fig. 3. For the model-to-data comparisons, concentrationsare taken in the first model layer. This may induce representativity problems whenthe topography greatly varies from cells to cells as in mountainous regions. Inorder to convert the organic material (OM) concentrations to the modeled organiccarbon (OC), the relation proposed in Turpin and Lim (2001) was used with OM =
1.6 × OC. SOA is a fraction of OM, the term SOA-C frequently used in the paper
Table 2 Names and coordinates of stations
Station Country Lat. (oN) Long. (oE) Altitude (m)
Puy de Dôme (PDDa) France 45.45 3.00 1450
Périgueux (PERId) France 45.19 0.73 ≈100
K-Puszta (KPZa) Hungary 46.97 19.58 125
Mace Head (IE31b,c) Irland 53.33 −9.90 25
Kollumerwaard (NL09b,c) The Netherlands 53.33 6.28 0
Payerne (CH02c) Switzerland 46.82 6.95 489
Tänikon (CH03c) Switzerland 47.48 8.90 539
Langenbrügge (DE02b,c) Germany 52.80 10.76 74
Neuglobsow (DE07c) Germany 53.17 13.03 62
Schmücke (DE08c) Germany 50.65 10.77 937
Zingst (DE09c) Germany 54.43 12.73 1
Schauinsland (SILa) Germany 47.92 7.90 1205
Košetice (CZ03b,c) The Czech Republic 49.58 15.08 534
Stara Lesna (SK04b,c) Slovakia 49.15 20.28 808
Liesek (SK05c) Slovakia 49.37 19.68 892
Starina (SK06c) Slovakia 49.05 22.27 345
Illmitz (AT02b,c) Austria 47.77 16.77 117
St. Koloman (AT04c) Austria 47.65 13.20 851
Montelibretti (IT01c) Italy 42.10 12.63 48
Ispra (IT04b,c) Italy 45.80 8.63 209
San Pietro Capofiume (IT08b) Italy 44.48 11.33 ≈10
Braganca (PT01b,c) Portugal 41.82 −6.77 691
Aveiro(AVEa) Portugal 40.57 −8.63 48
Penicuick (GB46b) Great Brittain 55.95 −3.22 ≈180
Ghent (BE02b) Belgium 51.05 3.72 ≈10
Keldsnor (DK05c) Denmark 54.73 10.73 9
Niembro (ES08c) Spain 43.44 −4.85 134
Cabo de Creus (ES10c) Spain 42.32 3.32 23
Barcarrota (ES11c) Spain 38.47 −6.92 393
Zarra (ES12c) Spain 39.09 −1.10 885
Penausende (ES13c) Spain 41.28 −5.87 985
Els Torms (ES14c) Spain 41.40 0.72 470
O Saviñao (ES16c) Spain 43.23 −7.70 506
Iskrba (SI08c) Slovenia 45.57 14.87 520
Most of the stations are rural background sites, except IT08, BE02 and PERI that are urbanbackground sitesaCARBOSOL sites (EC,OC)bEMEP sites of the EC/OC EMEP campaigncRoutine EMEP sites (PM10 data)dStation from the french monitoring network
12

-10º 0º 10º 20º
35º
40º
45º
50º
55º
AVE
PDD
SIL
KPZ
IE31 NL09
DE02
CZ03SK04
AT02
IT04
PT01
GB46
IT08
BE02
AT04CH02
CH03
DE07
DE08
DE09 DK05
ES08 ES10
ES11 ES12
ES13ES14
ES16 IT01
SI08
SK05 SK06
PERI
Fig. 3 Location of stations—Red triangles: OC and EC available measurements—Green circles:PM10 measurements available only. For IT04, SK04, AT02 sites both PM10 and OC, EC measure-ments are available (see Table 2 for the name of stations and coordinates)
refers to the carbon in the secondary organic aerosols (SOA-C), the same coefficientis used for the conversion: SOA = 1.6 × SOA − C.
4.2 SOA results and OC comparisons
In Fig. 4 and Table 3, the comparison of CHIMERE with OC measurements showsa systematic underestimation at each site. Time correlations for PDD, SIL, BE02,GB46 and IE31 are in the range 0.75–0.91. For IT04, IT08, AVE, PT01, SK04 andKPZ sites a clear underestimation by the CHIMERE model is noticed in wintertime.The same underestimation by the EMEP model (Simpson et al. 2007) was attributedto missing wood burning sources in these countries. A smaller underestimationis observed at the other low altitude sites (DE02, AT02, CZ03, and NL09) forthe same reasons. In summertime, SOA-C largely dominate the carbon fraction inmodel results, in the range 90–95% for the two elevated sites PDD (France) andSIL (Germany). CHIMERE gives surprisingly high SOA-C contributions to totalOC concentrations in winter for PDD, 71% and SIL, 52% for January-March andOctober-December periods. These findings are consistent with other CARBOSOL’sfindings (Gelencsér et al. 2007) where high fractions of biogenic secondary organiccarbon in winter, 72% at SIL and 69% at PDD, were reported. Moreover, within
13

0 50 100 150 200 250 300 350Julian day
0
2
4
6
8
10
12
14
16
18
Co
nce
ntr
atio
n (
µg
m-3
)
Simulated OCSimulated SOA-CObserved OC
AVE
0 50 100 150 200 250 300 350Julian day
0
2
4
6
8
Co
nce
ntr
atio
n (
µg
m-3
)
Simulated OCSimulated SOA-CObserved OC
PDD
0 50 100 150 200 250 300 350Julian day
0
2
4
6
8
10
12
Co
nce
ntr
atio
n (
µg
m-3
)
Simulated OCSimulated SOA-CObserved OC
SIL
0 50 100 150 200 250 300 350Julian day
02468
10121416182022
Co
nce
ntr
atio
n (
µg
m-3
)
Simulated OCSimulated SOA-CObserved OC
KPZ
0 50 100 150 200Julian day
0
2
4
6
8
Co
nce
ntr
atio
n (
µg
m-3
)
Simulated OCSimulated SOA-CObserved OC
IE31
0 50 100 150 200Julian day
0
1
2
3
4
5
6
7
8
Co
nce
ntr
atio
n (
µg
m-3
)
Simulated OCSimulated SOA-CObserved OC
NL09
0 50 100 150 200Julian day
0
2
4
6
8
10
12
14
Co
nce
ntr
atio
n (
µg
m-3
)
Simulated OCSimulated SOA-CObserved OC
DE02
0 50 100 150 200Julian day
0
2
4
6
8
10
12
14
Co
nce
ntr
atio
n (
µg
m-3
)
Simulated OCSimulated SOA-CObserved OC
CZ03
50 100 150 200Julian day
0
2
4
6
8
10
Co
nce
ntr
atio
n (
µg
m-3
)
Simulated OCSimulated SOA-CObserved OC
SK04
0 50 100 150 200Julian day
0
2
4
6
8
10
12
14
Co
nce
ntr
atio
n (
µg
m-3
)
Simulated OCSimulated SOA-CObserved OC
AT02
0 50 100 150 200Julian day
0
4
8
12
16
20
24
28
32
36
40
Co
nce
ntr
atio
n (
µg
m-3
)
Simulated OCSimulated SOA-CObserved OC
IT04
0 50 100 150 200Julian day
0
2
4
6
8
10
12
Co
nce
ntr
atio
n (
µg
m-3
)
Simulated OCSimulated SOA-CObserved OC
IT08
0 50 100 150 200Julian day
0
1
2
3
4
5
6
Co
nce
ntr
atio
n (
µg
m-3
)
Simulated OCSimulated SOA-CObserved OC
GB46
0 50 100 150 200Julian day
0
4
8
12
16
20
24
28
32
Co
nce
ntr
atio
n (
µg
m-3
)
Simulated OCSimulated SOA-CObserved OC
PT01
0 50 100 150 200Julian day
0
2
4
6
8
10
Co
nce
ntr
atio
n (
µg
m-3
)
Simulated OCSimulated SOA-CObserved OC
BE02
Fig. 4 Comparisons between observed (red squares) and simulated OC concentrations (filled area)in 2003 for the CARBOSOL and EC/OC EMEP campaign datasets. Carbon in the secondary organicaerosols (SOA-C) is represented by crosshatched area. The date corresponds to the first day ofsampling (see the full names and locations of each site in Table 2 and Fig. 3)
the CARBOSOL framework at least 86% of OC was attributed to SOA-C duringsummer (Gelencsér et al. 2007).
The yearly average SOA concentrations (Fig. 5) range in most of the regionsfrom 0.5 µg m−3 in the Northern Europe to 4 µg m−3 over forested regions (BlackForest, Portugal Forests, Massif-Central) and in the Pô valley, and peaking up to6 µg m−3 in Croatia. These values are twice larger compared to those obtained byglobal model simulations (3.75o
× 5o) (Tsikaridis and Kanakidou 2007), the dilutionof emissions in larger grid cells can explain these differences. Nevertheless, the spatialpattern is very similar with a maximum from the Pô valley to the Eastern Europe.The yearly averaged contribution (ratio in %) of secondary organic aerosols to thetotal organic material calculated by CHIMERE is mostly in the range 30–80% inEurope (Fig. 6). The highest ratios are found over the Pyrénées and Massif Centraland in Spain. Poland displays lower SOA contributions in Europe because of higherprimary organic emissions from industries in this country as previously discussed.
14

Table 3 Model-to-data statistics for OC concentrations
Station Obs.1 Total OC OC without OC without
SOA-Cc isoprene SOA-Cd
Mod.2 Corr.3 Err.4 Mod.2 Corr.3 Err.4 Mod.2 Corr.3 Err.4
AT02a 5.82 3.86 0.11 46.30 1.61 0.55 73.83 2.78 0.40 48.62
BE02a 3.97 2.16 0.90 48.69 1.46 0.87 64.93 1.94 0.92 53.68
CZ03a 4.98 2.84 0.33 48.79 1.36 0.51 73.55 2.23 0.47 52.10
DE02a 4.05 1.99 0.59 52.73 0.95 0.75 78.89 1.61 0.71 57.21
GB46a 1.67 0.70 0.82 63.76 0.35 0.90 81.15 0.61 0.85 68.02
IE31a 1.48 0.42 0.83 79.35 0.18 0.92 91.31 0.38 0.85 81.61
IT04a 8.30 2.49 −0.11 69.36 0.72 0.52 90.09 1.60 0.10 72.69
IT08a 5.76 2.48 0.00 65.33 0.66 0.45 85.62 1.60 0.10 68.46
NL09a 2.25 1.16 0.62 57.07 0.55 0.74 77.34 0.95 0.72 59.34
PT01a 5.30 0.80 −0.08 77.43 0.14 0.05 96.23 0.51 −0.02 85.52
SK04a 4.16 2.89 0.29 50.32 1.54 0.33 72.69 2.24 0.35 57.82
AVEb 5.43 1.16 0.01 74.10 0.23 0.41 94.59 0.73 0.11 82.19
KPZb 6.46 1.33 0.25 75.59 0.51 0.52 92.64 1.03 0.44 82.22
PDDb 1.84 0.82 0.91 56.69 0.10 0.08 90.65 0.47 0.81 69.02
SILb 2.47 1.74 0.75 39.82 0.32 −0.06 80.94 1.16 0.73 49.22
1Observation (µg m−3)2Model value (µg m−3)3Correlation factor4Normalized error (%)aDaily average values for the EMEP campaignbWeekly average values for the CARBOSOL campaigncComplete scheme with isoprene chemistrydOnly monoterpene and anthropogenic VOCs chemistry with no isoprene chemistry
As shown in Fig. 7 the biogenic fraction of SOA dominates over continental areasexceeding 90% in a large area from Portugal to the North-East of France and overthe Balkans. Over urbanized areas such as Paris and Milan only 20% of SOA isanthropogenic in origin, this is a direct consequence of the anthropogenic primarySVOCs chemistry not taken into account in this study. The current chemistry schemewith only primary VOC emissions are not able to produce large amounts of SOA.The fraction of secondary organic aerosols produced by isoprene chemistry rangesfrom 30% in Northern and Eastern Europe to 60% in Spain (Fig. 8). These results areconsistent with those reported in Tsikaridis and Kanakidou (2007) where a slightlylower range from the 20% to 50% over Europe with similar spatial patterns wasrelated. High isoprene relative contributions are found over North Africa, but asshown in Fig. 5 total SOA concentrations are low in this region.
Regarding to studies over the United States, a study using a global model (Liaoet al. 2007) reported a maximum concentration of 2 µg m−3 in summer with acontribution of 49.5% over the United States. By accounting for isoprene chemistrya large increase of the SOA global budget by a factor of two was reported in Henzeand Seinfeld (2006).
The evaluation of a SOA scheme is difficult because total SOA measurements donot exist yet, only estimates will be soon available during specific campaigns. Forthe moment, only indirect evaluations can be carried out. Table 3 also displays how
15

Fig. 5 Average SOA concentrations (µg m−3) in 2003 simulated by CHIMERE
Fig. 6 Average contribution (%) in 2003 of SOA to the total organic material calculated byCHIMERE
16

Fig. 7 Average contribution (%) in 2003 of biogenic SOA to the total SOA calculated byCHIMERE
SOA chemistry acts on model OC performances. The normalized error is obviouslyreduced by adding SOA chemistry, particularly when the isoprene chemistry isimplemented. These correlations are largely impaired at most of the sites, neverthe-less, at the PDD and SIL sites during the CARBOSOL campaign the correlationsare improved. The latter result makes sense, according to our biogenic emissioninventory these sites are very close to biogenic emission sources. Moreover, thesestatistics are more representative because the CARBOSOL sites provide at least50 samples for 2003 (versus about 25 for the EMEP campaign with only 3 to 4data in summertime). In order to estimate the influence of SOA formation on PMconcentrations, the impact of adding a SOA scheme has been evaluated on PM10
simulations. Several EMEP background sites in Europe have been selected withmore than 300 samples per station.
As shown in Table 4, the implementation of the SOA scheme improves the timecorrelation at several background sites. Large improvements are observed in Spainand Slovenia where biogenic VOC emissions are very large. In Ispra (IT04), timecorrelations are impaired, but largely improved in Montelibretti (IT01). However,the correlation in IT01 was initially poor. This latter result is not significant comparedto the slight decrease of correlation at IT04 particularly when adding SOA formedby isoprene. This shows model discrepancies for predicting biogenic SOA formationand particularly from isoprene in Italy and Slovakia. At DE08, a German stationlocated in a forested region, a large improvement is also observed from 0.58 to0.70. In Spain, a clear improvement is obtained by adding isoprene chemistry for
17

Fig. 8 Average contribution (%) in 2003 of SOA from isoprene to the total SOA calculated byCHIMERE
SOA formation. In Slovakia, the time correlations are globally impaired. The urbansite of Périgueux (PERI), a small city on the western part of the Massif Central, islocated in a strong biogenic precursor emission area in France. In this region, theCHIMERE simulations exhibit a high contribution of secondary organic species (upto 80%) to the total organic carbon, as shown in Fig. 6. The temporal correlation islargely improved from 0.39 to 0.51 at this site when implementing the SOA scheme.Considering only the summer period from May 1st to September 30, the correlationis improved from 0.24 to 0.63 at Périgueux.
4.3 EC comparisons
Figure 9 and Table 5 display EC model results against observations for each site. Asfor OC concentrations, the model underpredicts EC concentrations at AVE, PT01,IT08, IT04 and KPZ particularly in winter. The assumption made in Simpson et al.(2007) about missing wood burning sources in the model could again explain thisbehavior. The model reproduces well the time evolution of EC concentrations atBE02, NL09, IE31 and GB46, these sites are very close to well documented sourcesand are located over flat areas. For Mace Head station (IE31), located along theAtlantic Ocean in Ireland, averaged EC concentrations given by the model areglobally underestimated by a factor of two, 0.24 µg m−3 vs. 0.13 µg m−3 respectivelyfor the observations and the model. The associated time correlation is very high 0.89,the model catches well the polluted air masses issued from the continent. The low
18

Table 4 Impact of the SOA scheme implementation on the temporal correlation coefficients forPM10 concentrations observed and simulated
Station Corr. without Corr. with SOA Corr. with SOA
SOA (without isoprene SOAa) (with isoprene SOAb)
AT02 0.626 0.623 0.600
AT04 0.504 0.562 0.633
CH02 0.437 0.434 0.405
CH03 0.602 0.620 0.612
DE07 0.803 0.806 0.808
DE08 0.580 0.651 0.703
DE09 0.840 0.838 0.837
DK05 0.846 0.847 0.848
ES08 0.583 0.664 0.704
ES10 0.177 0.221 0.275
ES11 0.778 0.807 0.835
ES12 0.645 0.660 0.703
ES13 0.730 0.754 0.781
ES14 0.526 0.543 0.587
ES16 0.660 0.716 0.747
IT01 0.413 0.450 0.486
IT04 0.607 0.572 0.506
PERI 0.391 0.488 0.512
SI08 0.427 0.469 0.503
SK04 0.440 0.454 0.458
SK05 0.441 0.416 0.365
SK06 0.435 0.412 0.353
In bold, correlation coefficients improved by implementing the complete SOA schemeaOnly monoterpene and anthropogenic VOCs chemistrybComplete scheme with isoprene chemistry
temporal correlation at the two elevated sites (SIL and PDD) suggests that these sitescould be influenced by long range transport of anthropogenic pollution. As monthlyclimatologies are used at the domain boundaries, the model is not able to capturedaily intercontinental fluxes that can influence EC concentrations at elevated sites.That could be the reason why correlations for OC concentrations are higher thanthose for EC concentrations at elevated sites because OC has a more local secondaryorigin than EC for SIL and PDD sites. As shown in Fig. 2 biogenic VOC emissionsresponsible for a major fraction of organic material are spread out over Europecompare to the spotty patterns of EC emissions. EC concentrations at remote placesare affected by long range transport from anthropogenic emission areas (Kasper andPuxbaum 1998; Hitzenberger et al. 1999; Guillaume et al. 2008; Kaiser et al. 2007;Jaffe et al. 2003) and discrepancies in meteorological calculations can largely impairmodel concentrations. Indeed, even if the MM5 model has been already evaluatedin others studies devoted to meteorological simulations, the transport process canexplain such a behavior. Emissions are often located at low levels, because ofcumulative errors in transport and mixing at such resolutions, it is not surprisingto get such statistics on primary species at elevated sites. For gas phase chemistry,a similar behavior at remote background sites (Honoré et al. 2008) was alreadyshown, with better correlations for ozone concentrations (secondary species) than for
19

0 50 100 150 200 250 300 350Julian day
0
1
2
3
Co
nce
ntr
atio
n (
µg
m-3
)
Observed ECSimulated EC
AVE
0 50 100 150 200 250 300 350Julian day
0
0.25
0.5
0.75
1
Co
nce
ntr
atio
n (
µg
m-3
)
Observed ECSimulated EC
PDD
0 50 100 150 200 250 300 350Julian day
0
1
2
Co
nce
ntr
atio
n (
µg
m-3
)
Observed ECSimulated EC
SIL
0 50 100 150 200 250 300 350Julian day
0
1
2
3
4
5
Co
nce
ntr
atio
n (
µg
m-3
)
Observed ECSimulated EC
KPZ
0 50 100 150 200Julian day
0
1
2
Conce
ntr
atio
n (
µg m
-3)
Observed ECSimulated EC
IE31
0 50 100 150 200Julian day
0
1
2
3
Conce
ntr
atio
n (
µg m
-3)
Observed ECSimulated EC
NL09
0 50 100 150 200Julian day
0
1
2
3
4
5
Conce
ntr
atio
n (
µg m
-3)
Observed ECSimulated EC
DE02
0 50 100 150 200Julian day
0
1
2
3
4
Conce
ntr
atio
n (
µg m
-3)
Observed ECSimulated EC
CZ03
0 50 100 150 200Julian day
0
1
2
3
4
5
Conce
ntr
atio
n (
µg m
-3)
Observed ECSimulated EC
SK04
0 50 100 150 200Julian day
0
1
2
3
4
5
6
Conce
ntr
atio
n (
µg m
-3)
Observed ECSimulated EC
AT02
0 50 100 150 200Julian day
0
1
2
3
4
5
6
Conce
ntr
atio
n (
µg m
-3)
Observed ECSimulated EC
IT04
0 50 100 150 200Julian day
0
1
2
3
4
Conce
ntr
atio
n (
µg m
-3)
Observed ECSimulated EC
IT08
0 50 100 150 200Julian day
0
1
2
Conce
ntr
atio
n (
µg m
-3)
Observed ECSimulated EC
GB46
0 50 100 150 200Julian day
0
1
2
3
4
5
6
Conce
ntr
atio
n (
µg m
-3)
Observed ECSimulated EC
PT01
0 50 100 150 200Julian day
0
1
2
3
4
5
Conce
ntr
atio
n (
µg m
-3)
Observed ECSimulated EC
BE02
Fig. 9 Comparisons between observed (plus symbols) and simulated (circle symbols) EC concentra-tions in 2003 for the CARBOSOL and EC/OC EMEP campaign dataset. The date corresponds tothe first day of sampling (see the full names and locations of each site in Table 2 and Fig. 3)
nitrogen oxides (primary species). Similarly, the previous analysis is consistent withthe better correlations observed at some low altitude sites for EC concentrationsmodel-to-data comparisons versus OC concentrations : AT02 (0.72 vs. 0.11), AVE(0.30 vs. 0.01), CZ03 (0.52 vs. 0.33), IT04 (0.58 vs. −0.11), IT08 (0.47 vs. 0.00) andNL09 (0.73 vs. 0.62). Indeed, the stations cited here before are mostly influenced bynearby emission areas : AT02 influenced by Vienna, AVE close to the industrial cityof Aveiro, CZ03 influenced by industrial zone in the south of Poland, IT04 close toMilan, IT08 is an urban site and NL09 in the Netherlands is located within the mosturbanized area in Europe.
4.4 Mass distribution of SOA
Mass distribution of aerosol species simulated by CHIMERE are shown in Fig. 10for two background site PDD and NL09 the 1st August 2003. For the most remoteplace (PDD), a peak of SOA is observed at 1 µm with a non negligible amount in
20

Table 5 Model-to-datastatistics for EC concentrations
1Observation (µg m−3)2Model value (µg m−3)3Correlation factor4Normalized error (%)aDaily average values for theEMEP campaignbWeekly average values forthe CARBOSOL campaign
Station Obs.1 Mod.2 Corr.3 Err.4
AT02a 1.04 1.12 0.72 55.2
BE02a 1.65 1.70 0.77 41.2
CZ03a 1.05 0.90 0.52 42.3
DE02a 0.55 0.73 0.60 61.2
GB46a 0.52 0.31 0.75 44.3
IE31a 0.24 0.13 0.89 41.1
IT04a 1.83 0.72 0.58 58.6
IT08a 1.29 0.58 0.47 100.9
NL09a 0.47 0.54 0.73 53.3
PT01a 1.03 0.11 0.30 86.0
SK04a 0.85 0.92 0.44 66.8
AVEb 1.09 0.23 0.30 73.2
KPZb 1.14 0.33 0.40 72.2
PDDb 0.26 0.09 0.23 63.5
SILb 0.30 0.34 0.17 69.1
particles with diameter larger than 1 µm. For NL09 close to anthropogenic particleemission areas, the peak is located at 0.4–0.5 µm. In our model, SOA are assumed tobe absorbed into prexisting particles. The available surface for mass transfert and theabsorbing mass drives the absorption process, so they absorb preferentially into fineparticles. However, in very remote places, due to a lack of fine particles, those speciescan also absorb into coarse particles justifying our dynamical approach previouslydescribed.
4.5 Potential impact of forest fires
Fire emissions can be an important contributor to OC concentrations (Langmannet al. 2008). However, wild fire emissions do not contribute much to the atmosphericEC concentrations on a yearly average (Tsyro et al. 2007). The impact of fire
PDD NL09
0.1 1 10Particle diameter (µm)
0
2
4
6
Mas
s dis
trib
uti
on (
dC
/dL
ogD
in µ
g m
-3)
Sulfate, nitrate and ammoniumSOA from isopreneSOA from monoterpenesSea saltsCoarse primary anthropogenic particlesPrimary anthropogenic organic materialNatural dustElemental carbon
0.1 1 10Particle diameter (µm)
0
2
4
6
8
Mas
s dis
trib
uti
on (
dC
/dL
ogD
in µ
g m
-3)
Fig. 10 Daily mean mass distribution of particle components the 1st August 2003 at backgroundstations NL09 and PDD simulated by CHIMERE
21
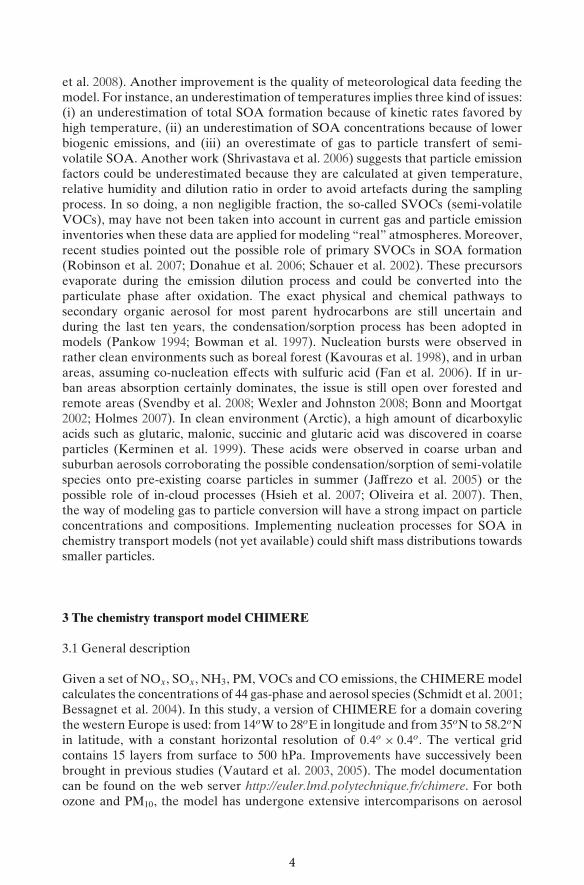
Fig. 11 Impact of forest fires (in %) estimated by CHIMERE on August 1st–15, 2003. The figuresdisplay the ratio between (top) the primary OC concentrations from fires and total primary OC, and(bottom) the ratio between SOA concentrations from fires and total SOA
22
emissions depends on fire buoyancy, and in models, sensitivity to fires depends onthe altitude of their release on the vertical grid (Hodzic et al. 2006). Figure 11 showsthe impact of adding forest fire emissions respectively on primary (a) and secondaryorganic material (b) estimated by CHIMERE on August 1st–15, 2003. During thisperiod, intense fires were recorded around the Mediterranean basin and in Portugal.CHIMERE estimates give a large contribution of these fires to the primary organicconcentrations in the South West of Europe with more than 90% in Portugal andoften more than 50% over the Mediterranean Sea (Fig. 11a). Moreover, wildfiresemit volatile organic precursors that can be oxidized to form SOA. In Fig. 11b, modelresults show a limited impact on the total SOA load of secondary organic materialoriginating from biomass burning related to VOCs, less than 10% during the moreintense fire period in August 2003. This modeling results provide a response to akey question concerning the relative contribution of secondary organic carbon fromVOC emitted by vegetation and biomass burning (Gelencsér et al. 2007), becauseanalysis methods cannot apportion the two contributions. This low contribution ismainly explained by the difference between VOC emissions from vegetation—1700kTon—and wildfires—75 kTon—over our modeling domain in August 2003.
5 Conclusion
In order to better simulate the atmosphere composition, an improved secondaryorganic aerosols scheme was implemented in the CHIMERE chemistry-transportmodel. In parallel, the implementation of the MEGAN biogenic emissions inventorywas performed. Accounting for these new contributions allowed an improvement ofmodel results over the whole year of 2003 comparing with OC, EC and PM10 surfaceconcentrations. Our work suggests that isoprene chemistry has a strong contributionto SOA concentrations in Europe and could explain large underestimation of OCconcentrations in the southern Europe when this specific chemistry is not accountedfor. Our findings are consistent with recent global model results and refine thespatial patterns of SOA concentrations in Europe. However, in this study, a clearunderestimation of OC concentrations was diagnosed during winter. A possibleexplanation is that wood burning emissions in Portugal, Italy, Slovakia and Hungaryare missing in the model emission inventory as suggested by a recent modelingwork (Simpson et al. 2007) carried out with a different model and other input data(meteorology and emissions). Satisfactory correlations are noticed between modeland observed OC at elevated sites such as Puy de Dôme (France) and Schauinsland(Germany) investigated during the CARBOSOL campaign. In these specific cases,the contribution of SOA to the total OC even in winter is quite high that is consistentwith CARBOSOL’s findings. For these two elevated sites, the implementation ofa complete SOA scheme involving monoterpenes and isoprene chemistry clearlyimproves the predicted OC concentrations. However, adding SOA schemes impaircorrelation factors in Portugal, Italy and Slovakia. Those discrepancies with observa-tional data could have several origins such as deficient biogenic emission inventories,meteorological data or SOA chemistry and physics. In addition, our work suggeststhat during the higher fire emission periods, OC concentrations from fires can be the
23

major part of primary organic carbon. The contribution of SOA from fire emissionsremains low.
Acknowledgements This work was funded by the French Ministry in charge of Ecology (MEED-DAT). We thank David Simpson (EMEP, Norway) for providing us the CARBOSOL data,CARBOSOL was financed by European Commission (EVK2-2001-113). Yann Martinet (CITEPA,France) is acknowledged for his contribution in emission speciation. We also thank Alex Guenther(NCAR, USA) for providing us the MEGAN biogenic inventory. G. Curci has been supportedby EU/FP6 CIRCE project. We thank METEOCIEL (www.meteociel.com) for providing us themeteorological data.
References
Altieri, K.E., Seitzinger, S.P., Carlton, A.G., Turpin, B.J., Klein, G.C., Marshall, A.G.: Oligomersformed through in-cloud methylglyoxal reactions: chemical composition, properties, and mech-anisms investigated by ultra-high resolution FT-ICR mass spectrometry. Atmos. Environ. 42,1476–1490 (2008)
Arneth, A., Monson, R.K., Schurgers, G., Niinemets, U., Palmer, P.I.: Why are estimates of globalterrestrial isoprene emissions so similar (and why is this not so for monoterpenes)? Atmos.Chem. Phys. 8, 4605–4620 (2008)
Bauer, H., Kasper-Giebl, A., Löflund, M., Giebl, H., Hitzenberger, R., Zibuschka, F., Puxbaum, H.:The contribution of bacteria and fungal spores to the organic carbon content of cloud water,precipitation and aerosols. Atmos. Res. 64, 109–119 (2002)
Bessagnet, B., Hodzic, A., Vautard, R., Beekmann, M., Cheinet, S., Honoré, C., Liousse, C.,Rouïl, L.: Aerosol modeling with CHIMERE: preliminary evaluation at the continental scale.Atmos. Environ. 38, 2803–2817 (2004)
Bessagnet, B., Hodzic, A., Blanchard, O., Lattuati, M., Le Bihan, O., Marfaing, H., Rouïl, L.: Originof particulate matter pollution episodes in wintertime over the Paris Basin. Atmos. Environ. 39,6159–6174 (2005)
Black, E., Blackburn, M., Harrison, G., Hoskins, B., Methven, J.: Factors contributing to the summer2003 European heatwave. Weather 59(8), 219–223 (2004)
Bond, T., Streets, D., Yarber, K., Nelson, S., Woo, J.H., Klimont, Z.: A technology-based globalinventory of black and organic carbon emissions from combustion. J. Geophys. Res. 109, D14,203 (2004). doi:10.1029/2003JD003697
Bonn, B., Moortgat, G.K.: New particle formation during α and β-pinene oxidation by O3, OH andNO3, and the influence of water vapour: particle size distribution studies. Atmos. Chem. Phys. 2,183–196 (2002)
Bowman, F.m., Odum, J.R., Seinfeld, J.H., Pandis, S.N.: Mathematical model for gas-particle part-tioning of secondary organic aerosols. Atmos. Environ. 31, 3921–3931 (1997)
Dentener, F., Kinne, S., Bond, T., Boucher, O., Cofala, J., Generoso, S., Ginoux, P., Gong, S.,Hoelzemann, J., Ito, A., Marelli, L., Penner, J., Putaud, J.P., Textor, C., Schulz, M., Werf,G.v.d., Wilson, J.: Emissions of primary aerosol and precursor gases in the years 2000 and 1750prescribed data-sets for AeroCom. Atmos. Chem. Phys. 6, 4321–4344 (2006)
Dommen, J., Metzger, A., Duplissy, J., Kalberer, M., Alfarra, M.R., Gascho, A.,Weingartner, E., Prevot, A.S.H., Verheggen, B., Baltensperger, U.: Laboratory observation ofoligomers in the aerosol from isoprene/NOx photooxidation. Geophys. Res. Lett. 33, L13805(2006). doi:10.1029/2006GL026523
Donahue, N.M., Robinson, A.L., Stanier, C.O., Pandis, S.N.: Coupled partitioning, dilution,and chemical aging of semivolatile organics. Environ. Sci. Technol. 40, 2635–2643 (2006).doi:10.1021/es052297
Dudhia, J.: A nonhydrostatic version of the Penn State/NCAR mesoscale model: validation tests andsimulation of an Atlantic cyclone and cold front. Mon. Weather Rev. 121, 1493–1513 (1993)
EPA: Volatile Organic Compounds (VOC)/Particulate Matter (PM) Speciation Data System(SPECIATE), version 1.5, emission inventory branch (MD-14). Tech. Rep., Office of Air QualityPlanning and Standards, U.S. Environmental Protection Agency, Research Triangle Park, NC(1993)
24
Fan, J.W., Zhang, R.Y., Collins, D., Li, G.H.: Contribution of secondary condensable organics tonew particle formation: a case study in Houston, Texas. Geophys. Res. Lett. 33, L15802 (2006).doi:10.1029/2006GL026295
Gelencsér, A., May, B., Simpson, D., Sánchez-Ochoa, A., Kasper-Giebl, A., Puxbaum, H., Caseiro,A., Pio, C., Legrand, M.: Source apportionment of PM2.5 organic aerosol over Europe: pri-mary/secondary, natural/anthropogenic, and fossil/biogenic origin. J. Geophys. Res. 112, D23S04(2007). doi:10.1029/2006JD008094
Graber, E.R., Rudich, Y.: Atmospheric HULIS: how humic-like are they? A comprehensive andcritical review. Atmos. Chem. Phys. 6, 729–753 (2006)
Griffin, R.J., Cocker, E.R., Flagan, R.C., Seinfeld, J.H.: Organic aerosol formation from the oxidationof biogenic hydrocarbons. J. Geophys. Res. 104, 3555–3567 (1999)
Guenther, A., Karl, T., Harley, P., Wiedinmyer, C., Palmer, P.I., Geron, C.: Estimates of globalterrestrial isoprene emissions using MEGAN (Model of Emissions of Gases and Aerosols fromNature). Atmos. Chem. Phys. 6, 3181–3210 (2006)
Guillaume, B., Liousse, C., Rosset, R., Cachier, H., Bessagnet, B., Velthoven, P.V., Poisson, N.:Global modelling of internally mixed size-resolved inorganic/organic aerosols with a focus oncarbonaceous components. Tellus, B 9, 283–302 (2007)
Guillaume, B., Liousse, C., Galy-Lacaux, C., Rosset, R., Gardrat, E., Cachier, H., Bessagnet, B.,Poisson, N.: Modeling exceptional high concentrations of carbonaceous aerosols observed at Picdu Midi in spring-summer 2003: comparison with Sonnblick and Puy de Dôme. Atmos. Environ.42, 5140–5149 (2008)
Hansen, M., DeFries, R., Townshend, J., Sohlberg, R.: Global land cover classification at 1kmresolution using a decision tree classifier. Int. J. Remote Sens. 21, 1331–1365 (2000)
Heinrich, J., Slama, R.: Fine particles, a major threat to children. Int. J. Hyg. Environ. Health 210,617–622 (2007)
Henze, D.K., Seinfeld, J.H.: Global secondary organic aerosol from isoprene oxidation. Geophys.Res. Lett. 33, L09812 (2006). doi:10.1029/2006GL025976
Hitzenberger, R., Berner, A., Giebl, H., Kromp, R., Larson, S.M., Rouc, A., Koch, A., Marischka, S.,Puxbaum, H.: Contribution of carbonaceous material to cloud condensation nuclei concentra-tions in European background (Mt. Sonnblick) and urban (Vienna) aerosols. Atmos. Environ.33(17), 2647–2659 (1999). ISSN 1352-2310, doi:10.1016/S1352-2310(98)00391-4
Hodzic, A., Madronich, S., Bohn, B., Massie, S., Menut, L., Wiedinmyer, C.: Wildfire particulatematter in Europe during summer 2003: meso-scale modeling of smoke emissions, transport andradiative effects. Atmos. Chem. Phys. 7, 4043–4064 (2007)
Hodzic, A., Vautard, R., Bessagnet, B., Lattuati, M., Moreto, F.: Long-term urban aerosol simulationversus routine particulate matter observations. Atmos. Environ. 39, 5851–5864 (2005)
Hodzic, A., Vautard, R., Chepfer, H., Goloub, P., Menut, L., Chazette, P., Deuze, J., Apituley, A.,Couvert, P.: Evolution of aerosol optical thickness over Europe during the August 2003 heatwave as seen from CHIMERE model simulations and POLDER data. Atmos. Chem. Phys. 6,1853–1864 (2006)
Hogrefe, C., Trivikrama Rao, S., Kasibhatla, P., Kallos, G., Tremback, C.J., Hao, W., Olerud, D.,Xiu, A., McHenry, J., Alapaty, K.: Evaluating the performance of regional-scale photochemicalmodeling systems: part I - meteorological predictions. Atmos. Environ. 35, 4159–4174 (2001)
Holmes, N.S.: A review of particle formation events and growth in the atmosphere in the vari-ous environments and discussion of mechanistic implications. Atmos. Environ. 41, 2183–2201(2007)
Honoré, C., Rouïl, L., Vautard, R., Beekmann, M., Bessagnet, B., Dufour, A., Elichegaray, C., Flaud,J.M., Malherbe, L., Meleux, F., Menut, L., Martin, D., Peuch, A., Peuch, V.H., Poisson, N.:Predictability of European air quality: assessment of 3 years of operational forecasts and analysesby the PREV’AIR system. J. Geophys. Res. 113, D04301 (2008). doi:10.1029/2007JD008761
Hsieh, L.Y., Kuo, S.C., Chen, C.L., Tsai, Y.I.: Origin of low-molecular-weight dicarboxylic acidsand their concentration and size distribution variation in suburban aerosol. Atmos. Environ. 41,6648–6661 (2007)
Jaffe, D., McKendry, I., Anderson, T., Price, H.: Six new episodes of trans-pacific transport of airpollutants. Atmos. Environ. 37, 391–404 (2003)
Jaffrezo, J.L., Aymoz, G., Cozic, J.: Size distribution of EC and OC in the aerosol of Alpine valleysduring summer and winter. Atmos. Chem. Phys. 5, 2915–2925 (2005)
Jiménez, P., Jorba, O., Parra, R., Baldasano, J.M.: Evaluation of MM5-EMICAT2000-CMAQ per-formance and sensitivity in complex terrain: high-resolution application to the northeasternIberian Peninsula. Atmos. Environ. 40, 5056–5072 (2006)
25

Junker, C., Liousse, C.: A global emission inventory of carbonaceous aerosol from historic records offossil fuel and biofuel consumption for the period 1860–1997. Atmos. Chem. Phys. 8, 1195–1207(2008)
Kaiser, A., Scheifinger, H., Spangl, W., Weiss, A., Gilge, S., Fricke, W., Ries, L., Cemas, D.,Jesenovec, B.: Transport of nitrogen oxides, carbon monoxide and ozone to the Alpine GlobalAtmosphere Watch stations Jungfraujoch (Switzerland), Zugspitze and Hohenpeissenberg(Germany), Sonnblick (Austria) and Mt. Krvavec (Slovenia). Atmos. Environ. 41, 9273–9287(2007)
Kasper, A., Puxbaum, H.: Seasonal variation of SO2, HNO3, NH3 and selected aerosol componentsat Sonnblick (3106 m a.s.l.). Atmos. Environ. 32(23), 3925–3939 (1998)
Kavouras, I., Mihalopoulos, N., Stephanou, E.: Formation of atmospheric particles from organicacids produced by forests. Nature 395, 683–686 (1998)
Kerminen, V.M., Teinilä, K., Hillamo, R., Mäkelä, T.: Size-segregated chemistry of particulatedicarboxylic acids in the Arctic atmosphere. Atmos. Environ. 33, 2089–2100 (1999)
Kleindienst, T.E., Jaoui, M., Lewandowski, M., Offenberg, J.H., Lewis, C.W., Bhave, P.V., Edney,E.O.: Estimates of the contributions of biogenic and anthropogenic hydrocarbons to secondaryorganic aerosol at a southeastern US location. Atmos. Environ. 41, 8288–8300 (2007)
Klimont, Z., Cofala, J., Bertok, I., Amann, M., Heyes, C., Gyarfas, F.: Estimating costs for controllingemissions of volatile organic compounds (VOC) from stationary sources in Europe. Tech. Rep.,IIASA Interim Report IR-02-76., Laxenburg (2002)
Kroll, J.H., Ng, N.L., Murphy, S.M., Flagan, R.C., Seinfeld, J.H.: Secondary organic aerosolformation from isoprene photooxidation. Environ. Sci. Technol. 40, 1869–1877 (2006). doi:10.1021/es0524301
Kroll, J.H., Seinfeld, J.H.: Review: chemistry of secondary organic aerosol: formation and evolutionof low-volatility organics in the atmosphere. Atmos. Environ. 42, 3593–3624 (2008)
Langmann, B., Varghese, S., Marmer, E., Vignati, E., Wilson, J., Stier, P., O’Dowd, C.: Aerosoldistribution over Europe: a model evaluation study with detailed aerosol microphysics. Atmos.Chem. Phys. 8, 1591–1607 (2008)
Lee, J.T., Son, J.Y., Cho, Y.S.: The adverse effects of fine particle air pollution on respiratory functionin the elderly. Sci. Total Environ. 385, 28–36 (2007)
Legrand, M., Puxbaum, H.: Summary of the CARBOSOL project: present and retrospectivestate of organic versus inorganic aerosol over Europe. J. Geophys. Res. 112, D23S01 (2007).doi:10.1029/2006JD008271
Liao, H., Henze, D.K., Seinfeld, J.H., Wu, S., Mickley, L.J.: Biogenic secondary organic aerosol overthe unites states: comparison of climatological simulations with observations. J. Geophys. Res.112, D06,201 (2007). doi:10.1029/2006JD007813
Lukács, H., Gelencsér, A., Puxbaum, H., Pio, C., Legrand, M., Caseiro, A., Limbeck, A., Preunkert,S.: Seasonal trends and possible sources of brown carbon based on 2-year aerosol measurementsat six sites in Europe. J. Geophys. Res. 112, D23S18 (2007). doi:10.1029/2006JD008151
Mayol-Bracero, O.L., Guyon, P., Graham, B., Roberts, G., Andreae, M.O., Decesari, S., Facchini,M.C., Fuzzi, S., Artaxo, P.: Water-soluble organic compounds in biomass burning aerosols overAmazonia 2. Apportionment of the chemical composition and importance of the polyacidicfraction. J. Geophys. Res. 107(D20), 8091 (2002). doi:10.1029/2001JD000522
Moukhtar, S., Bessagnet, B., Rouïl, L., Simon, V.: Monoterpene emissions from beech (fagus sylvat-ica) in a french forest and impact on secondary pollutants formation at regional scale. Atmos.Environ. 39, 3535–3547 (2005)
Nenes, A., Pilinis, C., Pandis, S.N.: ISORROPIA: a new thermodynamic equilibrium model formultiphase multicomponent marine aerosols. Aquat. Geochem. 4, 123–152 (1998)
Odum, J.R., Jungkamp, T.P.W., Griffin, R.J., Forstner, J.L., Flagan, R.C., Seinfeld, J.H.: Aromatics,reformulated gasoline and atmospheric organic aerosol formation. Environ. Sci. Technol. 31,1890–1897 (1997)
Oliveira, C., Pio, C., Evtyugina, M., Santos, P., Gon¸calves, V., Nunes, T., Silvestre, A.J.D., Palmgren,F., Wå hlin, P., Harrad, S.: Seasonal distribution of polar organic compounds in the urbanatmosphere of two large cities from the north and south of Europe. Atmos. Environ. 41,5555–5570 (2007)
Pankow, J.F.: An absorption model for gas/aerosol partition involved in the formation of secondaryorganic aerosol. Atmos. Environ. 28, 189–193 (1994)
Pio, C.A., Legrand, M., Oliveira, T., Afonso, J., Santos, C., Caseiro, A., Fialho, P., Barata, F.,Sánchez-Ochoa, A., Kasper-Giebl, A., Gelencsér, A., Preunkert, S., Schock, M.: Climatology of
26

aerosol composition (organic versus inorganic) at nonurban sites on a west-east transect acrossEurope. J. Geophys. Res. 112, D23S02 (2007). doi:10.1029/2006JD008038
Pun, B., Seigneur, C., Lohman, K.: Modeling secondary organic aerosol via multiphase partitioningwith molecular data. Environ. Sci. Technol. 40, 4722–4731 (2006)
Pun, B., Seigneur, C.: Investigative modeling of new pathways for secondary organic aerosol forma-tion. Atmos. Chem. Phys. 7, 2199–2216 (2007)
Putaud, J.P., Raes, F., Van Dingenen, R., Bruggemann, E., Facchini, M.C., Decesari, S., Fuzzi, S.,Gehrig, R., Huglin, C., Laj, P., Lorbeer, G., Maenhaut, W., Mihalopoulos, N., Muller, K., Querol,X., Rodriguez, S., Schneider, J., Spindler, G., Ten Brink, H., Tørseth, K., Wiedensohler, A.: AEuropean aerosol phenomenology–2: chemical characteristics of particulate matter at kerbside,urban, rural and background sites in Europe. Atmos. Environ. 38, 2579–2595 (2004)
Puxbaum, H., Tenze-Kunit, M.: Size distribution and seasonal variation of atmospheric cellulose.Atmos. Environ. 37, 3693–3699 (2003)
Robinson, A.L., Donahue, N.M., Shrivastava, M.K., Weitkamp, E.A., Sage, A.M., Grieshop, A.P.,Lane, T.E., Pierce, J.R., Pandis, S.N.: Rethinking organic aerosols: semivolatile emissions andphotochemical aging. Science 315(5816), 1259 (2007). doi:10.1126/science.1133061
Schaap, M., Van Der Gon, H.A.C.D., Dentener, F.J., Visschedijk, A.J.H., Van Loon, M., tenBrink, H.M., Putaud, J.P., Guillaume, B., Liousse, C., Builtjes, P.J.H.: Anthropogenic blackcarbon and fine aerosol distribution over europe. J. Geophys. Res. 109, D18,207 (2004).doi:10.1029/2003JD004330
Schaap, M., Vautard, R., Bergstrom, R., van Loon, M., Bessagnet, B., Brandt, J., Christensen, H.,Cuvelier, K., Foltescu, V., Graff, A., Jonson, J.E., Kerschbaumer, A., Krol, M., Langner, J.,Roberts, P., Rouïl, L., Stern, R., Tarrason, L., Thunis, P., Vignati, E., White, L., Wind, P.,Builtjes, P.H.J.: Evaluation of long-term aerosol simulations from seven air quality models andtheir ensemble in the eurodelta study. Atmos. Environ. (2009, in press)
Schauer, J.J., Kleeman, M.J., Cass, G.R., Simoneit, B.R.T.: Measurement of emissions from airpollution sources. 5. C1-C32 organic compounds from gasoline-powered motor vehicles. Environ.Sci. Technol. 36, 1169–1180 (2002)
Schell, B., Ackermann, I.J., Hass, H., Binkowski, F.S., Ebel, A.: Modeling the formation of secondaryorganic aerosol within a comprehensive air quality model system. J. Geophys. Res. 106, 28275–28293 (2001)
Schlesinger, R.B., Kunzli, N., Hidy, G.M., Gotschi, T., Jerrett, M.: The health relevance of ambientparticulate matter characteristics: coherence of toxicological and epidemiological inferences.Inhal. Toxicol. 18, 96–125 (2006)
Schmidl, C., Marr, I.L., Caseiro, A., Kotianová, P., Berner, A., Bauer, H., Kasper-Giebl, A.,Puxbaum, H.: Chemical characterisation of fine particle emissions from wood stove combustionof common woods growing in mid-European Alpine regions. Atmos. Environ. 42, 126–141(2008)
Schmidt, H., Derognat, C., Vautard, R., Beekmann, M.: A comparison of simulated and observedozone mixing ratios for the summer of 1998 in western Europe. Atmos. Environ. 35, 6277–6297(2001)
Schulz, M., Textor, C., Kinne, S., Balkanski, Y., Bauer, S., Berntsen, T., Berglen, T., Boucher,O., Dentener, F., Guibert, S., Isaksen, I.S.A., Iversen, T., Koch, D., Kirkevå g, A., Liu, X.,Montanaro, V., Myhre, G., Penner, J.E., Pitari, G., Reddy, S., Seland, O., Stier, P., Takemura,T.: Radiative forcing by aerosols as derived from the AeroCom present-day and pre-industrialsimulations. Atmos. Chem. Phys. 6, 5225–5246 (2006)
Shrivastava, M.K., Lipsky, E.M., Stanier, C.O., Robinson, A.L.: Modeling semivolatile organicaerosol mass emissions from combustion systems. Environ. Sci. Technol. 40, 2671–2677 (2006).doi:10.1021/es0522231
Simpson, D., Guenther, A., Hewitt, C.N., Steinbrecher, R.: Biogenic emissions in Europe. 1. esti-mates and uncertainties. J. Geophys. Res. 100D, 22875–22890 (1995)
Simpson, D., Yttri, K.E., Klimont, Z., Kupiainen, K., Caseiro, A., Gelencsér, A., Pio, C., Puxbaum,H., Legrand, M.: Modeling carbonaceous aerosol over Europe: analysis of the CARBOSOL andEMEP EC/OC campaigns. J. Geophys. Res. 112, D23S14 (2007). doi:10.1029/2006JD008158
Stern, R., Builtjes, P., Schaap, M., Timmermans, R., Vautard, R., Hodzic, A., Memmesheimer,M., Feldmann, H., Renner, E., Wolke, R., Kerschbaumer, A.: A model intercomparison studyfocussing on episodes with elevated PM10 concentrations. Atmos. Environ. 42(19), 4567–4588(2008). ISSN 1352-2310, doi:10.1016/j.atmosenv.2008.01.068
Surratt, J.D., Murphy, S.M., Kroll, J.H., Ng, N.L., Hildebrandt, L., Sorooshian, A., Szmigielski, R.,Vermeylen, R., Maenhaut, W., Claeys, M., Flagan, R.C., Seinfeld, J.H.: Chemical composition
27

of secondary organic aerosol formed from the photooxidation of isoprene. J. Phys. Chem. 110,9665–9690 (2006)
Svendby, T.M., Lazaridis, M., Tørseth, K.: Temperature dependent secondary organicaerosol formation from terpenes and aromatics. J. Atmos. Chem. 59, 25–46 (2008). doi:10.1007/s10874-007-9093-7
Textor, C., Schulz, M., Kinne, S., Guibert, S., Bauer, S., Berntsen, T., Berglen, T., Boucher, O., Chin,M., Dentener, F., Diehl, T., Feichter, H., Fillmore, D., Ghan, S., Ginoux, P., Gong, S., Grini, A.,Hendricks, J., Horrowitz, L., Isaksen, I., Iversen, T., Koch, D., Krol, M., Lauer, A., Lamarque,J.F., Liu, X., Montanaro, V., Myhre, G., Penner, J., Pitari, G., Reddy, S., Seland, O., Stier, P.,Takemura, T., Tie, X.: Analysis and quantification of the diversities of aerosol life cycles withinAeroCom. Atmos. Chem. Phys. 6, 1777–1813 (2006)
Tsikaridis, K., Kanakidou, M.: Secondary organic aerosol importance in the future atmosphere.Atmos. Environ. 41, 4682–4692 (2007)
Tsyro, S., Simpson, D., Tarrasón, L., Klimont, Z., Kupiainen, K., Pio, C., Yttri, K.E.: Modeling ofelemental carbon over Europe. J. Geophys. Res. 112, D23S19 (2007). doi:10.1029/2006JD008164
Turpin, B.J., Lim, H.J.: Species contributions to PM2.5 mass concentrations: revisiting commonassumptions for estimating organic mass. Aerosol Sci. Tech. 35, 602–610 (2001)
Van Dingenen, R., Raes, F., Putaud, J.-P., Baltensperger, U., Charron, A., Facchini, M.-C., Decesari,S., Fuzzi, S., Gehrig, R., Hansson, H.-C., Harrison, R.M., Huglin, C., Jones, A.M., Laj, P.,Lorbeer, G., Maenhaut, W., Palmgren, F., Querol, X., Rodriguez, S., Schneider, J., ten Brink, H,Tunved, P., Torseth, K., Wehner, B., Weingartner, E., Wiedensohler, A., Wahlin, P.: A Europeanaerosol phenomenology–1: physical characteristics of particulate matter at kerbside, urban, ruraland background sites in Europe. Atmos. Environ. 38(16), 2561–2577 (2004). ISSN 1352-2310,doi:10.1016/j.atmosenv.2004.01.040
van Donkelaar, A., Martin, R.V., Park, R.J., Heald, C.L., Fu, T.M., Liao, H., Guenther, A.: Modelevidence for a significant source of secondary organic aerosol from isoprene. Atmos. Environ.41, 1267–1274 (2007)
Van Loon, M., Vautard, R., Schaap, M., Bergstrom, R., Bessagnet, B., Brandt, J., Builtjes, P.,Christensen, J.H., Cuvelier, K., Graf, A., Jonson, J., Krol, M., Langner, J., Roberts, P., Rouil,L., Stern, R., Tarrason, L., Thunis, P., Vignati, E., White, L., Wind, P.: Evaluation of long-termozone simulations from seven regional air quality models and their ensemble average. Atmos.Environ. 41, 2083–2097 (2007)
Vautard, R., Bessagnet, B., Chin, M., Menut, L.: On the contribution of natural aeolian sourcesto particulate matter concentrations in Europe: testing hypotheses with a modelling approach.Atmos. Environ. 39, 3291–3303 (2005)
Vautard, R., Builtjes, P.H.J., Thunis, P., Cuvelier, K., Bedogni, M., Bessagnet, B., Honoré, C.,Moussiopoulos, N., Pirovano, G., Schaap, M., Stern, R., Tarrason, L., Van Loon, M.: Evaluationand intercomparison of ozone and PM10 simulations by several chemistry-transport models over4 European cities within the city-delta project. Atmos. Environ. 41(1), 173–188 (2007)
Vautard, R., Martin, D., Beekmann, M., Drobinski, P., Friedrich, R., Jaubertie, A., Kley, D., Lattuati,M., Moral, P., Neininger, B., Theloke, J.: Paris emission inventory diagnostics from ESQUIFairborne measurements and a chemistry transport model. J. Geophys. Res. 108(D17), 8564(2003). doi:10.1029/2002JD002797
Vestreng, V.: Review and revision. Emission data reported to CLRTAP. Tech. Rep., EMEP MSC-W,http://www.emep.int (2003)
Wexler, A.S., Johnston, M.V.: What have we learned from highly time-resolved measurementsduring EPA’s supersites program and related studies? J. Air Waste Manage. Assoc. 58, 303–319(2008)
Wiedinmyer, C., Quayle, B., Geron, C., Belote, A., McKenzie, D., Zhang, X.Y., O’Neill, S., Wynne,K.K.: Estimating emissions from fires in North America for air quality modeling. Atmos. Envi-ron. 40(19), 3419–3432 (2006)
Yttri, K.E., Aas, W., Bjerke, A., Cape, J.N., Cavalli, F., Ceburnis, D., Dye, C., Emblico, L., Facchini,M.C., Forster, C., Hanssen, J.E., Hansson, H.C., Jennings, S.G., Maenhaut, W., Putaud, J.P.,Tørseth, K.: Elemental and organic carbon in PM10: a one year measurement campaign withinthe European Monitoring and Evaluation Programme EMEP. Atmos. Chem. Phys. 7, 5711–5725(2007)
Zhang, Y., Huang, J.-P., Henze, D.K., Seinfeld, J.H.: Role of isoprene in secondary organic aerosolformation on a regional scale. J. Geophys. Res. 112, D20207 (2007). doi:10.1029/2007JD008675
28