carige roadshow presentation vfinalfinalfinal presentation may 2008 banca carige 2 this document has...
TRANSCRIPT
BANCA CARIGE 1
BANCA CARIGEBANCA CARIGECassa di Risparmio di Genova e Imperia
Fixed-income presentation
May 2008
BANCA CARIGE 2
This document has been prepared by Banca Carige SpA solely for information purposes and for use in presentation of the Group’s strategies and financials. The information contained herein has not been independently verified. No representation or warranty, express or implied, is made as to, and no reliance should be placed on, the fairness, accuracy, completeness or correctness of the information or opinions contained herein. Neither the company, its advisors or representatives shall have any liability whatsoever for any loss howsoever arising from any use of this document or its contents or otherwise arising in connection with this document. The forward-looking information contained herein has been prepared on the basis of a number of assumptions which may prove to be incorrect and, accordingly, actual results may vary.
This document does not constitute an offer or invitation to purchase or subscribe for any shares or bonds and no part of it shall form the basis of or be relied upon in connection with any contract or commitment whatsoever.
The distribution of this presentation in certain jurisdictions may be restricted by law. Recipients of this presentation should inform themselves about and observe such restrictions.
The information herein may not be reproduced or published in whole or in part, for any purpose, or distributed to any other party. By accepting this document you agree to be bound by the foregoing limitations.
*****
The manager responsible for preparing the company’s financial reports Ennio La Monica declares, pursuant to paragraph 2 of Article 154 bis of the Consolidated Law on Finance, that the accounting information contained in this presentation corresponds to the document results, books and accounting records.
Disclaimer

BANCA CARIGE 3
Giacomo BurroCFO & Wealth Management Director
[email protected]: +390105794580
Emilio Chiesi Head of International Funding & UK Representative
[email protected]: +442076002608
Daria BagnascoHead of Planning & [email protected]
Tel: +390105794869
Maurizio MarchioriHead of Planning
[email protected]: +390105794868
Roberta FamàElisa Bisio
Investor [email protected]
Tel: +390105794877
Contacts

BANCA CARIGE 4
Contents
CARIGE Group at a glance
2008-2010 business plan and strategic highlights
Ratings, capitalisation and funding strategy
CARIGE Group consolidated financial review

BANCA CARIGE 5
Business profile Financial highlights (31/12/2007)- IAS/IFRS
The Group is a leading player in the Italian banking market
• Banca CARIGE SpA is the sixth bank in Italy
by market capitalisation (1)
• The Group offers both banking and
insurance services through its 641 branches
and 376 insurance outlets
• Widespread geographical presence across
Italy, with particularly strong footprint in the
wealthy Northern area
• Strong track-record in successful
acquisitions of banks and branches
• The Group is a national financial
conglomerate equipped to provide banking,
financial, insurance and pension solutions
• Focus on retail, enhancing an integrated
multi-channel distribution system
• Market capitalisation (1): €4.8b
• Gross customer loans: €17.5b
• Direct customer funds: €17.4b
• Indirect customer funds: €20.2b, of which:
AUM €9.9b
• Cost/income: 53.2%
• Tier 1 capital ratio: 7.8%
• Total solvency ratio: 9.2%
• Ratings: A2 stable (Moody’s) / A- stable
(S&P) / A stable (Fitch)
(1) Data as at May 22, 2008

BANCA CARIGE 6
44.09%44.09%
Fondazione CR Genova e Imperia
36.83%36.83%
Market
InsuranceBanking Finance
Banca CARIGEBanca CARIGE SpA SpA Cassa di Risparmio di Genova e ImperiaCassa di Risparmio di Genova e Imperia
• Banca CARIGE
• CR Savona
• CR Carrara
• BM Lucca
• B. Cesare Ponti
• CARIGE Vita Nuova (life)
• CARIGE Ass.ni (non life)
• CARIGE AM SGR
• Creditis (Consumer
credit)
Main Companies Only
14.99%14.99%
CNCE
~53,000 small shareholders
AssicurazioniGenerali
4.09%4.09%
Trustee
5,839EMPLOYEES
641 BRANCHES &376 INSURANCE OUTLETS
1.9 M CUSTOMERS(1.2 M BANKING; 0.7M ASSURANCE)
CARIGE Group today
• Centro Fiduciario
EQUITY3.7 BILLION

BANCA CARIGE 7
Activities Portfolio
Sources and uses
Fondazione Cassa di Risparmio di Genova e Imperia
The sectors of activity of the Foundation are:
• Art works and cultural activities
• Volunteer work, philanthropy and charity
• Public health, preventive medicine and rehabilitation
• Education and training
• Scientific and technological research
Portfolio as at December 31, 2007 (€m)
Stake in CARIGE 818.8 82.7%
Other Stakes 41.8 4.2%
Fixed income investments 110 11.1%
Buildings & art investments 18.9 1.9%
Cash 0.3 0.0%
Total 989.8 100%
2007 (€m)Total: 13.5 million42,1%
27,7%
1,0%6,4%
12,3%10,4%
Art Volunteer work
Public health Other
Education Scientific resear
Total sources 66.3 100%
Dividends from Banca CARIGE Spa 53.8 81%
Other dividends 4.7 7%
Other financial investments 7.9 12%

BANCA CARIGE 8
Capital increase2008
Year CAPITAL RAISED € m Year ACQUISITIONS
1994-95 IPO 105 1993 - 99 Cassa di Risparmio di Savona 228
1996-97 Bond conversion into new shares 61 1991-06 Insurance companies 317
1997 Capital increase underwritten by La Basilese
46 1999-02-06 Banca del Monte di Lucca 74
1998116
2000 21 branches from Banco di Sicilia 60
1999236
2001 61 branches from Intesa 277
2001 Issue of a subordinated loan 400
2002 42 branches from Capitalia 127
2003-06521
2003 Cassa di Risparmio di Carrara 174
Total 2,442 Total 2,307
Capital increase underwritten by CNCEP, CDC, WestLB
Capital increases and issue of subordinated convertible bonds 2004-2006 Banca Cesare Ponti 50
Capital increase underwritten by institutional investors
€ m
Growth through targeted acquisitions
2008 95779 branches from Intesa Sanpaolo 860*
* Amount subject to price adjustment
38 branches from UniCredit2008 ~ 140 *

BANCA CARIGE 9
France
1
58/ 2469 / 60 46/ 30
20/ 18
56/ 24
1/ 5
4/ 11
33/ 35
11/ 24
37/
7
13
2
3
117
1183France
1
58/ 2469 / 60 46/ 30
20/ 18
56/ 24
1/ 5
4/ 11
33/ 35
11/ 24
37/ 53
7
13
2
7
3
25
55/1872/52 46/31
23/17
57/221/5
4/11
33/35
9/34
11/22
37/51
1/14 7
132
73
27
252/14
204 points of sales 979 points of sales
603 Banking branches376 Insurance outlets
Data do not include 38 branches ex UniCredit
1
A widespread network in Italy, particularly strong in the wealthy Northern area
Liguria: 41.8%North: 74.5%

BANCA CARIGE 10
Focus on retail
by areaby segment
Individuals33%
SMEs 36%
Public Entities 5%
Other 7%
Large Corporate8%
Liguria50%
North29%
Centre16%
South + Isles 5%
Liguria64%
North12%
Centre17%
South + Isles 7%
LOANS
DEPOSITS
LOANS TO CUSTOMERS 2007 : 17.5 €b
DIRECT DEPOSITS 2007 : 17.4 €b
Small Business11%
Private18%
Affluent & Mass Market45%
Corporate23%
Other14%
by areaby segment(ex debt securities)
Small business = turnover<1.5m ; SMEs= <100m€; Large Corporate= >100m€Mass Market= deposits<50k€; Affluent >50k€; Private= >250k€
46% after branches
acquisition
58% after branches
acquisition

BANCA CARIGE 11
16
574
335
106 93 8535 26 17 12
UCI ISP MPS UBI BP BPER BPM BC CE BPS
Source: Group data. Ratios as reported(1) Source: Bloomberg. Data as at May 22, 2008
Data do not include ex ISP branches
#8
2475005225271,204
1,9212,0942,165
5,025
6,050
ISP UCI BP MPS UBI BPER BPM BC CE BPS
#8
#8
1826273549121128162
573
1,022
UCI ISP MPS BP UBI BPER BPM BC CE BPS
Among the top 10 Italian banking Groups
Market Cap(1) (€b) Total Assets FY 2007 (€b)
Domestic Branch Network FY 2007 (#) Customer Loans FY 2007 (€b)
2
5753
13 108
3 3 34.8
UCI ISP MPS UBI BP BC BPER BPM BPS CE
• Ordinary shares 4.3 €b• Savings shares 0.5 €b

BANCA CARIGE 12
Source: Company data. Ratio as reported * Data refer to 30-Jun-07
64%58%57%56%56%54%53%52%52%52%
ISP BPS BPER BC UCI BPM UBI BP MPS CE
1.9%1.7%1.6%
1.5%
1.0%0.9%0.8%
0.6%0.4%
0.3%
CE BPM BPS UBI ISP BP BPER BC UCI MPS
Among the top 10 Italian banking Groups
C/I (%) FY 2007 Net NPL ratio (%) FY2007
8.4 7.5 6.610.3
7.8 6.5 6.1 5.2
2.7 3.23.6 1.2
3.6
8.17.4
2.82.8
2.51.48.78.99.09.29.39.910.110.210.711.1
BPM BPER*
UBI UCI BPS CE BC ISP MPS BP
Tier 1 and Total Capital Ratio (%) FY2007
-0.4

BANCA CARIGE 13
Organizational structure
ADMINISTRATIONGiacomo Ottonello
ADMINISTRATIONGiacomo Ottonello
PRODUCTIONMario CavannaPRODUCTIONMario Cavanna DISTRIBUTION
Carlo ArzaniDISTRIBUTION
Carlo Arzani
MANAGEMENT CONTROL
& SUPPORTEnnio La Monica
MANAGEMENT CONTROL
& SUPPORTEnnio La Monica
GENERALMANAGER
Alfredo Sanguinetto
GENERALMANAGER
Alfredo Sanguinetto
InternalAuditing
InternalAuditing
ConsumerLending
ConsumerLending Corporate
Lending
CorporateLending Wealth
Management
WealthManagement Payment
Systems
PaymentSystems
Marketing & Commercial
Planning
Marketing & Commercial
PlanningBranch
Network
BranchNetwork Other
SalesChannels
OtherSales
Channels
CHAIRMANGiovanni Berneschi
CHAIRMANGiovanni Berneschi

BANCA CARIGE 14
Contents
CARIGE Group at a glance
2008-2010 business plan and strategic highlights
Ratings, capitalisation and funding strategy
CARIGE Group consolidated financial review

BANCA CARIGE 15
Independence through growthIndependence through growth
1990 1990 -- 19981998 1999 1999 -- 20042004
Expansion and diversification
Capital base strengthening and
opening to new shareholders
Rationalization
and profitability enhancement
2005 2005 -- 20072007
Profitable integration of Profitable integration of the branches acquired & the branches acquired &
IT innovationIT innovationfor profitabilityfor profitabilitystrengtheningstrengthening
2008 2008 -- 20102010
CARIGE Group aims to be a nationalnational financialfinancial conglomerateconglomerate equipped to provide banking, financial, insurance and pension solutions, focused on retail, pursuant the development of resources and structures
and the enhancement of an integratedintegrated multimulti--channelchannel distribution system
• Complete offer of banking, financial and insurance products and services
• Aggregation point for smaller banks
• Widespread presence in Italy especially in certain areas and stronghold in Liguria
• Attention to the relationship with local communities
• Distribution system based on branches, mobile and remote channel
• Specialization of distribution and production structures
• Unitary management of the Group’s key-expertises
• Professional development of human resources
• IT system in line with best practice
Conglomerate National Multi-channel Quality of resources
and structuresRetailRetail
• Focus on families, SMEs and local public entities
• Widespread and intensive use of technology
Our strategy and our mission

BANCA CARIGE 16
Core priorities of 2008 – 2010 Strategic Plan
Enhancement of productivity, efficiency and profitability
Growth of volumes and
maintenance of consistent equity
levels
Risk management
• Profitability enhancement of each business area (lending, wealthmanagement, payment system, insurance)
• Integration between Insurance and Banking Business
• Process innovation through investments in technology
• Control of the economic impact of all kinds of risk
• Capital management
• Increase of volumes per employee:cross-selling, up-selling and retention in Liguriarising of market share outside Liguria
• Growth of intermediation, above all in areas outside Liguria where the presence is already significant
• Integration of the 79 ex ISP branches and 38 ex UniCredit
• Increase of income from subsidiaries
Human Resources:• Maintenance of a standard consistent with the Group’s needs• Development of skills and management of talents
PRODUCTION
GOVERNANCE AND CONTROL
ADMINISTRATION
DISTRIBUTION

BANCA CARIGE 17
(1) Total deposits + loans(2) Equity net of the reserve for the revaluation of the shareholding in Bank of Italy
Net income131 €m
Volumes(1)
47 €b
C/I66.4%
ROE adj.(2)
8.3%
Tier 15.4%
2005Starting point
0%
2007 results exceed ’06-’08 Strategic Plan targets
% objectives achieved
66.6%
20072007
205 205 €€mm
55 55 €€bb
53.2%53.2%
7.8%7.8%
10.3%10.3%
Objectives 2008
100%
220 €m
57 €b
54.7%
10.3%
8.2%

BANCA CARIGE 18
2010E2010E20072007CARIGE GROUPCARIGE GROUP
2010 Group’s targets
20062006
(*) 2007 PF data include the 79 ex ISP branches and the capital increase
(**) Equity net of the reserve for the revaluation of the shareholding in Bank of Italy
CAGR07 PF (*)-10E
CAGR07 PF (*)-10E
2007PF (*)
2007PF (*)
Net Profit (€m)
Shareholders’ Equity (€b)
ROE adj (**)
Cost Income
Tier 1
ROE
Total Deposits (€b)
Loans to customers (€b)
350 13.7%
4.3 6.4%
9.8%
49.9%
205
2.6
10.3%
53.2%
8.2%7.8%
59.1 11.0%37.6
27.4 12.8%17.5
+1.9 pp+2.2 pp
-2.7 pp
138
2.6
7.1%
57.6%
5.4%
35.8
16.1
238
3.6
7.6%
52.6%
6.3%
43.2
19.1
ROAE adj (**) 10.4% +0.6 pp7.8% 9.4% 10.0%
8.4%7.8%8.3% 7.2% Target 2008E> 8%
Target 2008E> 8%

BANCA CARIGE 19
Cagr2007PF-2010E
57.6
2006
53.2
2007
49.9
2010E
52.6
2007PF
Cost income %
Includes the impact of investments in IT for
150 million in 3 years
503515
+2.4%
577
+14.7%
709
+7.1%
2006 2007 2010E2007PF
Revenues (€m)
874
968+10.8%
1,096+25.4%
1,420+9.0%
2006 2007 2010E2007PF
Operating costs (€m)
Cost income below 50%Revenues growth is expected mainly from net
interest income
2006 2007 2010E2007PF
874
968+10.8%
1,096+25.4%
1,420+9.0%
Cagr2007PF-2010E
Non interest income
Net interest income
558
659+18.1%
316310
-2.1%
723+29.6%
992+11.1%
375+18.7%
428+4.5%
2006 2007 2010E2007PF
2006 2007 2010E2007PF
REVENUES (€m)
+
+
Cost income below 50% Revenues growth is expected mainly from net interest income
2007PF data include the effects connected to the 79 ex ISP branches and capital increase
Targets for key performance indicators

BANCA CARIGE 20
2006 2007 2010E2007PF
16.1
17.5+8.8%
18.9+17.6%
27.4+13.3%
Cagr2007PF-2010E
4.24.4
+5.1%
4.7+10.6%
7.2+15.7%
2006 2007 2010E2007PF
Cagr2007-2010E
11.312.4
+10.5%
13.6+20.9%
2006 2007 2010E2007PF
19.9+13.5%
2007PF data include the effects connected to the 79 ex ISP branches and capital increase
of which:
Loans to customers (€b)Loans to customers (€b)
IndividualsIndividuals CorporatesCorporates
Total deposits (€b)Total deposits (€b)
Cagr2007PF-2010E
Short termShort term M/L termM/L term
2006 2007 2010E2007PF
35.8
37.6+5.1%
42.6+19.1%
59.1+11.5%
16.3
17.4+6.6%
18.8+15.3%
28.4+14.7%
2006 2007 2010E2007PF
Direct depositsDirect deposits Indirect depositsIndirect deposits
19.5
20.2+3.9%
23.8+22.4%
30.7+8.8%
2006 2007 2010E2007PF
++
We expect a double digit growth of loans
Both direct and indirect deposits are expected to grow
Strong growth prospects
5.15.7
+12.6%
6.6+30.3%
8.8+10.0%
2006 2007 2010E2007PF
9.710.6
+9.4%
11.1+14.6%
2006 2007 2010E2007PF
16.2+13.3%

BANCA CARIGE 21
Data refer to 31-Dec-07. Loans to customers € 17.5 b
Medium/long term loans splitting
Cash loans concentration
loans tocorporates
59.1%
mortgage loansto individuals
37.3%consumer
credit3.7%
medium/long term
68.5%short term
27.9%
bad loans3.6%
5%
10%
15%
20%
25%
17,6% 16,9% 13,9% 11,3% 10,2%
First 30 groups 20,6% 19,3% 16,2% 13,5% 12,2%
First 50 groups 24,7% 22,8% 19,2% 16,7% 14,9%
5%
10%
15%
20%
25%
First 20 groups 17.6% 16.9% 13.9% 11.3% 10.2%
20.6% 19.3% 16.2% 13.5% 12.2%
24.7% 22.8% 19.2% 16.7% 14.9%
dic-02 dic-03 dic-04 dic-05 dic-06 dic-07
10,2%
12,6%
10.2%
15.4%
Loans to customers allocation and concentration Financial assets splitting
Data refer to 31-Mar-08 Operational data
(*) Data do not include the shareholding in Bank of Italy and the notional value underlying customers’ index linked policies
CARIGE group financial assets (*)
Debt securities, securitisation and structured notes rating (*)
(1) Including 508.2 million of swapped debt securities(2) Including 6 million of swapped structured notes
(1) Including 508.2 million of swapped debt securities and 6 million of swapped structured notes
(€m)
Equities and private equity 316.8
Securitisation 86.4
Mutual Funds 252.9
Debt securities 1 2,851.1
Hedge Funds 54
Structured notes 2 382.7
GRAND TOTAL 3,943.9
(€m)
AAA 204.3
AA 1,810.6
A 766.4
BBB 286.0
Other 252.9
TOTAL 1 3,320.2
Review of key financial assets
AAA6,2%
AA54,5%
A23,1%
BBB8,6%
Other7,6%
Exposure to Sub-prime: < 1‰No exposure to monoline
Mutual f und6,4%
Debt secur ities
72 3%
Hedge f unds1,4%
Str uctur ed notes9,7%
Secur itisation2,2%
Equities and pr ivate equity
8,0%

BANCA CARIGE 22
79 BRANCHES79 BRANCHES
Direct Deposits
€1.4b
Indirect Deposits
€3.6b
Loans€1.4b
Customers170,000
134
4 at 10 March 2008
25
15
… achieving an improving market share in wealthy provinces
The 79 ISP branches are more worththan the previous ones
AostaAostaPaduaPaduaVeniceVenice RovigoRovigo SassariSassariPaviaPavia ComoComoTurinTurin
Carige - ante
Branches n.
Market share
10
0.9%
5
1.6%
3
0.9%
0
0.0%
3
0.5%
0
0.0%
0
0.0%
3
1.4%
Carige - post
Branches n.
Market share
25
2.2%
11
3.4%
22
6.3%
18
3.6%
18
2.9%
1
0.6%
1
1.0%
7
3.3%
8.2% of Italian loans (*)8.2% of Italian loans (*)
The 8 provinces make:The 8 provinces make:
9.7% of Italian deposits (*) 9.7% of Italian deposits (*) 10.8% of Italian GDP(**) 10.8% of Italian GDP(**)
(*) Source: Bank of Italy; data at 31 Dec 2007. (**) Source: Unioncamere; data at 31 Dec 2006.
79
ISP branches(at 10/03/08)
21
BDSbranches(2000)
61
Intesabranches(2001)
42
Capitaliabranches(2002)
79754
1,4065,0206,426
5547
17.863.5
2.59.1
17.1%
21-
21
50406456
864.1
2.419.3
0.64.7
14.8%
613625
6191,3992,018
3345.5
10.122.9
1.94.2
19.5%
422
40
6301,4912,120
3979.5
15.035.5
1.63.8
8.4%
Number of branchesNorth
Centre and South
Loans (€m)Total deposits (€m)
Intermediation (€m)
EmployeesEmployees/branches
Loans/branches (€m)Total deposits/branches
Loans/employees (€m)Deposits/employees (€m)
Goodwill/Total deposits
Data refer to the year of the deal
21%for northbranches
Carige purchased 79 branches from Intesa Sanpaolo …
Value creation via external growth:79 branches acquired from Intesa Sanpaolo
BANCA CARIGE 23
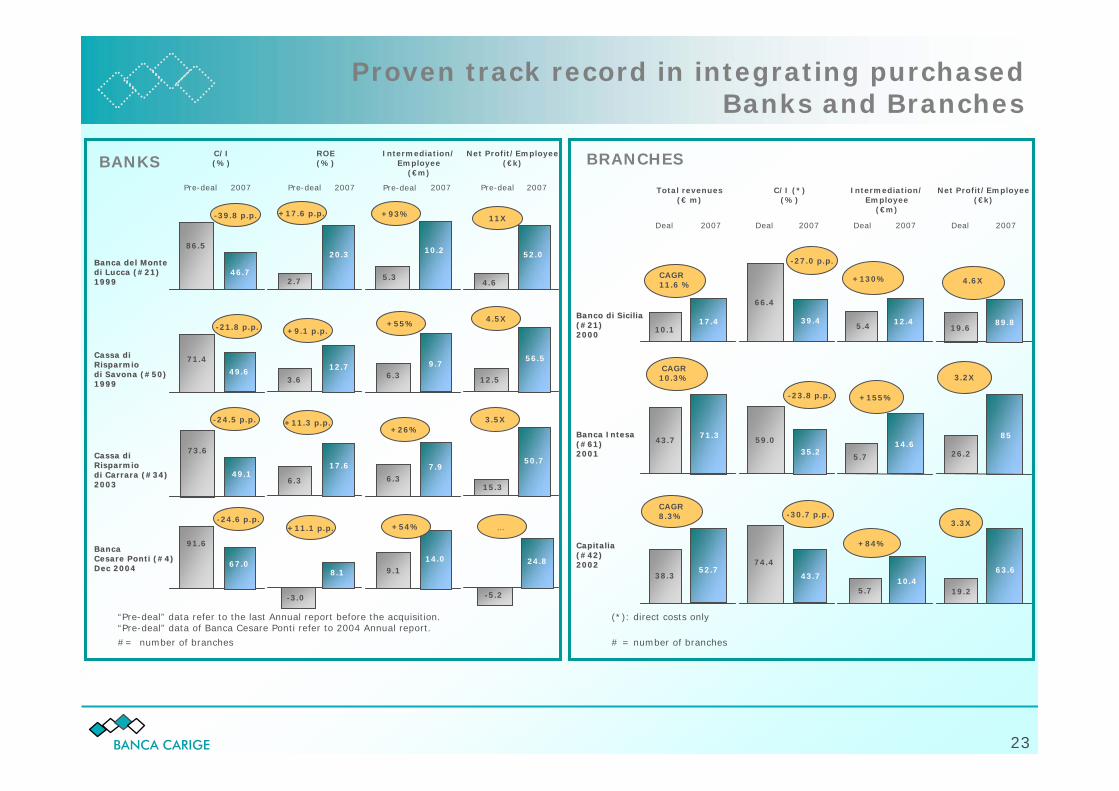
“Pre-deal” data refer to the last Annual report before the acquisition.“Pre-deal” data of Banca Cesare Ponti refer to 2004 Annual report.
Banca del MonteBanca del Montedi Lucca (#21)di Lucca (#21)19991999
Cassa di Cassa di RisparmioRisparmiodi Savona (#50)di Savona (#50)19991999
Cassa di Cassa di RisparmioRisparmiodi Carrara (#34)di Carrara (#34)20032003
BancaBancaCesare Ponti (#4)Cesare Ponti (#4)DecDec 20042004
C/I(%)
Pre-deal 2007
ROE(%)
Pre-deal 2007
46.7
86.5
-39.8 p.p.
71.4
49.6
-21.8 p.p.
49.1
73.6
-24.5 p.p.
91.6
-24.6 p.p.
67.0
20.3
2.7
+17.6 p.p.
12.7
3.6
+9.1 p.p.
17.6
6.3
+11.3 p.p.
8.1
-3.0
+11.1 p.p.
BANKS
#= number of branches
Intermediation/Employee
(€m)
2007 Pre-deal
Net Profit/Employee(€k)
2007Pre-deal
10.2
5.3
+93%
52.0
4.6
11X
6.39.7
+55%
7.96.3
+26%
50.7
15.3
3.5X
9.114.0
+54%
56.5
12.5
4.5X
24.8
-5.2
…
Banco di SiciliaBanco di Sicilia(#21)(#21)20002000
Banca IntesaBanca Intesa(#61)(#61)20012001
CapitaliaCapitalia(#42)(#42)20022002
(*): direct costs only
Total revenues(€ m)
BRANCHES
# = number of branches
C/I (*)(%)
Deal 2007 2007
CAGR11.6 %
10.117.4
CAGR10.3%
43.771.3
59.035.2
-23.8 p.p.
CAGR8.3%
52.738.3
66.4
39.4
-27.0 p.p.
43.7
74.4
-30.7 p.p.
Intermediation/Employee
(€m)
Net Profit/Employee(€k)
2007
+130%
5.4 12.4
+155%
5.7
14.6
+84%
10.45.7
2007
4.6X
19.689.8
3.2X
26.2
85
3.3X
63.6
19.2
Deal Deal Deal
Proven track record in integrating purchased Banks and Branches

BANCA CARIGE 24
38 BRANCHES38 BRANCHES
Direct Deposits
€0.5b
Indirect Deposits
€0.7b
Loans€0.4b
Customers67,000
1
5
1
8
23
SICILY 23PALERMO 12MESSINA 4CATANIA 2AGRIGENTO 2SYRACUSE 3
LATIUM 8ROME 8
UMBRIA 1PERUGIA 1
EMILIA ROMAGNA 5BOLOGNA 2RIMINI 2FORLI’ 1
VENETO 1VERONA 1
The acquisition of branches from UniCredit

BANCA CARIGE 25
CARIGE has drawn up a new plan of openings between 2008 and 2010. Most of them will take place in the regions next to Liguria (Lombardy, Piedmont, Emilia-Romagna, Tuscany, South France), in order to enhance the brand where it already exists.
The Plan foresees 69 openings
between 2008 and 2010The localization of the new branches meets two main principles:
- market attractiveness (potential customers, competition)
- achievement of a market share of 3-5%
CR Carrara
TOTAL
51
7
9
69
NEW BRANCHES BY BANK
A new plan of internal growth
2
The plan may be revised according to the latest acquisitions

BANCA CARIGE 26
2008-2010 Strategic Plan foresees IT investments for ~ 150 €m in order to: • raise the operating processes efficiency• improve the commercial effectivenessThe increase of IT costs in the next three years will be offset by savings on personnel expenses: only 65% of the staff that is going to retire will be replaced (apart from the recruiting for the new openings and the ex ISP employees).
5.4%6.1%
2007 2010
33.6% 29.5%
2007 2010
39.0%
35.6%
2007 2010
IT+HR Costs / revenues
IT costs / revenues
HR costs / revenues
5.0%
43.0%
48.0%
2005
2005
2005
IT innovation Main projects
NEW FRONT OFFICE
JV-CONSUMER CREDIT
BASEL II
PRODUCTION DISTRIBUTION SUPPORT
NEW OPENINGS
LIGURIA PROJECT(CUSTOMER SEGMENTATION)
COMMERCIAL STRENGTHENING PROGRAMME
COLLABORATION BRANCHES-INSURANCE AGENTS
REMOTE CHANNELS(microchip, ATM)
ISP BRANCHES INTEGRATION
LEAN ORGANISATION
PFP
IT innovation and main projects

BANCA CARIGE 27
Contents
CARIGE Group at a glance
2008-2010 business plan and strategic highlights
Ratings, capitalisation and funding strategy
CARIGE Group consolidated financial review

BANCA CARIGE 28
Moody’s S&P’s FitchThe rating reflects the bank's strong franchise in Italy's north-western regionof Liguria, where it has market shares of around 30% for deposits and 25% for loans, its satisfactory financialfundamentals and the need to strengthen controls.
The ratings on Banca Carige SpA reflect the bank's strong franchise in its home Region of Liguria and adequate overall financial profile, including adequate profitability, supported by sound revenuegeneration and improving efficiency, and good liquidity.
The ratings of Banca Carige (Carige) reflect its strong market share in its home region of Liguria, as well as improved risk management procedures and its prospects for a steady growth in profitability.
The bank's loan portfolio shows a good level of industry diversification, although with some concentration in construction which is however performing well in Liguria.
Capitalization is adequate, albeit penalized by Carige's capital-intensive insurance operations. Despite the bank's recent branch network acquisition, for a cost of about €900 million, Carige was able to respect its Tier 1 target ratio of approximately 8%.
The quality of Carige’s loan book is worse than that of similarly rated peers. However, credit risk management has been improving, in line with the investments required for Basel II.
Risk control processes have traditionally been unsophisticated, although management is focused on upgrading them, notably through Basel II implementation.
/ /
The stable outlook reflects S&Ps’expectation that Carige will maintain an overall adequate financial performanceas revenue and cost synergies from the latest branch acquisitions should offset the margin pressure from a deteriorating economic environment.
A2 StableApril 4, 2008
A- StableMarch 17, 2008
A StableDecember 21, 2007
Ratings, capitalisation and funding strategy
Profitability remained modest, despite progress made in integrating the various acquisitions of smaller banks andbranch networks in recent years.
Carige's capitalisation is prudent, supported by a sound core Tier 1 ratio of 7.1% in 2004-2006. The Tier 1 reached a sound 7.8% in June 2007.
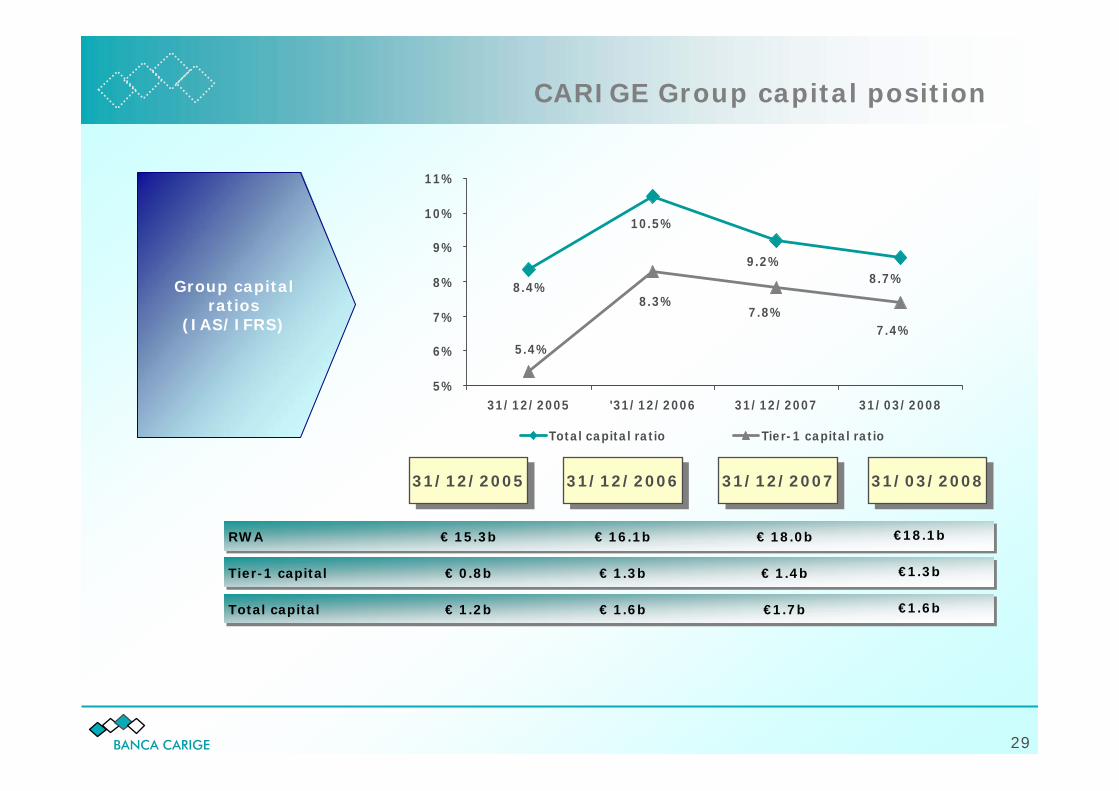
BANCA CARIGE 29
Group capital ratios
(IAS/IFRS)
RWA
31/12/200731/12/200731/12/200631/12/2006
€ 16.1b
CARIGE Group capital position
8.7%9.2%
10.5%
8.4%
7.4%7.8%
8.3%
5.4%
5%
6%
7%
8%
9%
10%
11%
31/12/2005 '31/12/2006 31/12/2007 31/03/2008
Total capital ratio Tier-1 capital ratio
Tier-1 capital
Total capital
€ 1.3b
€ 1.6b
€ 18.0b
€ 1.4b
€1.7b
31/12/200531/12/2005
€ 15.3b
€ 0.8b
€ 1.2b
€18.1b
€1.3b
€1.6b
31/03/200831/03/2008
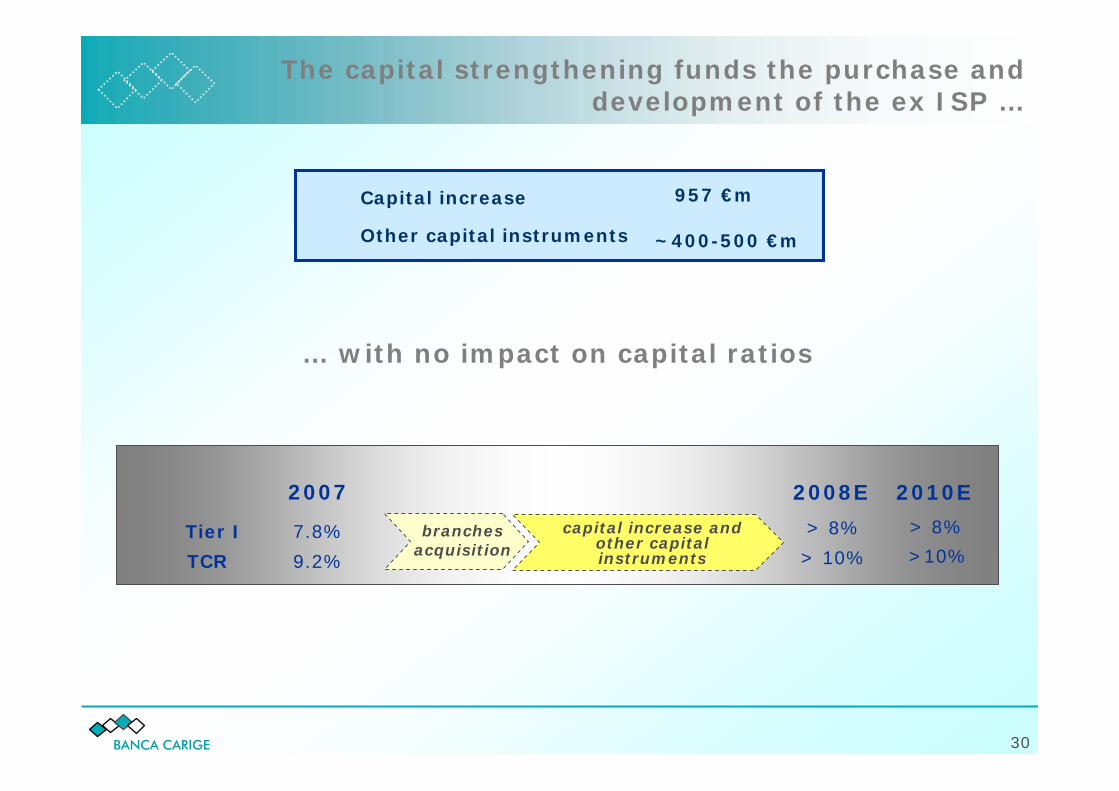
BANCA CARIGE 30
The capital strengthening funds the purchase and development of the ex ISP …
… with no impact on capital ratios
Tier I
TCR
2007
capital increase and other capital instruments
7.8%
9.2%
2008E
> 8%
> 10%branches
acquisition
~400-500 €m
Capital increase
Other capital instruments
957 €m
2010E
> 8%
>10%

BANCA CARIGE 31
Funding strategy: key pillars
Business strategic guidelines
1) Support the loan growth strategy
• Shifting structure of loans towards medium/long term at system level
2) Group focus on businesses (i.e. mortgages and corporate lending) structurally generating
growth of long term assets
Key actions to achieve business targets (Funding strategy)
A. Diversify funding sources maintaining a good balance among them (strong retail customer
funding base and institutional funding)
B. Access the capital markets to support the Group’s organic growth and capitalisation ratios
• EMTN programme in support of medium/long-term lending strategy
• Covered bond as new funding tool to improve the cost of funding on the medium-long
term indebtness
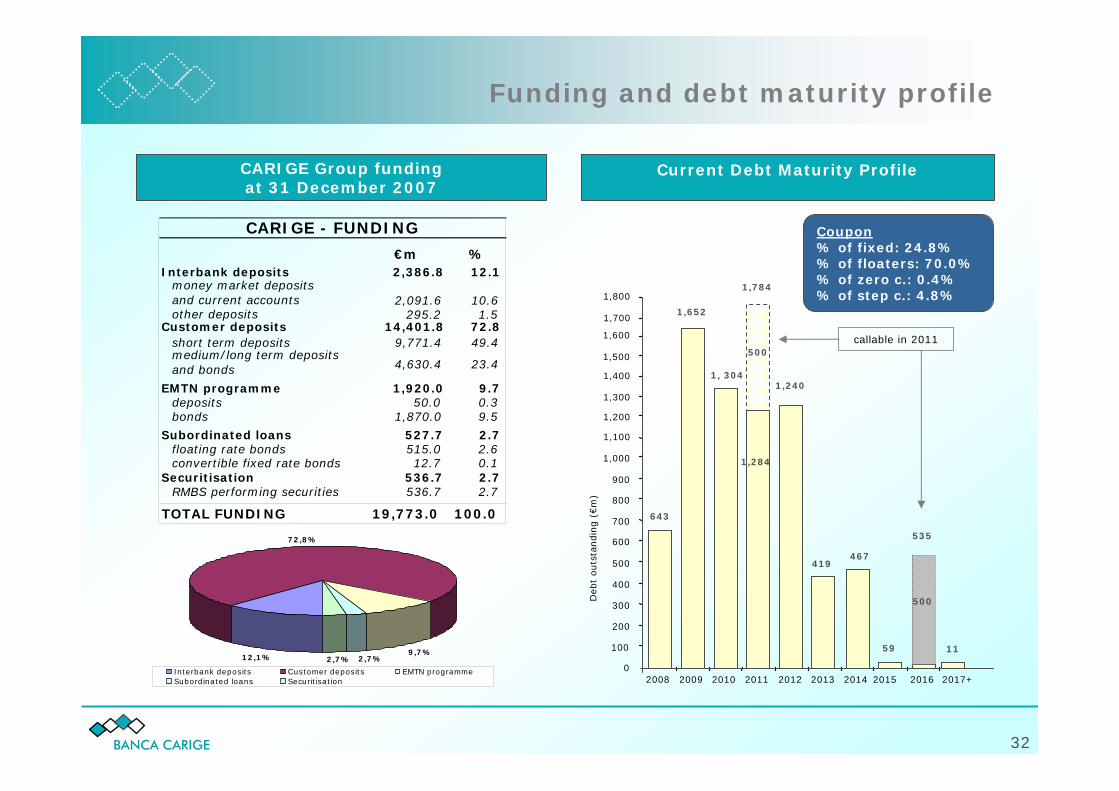
BANCA CARIGE 32
CARIGE Group fundingat 31 December 2007
12,1%
72,8%
9,7%2,7%2,7%
Interbank deposits Customer deposits EMTN programmeSubordinated loans Securitisation
Coupon% of fixed: 24.8%% of floaters: 70.0%% of zero c.: 0.4%% of step c.: 4.8%
callable in 2011
643
1,652
1, 3041,240
467
59
0
100
200
300
400
500
600
700
800
900
1,000
2008 2009 2011 2012 2013 2014 2015 2016
Deb
t outs
tandin
g (
€m
)
2017+
11
2010
1,100
1,200
1,300
1,400
1,784
500
419
500
535
1,500
1,600
1,700
1,800
1,284
CARIGE - FUNDING
€m %Interbank deposits 2,386.8 12.1
money market deposits and current accounts 2,091.6 10.6 other deposits 295.2 1.5
Customer deposits 14,401.8 72.8 short term deposits 9,771.4 49.4 medium/long term deposits and bonds 4,630.4 23.4
EMTN programme 1,920.0 9.7 deposits 50.0 0.3 bonds 1,870.0 9.5
Subordinated loans 527.7 2.7 floating rate bonds 515.0 2.6 convertible fixed rate bonds 12.7 0.1
Securitisation 536.7 2.7RMBS performing securities 536.7 2.7
TOTAL FUNDING 19,773.0 100.0
Current Debt Maturity Profile
Funding and debt maturity profile

BANCA CARIGE 33
Contents
CARIGE Group at a glance
2008-2010 business plan and strategic highlights
Ratings, capitalisation and funding strategy
CARIGE Group consolidated financial review

BANCA CARIGE 34
Financial performance
%change
%change €€mm FY
2006FY
2006FY
2007FY
2007
Gross operating income
of which: Net interest income
Net Commissions
Dividends
Profit (losses) from equity investments
968.4658.9
250.2
24.0
35.3
10.8%
18.1%
-1.2%-0.1%
-8,9%
874.1
558.1
253.224.1
38.7
Operating costs
of which: Net provisions for risks and charges
515.3 2.4%503.1
Operating profit from ordinary activities before taxes 369.6 54.5%239.2
Net profit of the year (net of minority interests)
Net income from financial and insurance management
875.6 19.3%734.0
3.1 -63.1%8.4
Net value adjustment 82.5 -7.5%89.1
204.8 48.6%137.9
BANCA CARIGE 35
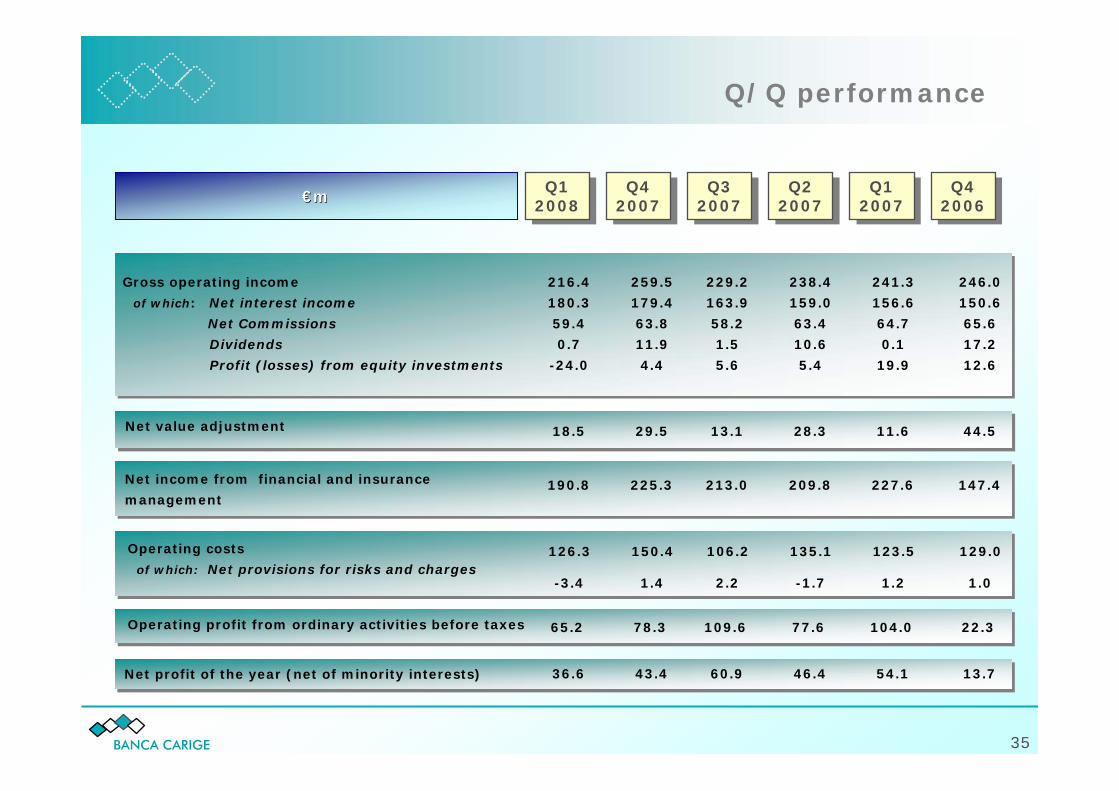
€€mm
Q/Q performance
Q12008
Q12008
Q42007
Q42007
Q32007
Q32007
Q22007
Q22007
Q12007
Q12007
Q42006
Q42006
Gross operating income
of which: Net interest income
Net Commissions
Dividends
Profit (losses) from equity investments
Operating costs
of which: Net provisions for risks and charges
Operating profit from ordinary activities before taxes
Net profit of the year (net of minority interests)
Net income from financial and insurance
management
Net value adjustment
246.0
150.6
65.6
17.2
12.6
129.0
22.3
1.0
147.4
44.5
13.7
241.3
156.6
64.7
0.1
19.9
123.5
104.0
1.2
227.6
11.6
54.1
238.4
159.0
63.4
10.6
5.4
135.1
77.6
-1.7
209.8
28.3
46.4
229.2
163.9
58.2
1.5
5.6
106.2
109.6
2.2
213.0
13.1
60.9
259.5
179.4
63.8
11.9
4.4
150.4
78.3
1.4
225.3
29.5
43.4
216.4
180.3
59.4
0.7
-24.0
126.3
65.2
-3.4
190.8
18.5
36.6
BANCA CARIGE 36
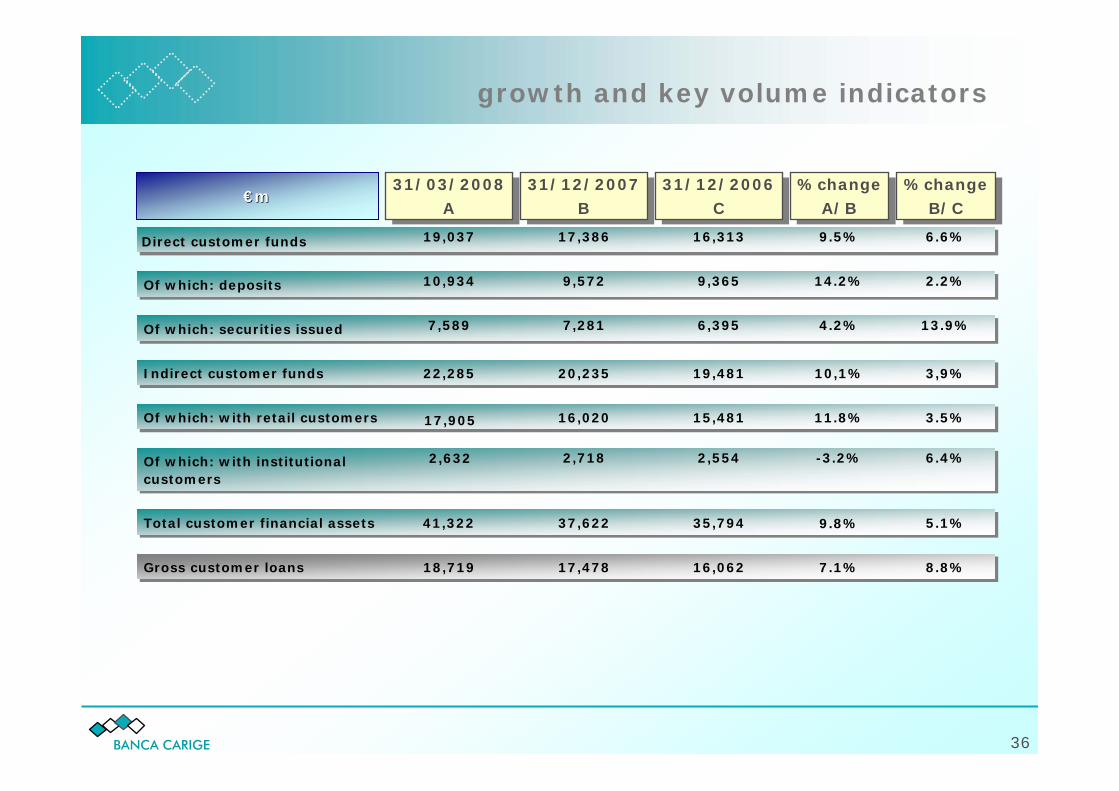
Direct customer funds
€€mm
growth and key volume indicators
31/03/2008A
31/03/2008A
Of which: deposits
Of which: securities issued
Indirect customer funds
Total customer financial assets
Gross customer loans
10,934
7,589
41,322
18,719
31/12/2007B
31/12/2007B
31/12/2006C
31/12/2006C
%changeA/B
%changeA/B
%changeB/C
%changeB/C
Of which: with retail customers
Of which: with institutionalcustomers
22,285
19,037
9,572
7,281
37,622
17,478
20,235
16,020
17,386
2,718
9,365
6,395
35,794
16,062
19,481
15,481
16,313
2,554
14.2%
4.2%
9.8%
7.1%
10,1%
11.8%
9.5%
-3.2%
2.2%
13.9%
5.1%
8.8%
3,9%
3.5%
6.6%
6.4%
17,905
2,632

BANCA CARIGE 37
1,40%1,30%1,40%
1,20%1,20%1,30%
0,1%
0,6%
1,1%
1,6%
2,1%
2,6%
31/12/2006 31/12/2007 31/03/2008
Gross watchlist loan ratio Net watchlist ratio
3,60% 3,30%3,70%
1,6% 1,5%1,8%
0,1%
1,1%
2,1%3,1%
4,1%
5,1%
6,1%
31/12/2006 31/12/2007 31/03/2008
Gross NPL loan ratio Net NPL ratio
Conservative NPL coverage policy, which has been progressing over time
NPL ratio Watchlist loan ratio
Breakdown of gross NPL (€m) 31/12/2006 31/12/2007 31/03/2008
Bad loansWatchlistRescheduled loansExpired loans
NPL
Coverage of gross NPLs
620.7223.4
6.0236.7
1,086.8
55.6%
598.7223.0
11.8184.6
1,018.1
52.0%
614.5257.5
4.1251.0
1,127.1
55.4%
Note: Consolidated data

BANCA CARIGE 38
ROE adj. (*)Net interest income/Total revenues
Net commission income/Total revenues
Q12008
Q12008
FY2006
FY2006
10.3% 7.1%4.8%
FY2007
FY2007
Profitability
Cost efficiency & productivity
Asset quality
68.0% 63.8%83.3%
25.8% 29.0%27.4%
Total operating costs /Total op. revenues
Total op. costs/avg. employees (€’000)
Total op. revenues/avg. employees (€’000)
53.2% 57.6%58.3%102.1 99.326.3
191.8 172.640.5
Net NPL ratio
Net watchlist loan ratio
Net NPLs/shareholders’ equity
Performing loan coverage
31/03/200831/03/2008 31/12/200631/12/200631/12/200731/12/2007
1.6% 1.8%1.5%
1.2% 1.3%1.2%
10.5% 11.3%7.4%0.45% 0.43%0.46%
Indicators
(*) Equity net of the reserve for the revaluation of the shareholding in Bank of Italy. Annualised