case control study: magnetic resonance spectroscopy · pdf filelevels in patients with hiv...
TRANSCRIPT
RESEARCH ARTICLE Open Access
Case control study: magnetic resonancespectroscopy of brain in HIV infectedpatientsDevender Bairwa1, Virendra Kumar2, Surabhi Vyas3, Bimal Kumar Das4, Achal Kumar Srivastava5,Ravinder M. Pandey6, Surendra K. Sharma1, Naranamangalam R. Jagannathan2 and Sanjeev Sinha1*
Abstract
Background: In vivo proton magnetic resonance spectroscopy (1H-MRS) studies on brain in HIV infected patientshave shown significant alteration in neuro-biochemicals.
Methods: In this study, we measured the neuro-biochemical metabolites from the left frontal white matter (FWM)and left basal ganglia (BG) caudate head nucleus in 71 subjects that include 30 healthy controls, 20 asymptomaticHIV and 21 HIV patients with CNS lesion. Proton MR spectra were acquired at 3 T MRI system and the concentration(institutional units) of tNAA (N-acetylaspartate, NAA + N-acetylaspartylglutamate, NAAG), tCr (Creatine, Cr +phosphocreatine, PCr), choline containing compounds (tCho), glutamate + glutamine (Glx) and lipid andmacromolecules at 0.9 ppm were determined using LC Model.
Results: In BG, the concentration of tNAA (6.71 ± 0.64) was decreased and in FWM, the concentration of Glx(20.4 ± 7.8), tCr (9.14 ± 3.04) and lipid and macromolecules at 0.9 ppm (8.69 ± 2.96) were increased in HIVpatients with CNS lesion. In healthy controls, the concentration of tNAA in BG was 7.31 ± 0.47 and concentration of Glx,tCr and lipid and macromolecules in FWM were 15.0 ± 6.06, 6.95 ± 2.56, 5.59 ± 1.56, respectively.
Conclusion: Reduced tNAA in BG suggests neuronal loss in HIV patients with CNS lesion while increased Glx in FWMmay suggest excito-toxicity. In addition, increased levels of tCr in FWM of HIV patients were observed. The studyindicates region specific metabolic changes in tNAA, tCr and Glx in brain of HIV infected patients.
Keywords: Magnetic resonance spectroscopy, MRS, HIV, AIDS, Glutamate
BackgroundHuman immunodeficiency virus (HIV) continues to be amajor global public health issue. Approximately 36.9[34.3–41.4] million people were living with HIV in 2014whereas 2.0 [1.9-2.2] million people died of HIV relatedillnesses in 2014 and more than 95 % of all HIV-infectedpeople now live in developing world [1]. India ranksthird with the estimated number of people living withHIV/AIDS is approximately 2.089 million (2012) with anestimated adult (15–49 age group) HIV prevalence of0.27 % in 2011 [2].
Central nervous system (CNS) involvement in HIVcan occur both early as well as late. Early involvement ischaracterized by impaired abstracting ability, learningdifficulties and slow speed of information processing.Late involvement of CNS can be either by neoplasms oropportunistic infections [3].Opportunistic infection includes toxoplasmosis,
cryptococcosis, progressive multifocal leucoencephalopa-thy and tuberculosis. Neoplasms include primary CNSlymphoma, Kaposi’s sarcoma and result of HIV-1 infec-tion includes aseptic meningitis, HIV-associated neuro-cognitive impairment, including HIV encephalopathy/AIDS dementia complex [4].MRS studies of brain have reported change in metab-
olite levels in HIV patients. Many studies have reportedchanges in N-acetylasparatate (NAA) and creatine (Cr)
* Correspondence: [email protected] of Medicine, All India Institute of Medical Sciences, AnsariNagar, New Delhi 110029, IndiaFull list of author information is available at the end of the article
© 2016 The Author(s). Open Access This article is distributed under the terms of the Creative Commons Attribution 4.0International License (http://creativecommons.org/licenses/by/4.0/), which permits unrestricted use, distribution, andreproduction in any medium, provided you give appropriate credit to the original author(s) and the source, provide a link tothe Creative Commons license, and indicate if changes were made. The Creative Commons Public Domain Dedication waiver(http://creativecommons.org/publicdomain/zero/1.0/) applies to the data made available in this article, unless otherwise stated.
Bairwa et al. BMC Neurology (2016) 16:99 DOI 10.1186/s12883-016-0628-x
levels in different regions of brain, however, the resultsreported across these studies are not consistent andsometimes contradictory [5–8]. Chong et al. [5] reportedthat there is significant reduction in the mean NAA tocholine (Cho) ratio and NAA/Cr and an increase inCho/Cr was observed in HIV patients with immunosu-pressed state and neurologic signs. Suwanwelaa et al. [7]showed a statistically significant reduction in NAA/Crand NAA/Cho in centrum semiovale and thalamic areaswith no statistically significant difference in Cho/Cr andmI/Cr in both the regions. The difference of NAA/Crwas more pronounced in white matter than in gray mat-ter. In addition, HIV infection has been linked withneuro-cognitive impairment which has been shown toresult in increased excite-toxicity of glutamate [9, 10]. Inthis context, glutamate concentration in brain has beenstudied and found to be significantly increased in CSF,plasma and brain tissues by using biochemical methodsin patients with HIV infection [9]. In the present study,we have quantified changes in brain neuro-biochemicallevels in patients with HIV infection at 3.0 Tesla usingin vivo single voxel proton magnetic resonance spectros-copy (1H MRS).
MethodsParticipantsA total of 71 subjects were recruited under this study fromMarch 2014 to October 2015 including 30 healthy sub-jects (Group 1), 20 HIV asymptomatic patients (Group 2)and 21 HIV patients with CNS lesions (Group 3). InstituteEthics Committee approved the study and written in-formed consent was obtained from all the participants inthe study. In case of patients with altered sensorium, con-sent was obtained from their relatives accompanying themto the hospital. Healthy subjects were with no history ofhigh risk behavior, any prolonged medical or surgicalillness.
Physical examination and neurological evaluationAll the subjects underwent general physical examinationand detailed clinical neurological examination. Subjectsin Group 2 included sero-positive HIV patients withCD4 count <500/ul and on anti-retroviral therapy(ART), with normal neurological, neuropsychologicalexamination and no apparent CNS involvement andwere screened with the help of international HIV de-mentia scale for any possible subclinical HIV associatedneuro-degeneration (HAND). Group 3 included HIV pa-tient, with CNS involvement apparent on imaging (MR,CT, PET), blood investigations or CSF study. Socioeco-nomic status was derived by using Modified Kuppus-wamy Scale last modified in 2012 [11]. For allparticipants baseline respiratory rate, heart rate, bloodpressure and temperature were recorded.
Biochemical investigationsHIV status was confirmed for all subjects using ELISAfor HIV1 and HIV2 infection. In case of patients inGroup 2 and Group 3, most recent CD4 count was re-corded. Since neuro-biochemical levels are affected bydyslipidemia, diabetes and other derangement of normalphysiology, laboratory parameters were obtained for allthe participants. These included, complete blood counts,kidney function test, liver function test, fasting lipid pro-file and a fasting blood glucose level.
Magnetic resonance imaging and spectroscopyAll MR studies were carried out on a whole body 3 TeslaMRI scanner (Achieva/Ingenia, Phillips Healthcare, TheNetherlands). Routine MRI of brain including multi-sliceT2-weighted axial images in three orthogonal planes anddiffusion-weighted images acquired with a standard headcoil. T2-weighted images in three orthogonal planeswere used to guide the localization of brain areas,namely, left frontal lobe white matter (FWM) and leftbasal ganglia (BG) (caudate head nucleus) for acquisitionof 1H MR spectra using single voxel MR spectroscopy.In addition, voxel was placed on the CNS lesion in sub-jects of Group 3. It was also ensured that the selectedvoxel in the FWM or BG of HIV patients with CNS le-sions did not include any lesion or part of it. Single voxel1H MRS spectra were acquired with a point resolvedspectroscopy (PRESS) localization pulse sequence at anecho time (TE) of 35 ms and a repetition time (TR) of2000 ms with 64 or 128 scans. The voxel size used foracquiring the MRS was 16 mm × 16 mm × 16 mm forthe FWM and 12 mm× 12 mm × 12 mm to 14 mm ×14 mm × 14 mm for the BG depending upon the individ-ual subject’s brain anatomy. The absolute concentrationsof neuro-biochemicals were estimated using LinearCombination Model software (LC Model, version 6.3-1)which performs deconvolution of spectra by using abasis set of reference spectra [12]. The preprocessing ofMR spectra is fully automated by LCModel softwareincluding phase, baseline and eddy current correction.Water scaling method using unsuppressed waterspectrum acquired from the same voxel used for acquir-ing water suppressed spectrum. Basis set of spectra (pro-vided by the vendor) for individual neuro-biochemicalwas used for automatic fitting routine for estimating theabsolute concentration and the Cramer-Rao LowerBounds values for each metabolite. The metabolite con-centrations were reported as obtained directly from theLCModel output and were not corrected for T1 and T2relaxation effects. This method includes correction forT2 relaxation time and the number of 1H nuclei contrib-uting to the resonance peak. In the 1H MR spectrum ob-tained, the main resonance peaks identified were arisingfrom tNAA (NAA +N-acetylaspartylglutamate, NAAG)
Bairwa et al. BMC Neurology (2016) 16:99 Page 2 of 10

at 2.0 ppm, tCr (Cr + phosphocreatine, PCr) at 3.0 ppm,Cho-containing compounds (tCho) at 3.2 ppm, glutam-ate + glutamine (Glx) at 2.2-2.4 ppm, myoinositol (mI) at3.5 ppm and lipid/macromolecule (Lip09 +MM09) at0.9 ppm. These resonances were analyzed to estimatethe concentration (in institutional units) of respectivemetabolite and the Cramer-Rao lower bounds for all me-tabolites analyzed in the study were below 15 %.
StatisticsData was analysed by Stata 12 (Statacorp 4905, LakewayDrive, College Station, Texas) and described by mean,standard deviation, frequency and percentage. Karl-Pearson/ Spearman correlation coefficient was used toassess the correlation between two continuous variables.Continuous variables were compared among the Groupby one way ANOVA followed by post-hoc comparison
with Bonferroni correction. p-value less than 0.05 wasconsidered as significant.
ResultsDemographic profile and clinical featuresMean age among three Groups was not statistically differ-ent with the mean age of Group 1 34.3 ± 12.5 years, Group2, 37.0 ± 13.1 years and 37.3 ± 10.6 years in Group 3. 50subjects (70.4 %) were male whereas 21 subjects (29.6 %)were female, 48 subjects (67.6 %) were married and 23subjects (32.4 %) were unmarried (Table 1).The mean duration between ART initiation and MRS
study for Group 2 is 6.3 ± 5.9 months whereas for Group3, most of the patients were examined within a monthof ART therapy except 3 patients which were studied at3, 38 and 144 months. However, it is difficult to knowthe exact time of HIV infection.
Table 1 Comparison of baseline characteristics among three groups
Variable Healthy controls Asymptomatic HIV HIV with CNS lesion Total
Group 1 Group 2 Group 3
n = 30 n = 20 n = 21
Gender
Male 19 11 20 50 (70.42 %)
Female 11 09 01 21 (29.58 %)
Marital status
Married 16 17 15 48 (67.61 %)
Unmarried 14 03 06 23 (32.39 %)
Socioeconomic status
Upper (I) 17 02 01 20 (28.17 %)
Upper Middle (II) 06 03 02 11 (15.49 %)
Lower Middle (III) 02 05 03 10 (14.08 %)
Upper Lower (IV) 04 06 15 25 (35.21 %)
Lower (V) 01 04 00 05 (07.04 %)
High risk behavior
None 30 00 00 30
Not specified 00 04 01 05
Heterosexual intercourse 00 13 18 31
I.V. needle sharing 00 00 02 02
Blood transfusion 00 01 00 01
Tattooing 00 01 00 01
From spouse 00 01 00 01
Presenting complaints
None 30 00 00 30
Fever 00 11 08 19
Altered sensorium 00 00 11 11
Retrospective after spouse 00 03 00 03
Antenatal screening 00 02 00 02
Others 00 04 02 06
Bairwa et al. BMC Neurology (2016) 16:99 Page 3 of 10
No history of high risk behavior was seen in healthysubjects; heterosexual intercourse was found to be mostcommon mode (31 patients) of HIV transmission inGroup 2 and Group 3. Other high risk behaviors in-clude I.V. needle sharing (2 patients), blood transfusion(1 patient), and tattooing (1 patient), from affectedspouse (1 patient) and in 5 HIV patients no specific eti-ology could be elicited on the basis of the history. Themost common complaint in Group 2 was fever (55 %)followed by other causes (20 %), retrospective diagnosisafter spouse (15 %) followed by during ante natalcheck-up (10 %). In Group 3, the most common present-ing complaint was altered sensorium (52.4 %), followed byfever (30.1 %) and other causes (9.5 %) (Table 1) .Therewas no significant difference in pulse rate and diastolicblood pressure among three Groups studied. Systolicblood pressure was significantly lower in Group 3 com-pare to Group 1 and respiratory rate was significantlyhigher in Group 3 compared to Group 1.
Biochemical parametersCD4 count was significantly lower (p-value <0.001) inGroup 3 (106.95 ± 86.94 /ul) compared to Group 2 (257.40± 129.09 /ul). Patients of Group 2 and Group 3 were foundto have significantly lower levels of hemoglobin (p-value<0.0001), serum calcium (p-value < 0.0001), serum sodiumlevels (p-value <0.0008) and serum albumin levels (p-value<0.0001) compared to Group 1 (Table 2).Serum globulin levels were significantly high (p-
value < 0.0001) in Group 2 (3 ± 0.46 g/dl) and Group 3(3.6 ± 0.98 g/dl) when compared to Group 1 (2.43 ± 0.59g/dl). Although there was no significant difference in thelevels of cholesterol, HDL and triglycerides but LDL levelwas significantly higher (p-value < 0.001) in Group 3(126.62 ± 20.9 mg/dl) compared to Group 1 (100.37 ±15.33 mg/dl) and Group 2 (103.7 ± 20.9 mg/dl) (Table 2).
MRI and MRS dataAmong 30 healthy controls, 21showed a normal MR im-aging and 7 showed non-specific white matter changes.In Group 2, 13 patients showed normal MRI whereas 7patients showed non-specific white matter changes.Group 3 is a heterogeneous group comprising patientsof HIV with tuberculomas (14 patients), progressivemultifocal leucoencephalopathy (4 patients), crypto-coccal meningitis (2 patients) and 1 patient of suspectedintracranial malignancy.There was no significant difference in the level of tCho
in FWM and BG among the three group studied. Pa-tients of Group 3 were found to have significantly lowerlevels of tNAA in BG (p-value < 0.05). Significantly highlevels of Glx (p-value < 0.05), tCr (p-value < 0.05) andLip09 +MM09 (p-value < 0.04) were seen in FWM ofGroup 3. In BG, Glx, tCr and Lip09 +MM09 levels were
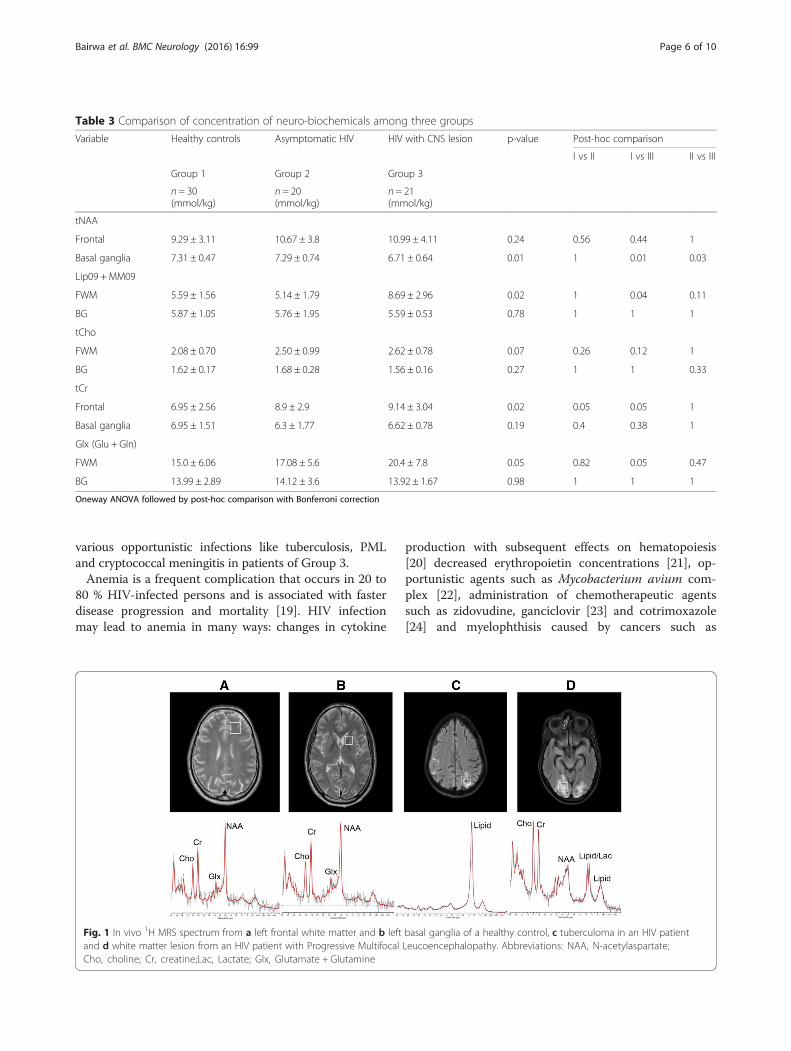
not significantly different among the three groups stud-ied (Table 3).Out of 14 HIV patients with CNS tuberculomas, 5 pa-
tients (35.7 %) showed lipid peak while 3 subjects(21.4 %) showed lactate peak from the lesion. Out of 4HIV patients with PML, one subject (25 %) showed lipidpeak and two (50 %) showed lactate peak from lesion(Fig. 1). No lipid and lactate peak were observed in HIVpatient with suspected malignancy and cryptococcalmeningitis. We did not find any correlation of laboratoryparameters namely, CD4 count, hemoglobin, fastingblood sugar, lipid profile, urea, creatinine or liver en-zymes with neuro-biochemical levels.
DiscussionThe immunosuppressed state in HIV patient makesCNS vulnerable to opportunistic infection and tumors aswell as susceptible to damage from HIV itself [13]. MRIof brain is a sensitive imaging modality for detection ofbrain abnormalities in patients infected with HIV, how-ever conventional MRI is not always sensitive for the de-tection of the early stages of brain HIV infection [14].No study till date has compared simultaneously healthycontrols, asymptomatic HIV patients and HIV patientswith CNS involvement by infection or malignancy. Wequantified the levels of neuro-biochemical to comparewith the results of previous studies.
Clinical evaluation and laboratory findingsIt is expected that during the early stages of HIV infec-tion, there are no neurological abnormality or anatom-ical changes apparent on MRI. However, it is possiblethat there may be some molecular and metabolicchanges occurring in the brain due to HIV infection.Therefore asymptomatic HIV patients (Group 2) wererecruited to investigate whether the HIV infection itselfhas some impact on brain neuro-biocehmicals evenwithout having overt involvement by infection or malig-nancy. Majority of the patients of Group 3 were criticallyill and were having septicemia because of infection dueto underlying immunosuppression and septic shock.Therefore these subjects showed significantly low systolicblood pressure and increased respiratory rate as a compo-nent of systemic inflammatory response syndrome (SIRS)[15]. Lower CD4 count is associated with an increased riskof opportunistic infection and increase risk of malignancy.The Swiss HIV Cohort study reported that the risk of de-veloping opportunistic infections is increased by 2.5 if theCD4 count is between 51–200 cells/mm; this risk in-creases to 5.8 for counts <50 cells/mm [16]. Various stud-ies have demonstrated that lower CD4 counts areassociated with an increased prevalence of opportunisticinfections [17, 18]. This explains the probable presence of
Bairwa et al. BMC Neurology (2016) 16:99 Page 4 of 10

Table 2 Comparison of laboratory parameters among three groups
Variable Healthy controls Asymptomatic HIV HIV with CNS lesion p-value Post-hoc comparison
I vs II I vs III II vs III
Group 1 Group 2 Group 3
n = 30 n = 20 n = 21
Age 34.33 ± 12.5 36.95 ± 13.1 37.29 ± 10.6 0.63
Respiratory rate Per minute 15.8 ± 1.1 15.4 ± 1.1 16.6 ± 2.2 0.04 1.00 0.19 0.04
Systolic blood pressure in mmHg 121.67 ± 7.47 118.5 ± 7.42 112 ± 12.55 0.002 0.72 0.001 0.08
CD4 count/ul 257.40 ± 129.09 106.95 ± 86.94 0.0001
Hemoglobin gm/dl 14.49 ± 1.57 12.46 ± 1.28 10.68 ± 2.69 0.0001 0.001 0.001 0.01
Serum Calcium Meq/L 9.16 ± 0.6 8.56 ± 0.77 8.16 ± 0.64 0.0001 0.007 0.001 0.18
Serum sodium Meg/L 140.03 ± 4.04 138.05 ± 4.51 134.76 ± 5.52 0.0008 0.43 0.001 0.72
Serum albumin gm/dl 4.56 ± 0.77 3.89 ± 0.81 3.36 ± 0.61 0.0001 0.008 0.001 0.72
Serum globulin gm/dl 2.43 ± 0.59 3 ± 0.46 3.6 ± 0.98 0.0001 0.01 0.001 0.72
LDL mg/dl 100.37 ± 15.33 103.7 ± 20.9 126.62 ± 20.9 0.0001 1 0.001 0.001
Oneway ANOVA followed by post-hoc comparison with Bonferroni correction
Bairwaet
al.BMCNeurology
(2016) 16:99 Page
5of
10
various opportunistic infections like tuberculosis, PMLand cryptococcal meningitis in patients of Group 3.Anemia is a frequent complication that occurs in 20 to
80 % HIV-infected persons and is associated with fasterdisease progression and mortality [19]. HIV infectionmay lead to anemia in many ways: changes in cytokine
production with subsequent effects on hematopoiesis[20] decreased erythropoietin concentrations [21], op-portunistic agents such as Mycobacterium avium com-plex [22], administration of chemotherapeutic agentssuch as zidovudine, ganciclovir [23] and cotrimoxazole[24] and myelophthisis caused by cancers such as
Table 3 Comparison of concentration of neuro-biochemicals among three groups
Variable Healthy controls Asymptomatic HIV HIV with CNS lesion p-value Post-hoc comparison
I vs II I vs III II vs III
Group 1 Group 2 Group 3
n = 30(mmol/kg)
n = 20(mmol/kg)
n = 21(mmol/kg)
tNAA
Frontal 9.29 ± 3.11 10.67 ± 3.8 10.99 ± 4.11 0.24 0.56 0.44 1
Basal ganglia 7.31 ± 0.47 7.29 ± 0.74 6.71 ± 0.64 0.01 1 0.01 0.03
Lip09 + MM09
FWM 5.59 ± 1.56 5.14 ± 1.79 8.69 ± 2.96 0.02 1 0.04 0.11
BG 5.87 ± 1.05 5.76 ± 1.95 5.59 ± 0.53 0.78 1 1 1
tCho
FWM 2.08 ± 0.70 2.50 ± 0.99 2.62 ± 0.78 0.07 0.26 0.12 1
BG 1.62 ± 0.17 1.68 ± 0.28 1.56 ± 0.16 0.27 1 1 0.33
tCr
Frontal 6.95 ± 2.56 8.9 ± 2.9 9.14 ± 3.04 0.02 0.05 0.05 1
Basal ganglia 6.95 ± 1.51 6.3 ± 1.77 6.62 ± 0.78 0.19 0.4 0.38 1
Glx (Glu + Gln)
FWM 15.0 ± 6.06 17.08 ± 5.6 20.4 ± 7.8 0.05 0.82 0.05 0.47
BG 13.99 ± 2.89 14.12 ± 3.6 13.92 ± 1.67 0.98 1 1 1
Oneway ANOVA followed by post-hoc comparison with Bonferroni correction
Fig. 1 In vivo 1H MRS spectrum from a left frontal white matter and b left basal ganglia of a healthy control, c tuberculoma in an HIV patientand d white matter lesion from an HIV patient with Progressive Multifocal Leucoencephalopathy. Abbreviations: NAA, N-acetylaspartate;Cho, choline; Cr, creatine;Lac, Lactate; Glx, Glutamate + Glutamine
Bairwa et al. BMC Neurology (2016) 16:99 Page 6 of 10

lymphosarcoma. Anemia has been associated with pro-gression to AIDS and shorter survival times [25] forHIV-infected patients.Disturbances of electrolyte metabolism and endocrine
regulation like hyponatremia [26, 27], hypo- and hyper-kalemia [28, 29] have been observed in HIV patients.Hypocalcaemia, defined by serum calcium level less than8.5 mg/dl [30], could be caused by HIV infection [31].Diarrhea is a common condition seen in HIV and diar-rheal diseases could also cause hypocalcaemia throughmalabsorption and sepsis [32, 33]. It has long been notedthat hyponatremia is associated with pulmonary or cen-tral nervous system (CNS) infections [34], gastrointes-tinal sodium losses [35], adrenal insufficiency [36] andrenal disorders [37]. Importantly, a CNS or pulmonaryinfection may result in a syndrome of inappropriate secre-tion of antidiuretic hormone (SIADH), which plays a piv-otal role in the presentation of hyponatremia [35, 38, 39].Therefore hyponatremia can be correlated with diseaseprogression in HIV.Serum albumin, is a plasma protein produced by the
liver, has a role in many physiologic processes, includingvasodilation, endothelial cell apoptosis, and antioxidantreactions [40]. Individuals with conditions such as mal-nutrition, chronic inflammation, enteropathy, or liverdisease can have reduced serum albumin concentrations[40]. Several studies of HIV-infected individuals have de-termined that hypoalbuminemia is associated with morerapid progression to AIDS and all-cause mortality in de-veloped countries [41, 42]. Globulin levels are also in-creased in HIV because of coexisting or ongoing chronicinflammatory process.
MRS findingstNAA and tCrNAA is a neuronal marker and is evenly distributedthroughout the cerebral cortex. Although its exact func-tion is not known but it is widely accepted that de-creased levels of NAA is a marker for neuronal loss.NAAG is a neuron-specific dipeptide synthesized fromNAA and Glu by NAAG synthase, present in brain at itshighest concentration [43, 44]. NAAG and its precursorNAA are proven by immune-histo-chemistry to bepresent within the bodies of neuron [45]. The resonancepeak of the methyl group of NAAG at 2.04 ppm stronglyoverlaps with methyl resonance of NAA in brain MRS.Our findings are in agreement with a previous report[46], which showed decreased tNAA levels in BG butnot in FWM of acutely infected HIV patients. BG com-prised of neuronal cell bodies and FWM is composed ofmainly nerve fibers. The observation of decreased levelsof tNAA in BG may indicate significant neuronal loss inthis region compared to FWM.
In the present study, a significant increase of tCr wasseen in FWM in Group 3 compared to Groups 1 and 2.This may be due to two possible factors: (i) glial cellscontain higher Cr content than neurons therefore, a cellpopulation change results in change of Cr level and, (ii)the equilibrium between PCr and Cr in creatine kinasereaction may change due to the disease progression [47].Previous studies have shown changes in Cr levels inbrain of patients with HIV infection. Ernst et al. reporteddecreased concentration of Cr in right basal ganglia inpatients with HIV and progressive cognitive impairmentwith motor dysfunction [48]. In a study on ART naïveHIV patients Chang et al. reported an increase in Cr infrontal white matter and correlation with CD4 count[49]. These results suggest region specific changes in Crmetabolism in HIV patients; however, further studies arerequired to substantiate these findings. Moreover, most ofthe previous studies analyzed ratios of neuro-biochemicalswith respect to Cr, assuming that the concentration of Crdo not change significantly [5–7, 50, 51]. However, it hasbeen shown that Cr levels can increase with age andtrauma as a hyperosmolar response and some brain path-ologies like stroke, tumor, lymphoma, toxoplasmosis arecharacterized by reduced Cr [45].
Glutamate and glutamine (Glx)Metabolically Glu is stored as glutamine (Gln) in glialcells, and the balanced cycling between these two neuro-biochemicals is essential for normal functioning of braincells. Astrocytes are responsible for uptake of mostextracellular Glu via the high-affinity Glu transportersGLT1 and GLAST, and additionally have a vital role inpreserving the low extracellular concentration of Gluneeded for proper receptor-mediated functions, as wellas maintaining low concentrations of extracellular Gluto prevent excite-toxicity [52, 53]. Therefore Gln is anastrocyte marker and Glu is an important neurotrans-mitter [45]. Glutamate release is subject to calcium regu-lation, and CD38 is an enzyme in astrocytes involved inintracellular calcium signal. CD38 up-regulation wasdemonstrated by immune-histo-chemical analysis inbrain tissue from HIV encephalopathy (HIVE) patients[54]. Activated astrocytes increase CD38 expression afterIL-1β treatment, and this up regulation is mediated bythe MAPK and NF-kB signal cascades [55]. Thus theresulting over expression of CD38 partially occurred dueto the evoked Glu release, which was in turn caused byelevated Ca2+ influx [56]. However, the role of increasedlevels of Glu in CSF or plasma as an useful indicator ofHIV-associated excite-toxicity remains to be investigated.Experimental evidence suggests that excite-toxicity mightplay a major role in HIV-induced neuro-degeneration.Ferrase et al. showed increased Glu levels in CSF of HIVpatients, compared to healthy subjects, also in patients
Bairwa et al. BMC Neurology (2016) 16:99 Page 7 of 10

with Alzheimer-type dementia, and patients with otherneurologic disorders [9]. Increased glutamate levels in theCSF and plasma of HIV-infected patients and the glutam-ate levels positively correlated with the degree of dementiaand brain atrophy [10]. Nonetheless, it is widely acceptedthat brain metabolite dysregulation occurs early in HIVinfection [57] and persists in the setting of chronic andstable disease [58]. Clinical studies using 1H MRS toevaluate the metabolite levels in early versus chronic cog-nitively normal HIV+ subjects showed a reduction in theGlx levels of HIV+ subjects compared to controls [57, 59].It should be noted that Ernst et al. [60] showed no sig-nificant increase in white matter Glu levels after adjust-ing p-value for multiple comparison.The present study showed increase in Glx in FWM of
HIV patients with CNS lesions compared to asymptom-atic HIV patients and healthy controls. Metabolism andregulation of Glu and Gln is a complex process in pa-tients with HIV and requires further studies to under-stand these changes in relation with HIV infection.
Choline and myo-Inositolmyo-Inositol (mI) is a known glial marker. Many previ-ous studies have shown either an increase in mI [6, 51]or no change in mI levels [7, 57]. The present study doesnot reflect any change in the brain mI levels. Cho is con-sidered to be a marker of cell membrane and previousstudies have reported variable results. While most of thestudies showed increased Cho/Cr ratio with HIV infec-tion [5, 50], few depicted no change in Cho/Cr ratio withHIV infection [6, 7]. We did not find any significantchanges in choline levels in Group 2 and Group 3 com-pared to Group 1.
Lipid and macromoleculesThe present study showed significant increase in Lip09/MM09 signal at 0.9 ppm in FWM in HIV patients withCNS lesion compared to healthy subjects. Over 20 % ofthe dry weight of brain is lipid and these macromole-cules do not appear unless some pathological processliberates the MR visible triglycerides and long chain fattyacids as seen in infection, inflammation, necrosis orstroke [45]. Salvan et al. conducted a study on HIV in-fected children older than 2 years using 1H MRS tostudy their cerebral metabolism and to identify meta-bolic profiles in relation to different stages of the disease.A significant increase of the proportion of the lipid sig-nals (p-value <0.05) was found in all HIV-infected chil-dren compare to HIV negative controls. In our study,Group 3 showed increased levels of Lip09/MM09 inFWM compared to healthy controls. In a study by Rocet al., the lipid and lactate/Cr ratio was significantly ele-vated in HIV positive subjects irrespective of the level of
neuro-cognitive impairment on the MRS study of len-ticular nuclei [61].There are some limitations of the present study; the
low number of patients in Group 3 which is primarilydue to reason that these patients were on life supportand with altered sensorium posing a difficulty to subjectthem to MRS. The number of patients with tuberculo-mas, PML, cryptococcal meningitis and suspected intra-cranial malignancy were very low and hence sub-groupanalysis could not be carried out. Further, it is difficultto conclude with certainty if the neuro-biochemicalchanges seen were either caused by the varying tissuecomposition in different MRS voxel or the neuro-biochemical change was associated with the cell popula-tion change during the diseases progression. In MRSthere is possibility of partial volume effect from dif-ferent tissues, which is difficult to avoid in some ana-tomical areas with cuboid shaped voxel. In our study,the voxel size and location was adjusted to match thetarget anatomical area as accurately as possible, how-ever, there is possibility of varying tissue compositionbeing included in the voxel. In addition, compara-tively smaller voxel size might have resulted into lowsignal to noise ratio in some of the spectra obtained.For example, in case of voxel localization in FWM,there is possibility of inclusion of gray matter. Wehave not acquired the tissue composition data foreach voxel to correct for these partial volume effects.In addition, it is difficult to differentiate between lipidand lactate signal at TE of 35 ms.
ConclusionThe results of the present study showed significant in-crease in Glx and tCr in FWM of HIV patients withCNS lesion compared to asymptomatic HIV patientsand healthy controls. In BG, there is significant reduc-tion in tNAA. Asymptomatic HIV patients do not havesignificant alteration in brain neuro-biochemicals com-pared to healthy controls. Our findings support excito-toxicity effect of increased Glx in HIV associated dementiaand region specific metabolic changes in brain associatedwith HIV infection.
AbbreviationsAIDS, Acquired immunodeficiency syndrome; ART, anti-retroviral therapy; BG,left basal ganglia caudate head nucleus; CNS, Central nervous system; Cr,Creatine; CSF, cerebrospinal fluid; ELISA, Enzyme linked immune-sorbentassay; FWM, left frontal lobe white matter; GLAST, glutamate astroglial trans-porter; GLT-1, glutamate transporter type 1; Glx, Glutamate and glutamine;HAND, HIV associated neuro degeneration; HDL, high density lipoprotein;HIV, Human immunodeficiency virus; HIVE, HIV associated encephalopathy;LDL, low density lipoprotein; MAPK, mitogen activated protein kinase; mI,myo-Inositol; MRI, magnetic resonance imaging; MRS, magnetic resonancespectroscopy; NAA, N-acetylaspartate; NAAG, N-acetylaspartylglutamate; NF-kB, nuclear factor –kB; PML, progressive multifocal leucoencephalopathy;tCho, Choline and other choline containing compounds
Bairwa et al. BMC Neurology (2016) 16:99 Page 8 of 10

AcknowledgementsWe thank radiographers from Department of NMR & MRI Facility fortechnical support and staff from ART center for helping in recruitment of HIVsubjects.
FundingNo funding was obtained.
Availability of data and materialsNot applicable.
Authors’ contributionsDB participated in patient recruitment, physical examination and detailedneurological examination, acquisition, interpretation of data and writing themanuscript. VK carried out MRI and MRS data acquisition, analysis,interpretation and writing the manuscript. SV participated in acquiring MRIimaging and interpretation. BKD helped in screening of healthy subjects forHIV and estimation of CD4 count in HIV subjects. AKS participated inneurological examination of subjects. RMP performed statistical analysis ofdata. NRJ participated in interpretation of MRS data and drafting manuscript.SKS helped in recruitment of subjects. SS, NRJ and VK conceived the study,participated in its design and directed its execution. All authors read andapproved the final manuscript.
Competing interestsThe authors declare that they have no competing interests.
Consent for publicationNot applicable.
Ethics approval and consent to participateThe study has been approved by the Institute Ethics Committee, All IndiaInstitute of Medical Sciences, New Delhi. India (IESC/T-11/03.01.2014). Beforestart of the study, all participants provided written informed consent.Participants are informed that they have the right to discontinue theirparticipation or withdraw from the study at any time.
Author details1Department of Medicine, All India Institute of Medical Sciences, AnsariNagar, New Delhi 110029, India. 2Department of NMR & MRI Facility, All IndiaInstitute of Medical Sciences, Ansari Nagar, New Delhi 110029, India.3Department of Radio-diagnosis, All India Institute of Medical Sciences, AnsariNagar, New Delhi 110029, India. 4Department of Microbiology, All IndiaInstitute of Medical Sciences, Ansari Nagar, New Delhi 110029, India.5Department of Neurology, All India Institute of Medical Sciences, AnsariNagar, New Delhi 110029, India. 6Department of Biostatistics, All IndiaInstitute of Medical Sciences, Ansari Nagar, New Delhi 110029, India.
Received: 20 January 2016 Accepted: 22 June 2016
References1. Global summary of the AIDS epidemic. http://www.who.int/hiv/data/epi_
core_july2015.png?ua=1. Accessed 9 July 2016.2. Annual Report. In: Control DoA, editor. New Delhi: Ministry of Health and
Family Welfare; 2013–2014. www.mohfw.nic.in/index1.3. Grant I, Atkinson JH, Hesselink JR, Kennedy CJ, Richman DD, Spector SA,
McCutchan JA. Evidence for early central nervous system involvement inthe acquired immunodeficiency syndrome (AIDS) and other humanimmunodeficiency virus (HIV) infections: Studies with neuropsychologic testingand magnetic resonance imaging. Ann Intern Med. 1987;107(6):828–36.
4. Fauci AS, Lane HC. HIV neurology. In Hauser SI and Josephson (Eds.),Harrison’s neurology in clinical medicine (2nd ed.). New York: McGraw-Hill;2010.
5. Chong W, Sweeney B, Wilkinson I, Paley M, Hall-Craggs M, Kendall B,Shepard J, Beecham M, Miller R, Weller I. Proton spectroscopy of the brainin HIV infection: correlation with clinical, immunologic, and MR imagingfindings. Radiology. 1993;188(1):119–24.
6. Laubenberger J, Häussinger D, Bayer S, Thielemann S, Schneider B,Mundinger A, Hennig J, Langer M. HIV-related metabolic abnormalities in
the brain: depiction with proton MR spectroscopy with short echo times.Radiology. 1996;199(3):805–10.
7. Suwanwelaa N, Phanuphak P, Phanthumchinda K, Suwanwela NC,Tantivatana J, Ruxrungtham K, Suttipan J, Wangsuphachart S, Hanvanich M.Magnetic resonance spectroscopy of the brain in neurologically asymptomaticHIV-infected patients. Magn Reson Imaging. 2000;18(7):859–65.
8. Tarasow E, Wiercińska‐Drapało A, Kubas B, Dzienis W, Orzechowska‐Bobkiewicz A, Prokopowicz D, Walecki J. Cerebral MR spectroscopy inneurologically asymptomatic HIV‐infected patients. Acta Radiol.2003;44(2):206–12.
9. Ferrarese C, Aliprandi A, Tremolizzo L, Stanzani L, De Micheli A, Dolara A,Frattola L. Increased glutamate in CSF and plasma of patients with HIVdementia. Neurology. 2001;57(4):671–5.
10. Bezzi P, Domercq M, Brambilla L, Galli R, Schols D, De Clercq E, Vescovi A,Bagetta G, Kollias G, Meldolesi J, et al. CXCR4-activated astrocyte glutamaterelease via TNFalpha: amplification by microglia triggers neurotoxicity. NatNeurosci. 2001;4(7):702–10.
11. Kumar BR, Dudala SR, Rao A. Kuppuswamy’s socio-economic statusscale–a revision of economic parameter for 2012. Int J Res Dev Health.2013;1(1):2–4.
12. Provencher SW. Automatic quantitation of localized in vivo1H spectra withLCModel. NMR Biomed. 2001;14(4):260–4.
13. Aronow HA, Brew BJ, Price RW. The management of the neurologicalcomplications of HIV infection and AIDS. AIDS. 1988;2:S151–160.
14. Post M, Berger J, Duncan R, Quencer R, Pall L, Winfield D. Asymptomaticand neurologically symptomatic HIV-seropositive subjects: results of long-term MR imaging and clinical follow-up. Radiology. 1993;188(3):727–33.
15. Dellinger RP, Levy MM, Carlet JM, Bion J, Parker MM, Jaeschke R, Reinhart K,Angus DC, Brun-Buisson C, Beale R. Surviving Sepsis Campaign: internationalguidelines for management of severe sepsis and septic shock: 2008.Intensive Care Med. 2008;34(1):17–60.
16. Ledergerber B, Egger M, Erard V, Weber R, Hirschel B, Furrer H, Battegay M,Vernazza P, Bernasconi E, Opravil M. AIDS-related opportunistic illnessesoccurring after initiation of potent antiretroviral therapy: the Swiss HIVCohort Study. JAMA. 1999;282(23):2220–6.
17. Moore RD, Chaisson RE. Natural history of opportunistic disease in an HIV-infected urban clinical cohort. Ann Intern Med. 1996;124(7):633–42.
18. Agarwal D, Chakravarty J, Sundar S, Gupta V, Bhatia B. Correlation betweenclinical features and degree of immunosuppression in HIV infected children.Indian Pediatr. 2008;45(2):140.
19. Belperio PS, Rhew DC. Prevalence and outcomes of anemia in individualswith human immunodeficiency virus: a systematic review of the literature.Am J Med. 2004;116(7):27–43.
20. Maciejewski JP, Weichold FF, Young NS. HIV-1 suppression of hematopoiesisin vitro mediated by envelope glycoprotein and TNF-alpha. J Immunol.1994;153(9):4303–10.
21. Spivak JL, Barnes DC, Fuchs E, Quinn TC. Serum immunoreactiveerythropoietin in HIV-infected patients. JAMA. 1989;261(21):3104–7.
22. Desforges JF, Horsburgh Jr CR. Mycobacterium avium complexinfection in the acquired immunodeficiency syndrome. N Engl J Med.1991;324(19):1332–8.
23. Faulds D, Heel RC. Ganciclovir: A review of its antiviralactivity,pharmacokinetic properties and therapeutic efficiency incytomegalovirus infections. Drugs 1990;39(4):597-638.
24. Keisu M, Wiholm B, Palmblad J. Trimethoprim-sulphamethoxazole-associatedblood dyscrasias. Ten years’ experience of the Swedish spontaneousreporting system. J Intern Med. 1990;228(4):353–60.
25. Morfeldt-månson L, Böttiger B, Nilsson B, Stedingk L-V. Clinical signs andlaboratory markers in predicting progression to AIDS in HIV-1 infectedpatients. Scand J Infect Dis. 1991;23(4):443–9.
26. Glassock RJ, Cohen AH, Danovitch G, Parsa KP. Human immunodeficiencyvirus (HIV) infection and the kidney. Ann Intern Med 1990;112:35-49.
27. Vitting KE, Gardenswartz MH, Zabetakis PM, Tapper ML, Gleim GW, Agrawal M,Michelis MF. Frequency of hyponatremia and nonosmolar vasopressin releasein the acquired immunodeficiency syndrome. JAMA. 1990;263(7):973–8.
28. Guy R, Turberg Y, Davidson R, Finnerty G, MacGregor G, Wise P.Mineralocorticoid deficiency in HIV infection. BMJ. 1989;298(6672):496–7.
29. Velazquez H, Perazella MA, Wright FS, Ellison DH. Renal mechanism oftrimethoprim-induced hyperkalemia. Ann Intern Med. 1993;119(4):296–301.
30. Ross AC, Taylor CL, Yaktine AL, Del Valle HB, eds. Dietary reference intakesfor calcium and vitamin D. National Academies Press; 2011.
Bairwa et al. BMC Neurology (2016) 16:99 Page 9 of 10

31. Emejulu A, Onwuliri V, Ojiako O. Electrolyte Abnormalities and RenalImpairment in Asymptomatic HIV-infected Patients in Owerri, South EasternNigeria. Aust J Basic Appl Sci. 2011;5(3):257–60.
32. Strauss KW. Endocrine complications of the acquired immunodeficiencysyndrome. Arch Intern Med. 1991;151(7):1441–4.
33. Peter SA. Disorders of serum calcium in acquired immunodeficiencysyndrome. J Natl Med Assoc. 1992;84(7):626.
34. Zilberberg MD, Exuzides A, Spalding J, Foreman A, Jones AG, Colby C, ShorrAF. Hyponatremia and hospital outcomes among patients with pneumonia: aretrospective cohort study. BMC Pulm Med. 2008;8(1):16.
35. Tang WW, Kaptein EM, Feinstein EI, Massry SG. Hyponatremia in hospitalizedpatients with the acquired immunodeficiency syndrome (AIDS) and theAIDS-related complex. Am J Med. 1993;94(2):169–74.
36. Uno K, Konishi M, Yoshimoto E, Kasahara K, Mori K, Maeda K, Ishida E,Konishi N, Murakawa K, Mikasa K. Fatal cytomegalovirus-associated adrenalinsufficiency in an AIDS patient receiving corticosteroid therapy. Intern Med.2007;46(9):617–20.
37. Berggren R, Batuman V. HIV-associated renal disorders: recent insights intopathogenesis and treatment. Curr HIV/AIDS Rep. 2005;2(3):109–15.
38. Nettles R. Hyponatremia in a Patient With AIDS. Infect Dis Clin Pract.2002;11(6):361–4.
39. Palmer BF. Hyponatremia in patients with central nervous system disease:SIADH versus CSW. Trends Endocrinol Metabolism. 2003;14(4):182–7.
40. Don BR, Kaysen G. Serum albumin: relationship to inflammation andnutrition. Semin Dial. 2004;17(6):432–7.
41. Shah S, Smith CJ, Lampe F, Youle M, Johnson MA, Phillips AN, Sabin CA.Haemoglobin and albumin as markers of HIV disease progression in thehighly active antiretrovial therapy era: relationships with gender. HIV Med.2007;8(1):38–45.
42. Mehta SH, Astemborski J, Sterling TR, Thomas DL, Vlahov D. Serum albuminas a prognostic indicator for HIV disease progression. AIDS Res HumanRetroviruses. 2006;22(1):14–21.
43. Baslow MH. An answer to“The Nagging Question of the Function of N-Acetylaspartylglutamate”. Neurosci Commun. 2015;2:e844.
44. Moffett JR, Ross B, Arun P, Madhavarao CN, Namboodiri AM. N-Acetylaspartate in the CNS: from neurodiagnostics to neurobiology. ProgNeurobiol. 2007;81(2):89–131.
45. Danielsen ER, Ross B. Magnetic Resonance Spectroscopy Diagnosis ofNeurological Disease. New York: Marcel Dekker; 1999.
46. Lentz MR, Kim W-K, Kim H, Soulas C, Lee V, Venna N, Halpern EF, RosenbergES, Williams K, Gonzalez R. Alterations in brain metabolism during the firstyear of HIV infection. J Neurovirol. 2011;17(3):220–9.
47. Urenjak J, Williams SR, Gadian DG, Noble M. Proton nuclear magneticresonance spectroscopy unambiguously identifies different neural cell types.J Neurosci. 1993;13(3):981–9.
48. Ernst T, Itti E, Itti L, Chang L. Changes in cerebral metabolism are detectedprior to perfusion changes in early HIV‐CMC: A coregistered 1H MRS andSPECT study. J Magn Reson Imaging. 2000;12(6):859–65.
49. Chang L, Ernst T, Witt MD, Ames N, Gaiefsky M, Miller E. Relationshipsamong brain metabolites, cognitive function, and viral loads inantiretroviral-naıve HIV patients. Neuroimage. 2002;17(3):1638–48.
50. Simone I, Federico F, Tortorella C, Andreula C, Zimatore G, Giannini P,Angarano G, Lucivero V, Picciola P, Carrara D. Localised 1H-MR spectroscopyfor metabolic characterisation of diffuse and focal brain lesions in patientsinfected with HIV. J Neurol Neurosurg Psychiatry. 1998;64(4):516–23.
51. Salvan A-M, Lamoureux S, Michel G, Confort-Gouny S, Cozzone PJ, Vion-Dury J. Localized proton magnetic resonance spectroscopy of the brain inchildren infected with human immunodeficiency virus with and withoutencephalopathy. Pediatr Res. 1998;44(5):755–62.
52. Schousboe A. Role of astrocytes in the maintenance and modulation ofglutamatergic and GABAergic neurotransmission. Neurochem Res. 2003;28(2):347–52.
53. Schousboe A, Waagepetersen HS. Role of astrocytes in glutamatehomeostasis: implications for excitotoxicity. Neurotox Res. 2005;8(3–4):221–5.
54. Kou W, Banerjee S, Eudy J, Smith LM, Persidsky R, Borgmann K, Wu L,Sakhuja N, Deshpande MS, Walseth TF, et al. CD38 regulation in activatedastrocytes: implications for neuroinflammation and HIV-1 brain infection. JNeurosci Res. 2009;87(10):2326–39.
55. Mamik MK, Banerjee S, Walseth TF, Hirte R, Tang L, Borgmann K, GhorpadeA. HIV-1 and IL-1β regulate astrocytic CD38 through mitogen-activated
protein kinases and nuclear factor-kB signaling mechanisms. JNeuroinflammation. 2011;25(8):145.
56. Bruzzone S, Verderio C, Schenk U, Fedele E, Zocchi E, Matteoli M, De Flora A.Glutamate-mediated overexpression of CD38 in astrocytes cultured withneurones. J Neurochem. 2004;89(1):264–72.
57. Sailasuta N, Ross W, Ananworanich J, Chalermchai T, DeGruttola V, LerdlumS, Pothisri M, Busovaca E, Ratto-Kim S, Jagodzinski L. Change in brainmagnetic resonance spectroscopy after treatment during acute HIVinfection. PLoS One. 2012;7(11):e49272.
58. Harezlak J, Buchthal S, Taylor M, Schifitto G, Zhong J, Daar E, Alger J, SingerE, Campbell T, Yiannoutsos C, et al. Persistence of HIV-associated cognitiveimpairment, inflammation, and neuronal injury in era of highly activeantiretroviral treatment. AIDS. 2011;25(5):625–33.
59. Lentz M, Kim W, Lee V, Bazner S, Halpern E, Venna N, Williams K,Rosenberg E, Gonzalez R. Changes in MRS neuronal markers andT cell phenotypes observed during early HIV infection. Neurology.2009;72(17):1465–72.
60. Ernst T, Jiang CS, Nakama H, Buchthal S, Chang L. Lower brain glutamate isassociated with cognitive deficits in HIV patients: A new mechanismfor HIV-associated neurocognitive disorder. J Magn Reson Imaging.2010;32(5):1045–53.
61. Roc AC, Ances BM, Chawla S, Korczykowski M, Wolf RL, Kolson DL, Detre JA,Poptani H. Detection of human immunodeficiency virus–inducedinflammation and oxidative stress in lenticular nuclei with magneticresonance spectroscopy despite antiretroviral therapy. Arch Neurol.2007;64(9):1249–57.
• We accept pre-submission inquiries
• Our selector tool helps you to find the most relevant journal
• We provide round the clock customer support
• Convenient online submission
• Thorough peer review
• Inclusion in PubMed and all major indexing services
• Maximum visibility for your research
Submit your manuscript atwww.biomedcentral.com/submit
Submit your next manuscript to BioMed Central and we will help you at every step:
Bairwa et al. BMC Neurology (2016) 16:99 Page 10 of 10