catholic relief services' (crs) guidance for developing logical … · types of indicator...
TRANSCRIPT

Catholic Relief Services' (CRS) Guidance for Developing Logical and Results Frameworks
Carlisle J. Levine
Since 1943, Catholic Relief Services (CRS) has held the privilege of serving the poor and disadvantaged overseas. Without regard to race, creed or nationality, CRS provides emergency relief in the wake of natural and man-made disasters. Through development projects in fields such as education, peace and justice, agriculture, microfinance, health and HIV & AIDS, CRS works to uphold human dignity and promote better standards of living. CRS also works throughout the United States to expand the knowledge and action of Catholics and others interested in issues of international peace and justice. Our programs and resources respond to the U.S. Bishops’ call to live in solidarity-as one human family-across borders, over oceans, and through differences in language, culture and economic condition. Published in 2007 by: Catholic Relief Services 228 W. Lexington Street Baltimore, MD 21201-3413 USA Written by: Carlisle J. Levine © 2007 Catholic Relief Services. All rights reserved. Any ‘fair use’ under U.S. copyright law should contain appropriate citation and attribution to Catholic Relief Services.
ii

Table of Contents Preface.................................................................................................................................................... iv Acknowledgements................................................................................................................................ iv
Overview…………..................................................................................................................................... 1 Section 1: Theories of Change ............................................................................................................. 2 Section 2: Objective or Result Statements........................................................................................... 3
General Guidelines for Conceptualizing and Writing Objective or Result Statements.......................... 3 Objective and Result Statement Levels .................................................................................................. 5
Section 3: Critical Assumptions........................................................................................................... 8 Section 4: Performance Indicator Statements .................................................................................... 11
General Guidelines for Conceptualizing and Writing Performance Indicator Statements ................... 11 Performance Indicators Levels: Impact, Outcome, Output, Process and Input .................................... 14 Selecting Performance Indicators ......................................................................................................... 20
Section 5: Measurement Methods and Data Sources......................................................................... 22
Types of Indicator Measurement Methods Commonly Used ............................................................... 22 Choosing Indicator Measurement Methods .......................................................................................... 23 Identifying and Selecting Data Sources................................................................................................ 24 Setting Indicator Targets....................................................................................................................... 24
Annex 1: Comparison among Different Donor Agencies’ Terminologies for Results and Logical Frameworks………………………………………………………………………………………………25 Annex 2: Examples of a CRS Proframe, USAID Results Framework, DFID Logframe………………..26
iii

iv
Preface This document was primarily written to provide guidance for conceptualizing, writing, selecting and measuring project performance indicators. In this document, that guidance is placed within the larger context of articulating theories of change, conceptualizing and writing objective and results statements (taken largely from ProPack, with slight adjustments) and creating logical and results frameworks. This guidance was written to serve CRS’ effort to develop CRS-wide commonly accepted and core project indicators. Given its broader context, it can also prove useful for project design.
Acknowledgements This document draws heavily from the following:
• Valerie Stetson, Guy Sharrock and Susan Hahn, ProPack: The CRS Project Package, Baltimore, MD: Catholic Relief Services, July 2004, pp. 105-113;
• Catholic Relief Services, CRS Project Proposal Guidance, Baltimore, MD: Catholic Relief
Services, June 1999, pp. 145-146; and
• USAID Automated Directives System (ADS), ADS203.3.4.2, [http://www.usaid.gov/policy/ads/200/203.pdf], accessed October 17, 2006.
Please also note references to:
• Valerie Stetson, Susan Hahn, David Leege, Debbie Reynolds and Guy Sharrock, ProPack II: The CRS Project Package - Project Management and Implementation Guidance for CRS Project and Program Managers, Baltimore, MD: Catholic Relief Services, 2007, pp. 83-130, 178-206, 215-248.
References for other documents cited in this text can be found in the footnotes. Additionally, the following people provided excellent feedback, thus greatly increasing the quality of this document Aatsa Atogho Didier Bloch Velida Dzino-Silajdzic Eric Eversmann Sarah Ford Constantin Hien Joseph Ilboudo Luis Cláudio Mattos Elena McEwan
Carrie Miller Gisele Orellana Mark Rogers Wendy-Ann Rowe Daniel Selener Shannon Senefeld Allison Smith Irene Youmbi

Overview This document summarizes Catholic Relief Services’ (CRS) guidance for developing logical and results frameworks.
• A logical framework “is a systematic and visual way to present and share your understanding of the relationships among the resources you have to operate your program, the activities you plan, and the changes or results you hope to achieve.”1 CRS’ proframe and the U.K. Department for International Development’s (DFID’s) logframe are examples of logical frameworks.
• A results framework is similar, except that it focuses on articulating results. USAID’s results
framework is an example of such a framework.
These frameworks are planning, management and communications tools. Which type of framework designers choose to use usually depends on donor demands.2 They are developed during the design phase and are revised as necessary during implementation. These frameworks also guide the development of detailed implementation plans and program or project budgets.3 Figure 1: CRS’ Proframe (a logical framework)
Objectives Statements
Performance Indicator
Statements
Measurement Methods /
Data Sources
Critical Assumptions
Goal Strategic Objectives Intermediate Results Outputs Activities
Figure 2: DFID’s Logframe (a logical framework) Objectives Objectively
Verifiable Indicators
Means of Verification
Risks and Assumptions
Goal Purpose(s)
Outputs Activities
Figure 3: USAID’s Results Framework
Goal
There is variation among logical or results frameworks, not only in terms of the types of objective or result statements included and the names these statements are given, but also in the guidance provided for articulating them. While we recognize that there is no single agreed-upon approach for developing logical or results frameworks, we believe that agreeing upon an approach within CRS will help us provide more consistent technical assistance, which will, in turn, increase the utility of logical or results frameworks to planning, monitoring and evaluation processes. 1 W.K. Kellogg Foundation, Logic Model Development Guide, January 2004, [http://www.wkkf.org/Pubs/ Tools/Evaluation/Pub3669.pdf], accessed October 19, 2006. 2 See Annex 1: Comparisons among Different Donor Agencies’ Terminologies for Results/Logical Frameworks. 3 For more on this, see ProPack, pp. 173-179.
* Outputs and activities are included in the text accompanying a results framework.
SO 1
IR 1.1
SO 2
IR 1.2
IR 2.1
SO 3
IR 2.2
IR 2.3
IR 3.1
1

This document contains guidance on:
1. Theories of Change 2. Objective or Result Statements 3. Critical Assumptions 4. Performance Indicator Statements 5. Measurement Methods and Data Sources
Two annexes include:
1. A comparison of logical and results frameworks terminologies from different agencies; and 2. One project captured in a CRS proframe, a USAID results framework and a DFID logframe as a
concrete example comparing the three frameworks.
Section 1: Theories of Change All logical or results frameworks, including CRS’ proframe, USAID’s results framework and DFID’s logframe, establish a hierarchy of objective or result statements, or a development pathway, to show how project or program designers believe change will come about. How project or program designers believe change will come about are their theories of change. Theories of change are found in underlying assumptions, articulated strategy, and interconnected actions in a project that are intended to lead a community or organization to a positive transformation. When theories of change are well captured in logical or results frameworks, program managers can use them to articulate what programs are trying to achieve and what they think needs to happen to get there. Monitors can then look for evidence of activities leading to anticipated results, or probe to find out why a result is or is not leading to a next higher-level anticipated result. Therefore, vital to a logical or results framework is the clearly articulated, direct cause-effect relationship between different levels of objectives or results.
• Going down a logical or results framework, how an objective or result will be achieved should be explained by the objective or result below it.
o For example, program designers hope that women farmers will adopt new agricultural techniques (higher-level result) as a result of learning new agricultural techniques (lower-level result).
• Going up a logical or results framework, why we are trying to achieve a lower-level objective or
result should be explained by the one above it. o For example, program designers believe that women farmers will learn new agricultural
techniques (lower-level result) in order to adopt them (higher-level result).
The statements in the example above are describing changes expected to happen at different levels. Achieving one objective or result at one level should be a necessary and direct contribution to the achievement of the next. Readers should not need to make inferences or many, broad assumptions in
2
order to understand the cause-effect relationship between different levels of a logical or results framework.4
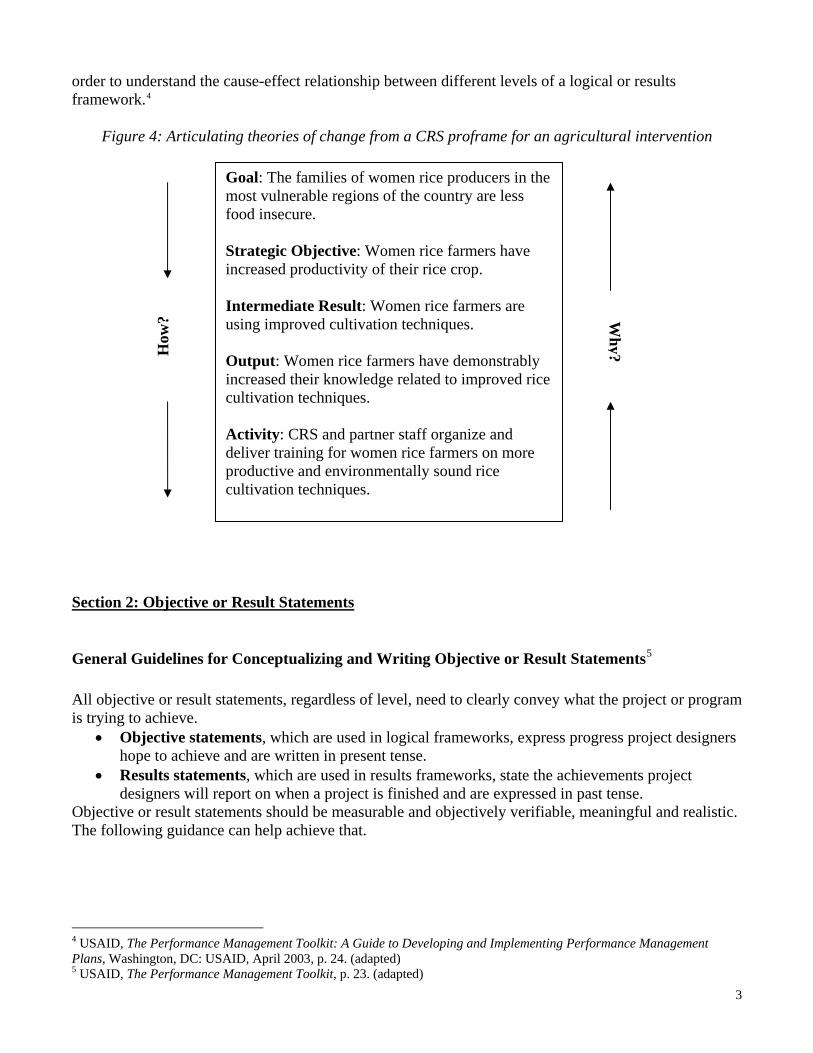
Figure 4: Articulating theories of change from a CRS proframe for an agricultural intervention
Goal: The families of women rice producers in the most vulnerable regions of the country are less food insecure. Strategic Objective: Women rice farmers have increased productivity of their rice crop. Intermediate Result: Women rice farmers are using improved cultivation techniques.
How
? Wh y
Output: Women rice farmers have demonstrably increased their knowledge related to improved rice cultivation techniques.
?
Activity: CRS and partner staff organize and deliver training for women rice farmers on more productive and environmentally sound rice cultivation techniques.
Section 2: Objective or Result Statements
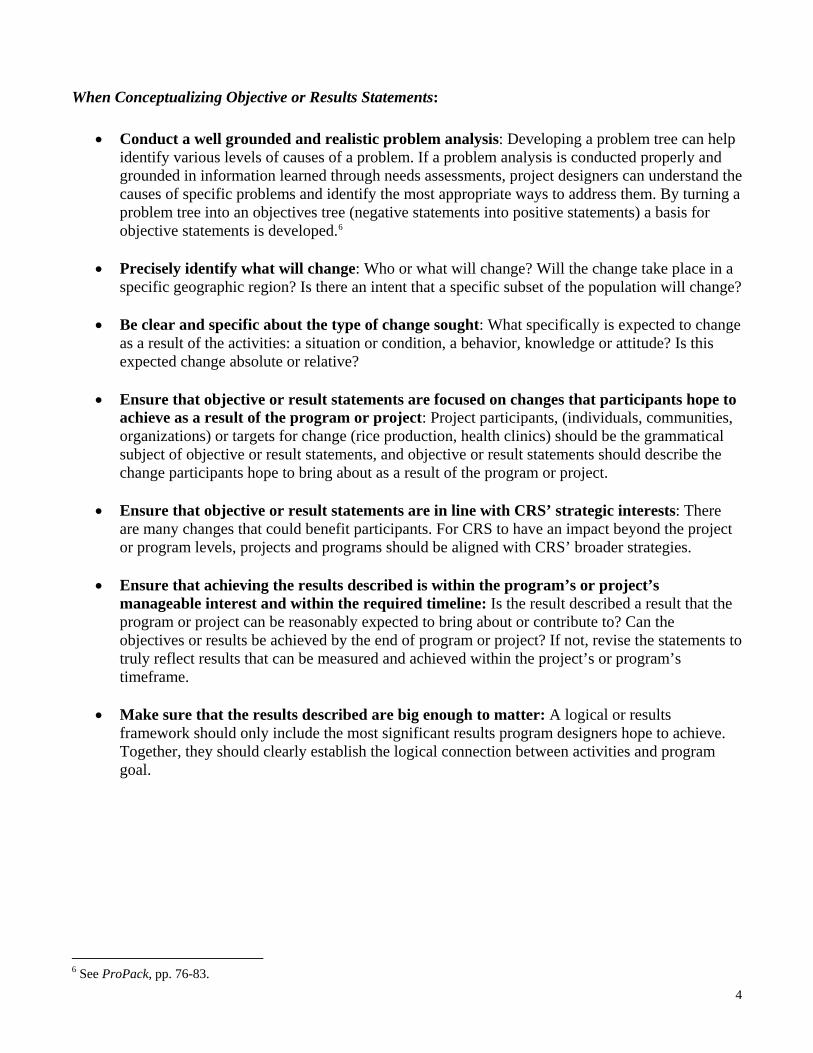
General Guidelines for Conceptualizing and Writing Objective or Result Statements5 All objective or result statements, regardless of level, need to clearly convey what the project or program is trying to achieve.
• Objective statements, which are used in logical frameworks, express progress project designers hope to achieve and are written in present tense.
• Results statements, which are used in results frameworks, state the achievements project designers will report on when a project is finished and are expressed in past tense.
Objective or result statements should be measurable and objectively verifiable, meaningful and realistic. The following guidance can help achieve that.
4 USAID, The Performance Management Toolkit: A Guide to Developing and Implementing Performance Management Plans, Washington, DC: USAID, April 2003, p. 24. (adapted) 5 USAID, The Performance Management Toolkit, p. 23. (adapted)
3
When Conceptualizing Objective or Results Statements:
• Conduct a well grounded and realistic problem analysis: Developing a problem tree can help identify various levels of causes of a problem. If a problem analysis is conducted properly and grounded in information learned through needs assessments, project designers can understand the causes of specific problems and identify the most appropriate ways to address them. By turning a problem tree into an objectives tree (negative statements into positive statements) a basis for objective statements is developed.6
• Precisely identify what will change: Who or what will change? Will the change take place in a
specific geographic region? Is there an intent that a specific subset of the population will change? • Be clear and specific about the type of change sought: What specifically is expected to change
as a result of the activities: a situation or condition, a behavior, knowledge or attitude? Is this expected change absolute or relative?
• Ensure that objective or result statements are focused on changes that participants hope to
achieve as a result of the program or project: Project participants, (individuals, communities, organizations) or targets for change (rice production, health clinics) should be the grammatical subject of objective or result statements, and objective or result statements should describe the change participants hope to bring about as a result of the program or project.
• Ensure that objective or result statements are in line with CRS’ strategic interests: There
are many changes that could benefit participants. For CRS to have an impact beyond the project or program levels, projects and programs should be aligned with CRS’ broader strategies.
• Ensure that achieving the results described is within the program’s or project’s
manageable interest and within the required timeline: Is the result described a result that the program or project can be reasonably expected to bring about or contribute to? Can the objectives or results be achieved by the end of program or project? If not, revise the statements to truly reflect results that can be measured and achieved within the project’s or program’s timeframe.
• Make sure that the results described are big enough to matter: A logical or results
framework should only include the most significant results program designers hope to achieve. Together, they should clearly establish the logical connection between activities and program goal.
6 See ProPack, pp. 76-83.
4

When Writing Objective or Results Statements:
• Use strong action verbs: Does the verb clearly describe what will take place in the activity? Will monitors know what kind of activity they are looking for and therefore whether or not the project is being implemented as planned?
• Make each objective or result statement unidimensional: Is the statement capturing only one
result? Does the result statement contain only one verb and a manageable number of subjects and objects? Measuring more than one change in one objective or result statement is complicated. If one of the multiple changes does not take place as expected, even if the others do, then the program has failed to meet the objective. For example,
o Two verbs: Women rice farmers are using improved cultivation techniques and identifying markets.
Two verbs! So two actions to assess: if one does not succeed, the objective is not achieved.
To improve this statement, separate “using improved cultivation techniques” and “identifying markets” into two objective statements.
o Two subjects: Women rice farmers and women soy producers are using improved cultivation techniques.
Multiple subjects to assess: if one does not succeed, the objective is not achieved. This statement can be used as is, if there is indeed a significant difference
between the two groups that warrants the distinction, and as long as there are separate indicators for women rice farmers and women soy producers. Alternatively, we can separate “women rice farmers” and “women soy producers” into two different objective statements. Or, particularly if there is not a significant difference between the two groups, we could say “women farmers,” knowing that this broader term incorporates both.
o One subject, one verb, one object: Women rice farmers (one subject) are using (one verb) improved cultivation techniques (one object).
With one subject, one verb and one object, program managers and project participants know exactly what they are trying to achieve, and they know how to assess whether or not they are achieving that objective.
Finally, as suggested above, be flexible and ready to change and rephrase the statements until they truly reflect change that the program or project can realistically achieve based on the capacity and time available and the local context.
Objective and Result Statement Levels This section contains most possible objective or result statement levels, although the names they are given might differ according to the logical or results framework used. Examples of the three most common frameworks that CRS staff members encounter (CRS’ proframe, USAID’s results framework and DFID’s logframe) are included as an annex at the end of this document. In the following section, each term in the framework is defined and examples are given. In order to understand how each element of the framework relates to the next, it is helpful to remember that, for the most part,
5

• Impact, which has been defined as changes in circumstances “proven to be caused by a
program,” is captured in goals (long-term) and strategic objectives (short-term). • Outcome, which has been defined as “change in individuals, organizations, communities,
policies or governments” is captured primarily in intermediate results, although it can also be captured in strategic objectives.
• Output, which has been defined as “tangible products that result from a program’s activities,”7
is captured in the section labeled “outputs,” and
• Process is captured in activities and inputs (the resources - human, physical and financial - invested in the project).
The table that follows is a shorter version of the table comparing terminologies that is included at the end of this document as an annex. Impact
(Long-term) Impact (Short-term) or
sometimes Outcome Outcome Output Process
CRS Proframe Goal Strategic Objective Intermediate Results
Outputs Activities Inputs
USAID Results Framework8
Goal Strategic Objective
Intermediate Results
(Outputs) (Activities) (Inputs)
DFID Logframe
Goal Purpose Outputs Activities
The Goal describes the longer-term, wider development change to which the project contributes. CRS’ proframe, USAID’s results framework and DFID’s logframe all include goals. Sample Goal ...for an agricultural intervention The families of women rice farmers in the most vulnerable regions of the country are less food insecure.
...for a peacebuilding intervention Inhabitants of the region experience greater levels of personal security.
Strategic Objectives (SOs) describe the immediate benefits that are achieved by participants by a given date, such as the end of the project. SOs result from changes that have taken place at the IR-level as a consequence of the new attitudes, skills or knowledge acquired or deliverables received (outputs) from well-done activities. An SO expresses the central purpose of the project in a way that is realistic, specific to the project and measurable. CRS’ proframe, USAID’s results framework and DFID’s logframe all include strategic objectives, although DFID uses the term “purpose.”
7 Alana Conner Snibbe, “Drowning in Data,” Stanford Social Innovation Review, Fall 2006, p. 41. 8 Outputs, Activities and Inputs are described in the Performance Monitoring Plan narrative.
6

Sample SO ...for an agricultural intervention Women rice farmers have increased the productivity of their rice crop.
...for a peacebuilding intervention Two ethnic groups have reduced tensions between them in non-violent ways.
Intermediate Results (IRs) state the expected change(s) in identifiable behaviors by participants or in identifiable approaches by interventions, systems, policies or institutions as a result of what was gained (outputs) through project actions (activities). Progress at this level is a necessary precondition towards achieving the SOs. IRs can be expressed as:
o Changes in the rate project participants practice new behaviors or skills promoted by the project; o Expansion of project reach or coverage; o New ways of organizing or managing systems; o Alterations to policy; or o Other evidence that shows project outputs being used consistently and correctly by participants.
Intermediate results are included in USAID’s results framework and CRS’ proframe, but not in DFID’s logframe. Sample IR ...for an agricultural intervention Women rice farmers are consistently using improved cultivation techniques.
...for a peacebuilding intervention Two ethnic groups are effectively implementing their agreed-upon activity.
Outputs are the goods, services, knowledge, skills, attitudes and enabling environment that are delivered or created by the project as a result of the activities undertaken. Outputs are included in CRS’ proframe and DFID’s logframe, but not in USAID’s results framework. FRAMEWORKS, PROFRAMESAND M&E PLANNING Sample Output ...for an agricultural intervention Women rice farmers have demonstrably increased their knowledge related to improved rice cultivation techniques.
...for a peacebuilding intervention Two ethnic groups have a plan to implement a tangible activity of mutual interest.
Activities describe the interventions to be undertaken in order to improve the immediate wellbeing, in the case of goods or services delivery, or knowledge, skills and/or attitudes of project participants. Activities are included in CRS’ proframe and DFID’s logframe, but not in USAID’s results framework.
7
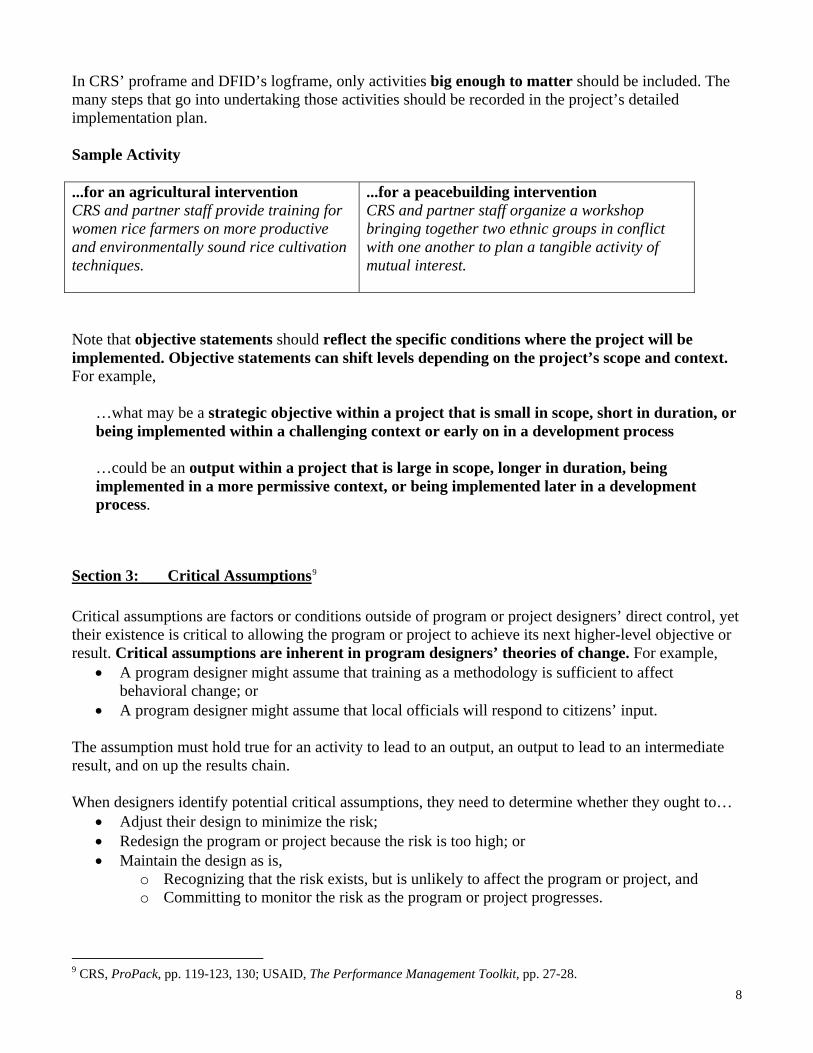
In CRS’ proframe and DFID’s logframe, only activities big enough to matter should be included. The many steps that go into undertaking those activities should be recorded in the project’s detailed implementation plan. Sample Activity ...for an agricultural intervention CRS and partner staff provide training for women rice farmers on more productive and environmentally sound rice cultivation techniques.
...for a peacebuilding intervention CRS and partner staff organize a workshop bringing together two ethnic groups in conflict with one another to plan a tangible activity of mutual interest.
Note that objective statements should reflect the specific conditions where the project will be implemented. Objective statements can shift levels depending on the project’s scope and context. For example,
…what may be a strategic objective within a project that is small in scope, short in duration, or being implemented within a challenging context or early on in a development process …could be an output within a project that is large in scope, longer in duration, being implemented in a more permissive context, or being implemented later in a development process.
Section 3: Critical Assumptions9 Critical assumptions are factors or conditions outside of program or project designers’ direct control, yet their existence is critical to allowing the program or project to achieve its next higher-level objective or result. Critical assumptions are inherent in program designers’ theories of change. For example,
• A program designer might assume that training as a methodology is sufficient to affect behavioral change; or
• A program designer might assume that local officials will respond to citizens’ input. The assumption must hold true for an activity to lead to an output, an output to lead to an intermediate result, and on up the results chain. When designers identify potential critical assumptions, they need to determine whether they ought to…
• Adjust their design to minimize the risk; • Redesign the program or project because the risk is too high; or • Maintain the design as is,
o Recognizing that the risk exists, but is unlikely to affect the program or project, and o Committing to monitor the risk as the program or project progresses.
9 CRS, ProPack, pp. 119-123, 130; USAID, The Performance Management Toolkit, pp. 27-28.
8

The following decision tree found in ProPack can help designers determine how best to respond to an external factor that is a potential critical assumption. While this decision tree specifies CRS’ proframe, it can be used when developing any logical or results framework.10
Almost certainly Do not include in Proframe
Do not include in Proframe Will it be realized?
Likely
Unlikely
Include as an assumption
Is it possible to redesign the project in order to influence the external factor?
YES NO
Is the External Factor Important?
YES
The project is not technically feasible
Redesign the project
NO
Using this decision tree, project designers can determine which external factors can be incorporated into their project design, and which must become critical assumptions to include in their results or logical frameworks. Project designers should maximize the external factors incorporated into their project design and minimize those included as critical assumptions. The fewer the needed critical assumptions the better, since they must be monitored. Project designers have the most control over activities and are able to incorporate the greatest number of external factors into project activity design. For example, availability of resources would not be a critical assumption, since this external factor should be taken into consideration in the activity design. At higher levels of a results or logical framework, project designers have less control over the achievement of results and a greater need to incorporate external factors as critical assumptions. For an objective statement to lead to the next higher-level objective statement, the critical assumptions associated with it must hold true. For example,
• If an output holds true - Women rice farmers have demonstrably increased their knowledge related to improved rice cultivation techniques,
• And its associated critical assumption or assumptions hold true - Training as a methodology is
sufficient to affect behavioral change,
• Then, it could be logically expected to lead to the intermediate result above it - Women rice farmers are consistently using improved cultivation techniques.
10 ProPack, p. 130.
9

Sample critical assumptions from a CRS proframe for an agriculture project
Objective statements Critical assumptions Goal: The families of women rice farmers in the most vulnerable regions of the country are less food insecure.
SO: Women rice farmers have increased the productivity of their rice crop.
Women farmers are able to retain the income derived from rice sales.
IR: Women rice farmers are consistently using improved cultivation techniques.
No diseases or pests destroy the seeds.
Output: Women rice farmers have demonstrably increased their knowledge related to improved rice cultivation techniques.
Training as a methodology is sufficient to affect behavioral change.
Activity: CRS and partner staff provide training for women rice farmers on more productive and environmentally sound rice cultivation techniques.
(In this case, no critical assumptions are included since project designers have responded to all foreseen potential risks in the project design.)
Sample critical assumptions from a CRS proframe for a peacebuilding project
Objective statements Critical assumptions Goal: Inhabitants of the region experience greater levels of personal security.
SO: Two ethnic groups have reduced tensions between them in non-violent ways.
Reduction in tension will contribute to improved mobility and greater sense of personal safety.
IR: Two ethnic groups are effectively implementing their agreed-upon activity.
Implementing a mutually agreed-upon plan provides new non-violent ways to interact with each other. The plan will be more important than the influence of dividers or others seeking to foment violence. The collaborative experience leads to a reconsideration of experiences that lead to increased tensions.
Output: Two ethnic groups have a plan to implement an activity of mutual interest.
(In this case, no critical assumptions included since project designers have responded to all foreseen potential risks in the project design.)
Activity: CRS and partner staff organize a workshop bringing together two ethnic groups in conflict with one another to plan a tangible activity of mutual interest.
(In this case, no critical assumptions included since project designers have responded to all foreseen potential risks in the project design.)
10

Section 4: Performance Indicator Statements Performance indicator statements point to evidence showing whether or not objectives are being achieved, thus helping managers make better-informed and timely decisions. Please note: This section provides guidance on conceptualizing and writing performance indicator statements and selecting performance indicators for a particular intervention. However, ones work with indicators only begins here! The section that follows, Section 5: Measurement Methods and Data Sources, provides guidance on using performance indicators as a part of a monitoring and evaluation system to assess intervention progress toward its objectives. To use performance indicators effectively, in addition to selecting appropriate indicators, one must also ensure that all terms within the indicator are clearly defined, and that data sources and data collection and analysis protocols are established.
General Guidelines for Conceptualizing and Writing Performance Indicator Statements
When Conceptualizing Performance Indicator Statements Good performance indicators are clear about what is being measured and how that measurement relates to the objective or results statement with which it is affiliated. Performance indicators can be:
• Quantitative: assigned a numeric value and measured, such as number, ratio, ranking, percentage, frequency, growth rate or yield; or
• Qualitative: descriptive and based on judgment or perception, such as level of participation,
group cohesion or satisfaction; decision-making or leadership capacity; or attitudinal or behavioral change.11
o Qualitative indicators can be quantified.
For example,
o Number of (quantitative measure) participants highly satisfied (qualitative judgment) with the content of the training; or
o Percentage of (quantitative measure) community members reporting decreased
tensions (qualitative judgment) between members of different ethnic groups.12
11 Performance and Effectiveness Department, U.K. Department for International Development (DFID), Tools for Development: A Handbook for Those Engaged in Development Activity, Version 15, September 2002, pp. 5.3-5.4. 12 See also ProPack II, pp. 107-108.
11
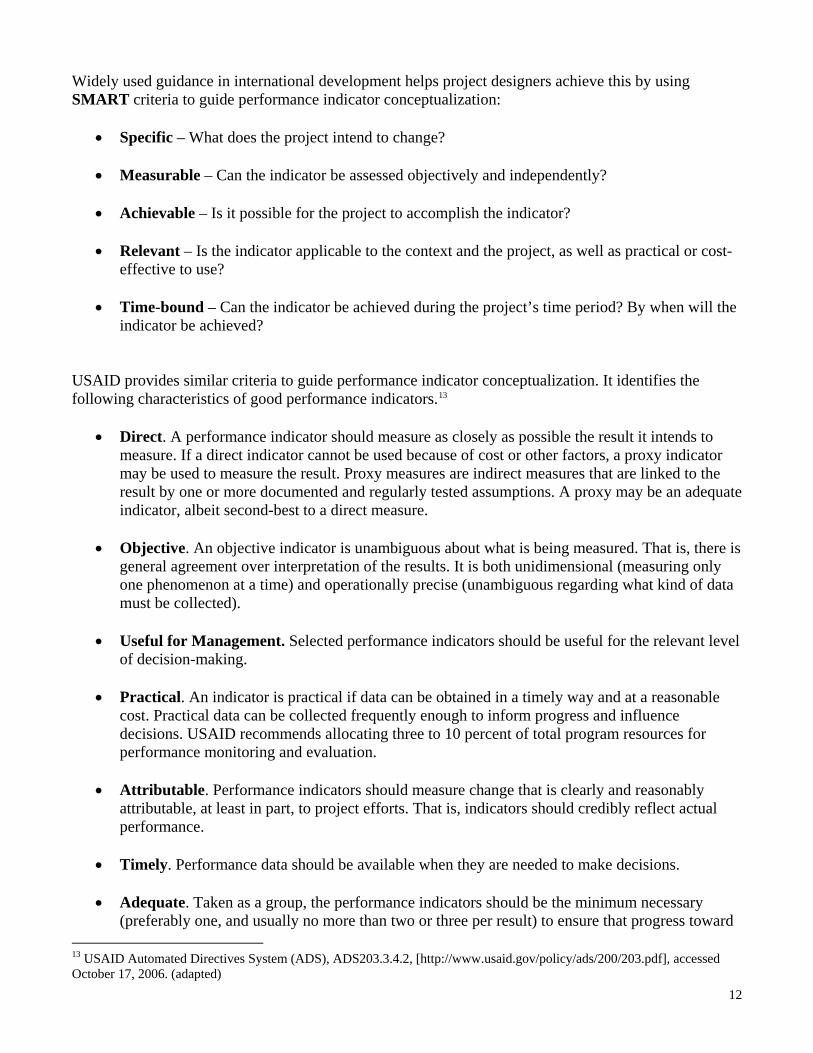
Widely used guidance in international development helps project designers achieve this by using SMART criteria to guide performance indicator conceptualization:
• Specific – What does the project intend to change? • Measurable – Can the indicator be assessed objectively and independently? • Achievable – Is it possible for the project to accomplish the indicator? • Relevant – Is the indicator applicable to the context and the project, as well as practical or cost-
effective to use? • Time-bound – Can the indicator be achieved during the project’s time period? By when will the
indicator be achieved? USAID provides similar criteria to guide performance indicator conceptualization. It identifies the following characteristics of good performance indicators.13
• Direct. A performance indicator should measure as closely as possible the result it intends to measure. If a direct indicator cannot be used because of cost or other factors, a proxy indicator may be used to measure the result. Proxy measures are indirect measures that are linked to the result by one or more documented and regularly tested assumptions. A proxy may be an adequate indicator, albeit second-best to a direct measure.
• Objective. An objective indicator is unambiguous about what is being measured. That is, there is
general agreement over interpretation of the results. It is both unidimensional (measuring only one phenomenon at a time) and operationally precise (unambiguous regarding what kind of data must be collected).
• Useful for Management. Selected performance indicators should be useful for the relevant level
of decision-making. • Practical. An indicator is practical if data can be obtained in a timely way and at a reasonable
cost. Practical data can be collected frequently enough to inform progress and influence decisions. USAID recommends allocating three to 10 percent of total program resources for performance monitoring and evaluation.
• Attributable. Performance indicators should measure change that is clearly and reasonably
attributable, at least in part, to project efforts. That is, indicators should credibly reflect actual performance.
• Timely. Performance data should be available when they are needed to make decisions. • Adequate. Taken as a group, the performance indicators should be the minimum necessary
(preferably one, and usually no more than two or three per result) to ensure that progress toward 13 USAID Automated Directives System (ADS), ADS203.3.4.2, [http://www.usaid.gov/policy/ads/200/203.pdf], accessed October 17, 2006. (adapted)
12

the given results is sufficiently captured. Too many indicators may be worse than too few since all performance indicators require resources and effort to collect, analyze, report and use.
To these once can add reliable:
• Reliable. An indicator is reliable if its measurement produces the same result regardless of who makes the measurement.
When Writing Performance Indicator Statements ProPack complements the above guidance for conceptualizing performance indicator statements with the following guidance for writing performance indicator statements. ProPack states that a performance indicator statement ideally specifies seven elements of change, although it notes that it may not be possible or appropriate to articulate all elements within one indicator.
• Timeline – When is the target expected to be achieved? Example: By October 2007. • Target – Within a given time period, how many participants will benefit? Setting targets is
informed by baseline data. Example: 10,000 rural households. • Baseline – It is important to mention the comparison with the baseline in the indicator statement,
if in fact baseline data will be collected. Often baseline measures are not known when proposals are submitted and will be collected during the project’s first year. In some cases, a baseline measure can be estimated from available secondary data or from your past experience with similar work. Example: Additional to what exists at the time of the baseline or project start-up.
• Participant subgroup – Which subgroups will benefit from the change? Subgroups can include
households (single female-headed, poor, landless, pastoralist, living with HIV and AIDS, etc.) and individuals (women, men, youth, children of certain ages, etc.). Also, CRS, partner, community groups and government agency staff might be recipients of training and resources. Example: Rural households in the Eastern District .
o Since successful programming is gender sensitive, it is important to disaggregate program participants by gender, where appropriate.
• Quantity – What quantity of change is desired? Example: Increased use of water. • Nature – What is the nature of the fundamental planned change? Example: Use of water.
• Quality – How would you describe the quality of the change desired? Example: Clean water,
perhaps as defined by the World Health Organization’s standards. For example: By October 2007 (timeline), 10,000 (target) additional (baseline) rural households in the Eastern District (participant subgroup) enjoy increased (quantity) use of (nature) clean (quality) water (nature).
13

CRS also recommends that performance indicators contain verbs that facilitate measurement.14 An indicator should explain clearly how observers will know when it has been achieved. Verbs that facilitate measurement (examples):
• build, • complete, • establish, • increase to, • install, • raise or reduce from
Verbs with unclear measurements (examples):
• assist, • augment, • enhance, • facilitate, • promote, • strengthen
Performance Indicators Levels: Impact, Outcome, Output, Process and Input15 Performance indicator statements are defined for each level within a results or logical framework: impact, outcome and output, as well as sometimes process and input. With USAID’s results framework, these indicators are included in the performance management plan that accompanies the results framework. With CRS’ proframe and DFID’s logframe, these indicators are included in the framework itself. Sample performance indicators from a CRS proframe for an agriculture project Objective statements Performance indicator statements Critical
assumptions Goal: The families of women rice farmers in the most vulnerable regions of the country are less food insecure.
Long-term impact indicators • Percentage of households in the most
vulnerable regions of the country reporting maintenance or improvement in food consumption
• Percentage of households in the most vulnerable regions of the country reporting maintenance or improvement in nutritional status
SO: Women rice farmers have increased the productivity of their rice crop.
Short-term impact indicators • By the end of the program, 80 percent of
women rice farmers in the most vulnerable regions of the country have increased their rice crop productivity, as compared to productivity levels at the baseline.
• By the end of the program, rice crop productivity in the most vulnerable regions of the country has increased by 40 percent, as compared to the baseline.
Women farmers are able to retain the income derived from rice sales.
14 CRS Project Proposal Guidance, p. 149. 15 CRS, Project Proposal Guidance, pp. 145-146. Output indicators description and examples altered. Outcome indicators description and examples added. See also ProPack II, pp. 96-97.
14

IR: Women rice farmers are consistently using improved cultivation techniques.
Outcome indicators • Percentage of project participants consistently
using improved cultivation techniques
No diseases or pests destroy the seeds.
Output: Women rice farmers have demonstrably increased their knowledge related to improved rice cultivation techniques.
Output indicators • Percentage of training participants with
increased knowledge of improved rice cultivation techniques
Training as a methodology is sufficient to affect behavior change.
Activity: CRS and partner staff provide training for women rice farmers on more productive and environmentally sound rice cultivation techniques.
Process indicators • Number of trainings held • Number of training participants
(In this case, no critical assumptions are included since project designers have responded to all foreseen potential risks in the project design.)
Sample performance indicators from a CRS proframe for a peacebuilding project
Objective statements Performance indicator statements Critical assumptions Goal: Inhabitants of the region experience greater levels of personal security.
Long-term impact indicators • Percentage of people in the region
reporting greater mobility as a result of decreased tensions between the two ethnic groups
• Percentage of people in the region reporting engaging in longer-term planning as a result of decreased tensions between the two ethnic groups
SO: Two ethnic groups have reduced tensions between them in non-violent ways.
Short-term impact indicators • By the end of the program, 60 percent
of people in the region report decreased tensions with members of the other ethnic group, disaggregated by ethnicity, as compared to tension levels reported at the baseline.
• By the end of the program, 60 percent of people in the region report decreased fear of violence erupting between the two ethnic groups, disaggregated by ethnicity, as compared to tension levels reported at the baseline.
Reduction in tension will contribute to improved mobility and greater sense of personal safety.
15

IR: Two ethnic groups are effectively implementing their agreed-upon activity.
Outcome indicators • Percentage of participants
implementing the agreed-upon activity, disaggregated by ethnicity
Implementing a mutually agreed-upon plan provides new non-violent ways to interact with each other. The plan will be more important than the influence of dividers or others seeking to foment hate or violence. The new collaborative experience leads to a reconsideration of experiences that lead to increased tensions.
Output: Two ethnic groups have a plan to implement a tangible activity of mutual interest.
Output indicators • Mutually agreed upon plan to
implement a tangible activity of mutual interest exists
(No critical assumptions included since project designers have responded to all foreseen potential risks in the project design.)
Activity: CRS and partner staff organize a workshop bringing together two ethnic groups in conflict with one another to plan a tangible activity of mutual interest.
Process indicators • Number of workshop participants,
disaggregated by ethnicity
(No critical assumptions included since project designers have responded to all foreseen potential risks in the project design.)
Below, after each explanation of each performance indicator level, are additional examples of performance indicators for other types of programs. As one looks at the program type examples from one level to the next, one can see the logic of different sectoral interventions, as is similarly outlined above for an agricultural and a peacebuilding project. Please note: In the examples in this section, the indicators provided, while direct measures of the objectives with which they are associated, represent only one possible way to assess whether the objectives are being achieved. More indicators might be necessary to assess whether or not the objective was fully achieved. Also, depending on the project context, these indicators may or may not be appropriate. Impact indicators (goal or SO level, depending on whether the indicators represent long or short-term impact) are the long and short-term benefits contributed to by, or resulting from changes due to project outcomes. For example:
16

Sample impact indicators for a health project Objective statements Performance indicator statements People in targeted region experience improved health status (Goal)
• Percentage of children under five years of age in the targeted region experiencing decreased mortality (long-term)
• Percentage of mothers in the targeted region experiencing decreased morbidity (long-term)
Health facilities provide quality health services (SO)
• By the end of the program, 90 percent of children are treated in existing health facilities according to IMCI guidelines (short-term)
• By the end of the program, 90 percent of caretakers report satisfaction with the child care services (short-term)
Sample impact indicators for an education project Objective statements Performance indicator statements Girls in the targeted area demonstrate improved learning outcomes (Goal)
• Percentage of girls in ten targeted provinces passing primary school leaving exams (long-term)
Girls in the targeted area have sustained, increased access to basic education (SO)
• By the end of the program, girls’ enrollment rate in ten targeted provinces increases by three percentage points as compared to the baseline (short-term)
• By the end of the program, girls’ attendance rate in the targeted provinces increases to 85 percent (short-term)
Sample impact indicators for a microfinance project Objective statements Performance indicator statements Underserved communities in the targeted region experience improved livelihoods (Goal)
• Increase in household expenditure (long-term) • Improvement in asset acquisition (long-term) • Number of new businesses started (long-term) • Number of new employees hired by micro-businesses (long-term)
Underserved communities access microfinance services to support income-generating activities (SO)
• By the end of the program, targeted households in the communities successfully accessing microfinance services to improve their livelihoods have increased by 10 percentage points. (short-term)
• By the end of the program, 15 percent of applicants have successfully accessed microfinance services to support new businesses. (short-term)
17

Sample impact indicators for an advocacy project Objective statements Performance indicator statements Pollution in the targeted province reduced (Goal)
• Air quality sustainably improved (long-term) • Water quality sustainably improved (long-term)
Pollution-creating activities are reduced (SO)
• By the end of the program, 75 percent of enterprises in the targeted provinces dispose of trash without polluting water sources (short-term)
• By the end of the program, 30 percent additional factories in the targeted provinces use pollution-reducing equipment, as compared to the baseline (short-term)
Outcome indicators (often IR level) measure changes in practices or behaviors resulting from the acquisition of goods or services, knowledge, skills or attitudes as a result of project activities. For example: Sample outcome indicator for a health project Objective statement Performance indicator statements Health facility staff demonstrates consistent improved technical and management capacity to provide quality health services (IR)
• Percentage of trained staff using F/IMCI for sick child care
• Percentage of health clinic staff use system data for planning and improving their activities at least on a quarterly basis
Sample outcome indicator for an education project Objective statement Performance indicator statement Teachers in the targeted schools use girl-friendly teaching methodologies (IR)
• Percentage of teachers regularly using girl-friendly teaching methodologies
Sample outcome indicator for a microfinance project Objective statement Performance indicator statement Community groups successfully manage microfinance services (IR)
• Percentage of participants that repay loans on-time
• Percentage of portfolio at risk that is greater than 30 days
• Percentage of the portfolio in arrears
Sample outcome indicator for an advocacy project Objective statement Performance indicator statement Regulatory agencies incorporate anti-pollution policies into annual reviews (IR)
• Number of annual reviews that refer to anti-pollution policies
Provincial governments adopt anti-pollution policies (IR)
• Number of provincial governments adopting anti-pollution policies
18

Output indicators (Output level) are the deliverables obtained through project activities. Output indicators measure access to or acquisition of good or services, knowledge, skills or attitudes. For example: Sample output indicator for a health project Objective statement Performance indicator statement Annual health planning with quarterly analysis completed
• Percentage of health clinics that develop annual plans with quarterly analysis
Sample output indicator for an education project Objective statement Performance indicator statement Teachers in targeted schools have increased knowledge of girl-friendly teaching methodologies
• Percentage of teachers in targeted schools who have increased knowledge of girl-friendly teaching methodologies
Sample output indicator for a microfinance project Objective statement Performance indicator statement Community groups have demonstrably increased their knowledge related to improved internal controls
• Percentage of group participants who are present in weekly meetings on a regular basis
Sample output indicator for an advocacy project Objective statement Performance indicator statement Participants have proposals for new anti-pollution policies
• Policy proposals that will effectively reduce pollution exist
Process indicators (Activity level) show how program inputs are used in pursuit of the achievement of the objectives expected in the project. Process indicators show what has been done or implemented and how well it has been done. For example: Sample process indicator for a health project Objective statement Performance indicator statements Health clinic staff attend workshops on annual planning and quarterly analysis
• Number of health clinic staff members attending workshops
• Number of health clinics represented by workshop attendees
19

Sample process indicator for an education project Objective statement Performance indicator statements Teachers receive training in girl-friendly teaching methodologies
• Number of trainings held in girl-friendly teaching methodologies
• Number of teachers completing trainings in girl-friendly teaching methodologies
Sample process indicator for a microfinance project Objective statement Performance indicator statement MFI teaches community groups about group formation, by-laws and internal controls
• Number of active participants • Length of training provided on group
dynamics Sample process indicator for an advocacy project Objective statements Performance indicator statements Citizens and legislators actively participate in discussions to develop anti-pollution policy proposals
• Number of citizens and legislators influencing the content of anti-pollution policy proposals
Input indicators (Activity level) are the set of resources (human, physical or financial) that are the raw material put into the project. These are included in detailed implementation plans, but not in logical or results frameworks. However, they are included here to specify what input indicators are in contrast to process indicators. For example: Sample input indicators Objective statements Performance indicator statements Program managers budget funds for activity • Amount of funds budgeted for project
activity Program managers assign staff to activity • Number of staff assigned to project activity Staff spend time on project activity • Hours of time spent on project activity
Selecting Performance Indicators
How Many Indicators Are Needed to Measure Progress toward an Objective or Result? Program designers should choose the minimum number of performance indicators necessary to adequately report on progress toward an objective or result. This number can often be one is usually no more than two or three per objective or result. Selecting more performance indicators can overly burden data collection, analysis and reporting systems, and ultimately diminish program accountability and learning because of the burden they present.
20

Choosing an Ideal Indicator or a Measurable Indicator, Given Resource Constraints? It is worth repeating that a performance indicator is only as good as ones ability to measure it accurately and consistently. When choosing performance indicators, one should consider access to data sources; human, logistical and financial capacity; and time available to collect, analyze and document data. This is discussed in greater detail in the section that follows.
Choosing Standardized or Locally Developed Performance Indicators Some project sectors have standardized indicators with accompanying definitions, measurement methods and data sources. These are backed by research and approved by donors or practitioner networks. This is especially true in areas of development assistance where evidence of success and how it is measured can apply across contexts. Agriculture and natural resource management, education, health and nutrition are examples of these areas. It is less true for program areas such as advocacy, civil society strengthening and peacebuilding, for which indicators of success are less concrete and more contextual. In FY07, CRS began developing commonly accepted and core project indicators for all of its areas of intervention. These commonly accepted and core project indicators will include industry standards, as well as other indicators that commonly appear in CRS projects. CRS is developing them to facilitate proposal design, increase the feasibility and utility of monitoring and evaluation activities, and augment data comparability and, therefore, learning across projects. At the same time, local knowledge can often supply uniquely meaningful indicators. Project designers can identify locally meaningful indicators via discussions or participatory exercises with project groups. By including project participants and other stakeholders in the process of developing performance indicators, project designers might become aware of probable project results that they had not anticipated. This participatory process also serves to ground truth project designers’ theories of change, if they have not already done this. Nonetheless, using participatory methodologies to define indicators and using locally defined indicators more generally presents additional challenges. • Participatory methodologies put additional demands on project participants. • With participatory methodologies, care needs to be used to ensure that a representative sample of
project participants are involved in defining indicators to ensure that the indicators will be perceived as credible and fair by all project participants and stakeholders.
• With locally defined indicators, designers must carefully define the terms they are using within
their performance indicators, as well as the measurement methods and data sources they will use to ensure measurement reliability.
• Locally defined performance indicators are more difficult to aggregate or compare with similar
locally defined performance indicators for similar projects in different contexts. Yet, locally defined indicators, while not themselves comparable across projects, might fit within common categories of indicators that might lend themselves to comparison. For example, a locally 21

defined indicator of increased trust might be “mutual use of a road between the two participating communities increases.” This indicator would not be comparable across projects. However, if it is included within a common category of peacebuilding indicators, such as “increased mobility,” then the results it describes might be both comparable and able to be meaningfully aggregated to describe results at a Country Program, regional or agency level.
A Special Note on Indicators Measured Using an Index To measure some indicators, program managers need to measure progress using an index or check list containing multiple measures.
• For example, measuring changes in a Parent Teachers Association’s (PTA’s) organizational capacity might include finding out how often elections to the PTA’s leadership are held; assessing levels of member participation in PTA activities; determining if various population segments (women/men, different ethnic groups, different religious groups, old/young) are represented in the PTA, as well as their levels of participation in meetings, decision making and leadership; and asking if meeting reports are made publicly available, among other measures.
These indicators can be very informative. However, before selecting such an indicator, program managers should identify all the aspects of it that they will need to measure, and determine whether or not this measurement is feasible and will show adequate evidence that an objective or result is being achieved.
Section 5: Measurement Methods and Data Sources
Types of Indicator Measurement Methods Commonly Used Indicator measurement methods vary depending on whether ones measures are quantitative or qualitative. Quantitative methods provide information on breadth of an intervention result, and allow for the generalization of results to a wider population. Since randomized experiments are very difficult to conduct in an international development context, program managers often use quasi-experimental survey designs to gather quantitative data. In quasi-experimental designs, program managers use probability sampling methods, such as cluster sampling or Lot Quality Assurance Sampling, and often use comparison groups instead of control groups. Qualitative methods provide information on depth of an intervention result, and do not allow data analyzers to draw conclusions for any population beyond the sampled group. Commonly used qualitative methods include participatory rural appraisal techniques, focus groups, community or key informant interviews, observation, photography or videotaping.16 16 For more information on quantitative and qualitative methods describe in these two paragraphs, see Michael Quinn Patton, Utilization-Focused Evaluation: The New Century Text, edition 3 (Thousand Oaks, California: Sage Publications, Inc., 1997); Michael Bamberger, Jim Rugh and Linda Mabry, RealWorld Evaluation: Working Under Budget, Time, Data, and Political Constraints (Thousand Oaks, California: Sage Publications, Inc., 2006); Eric Sarriot et alia, “Methodology and Sampling Issues for KPC Surveys,” Johns Hopkins University, School of Public Health, Department of International Health, November 30, 1999; Stacy Hoshaw-Woodard, “Description and Comparison of the Methods of Cluster Sampling and Lot Quality Assurance Sampling to Assess Immunization Coverage,” World Health Organization, Geneva, 2001; and Karen
22

Choosing Indicator Measurement Methods17 When choosing indicator measurement methods, project managers must maximize reliability, validity and credibility, keeping in mind data collection, analysis and reporting constraints. Choosing data collection methods depends on how well data collected will support valid interpretations about the program; the availability and accessibility of data and data sources; professional expertise and capacity of the evaluation team; resources and time available to collect, analyze and report on data; and sensitivity to ethical concerns and culture, among other considerations. Please note: Performance indicators are only useful if project managers have the resources (human, financial, logistical, time) and access they need to collect and analyze the data they need to measure them! • Reliability refers to a measurement method’s ability to produce the same results repeatedly under
given measurement conditions. • Internal Validity refers to the accuracy and adequacy of the data gathered from indicator
measurement methods, giving data users confidence that the data collected accurately and adequately show that changes have taken place as a result of a project or activity.
• External Validity refers to the degree to which evaluation results can be generalized to other
settings, times and populations. (in the case of quantitative methods, since findings using qualitative methods cannot be generalized)
• Credibility refers to the extent to which audiences perceive the data and interpretations to be
accurate, fair and believable. Under ideal circumstances, choice of sample frame (the universe or population from which the sample will be taken) and sample size matched with random sampling can minimize threats to the validity of quantitative data collection methods. However, given real-world budget, time and human resource constraints, as well as limits to data availability or accessibility, this is often not possible. Evaluators also recognize that threats to validity and credibility in qualitative methods are almost inevitable, given the potential biases of both evaluators and respondents. To counter these threats, evaluators use triangulation or multiple approaches to data collection and analysis.
• To overcome bias or errors on the part of data collectors, multiple data collectors may be involved.
• To ensure that data collected is representative of a population, multiple data sources may be
used and multiple respondents involved.
Schoonmaker Freudenberger, Rapid Rural Appraisal (RRA) and Participatory Rural Appraisal (PRA): A Manual for CRS Field Workers and Partners, CRS, 1999. 17 See also ProPack II, pp. 99-103, 107-116.
23
24
• To overcome the limitations of data collection methods, multiple data collection methods may be used, including both quantitative and qualitative methods.
• To ensure that data collected holds true beyond the moment and place it is collected, data
collectors should visit multiple places within the target area during different times of the day, week and year. In each of these different places and times, data collectors are likely to encounter different respondents and conditions. For the data collected to hold true for an intervention, it must hold true under all of these circumstances.
• To ensure that the conclusions drawn are firmly based in the data collected, multiple evaluators
should be involved in analyzing the data collected. Either multiple people can be involved in the original data analysis, or an evaluator can ask peers to review findings and analysis.
Evaluators, weighing evaluation validity against practical constraints, must decide which threats are greatest and, in response, incorporate the appropriate triangulation methods from among those listed above. That might mean that data collectors visit communities at various times during the day to survey participants representing different population subgroups. Or data collectors might supplement survey data with interviews and observation to see if findings emerging from one data collection method match findings emerging from another. Monitors, who assess evidence of project progress toward results with greater frequency, need enough information to accurately and adequately inform project decision making. Mini-surveys, interviews and observation on their own can often provide the information project managers need to raise questions that inform discussions that lead to decisions. Monitors use their own judgment to determine that their data and analysis are accurate, adequate and balanced. Making a genuine effort to look for information that reaches beyond confirmation of ones existing biases in order to test those biases is one way to ensure that sufficient information is gathered and that a balanced analysis has been presented.18
Identifying and Selecting Data Sources Data sources might include individuals, households, CRS and partner staff, government entities, international organizations, other NGOs, or others involved in project implementation. They might also include population census data or government or international organization-conducted surveys. Specifying data sources helps ensure the consistency of data collection methods and therefore the likelihood that changes in the findings are not due to changes in the way data is collected.
Setting Indicator Targets Upon completion of a project baseline assessment, project decision makers set indicator targets. These targets should be informed by baseline results; the project time line; human and financial resources dedicated to the project; and permissiveness or difficulty of the context, including levels of uncertainty. It is often helpful to set lower targets during the first year of a project when start-up activities will occupy a portion of project resources and time. Targets can then be increased in later project years. If the project has a midterm evaluation, that offers an opportunity to evaluate and adjust targets as needed.19
18See also ProPack II, pp. 84-87, 178-206, 215-248. 19 See also ProPack II, pp. 103-107.

ANNEX 1: COMPARISONS AMONG DIFFERENT DONOR AGENCIES’ TERMINOLOGIES for RESULTS/LOGICAL FRAMEWORKS20 Ultimate Impact End Outcomes Intermediate Outcomes Outputs Interventions Needs-based Higher Consequence Specific Problem Cause Solution Process Inputs CARE terminology21
Program Impact Project Impact Effects Outputs Activities Inputs CARE logframe Program Goal Project Final Goal Intermediate Objectives Outputs Activities Inputs CRS Proframe Goal Strategic Objective Intermediate Results Outputs Activities Inputs PC/LogFrame22
Goal Purpose Outputs Activities USAID Results Framework23
Goal Strategic Objective Intermediate Results (Outputs) (Activities) (Inputs)
USAID Logframe24 Final Goal Strategic Goal/
Objective Intermediate Results Activities Inputs
DANIDA + DfID25 Goal Purpose Outputs Activities CIDA26 + GTZ27 Overall goal Project purpose Results/Outputs Activities Inputs European Union28
Overall Objective Project Purpose Results Activities FAO29 + UNDP30 + NORAD31
Development Objective Immediate Objectives Outputs Activities Inputs
UNHCR32 Sector Objective Goal Project Objective Outputs Activities Input/Resources
World Bank Long-term Objectives Short-term Objectives Outputs Inputs AusAID33
Scheme Goal Major Development Objectives
Outputs Activities Inputs
20 “The Rosetta Stone of Logical Frameworks” was compiled by Jim Rugh for CARE International and InterAction’s Evaluation Interest Group. Adapted here to include CRS. 21 CARE Impact Guidelines, October 1999. 22 PC/LogFrame (tm) 1988-1992 TEAM technologies, Inc. 23 Results Oriented Assistance Sourcebook, USAID, 1998. Outputs, Activities and Inputs are described in the narrative. 24 The Logical Framework Approach to portfolio Design, Review and Evaluation in A.I.D.: Genesis, Impact, Problems and Opportunities. CDIE, 1987. 25 A Guide to Appraisal, Design, Monitoring , Management and Impact Assessment of Health & Population Projects, ODA [now DFID], October 1995 26 Guide for the use of the Logical Framework Approach in the Management and Evaluation of CIDA’s International Projects. Evaluation Division. 27 ZOPP in Steps. 1989. 28 Project Cycle Management: Integrated Approach and Logical Framework, Commission of the European Communities Evaluation Unit Methods and Instruments for Project Cycle Management, No. 1, February 1993 29 Project Appraisal and the Use of Project Document Formats for FAO Technical Cooperation Projects. Pre-Course Activity: Revision of Project Formulation and Assigned Reading. Staff Development Group, Personnel Division, August 1992 30 UNDP Policy and Program Manual 31 The Logical Framework Approach (LFA). Handbook for Objectives-oriented Project Planning. 32 Project Planning in UNHCR: A Practical Guide on the Use of Objectives, Outputs and Indicators for UNHCR Staff and Implementing Partners. Second Ver. March 2002. 33 AusAID NGO Package of Information, 1998.

ANNEX 2a: CRS’ Proframe - An Example Objective Statements Performance Indicator Statements Measurement Methods / Data Sources Critical Assumptions
Goal: The families of women rice farmers in the most vulnerable regions of the country are less food insecure.
Percentage of households reporting maintenance or improvement in household food consumption as measured by months of adequate household food provisioning
Household survey in the project area measuring months of adequate household food provisioning Data source: External evaluators
Strategic Objective: Women rice farmers have increased the productivity of their rice crop.
By the project’s end, 75% of participating women farmers have increased their rice production by at least 20%.
Observation of project participants’ rice field production Data source: CRS staff
Women able to retain income derived from rice
Intermediate Result 1: Women rice farmers are consistently using improved cultivation techniques.
During the first harvest after training, percentage of participants consistently using improved cultivation techniques.
Observation of project participants’ rice production techniques. Data source: CRS staff
No adverse changes in rice pricing policy
Intermediate Result 2: Women rice farmers have planted seeds for improved rice varieties.
During the first planting season after the seed fairs, seed fair participants who selected improved rice varieties are planting them.
Observation of project participants’ rice fields. Data source: CRS staff
No diseases or pests destroy the seeds.
Output 1.1: Women rice farmers have demonstrably increased their knowledge related to improved rice cultivation techniques.
Percentage of training participants with increased knowledge of improved rice cultivation techniques.
Pre- and post-test of project participants’ knowledge. Data source: CRS partners
Women trainees pass knowledge on to other farmers.
Output 2.1: Women farmers have seeds for improved rice varieties.
Percentage of seed fair participants selecting seeds for improved rice varieties.
Post-seed fair survey of seed fair participants Data source: CRS partners
Activity 1.1.1: Women farmers participate in training on more productive, cost-effective and environmentally sound rice production techniques.
Training held for women farmers. Number of women farmer participants.
Attendance records from trainings. Data source: CRS partners
Activity 2.1.1: Women farmers participate in seed fairs.
Seeds fairs held for women farmers. Number of women farmer participants.
Observation of seed fairs Data source: CRS staff and partners
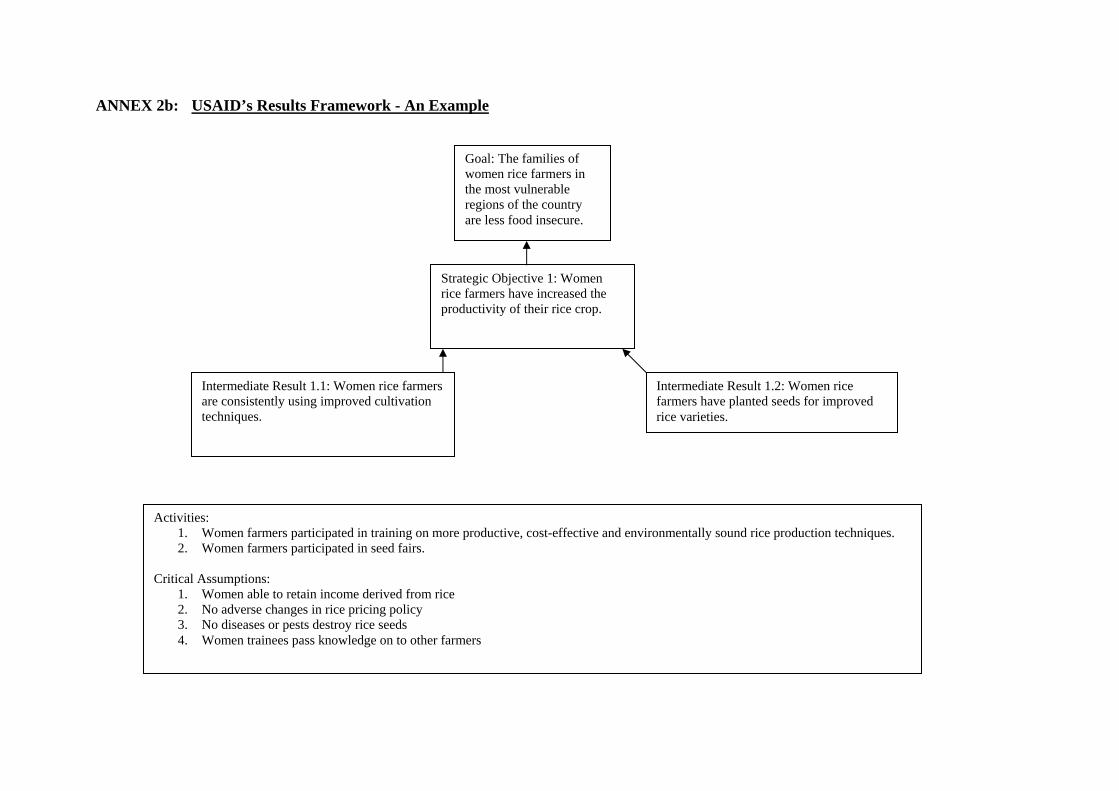
ANNEX 2b: USAID’s Results Framework - An Example
Goal: The families of women rice farmers in the most vulnerable regions of the country are less food insecure.
Strategic Objective 1: Women rice farmers have increased the productivity of their rice crop.
Intermediate Result 1.1: Women rice farmers are consistently using improved cultivation techniques.
Intermediate Result 1.2: Women rice farmers have planted seeds for improved rice varieties.
Activities: 1. Women farmers participated in training on more productive, cost-effective and environmentally sound rice production techniques. 2. Women farmers participated in seed fairs.
Critical Assumptions:
1. Women able to retain income derived from rice 2. No adverse changes in rice pricing policy 3. No diseases or pests destroy rice seeds 4. Women trainees pass knowledge on to other farmers

ANNEX 2c: DFID’s Logframe - An Example Logical hierarchy Objectively verifiable indicators Means of Verification Important generic
assumptions
Goal: To reduce food insecurity for the families of women rice farmers in the most vulnerable regions of the country.
Percentage of households reporting maintenance or improvement in household food consumption as measured by months of adequate household food provisioning
Household survey in the project area measuring months of adequate household food provisioning Data source: External evaluators
Purpose: Women rice farmers increase the productivity of their rice crop.
By the project’s end, 75% of participating women farmers have increased their rice production by at least 20%.
Observation of project participants’ rice field production Data source: CRS staff
Women able to retain income derived from rice
Output 1: Women rice farmers demonstrably increase their knowledge related to improved rice cultivation techniques.
Percentage of training participants with increased knowledge of improved rice cultivation techniques.
Pre- and post-test of project participants’ knowledge. Data source: CRS partners
Women trainees pass knowledge on to other farmers.
Output 2: Women farmers have seeds for improved rice varieties.
Percentage of seed fair participants selecting seeds for improved rice varieties.
Post-seed fair survey of seed fair participants Data source: CRS partners
Activity 1.1: Women farmers participate in training on more productive, cost-effective and environmentally sound rice production techniques.
Training held for women farmers. Number of women farmer participants.
Attendance records from trainings. Data source: CRS partners
Activity 2.1: Women farmers participate in seed fairs.
Seeds fairs held for women farmers. Number of women farmer participants.
Observation of seed fairs Data source: CRS staff and partners