causes of corruption in european countries: history, law ... · pdf filecauses of corruption...
TRANSCRIPT

Causes of Corruption in European Countries History Law and Political Stability Ronald MacDonald Muhammad Tariq Majeed University of Glasgow University of Glasgow Abstract This study asks why corruption is increasing in European countries and what are the most important factors that explain such corruption Although corruption scandals speeches and reports indicate that corruption persists in European countries no one has tested the causes of corruption in European countries and this study is to the best of our knowledge the first to empirically examine the causes of corruption for European countries Cross-country data for European countries is used to examine the role of legal influences historical factors and the effect of political stability on corruption Five key findings are (1) the effects of the legal strengths on the incidence of corruption are significant with a negative sign - a one-standard-deviation increase in the legal strengths is associated with a decrease in corruption of 026 points 26 of a standard deviation in the corruption index (2) political stability is a significant determinant of corruption (3) the interactive effects of history and law are important in reducing corruption levels (4) the size of government matters in affecting corruption levels (5) finally this study shows that an interdisciplinary approach is the most appropriate way to explain corruption Key Words History Law Political Instability Corruption European Countries JEL Classification K0 O52 P37 C33 H0
Acknowledgement this paper has benefited from comments received from participants at the First German ECSA Young Researcher Conference 21-23 February 2011 Berlin Germany Conference Topic Europersquos Post-Crisis Stability ndash An Interdisciplinary Approach organized by German ECSA Arbeitskreis Europaumlische Integration (AEI) and ZEW Mannheim European Academy Berlin Bismarckallee 4648 D-14193 Berlin Germany httpwwweab-berlinde
Corresponding author Department of Economics Adam Smith Building Glasgow G12 8RT United Kingdom Tel +44 (0)141-330 4697 Fax +44 (0)141-330 4940 mmajeed1researchglaacuk or tariqqauedupk The author also wishes to thank Arbeitskreis Europaumlische Integration (AEI) and ZEW Mannheim European Academy Berlin Bismarckallee for proving travel grant to present this paper
1
1 Introduction Although corruption ie lsquomisuse of public power for private gainrsquo is disliked in its
essence because of its detrimental effects on the development of a country it is
pervasive and exists with varying degrees in every country in the world In recent
years international organizations such as the United Nations and the World Bank
have made corruption a significant focus of their agendas and have made significant
attempts to curb corruption in the world but corruption perhaps like the poor will
always be with us According to the Global Corruption Barometer (2010) ldquocorruption
has increased over the last three years say six out of 10 people around the world and
one in four people report paying bribes in the last yearrdquo1
It is widely accepted by economists development practitioners and policy
makers that corruption is a problem of developing countries However recently a
number of scandals over corruption have shown that rich nations supposedly free
from corruption are also suffering from its effects In Norway and Sweden (regarded
as the cleanest nations) for example state owned companies have been shown to be
involved in bribe taking In Germany former Chancellor Helmut Kohl and his
Christian Democratic party the CDU were found to be involved in malpractices and
they were penalized for receiving illegal campaign funding Recently a number of
corruption scandals have being reported in Italy for example ldquoA report from the state
auditor shows that cases of corruption in Italy have increased by more than 200
since 20082rdquo Similarly in France ldquoForty-nine businessmen and public housing
officials have gone on trial accused of taking bribes when President Jacques Chirac
was mayor of Parisrdquo3 Recently Austrias former chancellor Wolfgang Schuumlssel has
ended his political career as a corruption scandal continues to unfold around him4 In
fact recent emerging major corruption scandals have shaken a striking and variety of
countries all over the world the United States Japan Italy France Germany South
Korea Mexico and the Kenya
The World Bankrsquos director for Governance Daniel Kaufmann states that It is
important to emphasize that this is not simply a developing country problem fighting
corruption is a global challenge Recently Kaufmann notes that ldquosome of
1 httpwwwtransparencyorgpolicy_researchsurveys_indicesgcb2010 2 httpnewsbbccouk1hiworldeurope8527593stm 3 httpnewsbbccouk1hiworldeurope4641372stm 4 httpwwwdw-worlddedwarticle01536555400html
2
my research tends to challenge orthodoxy such as taking issue with the claim that the
developing lsquoworldrsquo is corrupt (contrasting wealthy nations) that corruption
is largely about blatant bribery and that corruption and macro-economic stability
should be viewed separately from each other by different types of lsquoexpertsrsquo I am
committing the heresy of focusing on the link between corruption and budget deficits
in industrialized countries After all even if politically incorrect to admit it there are a
number of rich countries where corruption is widespread in a variety of forms illegal
and lsquolegalrsquo political and financialrdquo5
This study shows that the average level of corruption in European6 countries
during 1984 was a 078 unit of the corruption index Given that the corruption index
ranges from 0 to 6 where 0 indicates an absence of corruption and 6 indicates the
highest corruption such a low value of a corruption index implies that European
countries were initially close to zero level of corruption However the average level
of corruption in European countries has increased up to 212 in 2007 Although
corruption levels in Europe are still comparatively low in fact the cleanest countries
in the world such as Sweden Finland and Denmark are located in Europe but
nonetheless the corruption levels have increased by 134 unit of the corruption index
over the period 1984-2007 Such an increase of 134 units implies that corruption in
European countries on average has increased by 22 of the corruption index This is
an alarming figure and surely needs to be rapidly addressed
Research on the causes of corruption has proliferated in recent years Cross-
country empirical studies of the determinants of corruption have explored and tested a
wide range of factors such as economic political historical cultural and institutional
dimensions (see for example Treisman 2000 Paldam 2002 Serra 2006) Recently
Majeed and Macdonald (2010 2011) provide new insights on the causes of corruption
by exploring the institutional political and economic aspects of corruption Their
studies specifically explore the role and importance of military elites and financial
market reforms in determining the cross-country variations in corruption levels Their
findings suggest that the presence of military elites in politics fosters corruption while
financial reforms significantly control the incidence of corruption In the wake of the 5 httpthekaufmannpostnetcorruption-and-fiscal-deficits-in-rich-countries 6 The terms European and EU countries have been used interchangeably Our sample includes 26 countries from Europe where 22 countries are EU member states while two out of remaining four Iceland and Croatia are candidate for EU The other two countries Norway and Switzerland are not part of EU but they share borders with EU countries and are likely to share corruption norms with neighbours
3
proliferation of a large number of studies our understanding about the incidence of
corruption is improving and there is also a slowly emerging consensus on some of the
causes of corruption However some causes are still inconclusive such as the role
and importance of government spending
Although it is true that the cleanest economies are located in Europe the
question nonetheless arises as to why corruption still exists in European countries or
why corruption is increasing over time in this region The main motivation of this is
to provide an answer to these questions and we do so using an empirical analysis of
the causes of corruption in European countries Recently a number of studies (such as
Treisman 2000 Serra 2006 Majeed and MacDonald 2010 2011) have identified a
number of causes of corruption but surprisingly no one to the best of our knowledge
has investigated the causes of corruption in European countries Perhaps this is due to
the general perception that corruption is only a problem in developing countries
Another reason that European countries have been ignored hitherto in the
corruption literature could reflect the empirical consensus that economic development
reduces corruption For example almost every study on the causes of corruption
identifies economic development as a crucial variable with higher levels of economic
development reducing corruption A high level of economic development reduces the
discount rates of both bribe-givers and bribe-takers thereby making them less eager to
jump the queue via illegal ways On the other hand less developed economies
generate minimal wealth for average citizens which creates structural incentives for
bribery
Although corruption is increasing in European countries over time it is still
lower in comparison to developing economies and the cleanest economies are
developed ones In contrast it is also a fact that some of the relatively more developed
European countries are also relatively more corrupt For example although
Switzerland and Norway are more developed than Finland they are also relatively
more corrupt than Finland The basic point of this study is that development is not the
sole criterion for generating a corruption free economy although it matters a lot This
study raises a noteworthy question as to why developed rich7 countries are unable to
eradicate corruption completely or what is missing in these countries other than 7 The terms developed or rich countries for EU countries have been used as a matter of convenience According to World Bank except Lativa all countries in sample are high income countries (httpwwwiqlaorgjoiningWorld-Bank_Classification-List_2009pdf)
4
development that is generating the incidence of corruption An answer to this
question will not only help us to halt the rising trends of corruption in developed
countries but it should also serve as a timely anti-corruption tool for developing
countries where the incidence of corruption is a more serious issue
Another motivation for this study relates to the cultural and contagious nature
of corruption For example the literature on the causes of corruption identifies
corruption as a cultural phenomenon (Paldam 2002) and also identifies corruption as
contagious implying that corruption norms shift from one country to another (Majeed
and MacDonald 2011) For this reason it is important to ask why some countries in
the same region in our case Europe are clean while some of them are plagued with
corruption and why anti-corruption norms do not spread from a clean EU country to a
neighbouring country For example France shares a border with Switzerland and
Germany but the incidence of corruption is relatively lower in France So the natural
question to ask is why clean economies are unable to transfer anti-corruption norms
into neighbouring countries over time or put differently why clean economies are
consistently clean when their neighbouring countries have corruption prone elements
What is it in these (clean) economies that prevents a shift of corrupt activities from
neighbouring countries
The existing literature on the causes of corruption focuses on countries outside
Europe while in this study we focus exclusively on corruption in European countries
Although there are many potential determinants of corruption in this paper we focus
on the role of historical factors legal influences and political stability Four key
questions addressed are (1) what are the effects of how politically stable a country is
on the incidence of corruption (2) how important are historical and legal influences
in affecting corruption (3) what are the interactive effects of history law and
political instability (4) do interdisciplinary approaches explain corruption in a more
appropriate way
The rest of the discussion is structured as follow Section 2 provides a review
of the related literature while section 3 provides a theory on the selected predictors of
corruption Section 4 presents a simple model and discusses the data used in this study
Section 5 presents our results and provides a discussion of these results Finally
section 6 provides a conclusion
5
2 Survey of the Literature Corruption in Europe
In this section we systematically review the literature on the incidence of corruption in
European countries using a number of research sources such as surveys reports
academic articles stylized facts and scandals Using extant literature we support our
main proposition that corruption is a growing threat in European countries In EU
member states some nations suffer relatively high levels of corruption while others are
relatively clean Rapid economic transactions labour mobility uniform trade policies
and the widespread availability of information are among the potential sources that
shift cultural and political norms across borders within the member states Since
corruption by its nature is contagious it is highly likely that it will spread across
European countries that are members of the EU
According to the 2004 constitutional treaty of the European Union Member
Sates one core objective of the European Union is to offer its citizens an area of
freedom security and justice without internal borders The existing corruption and its
growing threat would seem to present a major obstacle to meeting this goal The
Eurobarometer surveys conducted in 2005 2007 and 2009 show that the majority of
Europeans believe that corruption is a major problem for EU member states In the
intervening years of the surveys a number of corruption scandals emerged in member
states including Finland Malta Austria Spain and UK In the same period global
financial crises have hit the European countries and the negative effects are still being
felt which has put an additional burden on the government of member states in the
EU
The euro barometer (2009) reports that the main reasons for corruption in
Europe are the lack of a real deterrent for corruption and a lack of transparency in
public spending In addition the majority of Europeans agree that corruption exists
within European Union institutions For example according to the Euro barometer
(2009) 94 of the respondents in Cyprus believe that corruption is widespread in the
police and wider public sector Two reasons for the perceived high corruption is that
appointments in the public sectors are not based on merit and that there is a poor rule
of law The Global Corruption Barometer (2010) has revealed that corruption in
Portugal has increased during the past three years and that 83 of the Portuguese
consider corruption has risen since 2007
6
In June 2011 Transparency International UK (TI-UK)8 issued a research
report that examines the levels of corruption in 23 sectors and institutions in the UK
The report shows that corruption is a much greater problem than recognized and there
is an inadequate response to its growing threat and the report identifies the following
sectors and institutions where corruption is particularly prevalent the prison system
political parties parliament and sport The report highlights the corruption risks
related to government policy For example cuts in government spending in specific
areas and rapid institutional changes may create an environment that largely increases
the risk of corruption The report shows that organized crime is the root cause of graft
in Britain The organized criminals have targeted staff of the UK Border Agency
prison service and police force
According to a survey (Capacent-Gallup 2009) 78 of the respondents in
Iceland believe that corruption in the private sector is rather high A similar trend has
been observed in the public opinion of corruption among the members of the ruling
party where the number of respondents who believe corruption has increased from
12 in 2007 to 71 in 2009 In addition 40 of Icelanders consider that public
officials are corrupt According to Global Integrity Report (2004)9 corruption in
Germany is spreading like a cancer and it has become part of todayrsquos German reality
The report says that public officials are involved in bribery managers misdirect
money into their own pockets and politicians misuse resources for their personal
gains
Norway is considered amongst the cleanest economies although in recent
years according to the Global Integrity Report (2009)10 corruption is increasing in
this country as well In four different cases the rehabilitation of public buildings has
been exposed to corruption as civil servants responsible for the rehabilitation
received bribes The CEO of two public companies in Norway has misused his
position for private gain and is alleged to have transferred more than 100 million
Norwegian kroners (US$ 177 million) from the two public companies into his private
accounts
According to the Global Integrity Report (2009)11 ccorruption is a major issue
in Slovakia Political corruption is widespread contracts are awarded to party 8 httpwwwtransparencyorgukti-uk-programmescorruption-in-the-uk 9 httpglobalintegrityorgreports20042004country65a8htmlcc=deampact=notebook 10httpreportglobalintegrityorgNorway2009notebook 11 httpreportglobalintegrityorgSlovakia2009notebook
7
supporters tenders are over priced and questionably managed Slovakians pay bribes
of expensive alcohol to professors to secure admission to prestigious universities and
to doctors in exchange for special medical treatment Experts refer to such a
widespread corruption in Slovakia to an historical heritage that existed under
communist rule (1948-89)
In Hungary aaccording to the Global Integrity Report (2008)12 evidence on
corruption ranges from small payments to high profile corrupt activities Recently it
was discovered that many Budapest drivers pay lower parking fees to parking control
companies instead of higher official parking prices Tax evasion is also part of the
culture Overall corruption contaminates many parts of Hungarian society It persists
in the departments issuing permits and licenses in the distribution of EU subsides
local government procurement local government and commercial bribery
Although it takes four days by train to reach Moscow from the central station
of Bishkek in the Kyrgyz Republic trains are always full on this route and since travel
by train is relatively cheap local businesses transport goods to Russia However
according to Global Integrity Report (2008)13 Kyrgyz customs officials demand
bribes from the passengers irrespective of whether they are transporting legal or
illegal goods In 2007 Kyrgyz customs reported US$100 millions imported from
china while Chinese customs reported US$200 million exported The customs staff in
Kyrgyz is known as the second most corrupt government agency where as the first
most corrupt agency is law enforcement
According to a report of the Centre for the Study of Democracy14 corruption
in the Netherlands is more prevalent in the public sector than in the political sphere In
the public sector corruption is more common at local levels than in central
administrative bodies These are the construction companies that pay bribes to local
officials in relation to access to public contracts and making the contracts profitable
One other type of local level corruption is related to red-light districts Individuals
linked to organized crimes buy residential places in or near red-light areas and then
give bribes to officials in the municipality for changing the classification of the place
from lsquoresidentialrsquo to lsquobrothelrsquo De Graaf et al (2008) have analyzed corruption cases
in the Netherlands They note that civil servants who are found to be susceptible to 12 httpreportglobalintegrityorgHungary2008notebook 13 httpreportglobalintegrityorgKyrgyz20Republic2008notebook 14 httpwwweuroparleuropaeumeetdocs2009_2014documentslibedvreport_csd_report_csd_enpdf
8
corruption are rather high profile officials in the civil service organization They note
that every second working day a new corruption investigation begins somewhere in
the government apparatus in the Netherlands
Costas-Peacuterez et al (2011) provides evidence on corruption for Spain using a
data set based upon press reports published over the period 1996-2009 Their data
show that corruption scandals emerged during 1999-2003 and peaked just before the
2007 elections and these scandals caused adverse effects on the election outcome Del
Monte and Papagni (2007) examine the causes of corruption in Italy and found that
economic variables affect corruption but that the explanatory power of the economic
variables is low and that political and cultural influences significantly affect
corruption The authors argue that corruption has plagued other sectors such as the
judiciary which were free from corruption in the past Since it is believed that known
offenders can continue corrupt practices with little risk of punishment corruption goes
on and on in Italy McCarthy (2003) evaluates the corruption incidence for the
economy of Ireland and argues that political corruption has increased sharply in recent
times The author emphasizes a review of the policy structure to curb corruption
particularly in two areas the zoning of land and the allocation of licences by beauty
contests
We can infer following points from the above short survey (1) corruption is a
reality in todayrsquos Europe and EU member states and it is a growing threat (2) at the
time of writing socioeconomic conditions and the ongoing financial crises are
increasing corruption perceptions and actual corruption (3) the strength of a countryrsquos
judiciary are important in the fight against corruption (4) in some countries
corruption exists among high level officials and this is likely to spill over to lower
levels in due course (5) some sectors and institutions in Europe are plagued with
corruption while some are free from it however corruption is likely to spread to clean
sectors and institutions as well eventually (6) perceptions about the lack of
punishment or lenient punishment also cause more corruption
Surprisingly no one has tested for the causes of corruption in European or EU
countries despite overwhelming evidence on the existence of corruption in European
countries Although case studies are there and country based evidence available such
evidence is often anecdotal and limited to a specific countryrsquos experience
Nevertheless unfortunately corruption is not just a country specific issue and
corruption by its nature it is not bound to stay within the boundaries of a country
9
Particularly due to its boundary free nature corruption is likely to flourish in EU
states as these countries provide a border free environment for their citizens We
believe that this is the first study of its kind that systematically quantifies the causes of
corruption in European countries
3 Theory Law political stability and history Law Corruption flourishes in an environment of unrestrained bureaucracy but it can be
contained when the laws of the land are vigorously enforced Moreover when the
administration or the political order is considered as illegitimate the social pressures
against acts of corruption become less important Corruption can therefore be
effectively curtailed by an administration that enjoys an enduring legitimacy
The level of corruption depends on the extent to which the laws of the land are
binding and enforced Corrupt officials are rational welfare maximizers they weigh
the pecuniary benefits from corruption against its cost The personal cost of corruption
is the loss of a job and the jail-time if caught and persecuted Individuals will act
corruptly so long as the perceived gains from corruption outweigh the costs The
probability of detection is lower the more lackadaisical the judicial system is Judicial
laxity reduces the opportunity cost of being corrupt Hence countries with strict laws
and efficient judicial systems tend to be less corrupt and vice versa (Ali and Isse
2003)
In a nutshell the legal strengths of a country play an important role in
reducing corruption levels If nobody is above the law then the incidence of corrupt
activities are least likely This study uses a rule of law index as a proxy for the legal
strength of a country This index has been used by a number of studies such as (Ali
and Isse 2003 and Herzfeld and Weiss 2003) This index shows the extent to which
the citizens of a country are willing to accept the established institutions to make and
implement laws and adjudicate disputes This index also reflects the degree to which
countries have a strong court system and an orderly succession of power The
expected sign for this variable is negative because both theory and empirical studies
show that a strong rule of law curbs corruption-prone activities
Political stability Political stability is another important variable that affects corruption levels It is
widely accepted in the literature that corruption is rooted in political deficiencies An
10
established democracy promotes political competition transparency and
accountability (to the voter) thereby reducing corruption If we look at democracy
from a dynamic rather than a procedural point of view it leads us to political
stability On the one hand politically stable administrations create productive
incentives for bureaucrats because they face less chance of dismissal and find more
opportunities for long-term development of their official careers It means political
stability motivates bureaucrats to build an open and honest reputation for career
advancement On the other hand a secure position in bureaucracy may help maintain
lsquopatronage and corruptionrsquo reputation and relations (Treisman 2000) These two
conflicting hypotheses require an empirical test and this study provides one
One of the important elements that determines the pervasiveness of corruption
in the public sector is defined as lsquopublic moralersquo that reflects faith in a countryrsquos
administrators (such as politicians and policy makers) In economies where polices
are unanticipated or policy makers renege on their commitments or policy changes are
not purely democratic the economy suffers from economic chaos that in turn
negatively affects public morale This study proxies economic chaos using high
inflation rates since high inflation rates reflect macroeconomic imbalances Another
outcome of high inflation rates is the redistribution of national wealth that may lead to
a further drop in the public morale (Paldam 2002 Majeed and Macdonald 2010) In
the literature high inflation rates are also used as a proxy for political instability
History The linkages between history and corruption are not simple and remain to be fully
studied in the literature (see Lambsdorff 2006 p 22) However one of the proposed
links between history and corruption is the role of historical precedents and customs
that might shape institutions and cultural norms in a country (Knack and Keefer
1995 Lambsdorff 2006 and Paldam 2002) This link implies that established
practises and norms in old countries might be difficult to abandon and it also implies
that many of these established practises might be viewed as corrupt over time by
outsiders Corruption in these economies might be considered a norm of doing
business and thus might have become socially acceptable This all means that over
time potential bribe-givers become familiar with the mechanism of offering bribes
(see Lambsdorff and Teksoz 2004) On the other hand it is also possible that
enforcement mechanisms and institutional strengths might be well established in old
11
countries thereby making corruption less likely In this study countries have been
divided into two groups namely those with a long history (more than one century)
and those with a relatively short history
4 Model and Data The theoretical formation of a model for this study relies on Becker (1968)rsquos seminal
work where individuals make rational choices by giving weights to relative costs and
benefits of an illegal (corrupt) activity These costs and benefits depend on exogenous
factors that in turn depend on the role of law and the socio-cultural environment The
socio-cultural environment is developed by historical legal political and country-
specific factors This study takes into account all these factors for an empirical
analysis The specified equation is given as follows
)1(54321 ittitititititititit XHPolLawPCYC ενμβββββα ++++++++=
Where )11( TtNi ==
Where Cit is a perceived corruption index Lawit represents degree of rule of law Polit
denotes political stability Hit is a dummy variable for a country with a long history
Xit represents a set of control variables based on those used in the existing corruption
literature ui is a country specific unobservable effect vt is a time specific factor and εit
is an iid disturbance term The expected sign for the parameters on our key variables
of interest - β2 β3 and β4 - are all negative
)2( 54321 ittititititititititit XHLawLawHPCYC ενμβββββα ++++++++=
Equation 2 includes an interactive term - lawhistory - to assess the combined effect
of historical and legal influences in reducing corruption levels The expected sign for
β4 is negative
)3( 54321 ittititititititititit XHPolPolHPCYC ενμβββββα ++++++++=
Equation 3 excludes law and lawhistory and includes political stability and an
interactive term historypolitical stability to assess the combined effect of historical
12
and political influences in reducing corruption levels The expected sign for β4 is
negative
41 Data Description Empirical studies on corruption mainly use two indexes of corruption provided by the
ICRG (International Country Risk Guide) and Transparency International In this
study the corruption perception index of the ICRG has been used for two reasons
First it spans a long period of time and covers a large number of countries and the
comprehensive nature of the index gives it an edge over other available indices for
corruption Second this index is highly correlated with other available corruption
indices (see Treisman 2000)
Recently Majeed and MacDonald (2010) demonstrate a high correlation
between these alternative corruption indices over the period 1996-2007 with the
correlation between the ICRG and TI corruption indices at 087 and the correlation
between ICRG and World Bank (WB)rsquos corruption indices being 088 Finally their
study shows a very high correlation between TI and WB of 098 These high
correlations indicate that the alternative corruption indices are consistent even though
they are based on a subjective rating The other variables used in this study are
reported in Table 1 (appendix) The data for this study has been averaged over 5-year
non overlapping periods using the overall period 1984-2007 Thus data series contain
5 observations for each country in the sample The year average periods are 1984-88
1989-93 1994-98 1999-03 and 2004-07
Table1 shows that Finland Denmark Sweden Iceland and the Netherlands are
the cleanest countries in Europe while Latvia Croatia Slovakia Slovenia and Italy
are the bottom five cleanest countries This simple ranking of the economies is based
on an average over the total sample period 1984-07 and demonstrates that Finland is
the cleanest country while Latvia is the most corrupt country
Figure 3 shows the results from regressing the corruption index onto a
constant and a time trend It is evident from the figure that the relationship between
corruption and time is akin to an inverted U-shape over the period 1984-92 However
from 1992 to onwards corruption is increasing In fact the figure clearly shows a
rising trend in corruption over the period Corruption in European countries on
average has increased by 22 of the corruption scale over the period 1984-2007
This is an alarming figure for European countries and surely needs to be addressed in
13
order to avoid the adverse socio-economic and political consequences of an increasing
rate of corruption
In Figures 4 and 5 we present a number of scatter plots to illustrate the
bivariate relationships between corruption and a number of variables often cited in the
literature as determinants of corruption As the figures show inflation is the only
variable to have a positive relationship with corruption levels while all the other
scatter plots - for government spending law socioeconomic conditions democracy
and economic freedom - show a negative relationship with corruption For example
the negative relationship between corruption and government spending implies that
larger governments might control corruption effectively by spending more resources
on law enforcement machinery It is note worthy that the cleanest economies such as
Denmark and Sweden also have the highest levels of government spending the ratio
of government spending to GDP for these economies is greater than 25
It is noteworthy that countries with the full scale of law and order such as
Finland Denmark Norway and Sweden are also the cleanest countries Law and order
reflect legal and enforcement strengths of a country that can effectively curb
corruption Interpreting both government spending and law in relation to corruption it
can be argued that the economies with larger shares of government spending
combined with a fully developed legal structure devote a major share of resources to
upholding the law In figure 5 scatter plots for economic prosperity bureaucracy
quality and informationcommunication related variables show a negative
relationship with the corruption incidence Information that is symmetric or
information available on a larger scale implies tight monitoring of bureaucrats A
society with more information and communication facilities tends to be less corrupt
5 Results and Discussion
The above scatter plots are indicative of the drivers of corruption In this section we
present our multivariate results where we condition corruption jointly on the variables
noted above Specifically we use a panel data set for 26 European countries over the
longest period of time that has hitherto been estimated Initially we condition on key
variables in the corruption literature such as law and political stability Secondly as a
sensitivity analysis some further control variables are introduced Thirdly and finally
alternative econometric techniques have been used to address the possible problem of
endogeneity
14
Table 3 reports the results for a benchmark model Column (1) of the table
shows the control variables while column (2) shows the relationship between
corruption and economic development The coefficient on the level of economic
development turns out to be significant with the expected sign and remains
consistently significant in all other regressions The level of economic development
plays an important role in reducing corruption in rich economies This suggests that a
high level of economic development is also important for high-income countries just
like low-income countries
Economic development is seen to affect corruption in a number of ways A
high level of economic development reduces the discount rates of both bribe-givers
and bribe-takers thereby making them less eager to jump the queue via illegal means
The opportunity cost of punishment for a wealthy individual is much higher and also
acts as a deterrent Citizens of rich societies do not tolerate corruption due to the
awareness of their rights and they react forcefully to corruption-prone activities On
the other hand countries where incomes are relatively low the average citizen
receives minimal wealth Such low levels of income create structural incentives for
corrupt ways of increasing income In these economies the marginal utility of money
is higher than in wealthier nations The high utility of money even for a marginal
supplement to income affects both the bribe-giver and bribe-taker This finding is
consistent with Treisman 2000 Serra 2006 Majeed and MacDonald 2010
Column (3) shows that the coefficient on the rule of law is significant with the
correct sign - a nation with a strong legal set up has a high opportunity cost of
corruption activity and thus serves as a deterrent to corruption
The role of government spending term in reducing corruption can be signed in
either direction larger governments may increase corruption because of a greater
bureaucracy and red tape and also more opportunities to seek bribery (La Porta et el
1999 Rose-Ackerman 1999) On the other hand larger governments can spend more
resources on law enforcement and can also spend more resources on checks and
balances implying larger governments might effectively control corruption Columns
(4-5) indicate that the influence of a large government on corruption levels is
negative although the influence is not significant once additional control variables
particularly time dummies are introduced its influence turns out to be significant in
all remaining columns of Table 3 Columns (6-8) of Table 3 suggest that larger
governments are effective in controlling corruption in European countries The
15
coefficient on government spending is consistently significant in all regressions The
R squared statistic is reasonably high and the F stat supports the overall significance
of the model
Economic freedom is used as an indicator of political stability (see Serra
2006) The coefficient on economic freedom turns out to be significant with a
negative sign as expected because a higher level of economic freedom reduces rent
seeking opportunities thereby reducing corruption The sign for this variable is stable
and always negative in all other regressions however in some cases its level of
significance varies
The relationship between trade and corruption is ambiguous in the theoretical
literature Ades and DiTella (1999) provide insights on the relationship between
corruption market structure and rents They argue that market structure determines
rents and in turn the rents determine corruption More generally lower competition
in markets generates rents for entrepreneurs that motivate bureaucrats to ask for
bribery It implies that the relationship between competition and corruption is
negative The higher the degree of competition yields lower levels of corruption
Since openness to trade increases competition it can be expected that a higher degree
of economic openness yields lower corruption Alternatively lower levels of
competition increase the value of corruption avoidance for a society and increase the
accountability and monitoring of bureaucracy Theoretically therefore the net impact
of competition on corruption is uncertain and it is interesting to note that we find that
foreign competition (measured by openness to trade) has a positive influence on
corruption in European countries The sign for openness to trade is stable and always
negative although the level of significance changes
Table 4 replicates the benchmark findings using the Random Effects
econometric technique The coefficient on law fluctuates between 03 and 05 A one-
standard-deviation increase in legal strength is associated with a decrease in
corruption of 026 (or 043) points 26 (or 40) of a standard deviation in the
corruption index The role of government in reducing corruption is consistently
negative while the role of foreign competition is consistently positive The effect of a
higher degree of economic freedom is significant with the expected sign Finally
inflation does not reflect a significant effect on corruption
Table 5 reports results for another key variable of interest namely political
stability The empirical strategy remains the same except the variable lsquolawrsquo is replaced
16
with political stability Both variables can be used together however in this study
their effects have been examined individually for two reasons First both variables are
highly correlated and may bias the results if they are used together Second this
studyrsquos focus is to identify individual effects of both variables In the literature
political stability is measured using a number of indicators In this study we focus on
two indicators namely democracy and economic freedom
The effect of democracy has been frequently used in the literature (see
Treisman 2000 Serra 2006 Majeed and MacDonald 2010) as it measures the
degree of political competition and this is taken to be closely related to political
deficiencies in a country The coefficient on this variable turns out to be significant
with a negative sign Indeed all of the regressions in this study show that the effect of
democracy is always negative and significant The coefficient on democracy is around
03 in most of the regressions which implies that a one-standard-deviation increase in
democracy is associated with a decrease in corruption of 021 points 20 of a
standard deviation in the corruption index The other findings are similar to the
benchmark findings However economic freedom drops its level of significance while
the sign remains negative This might be due to the fact that influence of this variable
has been explained by the democracy variable because economic freedom and
democracy are closely related
Table 6 replicates the results of Table 5 using the Random Effects
econometrics method The effect of democracy remains stable and always negative
Its effect turns out to be significant in the last 3 columns of the table where time
dummies have been controlled for and also some additional control variables have
been introduced The role of government in curbing corruption is negative and
significant in all of the regressions of this table Other findings are similar to the
results above
Table 7 provides results for the influence of history on corruption The
relationship between history and corruption is complex and theoretically ambiguous
The history of a country has usually been measured using a dummy variable for old
countries which have a long history of independence In this study countries which
have more than one century of independence history have been considered as lsquooldrsquo
countries Columns (3-6) indicate that the relationship between the history of a
country and corruption is negative although insignificant
17
Considering the importance of legal strengths of a country in reducing
corruption an interactive variable lsquohistory and lawrsquo has been introduced in column 6
and the results show that the combined effect of law and history significantly reduces
corruption while just old countries are positivity associated with corruption Overall
this finding implies that nations with a long history may not be able to control
corruption because of entrenched norms and practises about business practice that
foreigners may consider as corrupt However nations which have a long history and
also have developed legal strengths may successfully combat corruption
Finally Table 8 provides results for law history and political stability as
causes of corruption in European countries using a system-GMM method Columns
(2-3) report results for law and it is evident that the influence of law on corruption is
negative and significant The size of the coefficients and level of significance have
improved relative to the results reported above Columns (5-7) report results for
democracy and here the results are similar to our earlier findings as the coefficient on
democracy is consistently negative and significant in explaining corruption
The independent role of history turns out to be positive and significant when
an interactive term lawhistory or democracyhistory is included However its
combined effect with law or democracy significantly reduces corruption levels These
findings again reinforce the idea that an interdisciplinary approach to understanding
corruption is superior to uni-dimensional approach ie the independent effect of the
history is not meaningful while its combined effect with law or political stability
(democracy) provides better insights in understanding corruption Other findings are
similar to our previous findings in terms of direction of the relationship while level of
significance varies
Overall our results show that law is an important factor in explaining a
significant part of corruption in European countries Political stability is another
important factor that can help in controlling the incidence of corruption The role of
the history of a country shows mixed results The independent effect of history does
not significantly explain corruption while its interactive effect with law or political
stability significantly explains corruption Economic freedom which is also an
indicator of political stability emerges as an important factor in controlling corruption
while inflation which reflects macroeconomic imbalances does not explain
corruption significantly The role of government is also critical in combating
corruption All of the regressions provide a stable negative relationship between
18
government size and corruption larger governments can spend more resources to
control for corruption and increase checks and balances on corrupt activities The
cleanest economies such as Denmark and Sweden allocate more than 25 of their
GDP to government spending
6 Conclusion
In recent years the elimination of global corruption has become a key objective of
international organizations such as the World Bank IMF and UNDP These
organizations have advocated anti-corruption policies and transparent contracts for
domestic government In addition governments are increasingly monitoring
bureaucrats and devising appropriate punishments for corrupt bureaucrats However
despite these initiatives corruption has become a global challenge
Although corruption is generally considered a problem for developing
countries recently a number of corruption scandals in rich countries have shown that
corruption is an equally important problem for developed nations In particular using
a simple descriptive average this study shows that corruption in European countries
has increased 16 units or 22 of the corruption index over the period 1984-2007
This study asks why corruption is increasing in European countries and what are the
most important factors that cause corruption in European countries
The main purpose of this study has been to quantify that corruption exists and
persists in European countries just as in developing countries Although the level of
corruption in European countries is comparatively lower than for developing countries
it is increasing over time and it would seem that a solid policy framework is required
to halt its increasing trend if corruption continues to develop in European countries
then it would be much more costly and difficult to eradicate as corruption would
become the norm of business and also may become socially acceptable The recent
emerging literature on the causes of corruption has largely ignored the determinants of
corruption in European countries although a number of corruption scandals speeches
and reports indicate that corruption is present in European countries So far there has
been no econometric and statistical analysis of the causes of corruption for European
countries That is the purpose of this study and we focus on the key determinants of
corruption in Europe namely history law and political stability
The study finds substantial support for the importance of law in reducing
corruption levels Our results show that a one-standard-deviation increase in the legal
19
strength is associated with a decrease in corruption of 026 points 26 of a standard
deviation in the corruption index Similarly we find a substantial support for the
proposition that political stability plays an important role in combating corruption We
do not find a significant influence of history on corruption although the combined
effect of the history of a nation with law or political stability is shown to significantly
explain corruption The significant interactive influences of law history and political
stability on corruption incidence implies that we need an interdisciplinary approach
rather than say a solely economic story to properly explain corruption Finally
government size also matters in affecting corruption with larger governments seeming
to control corruption in a better way
20
Relatively Clean Countries
Fig 1
01234567
Finlan
d
Denmark
Sweden
Iceland
Netherlan
ds
Norway
Switzer
land
United K
ingdom
German
y
Austria
Portug
al
Franc
e
Belgium
Countries
Corr
uptio
n In
dex
Fig 1
Figure 1
Relatively Corrupt Countries Fig 2
005
115
225
335
445
Hunga
ry
Spain
Irelan
d
Greec
e
Cypru
s
Estonia
Malta
Czech
Rep
ublic
Italy
Sloven
ia
Slovak
ia
Croati
aLa
tvia
Countries
Corr
uptio
n In
dex
Fig 2
Figure 2
19841985
19861987198819891990
1991
19921993
1994
19951996
19971998
199920002001
200220032004200520062007
15
22
53
35
Cor
rupt
ion
Inde
x
1985 1990 1995 2000 2005Time (1984-2007)
Fitted values corr
Time Trend of Corruption in EU Countries
Figure 3
21
aut
bel
cro
cyp
cze
den
est
fin
fra
ger
gre hun
ice
ire
ita
lat
mat
netnor
por
slo slv
spa
swe
swt
ukr
01
23
4C
orru
ptio
n In
dex
1 2 3 4 5Inflation
Fitted values corr
Corruption and Inflation
aut
bel
cro
cyp
cze
den
est
fin
fra
ger
grehun
ice
ire
ita
lat
mat
netnor
por
sloslv
spa
swe
swt
ukr
01
23
4C
orru
ptio
n In
dex
10 15 20 25 30Government Spending
Fitted values corr
Corruption and Government
aut
bel
cro
cyp
cze
den
est
fin
fra
ger
gre hun
ice
ire
ita
lat
mat
netnor
por
sloslv
spa
swe
swt
ukr
01
23
4C
orru
ptio
n In
dex
4 45 5 55 6Law
Fitted values corr
Corruption and Law
aut
bel
cro
cyp
cze
den
est
fin
fra
ger
grehun
ice
ire
ita
lat
mat
netnor
por
sloslv
spa
swe
swt
ukr
01
23
4C
orru
ptio
n In
dex
5 6 7 8 9Socioeconomic Conditions
Fitted values corr
Corruption and Socioeconomic Conditions
aut
bel
cro
cyp
cze
den
est
fin
fra
ger
gre hun
ice
ire
ita
lat
mat
netnor
por
sloslv
spa
swe
swt
ukr
01
23
4C
orru
ptio
n In
dex
45 5 55 6Democracy
Fitted values corr
Corruption and Political Stability
aut
bel
cro
cyp
cze
den
est
fin
fra
ger
grehun
ice
ire
ita
lat
mat
netnor
por
slo slv
spa
swe
swt
ukr
01
23
4C
orru
ptio
n In
dex
5 55 6 65 7Economic Freedom
Fitted values corr
Corruption and Economic Freedom
Figure 4
22
aut
bel
cro
cyp
cze
den
est
fin
fra
ger
grehun
ice
ire
ita
lat
mat
netnor
por
slo slv
spa
swe
swt
ukr
01
23
4C
orru
ptio
n In
dex
0 10000 20000 30000 40000Per Capita Income (PCY)
Fitted values corr
Corruption and Economic Development
aut
bel
cro
cyp
cze
den
est
fin
fra
ger
gre hun
ice
ire
ita
lat
mat
netnor
por
sloslv
spa
swe
swt
ukr
01
23
4C
orru
ptio
n In
dex
2 25 3 35 4Bureaucracy Quality
Fitted values corr
Corruption and Bureaucracy Quality
aut
bel
cro
cyp
cze
den
est
fin
fra
ger
hun
ice
ire
ita
lat
netnor
por
slo slv
spa
swe
swt
ukr
01
23
4C
orru
ptio
n In
dex
0 200 400 600Daily Newspapers Circulation
Fitted values corr
Corruption and Daily Newspapers Circulation
aut
bel
cro
cyp
cze
den
est
fin
fra
ger
gre hun
ice
ire
ita
lat
mat
netnor
por
sloslv
spa
swe
swt
ukr
01
23
4C
orru
ptio
n In
dex
10 20 30 40Internet
Fitted values corr
Corruption and Internet
aut
bel
cro
cyp
cze
den
est
fin
fra
ger
grehun
ice
ire
ita
lat
mat
netnor
por
slo slv
spa
swe
swt
ukr
01
23
4C
orru
ptio
n In
dex
40 60 80 100 120Mobile Phones
Fitted values corr
Corruption and Mobile Phones
aut
bel
cro
cyp
cze
den
est
fin
fra
ger
grehun
ice
ire
ita
lat
mat
netnor
por
slo slv
spa
swe
swt
ukr
01
23
4C
orru
ptio
n In
dex
20 30 40 50 60 70Telephones
Fitted values corr
Corruption and Telephones
Figure 5
23
Table 1 Ranking of Corruption Levels in European Countries 1984-2007 NO Comparatively Clean Economies NO Comparatively Corrupt Economies Country Corruption Index Country Corruption Index 1 Finland 600 1 Hungary 4162 Denmark 585 2 Spain 4143 Sweden 579 3 Ireland 4124 Iceland 577 4 Greece 4095 Netherlands 574 5 Cyprus 4006 Norway 552 6 Estonia 3607 Switzerland 539 7 Malta 3548 United Kingdom 501 8 Czech Republic 3469 Germany 497 9 Italy 33510 Austria 483 10 Slovenia 33111 Portugal 445 11 Slovakia 32812 France 445 12 Croatia 27813 Belgium 445 13 Latvia 231
Note corruption Index ranges from 0-6 where 0 indicates most corrupt and 6 indicates corruption free Table 2 Descriptive Statistics
Variable Observation Mean Std Dev Min Max Corruption 112 461 105 229 603 PCY 121 17149 9575 3190 41029 Economic Freedom 118 135 064 100 490 Law 112 527 086 200 600 Democracy 112 551 069 300 600 Government Spending 120 1969 401 994 2769 Exports 119 4485 1960 1682 9307 Imports 119 4491 1961 1855 10040 Trade Openness 119 8976 3876 3621 19045 Bureaucracy Quality 112 353 057 198 400 Inflation 117 1389 7743 054 82944
24
Table 3 Corruption and Law in European Countries Panel Estimation Variables Dependent Variable Corruption Index PCY -0000
(-625) -0000 (-233)
-0000 (-241)
-0000 (-178)
-0000 (-516)
-0000 (-240)
-0000 (-16)
Law -062 (-562)
-0581 (-495)
-057 (-422)
-05 (-504)
-032 (-324)
-033 (-328)
Government -0025 (-122)
-0027 (-147)
-0031 (-199)
-0031 (-211)
-003 (-195)
Trade 001 (326)
0002 (114)
0003 (151)
0003 (174)
Bureaucracy Quality
-055 (-402)
-054 (-397)
Economic Freedom
-019 (-231)
1994 011 (077)
01 (069)
012 (087)
1999 058 (303)
055 (313)
058 (324)
2004 103 (546)
102 (614)
103 (614)
2007 132 (736)
121 (731)
124 (731)
R2 026 043 044 050 069 072 072 F Stat 3912
(0000) 4080 (0000)
3640 (0000)
23263 (0000)
4262 (0000)
4184 (0000)
3910 (0000)
Observations 112 112 111 111 111 111 denotes statistically significant at the 1 level denotes statistically significant at the 5 level denotes statistically significant at the 10 level
25
Table 4 Corruption and Law in European Countries Random Effects Variables Dependent Variable Corruption Index PCY -0000
(-167) 0000 (205)
0000 (200)
-0000 (-235)
-0000 (-183)
-0000 (-196)
Law -053 (-524)
-042 (-499)
-042 (-458)
-033 (-392)
-033 (-407)
-031 (-367)
Government -0025 (-149)
-0036 (-147)
-005 (-225)
-005 (-224)
-004 (-192)
Trade 001 (326)
0003 (128)
0005 (195)
0005 (190)
Economic Freedom
-037 (-315)
Inflation -0001 (-010)
1994 006 (041)
011 (085)
015 (109)
1999 044 (282)
048 (319)
047 (290)
2004 093 (579)
095 (612)
096 (586)
2007 120 (658)
126 (706)
129 (692)
With in R 020 024 045 058 062 060 Between R 027 015 025 073 072 074 Overall R 024 023 030 067 067 067 Wald 2752
(0000) 3021 (0000)
6710 (0000)
16060 (0000)
18001 (0000)
17202 (0000)
Observations 112 111 111 111 111 111 denotes statistically significant at the 1 level denotes statistically significant at the 5 level denotes statistically significant at the 10 level
26
Table 5 Corruption and Political Stability (Democracy) in European Countries Panel Estimation Variables Dependent Variable Corruption Index PCY -0000
(-625) -0000 (-450)
-0000 (-396)
-0000 (-312)
-0000 (-606)
-0000 (-326)
-0000 (-29)
Democracy -025 (-181)
-022 (-16)
-029 (-206)
-05 (-497)
-033 (-285)
-030 (-255)
Government -0048 (-213)
-0049 (-240)
-004 (-301)
-0039 (-289)
-004 (-281)
Trade 001 (360)
0002 (110)
0003 (148)
0003 (16)
Bureaucracy Quality
-054 (-355)
-055 (-363)
EF -008 (-089)
1994 -03 (-021)
-0002 (-002)
001 (006)
1999 039 (220)
042 (255)
042 (256)
2004 114 (663)
109 (689)
109 (685)
2007 158 (727)
139 (706)
139 (706)
R2 026 028 031 039 069 071 071 F 3912
(0000) 4080 (0000)
2015 (0000)
2491 (0000)
5080 (0000)
4417 (0000)
4042 (0000)
Observations 112 112 111 111 111 111 111 denotes statistically significant at the 1 level denotes statistically significant at the 5 level denotes statistically significant at the 10 level
27
Table 6 Corruption and Political Stability (Democracy) in European Countries Random Effects Variables Dependent Variable Corruption Index PCY -0000
(-190) -0000 (-102)
-0000 (-018)
-0000 (-443)
-0000 (-398)
-0000 (-419)
Democracy -013 (-062)
-005 (-037)
-013 (-109)
-033 (-371)
-028 (-302)
-028 (-305)
Government -007 (-205)
-0053 (-181)
-005 (-251)
-005 (-250)
-005 (-241)
Trade 001 (545)
0003 (130)
0004 (160)
0003 (148)
Economic Freedom
-017 (-143)
-024 (-183)
-013 (-128)
1994 -03 (-018)
0002 (001)
007 (045)
1999 033 (217)
034 (223)
028 (173)
2004 107 (647)
106 (646)
10004 (594)
2007 147 (797)
147 (801)
143 (748)
With in R 028 006 029 055 056 056 Between R 069 040 030 076 075 077 Overall R 027 024 026 068 067 068 Wald 597
(005) 758 (005)
3740 (0000)
16731 (0000)
16898 (0000)
17092 (0000)
Observations 112 111 111 111 111 111 denotes statistically significant at the 1 level denotes statistically significant at the 5 level denotes statistically significant at the 10 level
28
Table 7 Corruption and History in European Countries Panel Estimation Variables Dependent Variable Corruption Index PCY -0000
(-625) -0000 (-633)
-0000 (-246)
-0000 (-245)
-0000 (-243)
-0000 (-238)
-0000 (-17)
History -011 (-058)
-025 (-140)
-022 (-130)
-002 (-015)
25 (215)
257 (213)
RL -060 (-529)
-058 (-480)
-058 (-481)
-038 (-359)
-037 (-341)
G 002 (-087)
Trade 001 (334)
001 (446)
001 (464)
RLH -047 (-219)
-047 (-216)
EF -016 (-135)
R2 026 030 044 039 049 051 052 F 3912
(0000) 2813 (0000)
3359 (0000)
2491 (0000)
2855 (0000)
2722 (0000)
2223 (0000)
Observations 112 115 115 115 114 114 114 denotes statistically significant at the 1 level denotes statistically significant at the 5 level denotes statistically significant at the 10 level
29
Table 8 Law Political Stability and History as Causes of Corruption System GMM Variables Dependent Variable Corruption Index PCY -0000
(-215) -0000 (-271)
-0000 (-174)
-0000 (-547)
-0000 (-511)
-0000 (-233)
Law -058 (-328)
-053 (-265)
History 014 (055)
329 (198)
022 (081)
164 (188)
Democracy -033 (-276)
-033 (-244)
-029 (-190)
Government -0017 (-041)
-0022 (-054)
-0024 (-075)
-005 (-190)
-005 (-184)
-004 (-172)
Trade 0005 (16)
001 (17)
001 (192)
0004 (129)
0005 (168)
0006 (166)
Economic Freedom
-068 (-243)
-062 (-238)
092 (112)
LawHistory -056 (-181)
-027 (-178)
1994 -120 (-592)
-116 (-594)
-109 (-539)
-154 (-734)
-157 (-688)
-141 (-549)
1999 -083 (-316)
-081 (-346)
-094 (-463)
-154 (-718)
-153 (-769)
-145 (-602)
2004 -042 (-205)
-039 (-211)
-115 (-718)
-115 (-705)
-110 (-525)
2007 -46 (-250)
-40 (-342)
-40 (-331)
-46 (-353)
AR (2) 020 016 041 003 003 020 Over ID 034 037 033 029 027 012 Hansen Dif 040 036 043 093 095 006 Wald 27163
(0000) 30999 (0000)
25568 (0000)
24003 (0000)
17379 (0000)
51706 (0000)
Observations 88 88 88 88 88 88 denotes statistically significant at the 1 level denotes statistically significant at the 5 level denotes statistically significant at the 10 level
30
References
Ades A and Di Tella R (1999) Rents competition and corruption American
Economic Review 89(4) 982-92
Ali M Abdiweli and Hodan Said Isse (2003) Determinants of economic corruption
A cross-country comparison Cato Journal 22(3) 449-466
Becker G S (1968) Crime and punishment An economic approach Journal of
Political Economy 76 169ndash217
Capacent-Gallup (2009) lsquoTHORNjoacuteetharspegillinn spilling aacuteIacuteslandi [Corruption in Iceland
A Survey]rsquo May 7
Costas-Peacuterez Elena Albert Soleacute-Olleacute Pilar Sorribas-Navarro (2011) Corruption
scandals press reporting and accountability Evidence from Spanish mayors
Working Paper University of Barcelona 2011ndash9
De Graaf G Huberts LWJC Nelen JM (2008) Is the glass half full or half
empty Perceptions of the scale and nature of corruption in the Netherlands In
Perspectives on European Politics and Society 9 (1) 84 -94
Del Monte A and Papagni E (2007) The determinants of corruption in Italy
regional panel data analysis European Journal of Political Economy 23 79ndash396
Eurobarometer (2009) Attitudes of Europeans towards corruption Available at
httpeceuropaeupublic_opinionarchivesebsebs_325_enpdf
Herzfeld Thomas and Christoph Weiss (2003) Corruption and legal (In)-
effectiveness an empirical investigation European Journal of Political Economy
19 621-632
International Country Risk Guide (ICRG) (2008) A business guide to political risk
for international decisions (New York The PRS Group)
Knack S amp Keefer P (1995) Institutions and economic performance cross-country
tests using alternative institutional measures Economics and Politics 7 207ndash227
La Porta R Lopez-de-Silanes F Shleifer A amp Vishny R (1999) The quality of
government Journal of Law Economics and Organization 15 222ndash279
Lambsdorff J G amp Teksoz S U (2004) Corrupt relational contracting In J G
Lambsdorff M Schramm ampM Taube (Eds) The new institutional economics of
corruption (pp 138ndash151) New York Rutledge
31
Lambsdorff JG (2006) Causes and consequences of corruption what do we know
from a cross-section of countries In S Rose-Ackerman Editor International
Handbook on the Economics of Corruption Edward Elgar Cheltenham UK
(2006) pp 3ndash51
MacDonald Ronald and M T Majeed (2010) Distributional and poverty
consequences of globalization a dynamic comparative analysis for developing
countries Working Paper University of Glasgow 2010ndash22
Majeed M Tariq and Ronald Macdonald (2010) Corruption and the military in
politics theory and evidence from around the World Working Paper University
of Glasgow 2010ndash34
Majeed M Tariq and Ronald MacDonald (2011) Corruption and financial
intermediation in a panel of regions cross-border effects of corruption Working
Paper University of Glasgow 2011ndash18
McCarthy C (2003) Corruption in public office in Ireland policy design as a
countermeasure In Economic and Social Research Institute Quarterly Economic
Commentary 1ndash15
Paldam Martin (2002) The cross-country pattern of corruption economics culture
and the seesaw dynamics European Journal of Political Economy 18 215-240
Rose-Ackerman S (1999) Corruption and government Cambridge Cambridge
University Press
Serra D (2006) Empirical determinants of corruption a sensitivity analysis Public
Choice 126 225ndash256
Treisman Daniel (2000) The causes of corruption a cross-national study Journal of
Public Economics 76 399-457
32
Appendix
Table 1 Description of Variables Variable Definitions Sources
Per capita real GDP GDP per capita (constant 2000 US$) World Bank database World Bank (2008) Trade Liberalization It is the sum of exports and imports as a share of
real GDP World Bank database World Bank (2008)
Corruption ICRG corruption index rescaled from 0 (absence of corruption) to 6 (highest corruption)
International Country Risk Guide PRS group
Democracy ICRG index 0-6 scale where 6 indicate high degree of democracy
International Country Risk Guide PRS group
Rule of Law ICRG index 0-6 scale where 6 indicate high degree of law and order
International Country Risk Guide PRS group
Bureaucracy Quality
ICRG index 0-4 scale where 4 indicate high degree of law and order
International Country Risk Guide PRS group
Socioeconomic Conditions
ICRG index 0-12 scale where 0 indicates very high risk and 12 indicates very low risk
International Country Risk Guide PRS group
Investment Profiles ICRG index 0-12 scale where 0 indicates very high risk and 12 indicates very low risk
International Country Risk Guide PRS group
Economic Freedom Freedom House data Index rescaled 0 (low economic freedom)-7 (high economic freedom)
Fraser Institute
Inflation Inflation consumer prices (annual ) World Bank database World Bank (2008) Government Spending
General government final consumption expenditure ( of GDP)
World Bank database World Bank (2008)
Newspapers Daily newspapers (per 1000 people) World Bank database World Bank (2008) Internet users Internet Users (per 1000 people) World Bank database World Bank (2008) Mobile Mobile cellular subscriptions (per 100 people) World Bank database World Bank (2008) Telephones Telephone lines (per 100 people) World Bank database World Bank (2008) Protestant Share of Protestants in 1980 Treisman (2000)
33
- 5 Results and Discussion
- 6 Conclusion
- Table 2 Descriptive Statistics
-
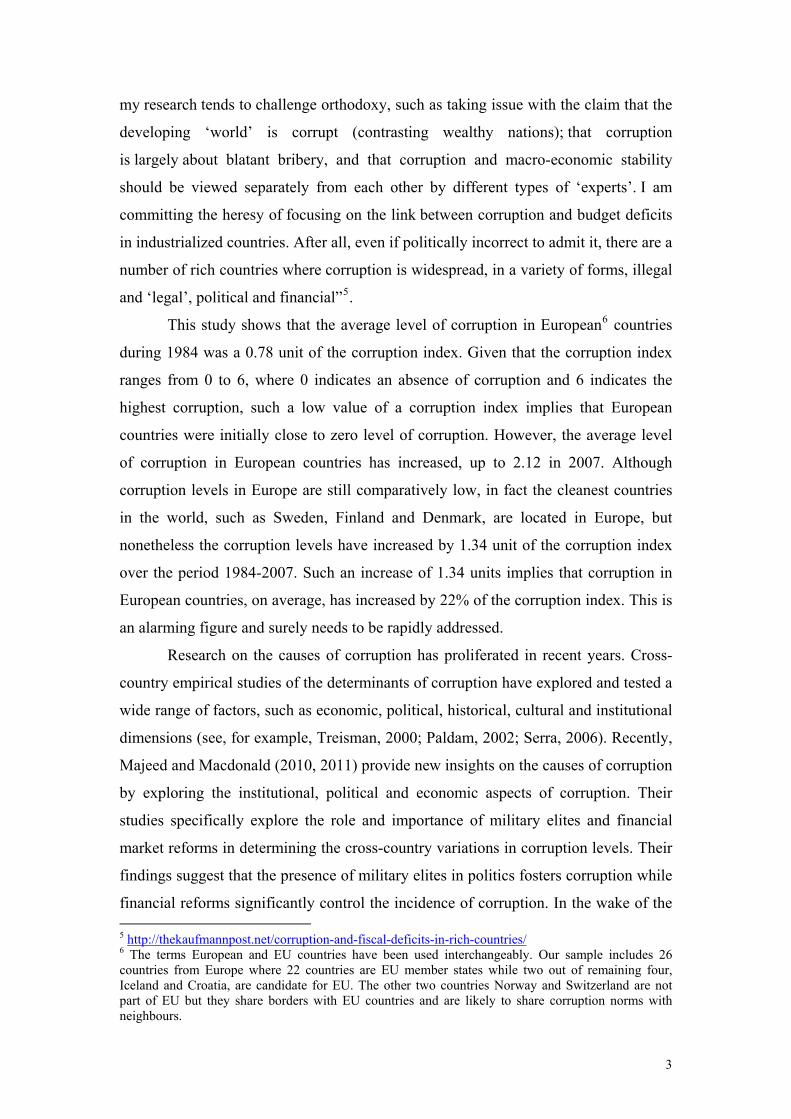

aut
bel
cro
cyp
cze
den
est
fin
fra
ger
gre hun
ice
ire
ita
lat
mat
netnor
por
slo slv
spa
swe
swt
ukr
01
23
4C
orru
ptio
n In
dex
1 2 3 4 5Inflation
Fitted values corr
Corruption and Inflation
aut
bel
cro
cyp
cze
den
est
fin
fra
ger
grehun
ice
ire
ita
lat
mat
netnor
por
sloslv
spa
swe
swt
ukr
01
23
4C
orru
ptio
n In
dex
10 15 20 25 30Government Spending
Fitted values corr
Corruption and Government
aut
bel
cro
cyp
cze
den
est
fin
fra
ger
gre hun
ice
ire
ita
lat
mat
netnor
por
sloslv
spa
swe
swt
ukr
01
23
4C
orru
ptio
n In
dex
4 45 5 55 6Law
Fitted values corr
Corruption and Law
aut
bel
cro
cyp
cze
den
est
fin
fra
ger
grehun
ice
ire
ita
lat
mat
netnor
por
sloslv
spa
swe
swt
ukr
01
23
4C
orru
ptio
n In
dex
5 6 7 8 9Socioeconomic Conditions
Fitted values corr
Corruption and Socioeconomic Conditions
aut
bel
cro
cyp
cze
den
est
fin
fra
ger
gre hun
ice
ire
ita
lat
mat
netnor
por
sloslv
spa
swe
swt
ukr
01
23
4C
orru
ptio
n In
dex
45 5 55 6Democracy
Fitted values corr
Corruption and Political Stability
aut
bel
cro
cyp
cze
den
est
fin
fra
ger
grehun
ice
ire
ita
lat
mat
netnor
por
slo slv
spa
swe
swt
ukr
01
23
4C
orru
ptio
n In
dex
5 55 6 65 7Economic Freedom
Fitted values corr
Corruption and Economic Freedom
Figure 4
22
aut
bel
cro
cyp
cze
den
est
fin
fra
ger
grehun
ice
ire
ita
lat
mat
netnor
por
slo slv
spa
swe
swt
ukr
01
23
4C
orru
ptio
n In
dex
0 10000 20000 30000 40000Per Capita Income (PCY)
Fitted values corr
Corruption and Economic Development
aut
bel
cro
cyp
cze
den
est
fin
fra
ger
gre hun
ice
ire
ita
lat
mat
netnor
por
sloslv
spa
swe
swt
ukr
01
23
4C
orru
ptio
n In
dex
2 25 3 35 4Bureaucracy Quality
Fitted values corr
Corruption and Bureaucracy Quality
aut
bel
cro
cyp
cze
den
est
fin
fra
ger
hun
ice
ire
ita
lat
netnor
por
slo slv
spa
swe
swt
ukr
01
23
4C
orru
ptio
n In
dex
0 200 400 600Daily Newspapers Circulation
Fitted values corr
Corruption and Daily Newspapers Circulation
aut
bel
cro
cyp
cze
den
est
fin
fra
ger
gre hun
ice
ire
ita
lat
mat
netnor
por
sloslv
spa
swe
swt
ukr
01
23
4C
orru
ptio
n In
dex
10 20 30 40Internet
Fitted values corr
Corruption and Internet
aut
bel
cro
cyp
cze
den
est
fin
fra
ger
grehun
ice
ire
ita
lat
mat
netnor
por
slo slv
spa
swe
swt
ukr
01
23
4C
orru
ptio
n In
dex
40 60 80 100 120Mobile Phones
Fitted values corr
Corruption and Mobile Phones
aut
bel
cro
cyp
cze
den
est
fin
fra
ger
grehun
ice
ire
ita
lat
mat
netnor
por
slo slv
spa
swe
swt
ukr
01
23
4C
orru
ptio
n In
dex
20 30 40 50 60 70Telephones
Fitted values corr
Corruption and Telephones
Figure 5
23
Table 1 Ranking of Corruption Levels in European Countries 1984-2007 NO Comparatively Clean Economies NO Comparatively Corrupt Economies Country Corruption Index Country Corruption Index 1 Finland 600 1 Hungary 4162 Denmark 585 2 Spain 4143 Sweden 579 3 Ireland 4124 Iceland 577 4 Greece 4095 Netherlands 574 5 Cyprus 4006 Norway 552 6 Estonia 3607 Switzerland 539 7 Malta 3548 United Kingdom 501 8 Czech Republic 3469 Germany 497 9 Italy 33510 Austria 483 10 Slovenia 33111 Portugal 445 11 Slovakia 32812 France 445 12 Croatia 27813 Belgium 445 13 Latvia 231
Note corruption Index ranges from 0-6 where 0 indicates most corrupt and 6 indicates corruption free Table 2 Descriptive Statistics
Variable Observation Mean Std Dev Min Max Corruption 112 461 105 229 603 PCY 121 17149 9575 3190 41029 Economic Freedom 118 135 064 100 490 Law 112 527 086 200 600 Democracy 112 551 069 300 600 Government Spending 120 1969 401 994 2769 Exports 119 4485 1960 1682 9307 Imports 119 4491 1961 1855 10040 Trade Openness 119 8976 3876 3621 19045 Bureaucracy Quality 112 353 057 198 400 Inflation 117 1389 7743 054 82944
24
Table 3 Corruption and Law in European Countries Panel Estimation Variables Dependent Variable Corruption Index PCY -0000
(-625) -0000 (-233)
-0000 (-241)
-0000 (-178)
-0000 (-516)
-0000 (-240)
-0000 (-16)
Law -062 (-562)
-0581 (-495)
-057 (-422)
-05 (-504)
-032 (-324)
-033 (-328)
Government -0025 (-122)
-0027 (-147)
-0031 (-199)
-0031 (-211)
-003 (-195)
Trade 001 (326)
0002 (114)
0003 (151)
0003 (174)
Bureaucracy Quality
-055 (-402)
-054 (-397)
Economic Freedom
-019 (-231)
1994 011 (077)
01 (069)
012 (087)
1999 058 (303)
055 (313)
058 (324)
2004 103 (546)
102 (614)
103 (614)
2007 132 (736)
121 (731)
124 (731)
R2 026 043 044 050 069 072 072 F Stat 3912
(0000) 4080 (0000)
3640 (0000)
23263 (0000)
4262 (0000)
4184 (0000)
3910 (0000)
Observations 112 112 111 111 111 111 denotes statistically significant at the 1 level denotes statistically significant at the 5 level denotes statistically significant at the 10 level
25
Table 4 Corruption and Law in European Countries Random Effects Variables Dependent Variable Corruption Index PCY -0000
(-167) 0000 (205)
0000 (200)
-0000 (-235)
-0000 (-183)
-0000 (-196)
Law -053 (-524)
-042 (-499)
-042 (-458)
-033 (-392)
-033 (-407)
-031 (-367)
Government -0025 (-149)
-0036 (-147)
-005 (-225)
-005 (-224)
-004 (-192)
Trade 001 (326)
0003 (128)
0005 (195)
0005 (190)
Economic Freedom
-037 (-315)
Inflation -0001 (-010)
1994 006 (041)
011 (085)
015 (109)
1999 044 (282)
048 (319)
047 (290)
2004 093 (579)
095 (612)
096 (586)
2007 120 (658)
126 (706)
129 (692)
With in R 020 024 045 058 062 060 Between R 027 015 025 073 072 074 Overall R 024 023 030 067 067 067 Wald 2752
(0000) 3021 (0000)
6710 (0000)
16060 (0000)
18001 (0000)
17202 (0000)
Observations 112 111 111 111 111 111 denotes statistically significant at the 1 level denotes statistically significant at the 5 level denotes statistically significant at the 10 level
26
Table 5 Corruption and Political Stability (Democracy) in European Countries Panel Estimation Variables Dependent Variable Corruption Index PCY -0000
(-625) -0000 (-450)
-0000 (-396)
-0000 (-312)
-0000 (-606)
-0000 (-326)
-0000 (-29)
Democracy -025 (-181)
-022 (-16)
-029 (-206)
-05 (-497)
-033 (-285)
-030 (-255)
Government -0048 (-213)
-0049 (-240)
-004 (-301)
-0039 (-289)
-004 (-281)
Trade 001 (360)
0002 (110)
0003 (148)
0003 (16)
Bureaucracy Quality
-054 (-355)
-055 (-363)
EF -008 (-089)
1994 -03 (-021)
-0002 (-002)
001 (006)
1999 039 (220)
042 (255)
042 (256)
2004 114 (663)
109 (689)
109 (685)
2007 158 (727)
139 (706)
139 (706)
R2 026 028 031 039 069 071 071 F 3912
(0000) 4080 (0000)
2015 (0000)
2491 (0000)
5080 (0000)
4417 (0000)
4042 (0000)
Observations 112 112 111 111 111 111 111 denotes statistically significant at the 1 level denotes statistically significant at the 5 level denotes statistically significant at the 10 level
27
Table 6 Corruption and Political Stability (Democracy) in European Countries Random Effects Variables Dependent Variable Corruption Index PCY -0000
(-190) -0000 (-102)
-0000 (-018)
-0000 (-443)
-0000 (-398)
-0000 (-419)
Democracy -013 (-062)
-005 (-037)
-013 (-109)
-033 (-371)
-028 (-302)
-028 (-305)
Government -007 (-205)
-0053 (-181)
-005 (-251)
-005 (-250)
-005 (-241)
Trade 001 (545)
0003 (130)
0004 (160)
0003 (148)
Economic Freedom
-017 (-143)
-024 (-183)
-013 (-128)
1994 -03 (-018)
0002 (001)
007 (045)
1999 033 (217)
034 (223)
028 (173)
2004 107 (647)
106 (646)
10004 (594)
2007 147 (797)
147 (801)
143 (748)
With in R 028 006 029 055 056 056 Between R 069 040 030 076 075 077 Overall R 027 024 026 068 067 068 Wald 597
(005) 758 (005)
3740 (0000)
16731 (0000)
16898 (0000)
17092 (0000)
Observations 112 111 111 111 111 111 denotes statistically significant at the 1 level denotes statistically significant at the 5 level denotes statistically significant at the 10 level
28
Table 7 Corruption and History in European Countries Panel Estimation Variables Dependent Variable Corruption Index PCY -0000
(-625) -0000 (-633)
-0000 (-246)
-0000 (-245)
-0000 (-243)
-0000 (-238)
-0000 (-17)
History -011 (-058)
-025 (-140)
-022 (-130)
-002 (-015)
25 (215)
257 (213)
RL -060 (-529)
-058 (-480)
-058 (-481)
-038 (-359)
-037 (-341)
G 002 (-087)
Trade 001 (334)
001 (446)
001 (464)
RLH -047 (-219)
-047 (-216)
EF -016 (-135)
R2 026 030 044 039 049 051 052 F 3912
(0000) 2813 (0000)
3359 (0000)
2491 (0000)
2855 (0000)
2722 (0000)
2223 (0000)
Observations 112 115 115 115 114 114 114 denotes statistically significant at the 1 level denotes statistically significant at the 5 level denotes statistically significant at the 10 level
29
Table 8 Law Political Stability and History as Causes of Corruption System GMM Variables Dependent Variable Corruption Index PCY -0000
(-215) -0000 (-271)
-0000 (-174)
-0000 (-547)
-0000 (-511)
-0000 (-233)
Law -058 (-328)
-053 (-265)
History 014 (055)
329 (198)
022 (081)
164 (188)
Democracy -033 (-276)
-033 (-244)
-029 (-190)
Government -0017 (-041)
-0022 (-054)
-0024 (-075)
-005 (-190)
-005 (-184)
-004 (-172)
Trade 0005 (16)
001 (17)
001 (192)
0004 (129)
0005 (168)
0006 (166)
Economic Freedom
-068 (-243)
-062 (-238)
092 (112)
LawHistory -056 (-181)
-027 (-178)
1994 -120 (-592)
-116 (-594)
-109 (-539)
-154 (-734)
-157 (-688)
-141 (-549)
1999 -083 (-316)
-081 (-346)
-094 (-463)
-154 (-718)
-153 (-769)
-145 (-602)
2004 -042 (-205)
-039 (-211)
-115 (-718)
-115 (-705)
-110 (-525)
2007 -46 (-250)
-40 (-342)
-40 (-331)
-46 (-353)
AR (2) 020 016 041 003 003 020 Over ID 034 037 033 029 027 012 Hansen Dif 040 036 043 093 095 006 Wald 27163
(0000) 30999 (0000)
25568 (0000)
24003 (0000)
17379 (0000)
51706 (0000)
Observations 88 88 88 88 88 88 denotes statistically significant at the 1 level denotes statistically significant at the 5 level denotes statistically significant at the 10 level
30
References
Ades A and Di Tella R (1999) Rents competition and corruption American
Economic Review 89(4) 982-92
Ali M Abdiweli and Hodan Said Isse (2003) Determinants of economic corruption
A cross-country comparison Cato Journal 22(3) 449-466
Becker G S (1968) Crime and punishment An economic approach Journal of
Political Economy 76 169ndash217
Capacent-Gallup (2009) lsquoTHORNjoacuteetharspegillinn spilling aacuteIacuteslandi [Corruption in Iceland
A Survey]rsquo May 7
Costas-Peacuterez Elena Albert Soleacute-Olleacute Pilar Sorribas-Navarro (2011) Corruption
scandals press reporting and accountability Evidence from Spanish mayors
Working Paper University of Barcelona 2011ndash9
De Graaf G Huberts LWJC Nelen JM (2008) Is the glass half full or half
empty Perceptions of the scale and nature of corruption in the Netherlands In
Perspectives on European Politics and Society 9 (1) 84 -94
Del Monte A and Papagni E (2007) The determinants of corruption in Italy
regional panel data analysis European Journal of Political Economy 23 79ndash396
Eurobarometer (2009) Attitudes of Europeans towards corruption Available at
httpeceuropaeupublic_opinionarchivesebsebs_325_enpdf
Herzfeld Thomas and Christoph Weiss (2003) Corruption and legal (In)-
effectiveness an empirical investigation European Journal of Political Economy
19 621-632
International Country Risk Guide (ICRG) (2008) A business guide to political risk
for international decisions (New York The PRS Group)
Knack S amp Keefer P (1995) Institutions and economic performance cross-country
tests using alternative institutional measures Economics and Politics 7 207ndash227
La Porta R Lopez-de-Silanes F Shleifer A amp Vishny R (1999) The quality of
government Journal of Law Economics and Organization 15 222ndash279
Lambsdorff J G amp Teksoz S U (2004) Corrupt relational contracting In J G
Lambsdorff M Schramm ampM Taube (Eds) The new institutional economics of
corruption (pp 138ndash151) New York Rutledge
31
Lambsdorff JG (2006) Causes and consequences of corruption what do we know
from a cross-section of countries In S Rose-Ackerman Editor International
Handbook on the Economics of Corruption Edward Elgar Cheltenham UK
(2006) pp 3ndash51
MacDonald Ronald and M T Majeed (2010) Distributional and poverty
consequences of globalization a dynamic comparative analysis for developing
countries Working Paper University of Glasgow 2010ndash22
Majeed M Tariq and Ronald Macdonald (2010) Corruption and the military in
politics theory and evidence from around the World Working Paper University
of Glasgow 2010ndash34
Majeed M Tariq and Ronald MacDonald (2011) Corruption and financial
intermediation in a panel of regions cross-border effects of corruption Working
Paper University of Glasgow 2011ndash18
McCarthy C (2003) Corruption in public office in Ireland policy design as a
countermeasure In Economic and Social Research Institute Quarterly Economic
Commentary 1ndash15
Paldam Martin (2002) The cross-country pattern of corruption economics culture
and the seesaw dynamics European Journal of Political Economy 18 215-240
Rose-Ackerman S (1999) Corruption and government Cambridge Cambridge
University Press
Serra D (2006) Empirical determinants of corruption a sensitivity analysis Public
Choice 126 225ndash256
Treisman Daniel (2000) The causes of corruption a cross-national study Journal of
Public Economics 76 399-457
32
Appendix
Table 1 Description of Variables Variable Definitions Sources
Per capita real GDP GDP per capita (constant 2000 US$) World Bank database World Bank (2008) Trade Liberalization It is the sum of exports and imports as a share of
real GDP World Bank database World Bank (2008)
Corruption ICRG corruption index rescaled from 0 (absence of corruption) to 6 (highest corruption)
International Country Risk Guide PRS group
Democracy ICRG index 0-6 scale where 6 indicate high degree of democracy
International Country Risk Guide PRS group
Rule of Law ICRG index 0-6 scale where 6 indicate high degree of law and order
International Country Risk Guide PRS group
Bureaucracy Quality
ICRG index 0-4 scale where 4 indicate high degree of law and order
International Country Risk Guide PRS group
Socioeconomic Conditions
ICRG index 0-12 scale where 0 indicates very high risk and 12 indicates very low risk
International Country Risk Guide PRS group
Investment Profiles ICRG index 0-12 scale where 0 indicates very high risk and 12 indicates very low risk
International Country Risk Guide PRS group
Economic Freedom Freedom House data Index rescaled 0 (low economic freedom)-7 (high economic freedom)
Fraser Institute
Inflation Inflation consumer prices (annual ) World Bank database World Bank (2008) Government Spending
General government final consumption expenditure ( of GDP)
World Bank database World Bank (2008)
Newspapers Daily newspapers (per 1000 people) World Bank database World Bank (2008) Internet users Internet Users (per 1000 people) World Bank database World Bank (2008) Mobile Mobile cellular subscriptions (per 100 people) World Bank database World Bank (2008) Telephones Telephone lines (per 100 people) World Bank database World Bank (2008) Protestant Share of Protestants in 1980 Treisman (2000)
33
- 5 Results and Discussion
- 6 Conclusion
- Table 2 Descriptive Statistics
-
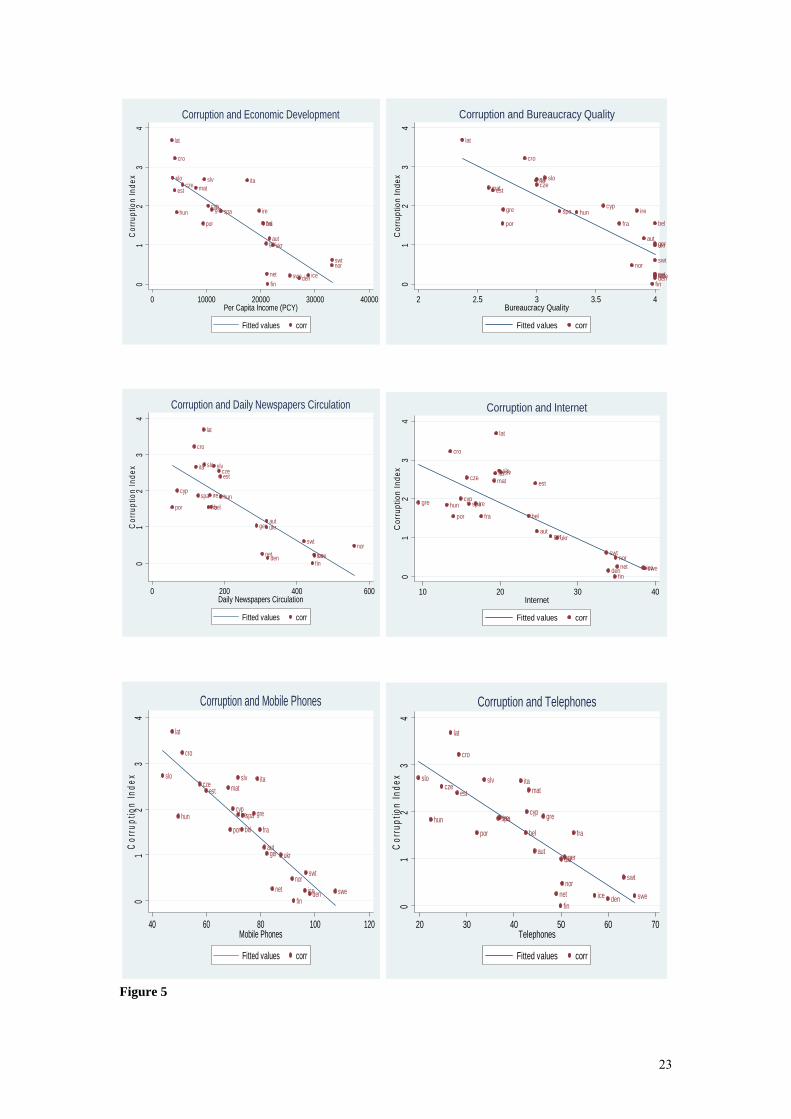
aut
bel
cro
cyp
cze
den
est
fin
fra
ger
grehun
ice
ire
ita
lat
mat
netnor
por
slo slv
spa
swe
swt
ukr
01
23
4C
orru
ptio
n In
dex
0 10000 20000 30000 40000Per Capita Income (PCY)
Fitted values corr
Corruption and Economic Development
aut
bel
cro
cyp
cze
den
est
fin
fra
ger
gre hun
ice
ire
ita
lat
mat
netnor
por
sloslv
spa
swe
swt
ukr
01
23
4C
orru
ptio
n In
dex
2 25 3 35 4Bureaucracy Quality
Fitted values corr
Corruption and Bureaucracy Quality
aut
bel
cro
cyp
cze
den
est
fin
fra
ger
hun
ice
ire
ita
lat
netnor
por
slo slv
spa
swe
swt
ukr
01
23
4C
orru
ptio
n In
dex
0 200 400 600Daily Newspapers Circulation
Fitted values corr
Corruption and Daily Newspapers Circulation
aut
bel
cro
cyp
cze
den
est
fin
fra
ger
gre hun
ice
ire
ita
lat
mat
netnor
por
sloslv
spa
swe
swt
ukr
01
23
4C
orru
ptio
n In
dex
10 20 30 40Internet
Fitted values corr
Corruption and Internet
aut
bel
cro
cyp
cze
den
est
fin
fra
ger
grehun
ice
ire
ita
lat
mat
netnor
por
slo slv
spa
swe
swt
ukr
01
23
4C
orru
ptio
n In
dex
40 60 80 100 120Mobile Phones
Fitted values corr
Corruption and Mobile Phones
aut
bel
cro
cyp
cze
den
est
fin
fra
ger
grehun
ice
ire
ita
lat
mat
netnor
por
slo slv
spa
swe
swt
ukr
01
23
4C
orru
ptio
n In
dex
20 30 40 50 60 70Telephones
Fitted values corr
Corruption and Telephones
Figure 5
23
Table 1 Ranking of Corruption Levels in European Countries 1984-2007 NO Comparatively Clean Economies NO Comparatively Corrupt Economies Country Corruption Index Country Corruption Index 1 Finland 600 1 Hungary 4162 Denmark 585 2 Spain 4143 Sweden 579 3 Ireland 4124 Iceland 577 4 Greece 4095 Netherlands 574 5 Cyprus 4006 Norway 552 6 Estonia 3607 Switzerland 539 7 Malta 3548 United Kingdom 501 8 Czech Republic 3469 Germany 497 9 Italy 33510 Austria 483 10 Slovenia 33111 Portugal 445 11 Slovakia 32812 France 445 12 Croatia 27813 Belgium 445 13 Latvia 231
Note corruption Index ranges from 0-6 where 0 indicates most corrupt and 6 indicates corruption free Table 2 Descriptive Statistics
Variable Observation Mean Std Dev Min Max Corruption 112 461 105 229 603 PCY 121 17149 9575 3190 41029 Economic Freedom 118 135 064 100 490 Law 112 527 086 200 600 Democracy 112 551 069 300 600 Government Spending 120 1969 401 994 2769 Exports 119 4485 1960 1682 9307 Imports 119 4491 1961 1855 10040 Trade Openness 119 8976 3876 3621 19045 Bureaucracy Quality 112 353 057 198 400 Inflation 117 1389 7743 054 82944
24
Table 3 Corruption and Law in European Countries Panel Estimation Variables Dependent Variable Corruption Index PCY -0000
(-625) -0000 (-233)
-0000 (-241)
-0000 (-178)
-0000 (-516)
-0000 (-240)
-0000 (-16)
Law -062 (-562)
-0581 (-495)
-057 (-422)
-05 (-504)
-032 (-324)
-033 (-328)
Government -0025 (-122)
-0027 (-147)
-0031 (-199)
-0031 (-211)
-003 (-195)
Trade 001 (326)
0002 (114)
0003 (151)
0003 (174)
Bureaucracy Quality
-055 (-402)
-054 (-397)
Economic Freedom
-019 (-231)
1994 011 (077)
01 (069)
012 (087)
1999 058 (303)
055 (313)
058 (324)
2004 103 (546)
102 (614)
103 (614)
2007 132 (736)
121 (731)
124 (731)
R2 026 043 044 050 069 072 072 F Stat 3912
(0000) 4080 (0000)
3640 (0000)
23263 (0000)
4262 (0000)
4184 (0000)
3910 (0000)
Observations 112 112 111 111 111 111 denotes statistically significant at the 1 level denotes statistically significant at the 5 level denotes statistically significant at the 10 level
25
Table 4 Corruption and Law in European Countries Random Effects Variables Dependent Variable Corruption Index PCY -0000
(-167) 0000 (205)
0000 (200)
-0000 (-235)
-0000 (-183)
-0000 (-196)
Law -053 (-524)
-042 (-499)
-042 (-458)
-033 (-392)
-033 (-407)
-031 (-367)
Government -0025 (-149)
-0036 (-147)
-005 (-225)
-005 (-224)
-004 (-192)
Trade 001 (326)
0003 (128)
0005 (195)
0005 (190)
Economic Freedom
-037 (-315)
Inflation -0001 (-010)
1994 006 (041)
011 (085)
015 (109)
1999 044 (282)
048 (319)
047 (290)
2004 093 (579)
095 (612)
096 (586)
2007 120 (658)
126 (706)
129 (692)
With in R 020 024 045 058 062 060 Between R 027 015 025 073 072 074 Overall R 024 023 030 067 067 067 Wald 2752
(0000) 3021 (0000)
6710 (0000)
16060 (0000)
18001 (0000)
17202 (0000)
Observations 112 111 111 111 111 111 denotes statistically significant at the 1 level denotes statistically significant at the 5 level denotes statistically significant at the 10 level
26
Table 5 Corruption and Political Stability (Democracy) in European Countries Panel Estimation Variables Dependent Variable Corruption Index PCY -0000
(-625) -0000 (-450)
-0000 (-396)
-0000 (-312)
-0000 (-606)
-0000 (-326)
-0000 (-29)
Democracy -025 (-181)
-022 (-16)
-029 (-206)
-05 (-497)
-033 (-285)
-030 (-255)
Government -0048 (-213)
-0049 (-240)
-004 (-301)
-0039 (-289)
-004 (-281)
Trade 001 (360)
0002 (110)
0003 (148)
0003 (16)
Bureaucracy Quality
-054 (-355)
-055 (-363)
EF -008 (-089)
1994 -03 (-021)
-0002 (-002)
001 (006)
1999 039 (220)
042 (255)
042 (256)
2004 114 (663)
109 (689)
109 (685)
2007 158 (727)
139 (706)
139 (706)
R2 026 028 031 039 069 071 071 F 3912
(0000) 4080 (0000)
2015 (0000)
2491 (0000)
5080 (0000)
4417 (0000)
4042 (0000)
Observations 112 112 111 111 111 111 111 denotes statistically significant at the 1 level denotes statistically significant at the 5 level denotes statistically significant at the 10 level
27
Table 6 Corruption and Political Stability (Democracy) in European Countries Random Effects Variables Dependent Variable Corruption Index PCY -0000
(-190) -0000 (-102)
-0000 (-018)
-0000 (-443)
-0000 (-398)
-0000 (-419)
Democracy -013 (-062)
-005 (-037)
-013 (-109)
-033 (-371)
-028 (-302)
-028 (-305)
Government -007 (-205)
-0053 (-181)
-005 (-251)
-005 (-250)
-005 (-241)
Trade 001 (545)
0003 (130)
0004 (160)
0003 (148)
Economic Freedom
-017 (-143)
-024 (-183)
-013 (-128)
1994 -03 (-018)
0002 (001)
007 (045)
1999 033 (217)
034 (223)
028 (173)
2004 107 (647)
106 (646)
10004 (594)
2007 147 (797)
147 (801)
143 (748)
With in R 028 006 029 055 056 056 Between R 069 040 030 076 075 077 Overall R 027 024 026 068 067 068 Wald 597
(005) 758 (005)
3740 (0000)
16731 (0000)
16898 (0000)
17092 (0000)
Observations 112 111 111 111 111 111 denotes statistically significant at the 1 level denotes statistically significant at the 5 level denotes statistically significant at the 10 level
28
Table 7 Corruption and History in European Countries Panel Estimation Variables Dependent Variable Corruption Index PCY -0000
(-625) -0000 (-633)
-0000 (-246)
-0000 (-245)
-0000 (-243)
-0000 (-238)
-0000 (-17)
History -011 (-058)
-025 (-140)
-022 (-130)
-002 (-015)
25 (215)
257 (213)
RL -060 (-529)
-058 (-480)
-058 (-481)
-038 (-359)
-037 (-341)
G 002 (-087)
Trade 001 (334)
001 (446)
001 (464)
RLH -047 (-219)
-047 (-216)
EF -016 (-135)
R2 026 030 044 039 049 051 052 F 3912
(0000) 2813 (0000)
3359 (0000)
2491 (0000)
2855 (0000)
2722 (0000)
2223 (0000)
Observations 112 115 115 115 114 114 114 denotes statistically significant at the 1 level denotes statistically significant at the 5 level denotes statistically significant at the 10 level
29
Table 8 Law Political Stability and History as Causes of Corruption System GMM Variables Dependent Variable Corruption Index PCY -0000
(-215) -0000 (-271)
-0000 (-174)
-0000 (-547)
-0000 (-511)
-0000 (-233)
Law -058 (-328)
-053 (-265)
History 014 (055)
329 (198)
022 (081)
164 (188)
Democracy -033 (-276)
-033 (-244)
-029 (-190)
Government -0017 (-041)
-0022 (-054)
-0024 (-075)
-005 (-190)
-005 (-184)
-004 (-172)
Trade 0005 (16)
001 (17)
001 (192)
0004 (129)
0005 (168)
0006 (166)
Economic Freedom
-068 (-243)
-062 (-238)
092 (112)
LawHistory -056 (-181)
-027 (-178)
1994 -120 (-592)
-116 (-594)
-109 (-539)
-154 (-734)
-157 (-688)
-141 (-549)
1999 -083 (-316)
-081 (-346)
-094 (-463)
-154 (-718)
-153 (-769)
-145 (-602)
2004 -042 (-205)
-039 (-211)
-115 (-718)
-115 (-705)
-110 (-525)
2007 -46 (-250)
-40 (-342)
-40 (-331)
-46 (-353)
AR (2) 020 016 041 003 003 020 Over ID 034 037 033 029 027 012 Hansen Dif 040 036 043 093 095 006 Wald 27163
(0000) 30999 (0000)
25568 (0000)
24003 (0000)
17379 (0000)
51706 (0000)
Observations 88 88 88 88 88 88 denotes statistically significant at the 1 level denotes statistically significant at the 5 level denotes statistically significant at the 10 level
30
References
Ades A and Di Tella R (1999) Rents competition and corruption American
Economic Review 89(4) 982-92
Ali M Abdiweli and Hodan Said Isse (2003) Determinants of economic corruption
A cross-country comparison Cato Journal 22(3) 449-466
Becker G S (1968) Crime and punishment An economic approach Journal of
Political Economy 76 169ndash217
Capacent-Gallup (2009) lsquoTHORNjoacuteetharspegillinn spilling aacuteIacuteslandi [Corruption in Iceland
A Survey]rsquo May 7
Costas-Peacuterez Elena Albert Soleacute-Olleacute Pilar Sorribas-Navarro (2011) Corruption
scandals press reporting and accountability Evidence from Spanish mayors
Working Paper University of Barcelona 2011ndash9
De Graaf G Huberts LWJC Nelen JM (2008) Is the glass half full or half
empty Perceptions of the scale and nature of corruption in the Netherlands In
Perspectives on European Politics and Society 9 (1) 84 -94
Del Monte A and Papagni E (2007) The determinants of corruption in Italy
regional panel data analysis European Journal of Political Economy 23 79ndash396
Eurobarometer (2009) Attitudes of Europeans towards corruption Available at
httpeceuropaeupublic_opinionarchivesebsebs_325_enpdf
Herzfeld Thomas and Christoph Weiss (2003) Corruption and legal (In)-
effectiveness an empirical investigation European Journal of Political Economy
19 621-632
International Country Risk Guide (ICRG) (2008) A business guide to political risk
for international decisions (New York The PRS Group)
Knack S amp Keefer P (1995) Institutions and economic performance cross-country
tests using alternative institutional measures Economics and Politics 7 207ndash227
La Porta R Lopez-de-Silanes F Shleifer A amp Vishny R (1999) The quality of
government Journal of Law Economics and Organization 15 222ndash279
Lambsdorff J G amp Teksoz S U (2004) Corrupt relational contracting In J G
Lambsdorff M Schramm ampM Taube (Eds) The new institutional economics of
corruption (pp 138ndash151) New York Rutledge
31
Lambsdorff JG (2006) Causes and consequences of corruption what do we know
from a cross-section of countries In S Rose-Ackerman Editor International
Handbook on the Economics of Corruption Edward Elgar Cheltenham UK
(2006) pp 3ndash51
MacDonald Ronald and M T Majeed (2010) Distributional and poverty
consequences of globalization a dynamic comparative analysis for developing
countries Working Paper University of Glasgow 2010ndash22
Majeed M Tariq and Ronald Macdonald (2010) Corruption and the military in
politics theory and evidence from around the World Working Paper University
of Glasgow 2010ndash34
Majeed M Tariq and Ronald MacDonald (2011) Corruption and financial
intermediation in a panel of regions cross-border effects of corruption Working
Paper University of Glasgow 2011ndash18
McCarthy C (2003) Corruption in public office in Ireland policy design as a
countermeasure In Economic and Social Research Institute Quarterly Economic
Commentary 1ndash15
Paldam Martin (2002) The cross-country pattern of corruption economics culture
and the seesaw dynamics European Journal of Political Economy 18 215-240
Rose-Ackerman S (1999) Corruption and government Cambridge Cambridge
University Press
Serra D (2006) Empirical determinants of corruption a sensitivity analysis Public
Choice 126 225ndash256
Treisman Daniel (2000) The causes of corruption a cross-national study Journal of
Public Economics 76 399-457
32
Appendix
Table 1 Description of Variables Variable Definitions Sources
Per capita real GDP GDP per capita (constant 2000 US$) World Bank database World Bank (2008) Trade Liberalization It is the sum of exports and imports as a share of
real GDP World Bank database World Bank (2008)
Corruption ICRG corruption index rescaled from 0 (absence of corruption) to 6 (highest corruption)
International Country Risk Guide PRS group
Democracy ICRG index 0-6 scale where 6 indicate high degree of democracy
International Country Risk Guide PRS group
Rule of Law ICRG index 0-6 scale where 6 indicate high degree of law and order
International Country Risk Guide PRS group
Bureaucracy Quality
ICRG index 0-4 scale where 4 indicate high degree of law and order
International Country Risk Guide PRS group
Socioeconomic Conditions
ICRG index 0-12 scale where 0 indicates very high risk and 12 indicates very low risk
International Country Risk Guide PRS group
Investment Profiles ICRG index 0-12 scale where 0 indicates very high risk and 12 indicates very low risk
International Country Risk Guide PRS group
Economic Freedom Freedom House data Index rescaled 0 (low economic freedom)-7 (high economic freedom)
Fraser Institute
Inflation Inflation consumer prices (annual ) World Bank database World Bank (2008) Government Spending
General government final consumption expenditure ( of GDP)
World Bank database World Bank (2008)
Newspapers Daily newspapers (per 1000 people) World Bank database World Bank (2008) Internet users Internet Users (per 1000 people) World Bank database World Bank (2008) Mobile Mobile cellular subscriptions (per 100 people) World Bank database World Bank (2008) Telephones Telephone lines (per 100 people) World Bank database World Bank (2008) Protestant Share of Protestants in 1980 Treisman (2000)
33
- 5 Results and Discussion
- 6 Conclusion
- Table 2 Descriptive Statistics
-