ccc interrogatory #42
TRANSCRIPT
Filed: 2021-04-19 EB-2020-0290
Exhibit L E2-01-CCC-042
Page 1 of 1
Witness Panel: Nuclear Operations & Nuclear Projects
CCC Interrogatory #42 1 2 Interrogatory 3 4 Reference: Exhibit E2/T1/S1/ p. 1 5 6 OPG is seeking approval of a nuclear production forecast of 33.2 terawatt-hours 7 (“TWh”) for 2022, 30.8 TWh for 2023, 33.3 TWh for 2024, 30.2 TWh for 2025, and 8 21.5 TWh for 2026. This amounts to a total 149.1 TWh nuclear production forecast 9 for the IR term. 10 11
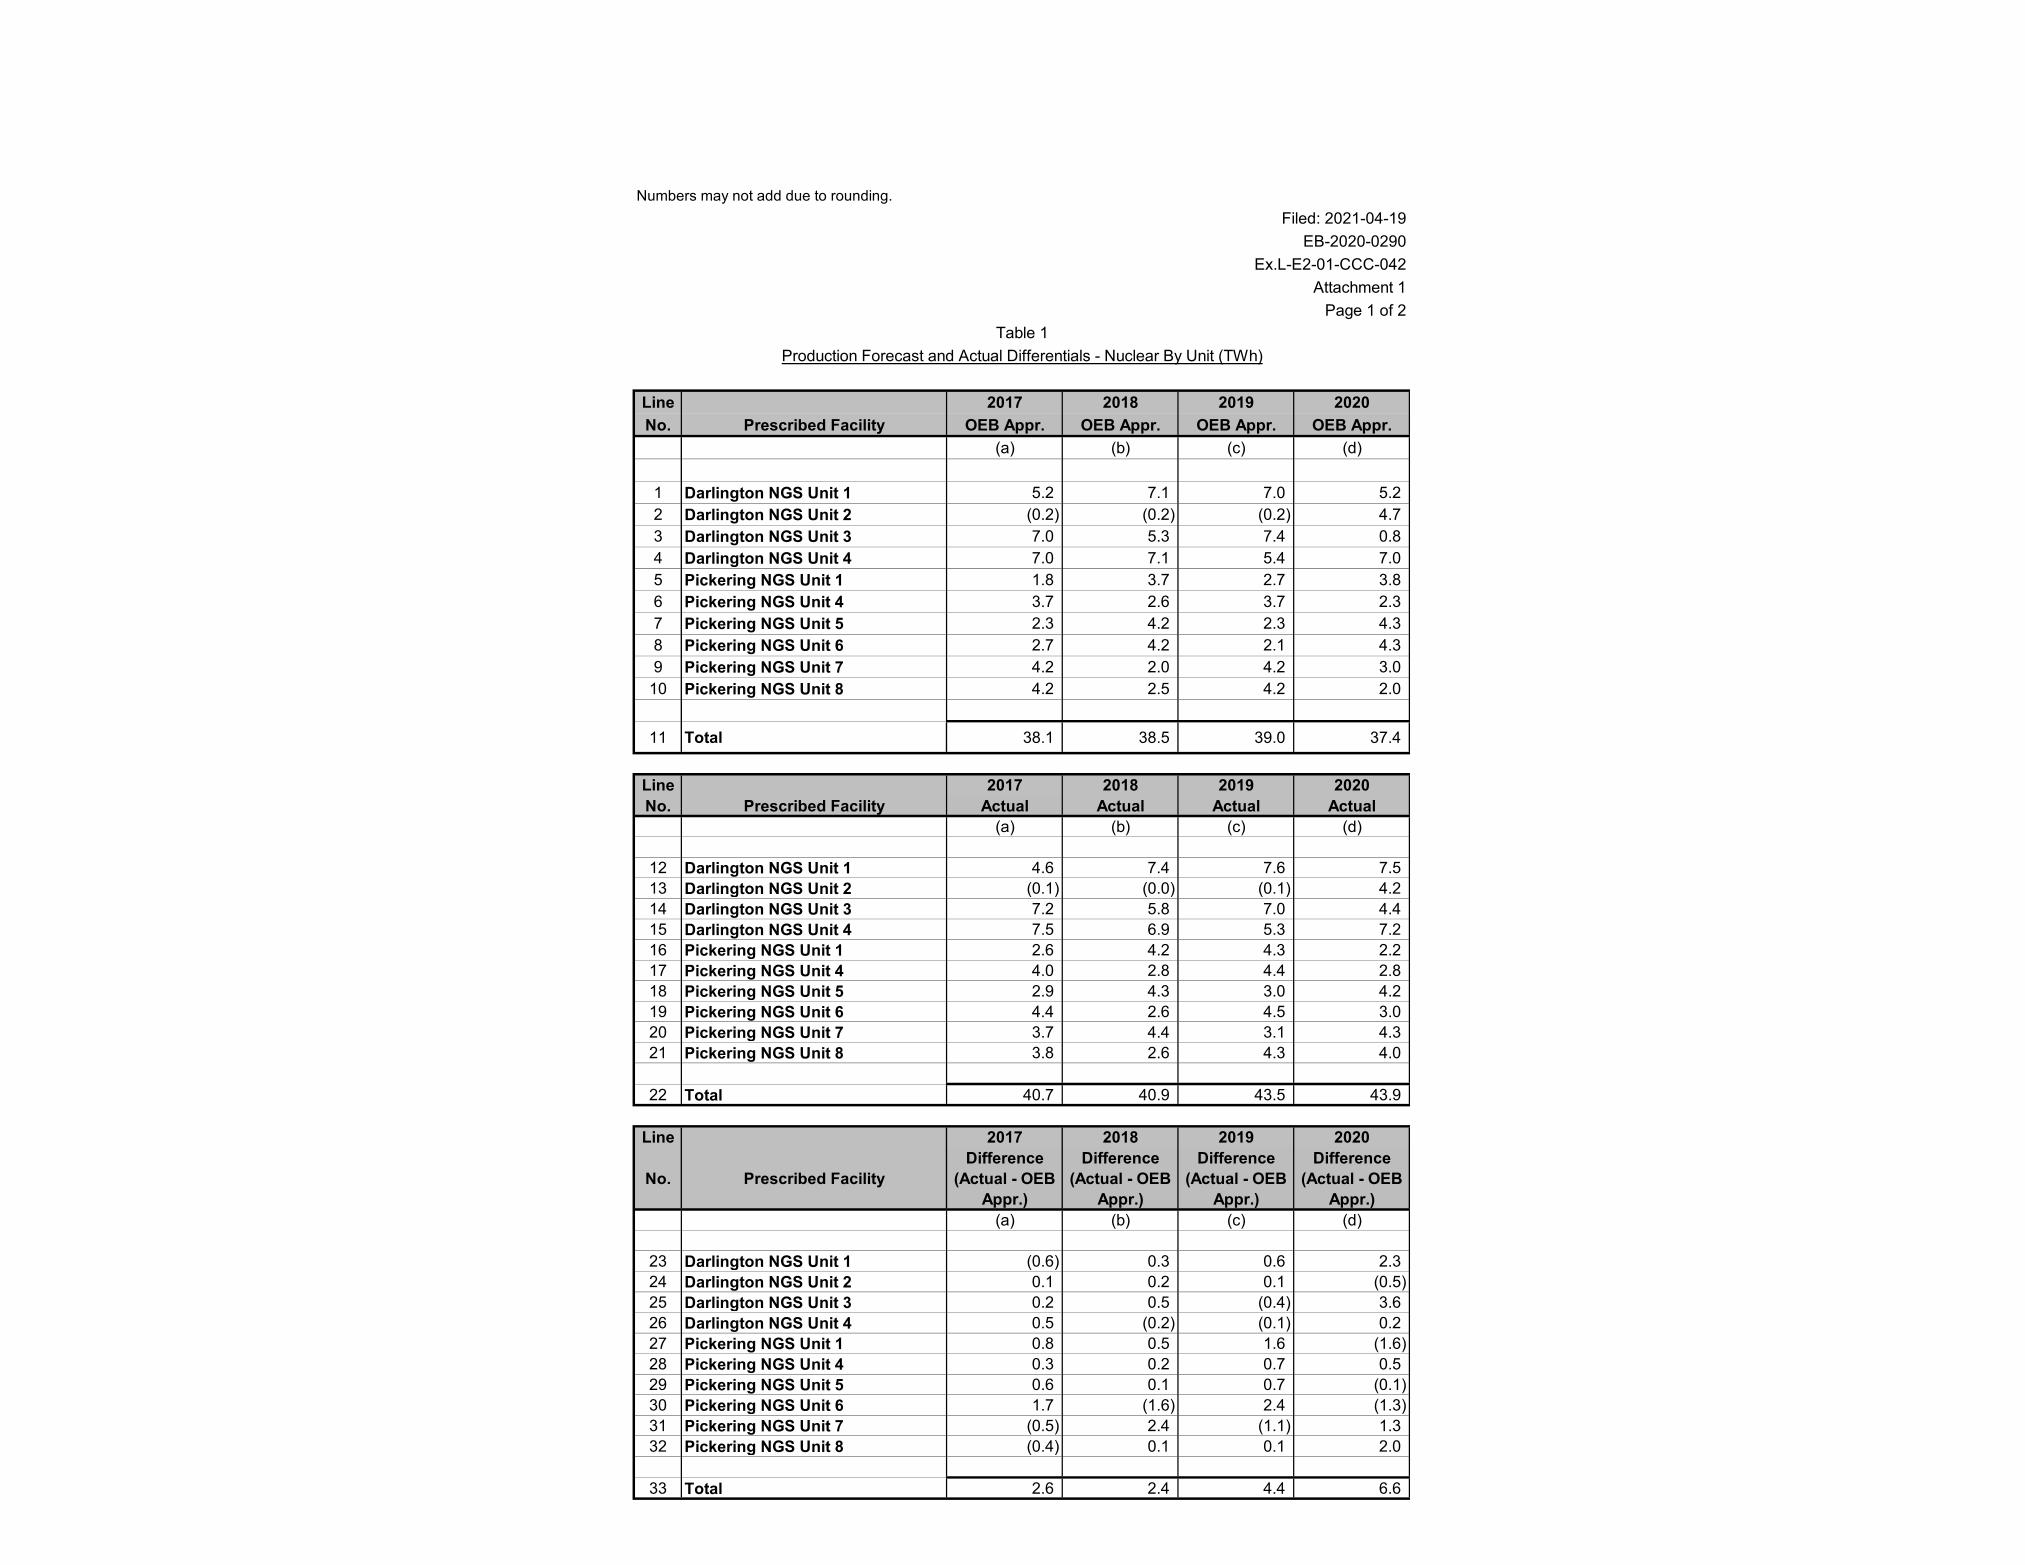
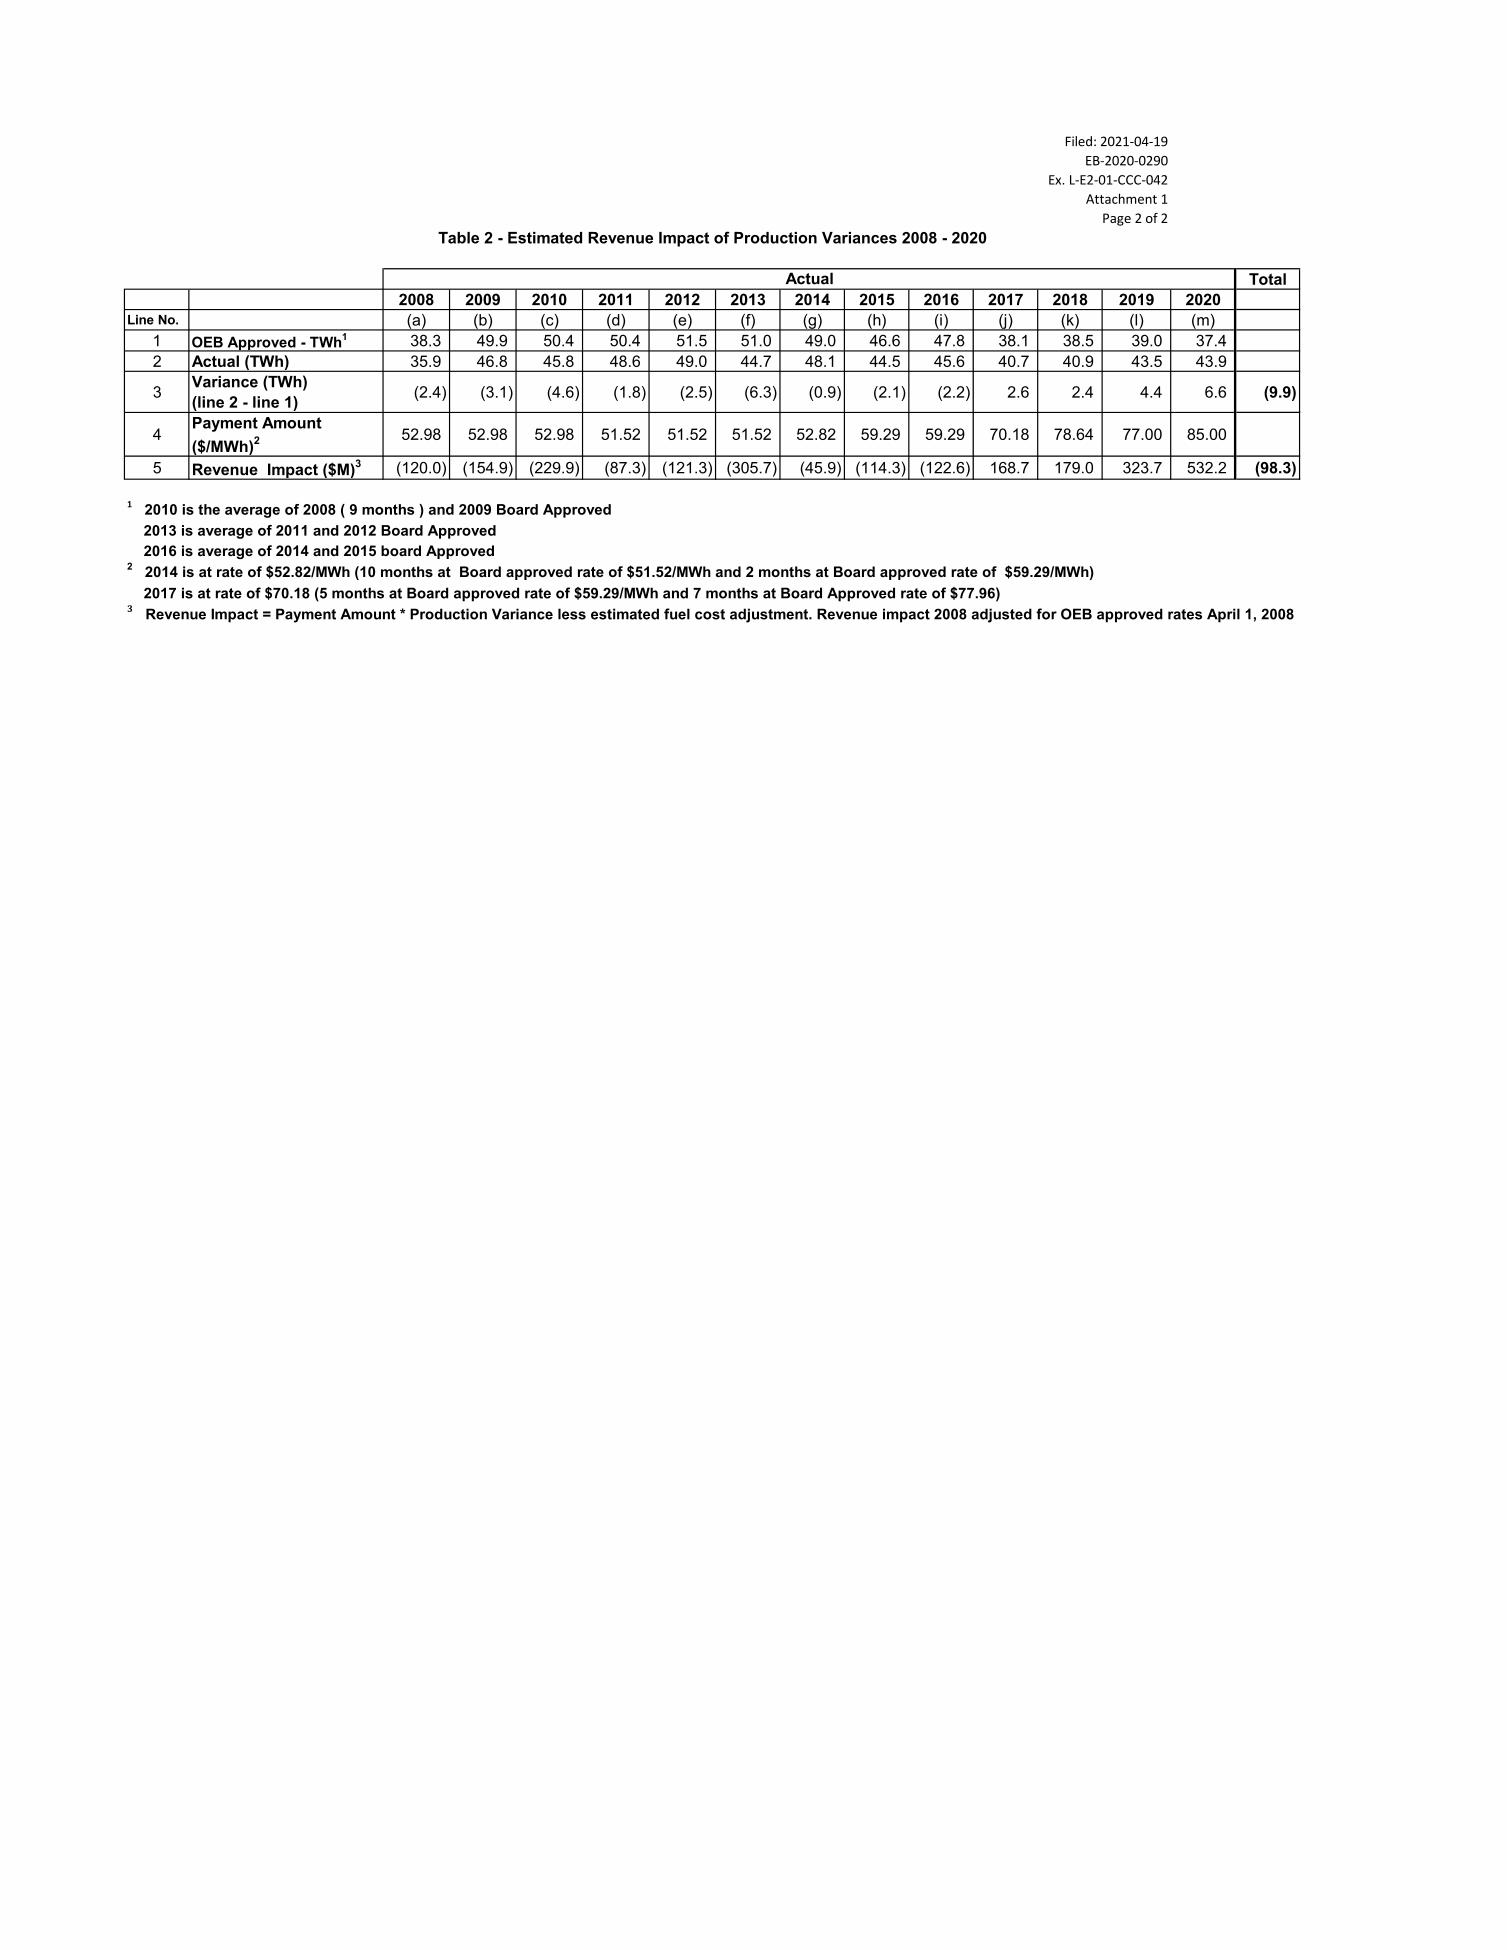
a) Please provide, in table form, the OEB approved production forecast and the 12 actual production for each year from 2017 to 2020, including both the total 13 production forecasts and actuals and the production forecast and actual for 14 each unit, as well as the annual revenue impact of the differential between the 15 OEB approved and actual forecasts. 16
17 18 Response 19 20 For OEB approved production forecasts and actual production differentials by unit for 21 2017-2020, see Attachment 1, Table 1. 22 23 The annual revenue impact of the differential between the OEB approved production 24 forecast and actual production for the period 2008 to 2021 see Attachment 1, Table 2. 25
Numbers may not add due to rounding.Filed: 2021-04-19
EB-2020-0290Ex.L-E2-01-CCC-042
Attachment 1Page 1 of 2
Line 2017 2018 2019 2020No. Prescribed Facility OEB Appr. OEB Appr. OEB Appr. OEB Appr.
(a) (b) (c) (d)
1 Darlington NGS Unit 1 5.2 7.1 7.0 5.22 Darlington NGS Unit 2 (0.2) (0.2) (0.2) 4.73 Darlington NGS Unit 3 7.0 5.3 7.4 0.84 Darlington NGS Unit 4 7.0 7.1 5.4 7.05 Pickering NGS Unit 1 1.8 3.7 2.7 3.86 Pickering NGS Unit 4 3.7 2.6 3.7 2.37 Pickering NGS Unit 5 2.3 4.2 2.3 4.38 Pickering NGS Unit 6 2.7 4.2 2.1 4.39 Pickering NGS Unit 7 4.2 2.0 4.2 3.0
10 Pickering NGS Unit 8 4.2 2.5 4.2 2.0
11 Total 38.1 38.5 39.0 37.4
Line 2017 2018 2019 2020No. Prescribed Facility Actual Actual Actual Actual
(a) (b) (c) (d)
12 Darlington NGS Unit 1 4.6 7.4 7.6 7.513 Darlington NGS Unit 2 (0.1) (0.0) (0.1) 4.214 Darlington NGS Unit 3 7.2 5.8 7.0 4.415 Darlington NGS Unit 4 7.5 6.9 5.3 7.216 Pickering NGS Unit 1 2.6 4.2 4.3 2.217 Pickering NGS Unit 4 4.0 2.8 4.4 2.818 Pickering NGS Unit 5 2.9 4.3 3.0 4.219 Pickering NGS Unit 6 4.4 2.6 4.5 3.020 Pickering NGS Unit 7 3.7 4.4 3.1 4.321 Pickering NGS Unit 8 3.8 2.6 4.3 4.0
22 Total 40.7 40.9 43.5 43.9
Line 2017 2018 2019 2020
No. Prescribed FacilityDifference
(Actual - OEB Appr.)
Difference(Actual - OEB
Appr.)
Difference(Actual - OEB
Appr.)
Difference(Actual - OEB
Appr.)(a) (b) (c) (d)
23 Darlington NGS Unit 1 (0.6) 0.3 0.6 2.324 Darlington NGS Unit 2 0.1 0.2 0.1 (0.5)25 Darlington NGS Unit 3 0.2 0.5 (0.4) 3.626 Darlington NGS Unit 4 0.5 (0.2) (0.1) 0.227 Pickering NGS Unit 1 0.8 0.5 1.6 (1.6)28 Pickering NGS Unit 4 0.3 0.2 0.7 0.529 Pickering NGS Unit 5 0.6 0.1 0.7 (0.1)30 Pickering NGS Unit 6 1.7 (1.6) 2.4 (1.3)31 Pickering NGS Unit 7 (0.5) 2.4 (1.1) 1.332 Pickering NGS Unit 8 (0.4) 0.1 0.1 2.0
33 Total 2.6 2.4 4.4 6.6
Table 1Production Forecast and Actual Differentials - Nuclear By Unit (TWh)
Filed: 2021-04-19EB-2020-0290
Ex. L-E2-01-CCC-042Attachment 1
Page 2 of 2
Total2008 2009 2010 2011 2012 2013 2014 2015 2016 2017 2018 2019 2020
Line No. (a) (b) (c) (d) (e) (f) (g) (h) (i) (j) (k) (l) (m)1 OEB Approved - TWh1 38.3 49.9 50.4 50.4 51.5 51.0 49.0 46.6 47.8 38.1 38.5 39.0 37.42 Actual (TWh) 35.9 46.8 45.8 48.6 49.0 44.7 48.1 44.5 45.6 40.7 40.9 43.5 43.9
3 Variance (TWh)(line 2 - line 1) (2.4) (3.1) (4.6) (1.8) (2.5) (6.3) (0.9) (2.1) (2.2) 2.6 2.4 4.4 6.6 (9.9)
4Payment Amount ($/MWh)2 52.98 52.98 52.98 51.52 51.52 51.52 52.82 59.29 59.29 70.18 78.64 77.00 85.00
5 Revenue Impact ($M)3 (120.0) (154.9) (229.9) (87.3) (121.3) (305.7) (45.9) (114.3) (122.6) 168.7 179.0 323.7 532.2 (98.3)
1 2010 is the average of 2008 ( 9 months ) and 2009 Board Approved 2013 is average of 2011 and 2012 Board Approved 2016 is average of 2014 and 2015 board Approved 2 2014 is at rate of $52.82/MWh (10 months at Board approved rate of $51.52/MWh and 2 months at Board approved rate of $59.29/MWh) 2017 is at rate of $70.18 (5 months at Board approved rate of $59.29/MWh and 7 months at Board Approved rate of $77.96)3 Revenue Impact = Payment Amount * Production Variance less estimated fuel cost adjustment. Revenue impact 2008 adjusted for OEB approved rates April 1, 2008
Actual
Table 2 - Estimated Revenue Impact of Production Variances 2008 - 2020
Filed: 2021-04-19 EB-2020-0290
Exhibit L E2-01-CCC-043
Page 1 of 1
Witness Panel: Nuclear Operations & Nuclear Projects
CCC Interrogatory #43 1 2 Interrogatory 3 4 Reference: Exhibit E2/T1/S1/ p. 4 5 6 Chart 2: Planned Outage Durations. 7 8 a) Please provide the OEB approved planned outage days, the actual planned 9
outages, and the unbudgeted planned outages both in total and for each unit from 10 2008 to 2026 (recognizing that 2021-2026 will include only forecast numbers), 11 including FEPO days. Please include the revenue impact of the variance in outage 12 days between OEB approved and actuals. 13
14 15 Response 16
17 a) See Attachment 1. 18

Numbers may not add due to rounding
Operating Unit 2008 2009 2010 2011 2012 2013 2014 2015 2016 2017 2018 2019 2020 2021 2022 2023 2024 2025 2026Darlington Unit 1PO Days (excludes Refurb) 69.1 30.1 0.0 55.4 0.0 0.0 75.3 47.4 0.0 98.8 0.0 0.0 0.0 93.5 0.0 0.0 0.0 55.0 31.0FEPO Days 0.0 0.0 0.0 0.0 0.0 0.0 0.0 1.8 0.0 0.0 2.8 0.0 0.0 0.0 0.0 0.0 0.0 0.0 0.0Unbudgeted Planned Outage 0.0 0.0 0.0 4.9 0.0 0.0 2.1 24.5 0.0 12.1 2.0 0.0 0.0 0.0 0.0 0.0 0.0 0.0 0.0Total 69.1 30.1 0.0 60.3 0.0 0.0 77.4 73.7 0.0 110.9 4.8 0.0 0.0 93.5 0.0 0.0 0.0 55.0 31.0Darlington Unit 2PO Days (excludes Refurb) 0.0 32.0 61.7 0.0 0.0 77.9 0.0 50.3 0.0 0.0 0.0 0.0 0.0 44.4 43.0 82.2 0.0 182.0 28.1FEPO Days 0.0 3.2 0.0 0.0 0.0 19.7 0.0 0.0 0.0 0.0 0.0 0.0 0.0 0.0 0.0 0.0 0.0 0.0 0.0Unbudgeted Planned Outage 0.0 0.0 0.0 0.0 0.0 0.0 2.8 0.0 2.8 0.0 0.0 0.0 0.0 0.0 0.0 0.0 0.0 0.0 0.0Total 0.0 35.2 61.7 0.0 0.0 97.6 2.8 50.3 2.8 0.0 0.0 0.0 0.0 44.4 43.0 82.2 0.0 182.0 28.1Darlington Unit 3PO Days (excludes Refurb) 0.0 79.5 0.0 0.0 56.2 0.0 0.0 95.8 19.6 0.0 82.7 0.0 33.0 0.0 0.0 0.0 55.0 31.0 0.0FEPO Days 0.0 7.7 0.0 0.0 0.0 0.0 0.0 5.8 0.0 0.0 0.0 0.0 1.3 0.0 0.0 0.0 0.0 0.0 0.0Unbudgeted Planned Outage 0.0 0.0 4.9 0.0 0.6 0.0 0.0 0.0 0.0 0.0 0.0 0.0 0.0 0.0 0.0 0.0 0.0 0.0 0.0Total 0.0 87.2 4.9 0.0 56.8 0.0 0.0 101.6 19.6 0.0 82.7 0.0 34.3 0.0 0.0 0.0 55.0 31.0 0.0Darlington Unit 4PO Days (excludes Refurb) 0.0 28.7 56.5 0.0 0.0 66.6 0.0 48.8 87.7 0.0 24.6 84.9 0.0 90.3 30.0 30.0 0.0 0.0 0.0FEPO Days 0.0 1.0 13.9 0.0 0.0 20.1 0.0 0.0 0.0 0.0 0.0 0.0 0.0 0.0 0.0 0.0 0.0 0.0 0.0Unbudgeted Planned Outage 0.0 0.0 0.0 0.0 6.8 0.0 11.8 0.0 0.0 0.0 0.0 0.0 0.0 0.0 0.0 0.0 0.0 0.0 0.0Total 0.0 29.7 70.4 0.0 6.8 86.7 11.8 48.8 87.7 0.0 24.6 84.9 0.0 90.3 30.0 30.0 0.0 0.0 0.0Darlington All Units PO Days (excludes Refurb) 69.1 170.3 118.2 55.4 56.2 144.5 75.3 242.3 107.3 98.8 107.3 84.9 33.0 228.2 73.0 112.2 55.0 268.0 59.1FEPO Days 0.0 11.9 13.9 0.0 0.0 39.8 0.0 7.7 0.0 0.0 2.8 0.0 1.3 0.0 0.0 0.0 0.0 0.0 0.0Unbudgeted Planned Outage 0.0 0.0 4.9 4.9 7.4 0.0 16.7 24.5 2.8 12.1 2.0 0.0 0.0 0.0 0.0 0.0 0.0 0.0 0.0Darlington Total 69.1 182.2 137.0 60.3 63.6 184.3 92.0 274.5 110.1 110.9 112.1 84.9 34.3 228.2 73.0 112.2 55.0 268.0 59.1Pickering Unit 1PO Days 0.0 0.0 98.0 0.0 106.3 0.0 0.0 101.7 0.0 133.1 2.9 0.0 157.9 0.0 113.1 19.5 0.0 0.0 0.0FEPO Days 1.1 0.0 12.3 0.0 9.9 109.7 0.0 17.3 0.0 0.0 0.0 0.0 0.0 0.0 0.0 0.0 0.0 0.0 0.0Unbudgeted Planned Outage 0.0 0.0 0.0 0.0 0.0 0.0 0.0 26.6 0.0 0.0 0.0 0.0 0.0 0.0 0.0 0.0 0.0 0.0 0.0Total 1.1 0.0 110.3 0.0 116.2 109.7 0.0 145.6 0.0 133.1 2.9 0.0 157.9 0.0 113.1 19.5 0.0 0.0 0.0Pickering Unit 4PO Days 0.0 74.0 46.5 80.9 0.0 20.0 85.3 0.0 107.8 29.3 112.3 0.0 121.6 0.0 65.0 70.2 35.0 0.0 0.0FEPO Days 0.0 32.5 0.0 6.8 7.4 4.5 34.3 0.0 31.9 0.0 0.0 0.0 13.0 0.0 0.0 0.0 0.0 0.0 0.0Unbudgeted Planned Outage 0.0 0.0 0.0 0.0 18.0 0.0 0.0 0.0 0.0 0.0 0.0 0.0 0.0 0.0 0.0 0.0 0.0 0.0 0.0Total 0.0 106.5 46.5 87.7 25.4 24.5 119.6 0.0 139.7 29.3 112.3 0.0 134.6 0.0 65.0 70.2 35.0 0.0 0.0Pickering Unit 5PO Days 0.0 57.3 41.9 113.0 0.0 87.8 0.0 105.9 0.0 121.6 0.0 115.9 0.0 35.0 194.2 0.0 100.8 0.0 0.0FEPO Days 5.3 27.7 0.0 63.9 0.0 53.4 0.0 14.7 0.0 0.0 0.0 0.0 0.0 0.0 0.0 0.0 0.0 0.0 0.0Unbudgeted Planned Outage 1.7 0.0 0.0 0.0 0.0 0.0 0.0 0.0 0.0 0.0 0.0 0.0 0.0 0.0 0.0 0.0 0.0 0.0 0.0Total 7.0 85.0 41.9 176.9 0.0 141.2 0.0 120.6 0.0 121.6 0.0 115.9 0.0 35.0 194.2 0.0 100.8 0.0 0.0Pickering Unit 6PO Days 0.0 68.2 39.4 101.1 0.0 113.0 0.0 102.4 1.4 0.0 124.0 0.0 119.4 22.0 30.0 132.3 0.0 35.0 0.0FEPO Days 0.0 0.0 0.0 0.0 0.0 0.0 0.0 0.0 16.2 0.0 0.0 0.0 0.0 0.0 0.0 0.0 0.0 0.0 0.0Unbudgeted Planned Outage 0.0 0.0 0.0 0.0 0.0 0.0 0.0 0.0 0.0 0.0 0.0 0.0 0.0 0.0 0.0 0.0 0.0 0.0 0.0Total 0.0 68.2 39.4 101.1 0.0 113.0 0.0 102.4 17.6 0.0 124.0 0.0 119.4 22.0 30.0 132.3 0.0 35.0 0.0Pickering Unit 7
ForecastActualsChart 1 - Outage Days Metrics 2008-2026 By Nuclear Unit
Filed: 2021-04-19 EB-2020-0290
Exhibit L E2-01-CCC-043
Attachment 1 Page 1 of 2

PO Days 0.0 0.0 117.2 0.0 104.4 0.0 113.9 0.0 117.5 0.0 0.0 109.6 0.0 112.1 54.9 35.0 132.2 0.0 0.0FEPO Days 0.0 0.0 2.2 0.0 0.0 0.0 7.5 8.5 3.9 11.6 0.0 0.0 0.0 0.0 0.0 0.0 0.0 0.0 0.0Unbudgeted Planned Outage 0.0 0.0 0.0 0.0 0.0 0.0 0.0 0.0 0.0 0.0 0.0 0.0 19.3 0.0 0.0 0.0 0.0 0.0 0.0Total 0.0 0.0 119.4 0.0 104.4 0.0 121.4 8.5 121.4 11.6 0.0 109.6 19.3 112.1 54.9 35.0 132.2 0.0 0.0Pickering Unit 8PO Days 60.4 0.0 76.4 0.0 97.4 0.0 85.7 0.0 142.6 0.0 109.9 0.0 0.0 188.8 30.0 114.1 2.2 0.0 0.0FEPO Days 13.2 0.0 7.0 0.0 8.9 0.0 13.6 0.0 41.4 0.0 0.0 0.0 0.0 0.0 0.0 0.0 0.0 0.0 0.0Unbudgeted Planned Outage 0.0 0.0 0.0 0.0 0.0 0.0 0.0 13.4 0.0 40.6 0.0 7.9 31.8 0.0 0.0 0.0 0.0 0.0 0.0Total 73.6 0.0 83.4 0.0 106.3 0.0 99.3 13.4 184.0 40.6 109.9 7.9 31.8 188.8 30.0 114.1 2.2 0.0 0.0Pickering All Units PO Days 60.4 199.5 419.4 295.0 308.1 220.8 284.9 310.0 369.3 284.0 349.1 225.5 398.9 357.9 487.2 371.1 270.2 35.0 0.0FEPO Days 19.6 60.2 21.5 70.7 26.2 167.6 55.4 40.5 93.4 11.6 0.0 0.0 13.0 0.0 0.0 0.0 0.0 0.0 0.0Unbudgeted Planned Outage 1.7 0.0 0.0 0.0 18.0 0.0 0.0 40.0 0.0 40.6 0.0 7.9 51.1 0.0 0.0 0.0 0.0 0.0 0.0Pickering Total 81.7 259.7 440.9 365.7 352.3 388.4 340.3 390.5 462.7 336.2 349.1 233.4 463.0 357.9 487.2 371.1 270.2 35.0 0.0
Numbers may not add due to rounding
20081 20091 20102 20113 20123 20134 20145 20155 20164 20176 20186 20196 20206 20216 20227 20237 20247 20257 20267
Pickering OEB Approved PO Days 179.0 176.0 436.0 304.0 247.0 303.5 292.9 287.9 401.6 541.6 530.8 517.2 498.9 562.8 487.2 371.1 270.2 35.0 0.0Darlington OEB Approved PO Days 75.1 171.7 118.8 68.3 65.5 144.4 77.1 188.0 111.0 148.4 143.3 119.1 183.2 51.2 73.0 112.2 55.0 268.0 59.1Pickering Variance (days) (Actual - OEB/Appr.) (97.3) 83.7 4.9 61.7 105.3 84.9 47.4 102.6 61.1 (205.4) (181.7) (283.8) (35.9) (204.9) 0.0 0.0 0.0 0.0 0.0Pickering Variance (TWh) (Actual - OEB/Appr.) (1.2) 1.0 0.1 0.8 1.3 1.1 0.6 1.3 0.8 (2.5) (2.2) (3.5) (0.4) (2.5) 0.0 0.0 0.0 0.0 0.0Darlington Variance (days) (Actual - OEB/Appr.) (6.0) 10.5 18.2 (8.0) (1.9) 39.9 14.9 86.5 (0.9) (37.5) (31.2) (34.2) (148.9) 177.0 0.0 0.0 0.0 0.0 0.0Darlington Variance (TWh) (Actual - OEB/Appr.) (0.1) 0.2 0.4 (0.2) (0.0) 0.8 0.3 1.8 (0.0) (0.8) (0.7) (0.7) (3.1) 3.7 0.0 0.0 0.0 0.0 0.0Total Variance (TWh) (1.3) 1.3 0.4 0.6 1.3 1.9 0.9 3.1 0.7 (3.3) (2.9) (4.2) (3.6) 1.2 0.0 0.0 0.0 0.0 0.0Revenue Rate ($/MWh)8 53.0 53.0 53.0 51.5 51.5 51.5 52.8 59.3 59.3 70.2 78.6 77.0 85.0 89.7 101.5 105.1 104.4 106.7 120.7Revenue Deficiency ($M)9 (50.2) 62.4 21.8 28.1 59.3 89.2 43.8 170.4 40.5 (219.2) (215.9) (308.6) (289.9) 102.6 0.0 0.0 0.0 0.0 0.0
1OPG Approved Budget, Ref. EB 2010-008 E2-1-2 Table 1a, 1b 2OPG Budget, Ref. EB 2013-0321 E2-1-2 Table 13Ref. EB 2013-0321 E2-1-2 Table 14OPG Budget, Ref. EB 2016-0152 E2-1-2 Table 15Ref. EB 2016-0152 E2-1-2 Table 16Ref. L-1-Staff-0027OPG Approved Budget, Ref. EB 2020-0290 E2-1-2 Table 1a, 1b82014 is at rate of $52.82/MWh (10 months at Board approved rate of $51.52/MWh and 2 months at Board approved rate of $59.29/MWh) 2017 is at rate of $70.18 (5 months at Board approved rate of $59.29/MWh and 7 months at Board Approved rate of $77.96)9 Revenue Deficiency adjusted for fuel. Revenue Deficiency in 2008 has been adjusted to reflect 9 months per OEB approved rates April 1 2008
Chart 2 - Outage Days and Production Variance and Revenue Deficiency by Station and Year
Filed: 2021-04-19 EB-2020-0290
Exhibit L E2-01-CCC-043
Attachment 1 Page 2 of 2

Filed: 2021-04-19 EB-2020-0290
Exhibit L E2-01-CCC-044
Page 1 of 3
Witness Panel: Nuclear Operations & Nuclear Projects
CCC Interrogatory #44 1 2 Interrogatory 3 4 Reference: Exhibit E2/ T/1/S1/ pp. 11-12 5 6 3.2.2 Vacuum Building Outage 7 A six-unit Pickering VBO is scheduled in 2022. Historically, OPG has undertaken VBOs 8 at Pickering on an established 10-year regulatory test interval. The initial VBO date 9 was 2020 to be consistent with the established 10-year regulatory test interval from the 10 last execute VBO in April 2010. Based on innovative maintenance and inspection 11 activities and after extensive technical reviews, the CNSC accepted OPG’s request in 12 March 2019 to increase the interval from 10 to 12 years, allowing the VBO to be 13 deferred until 2022.This twelve-year frequency is consistent with the frequency used 14 at Darlington. 15 16
a) Please confirm that the impact of the 6-unit Pickering VBO was included in the 17 outage forecast for 2021 in EB-2016-0152, such that OPG’s rates for 2021 were 18 increased to account for the outage in that year; 19 20
b) Please confirm that moving the VBO outage to 2022 has the effect of reducing 21 the production forecast for 2022, necessitating an increase in 2022 rates; 22 23
c) Please confirm the number of outage days included in the OEB approved 24 number of 2021 outage days as a result of the VBO, and the number outage 25 days OPG is seeking approval for in 2022 as a result of the deferral of the VBO 26 to 2022; 27 28
d) Given the 10-12 year frequency of testing cited by OPG, please explain the 29 benefit to ratepayers of initially increasing rates in 2021 to account for the impact 30 of the VBO, shifting the VBO to 2022, and then accounting for VBO in 2022 a 31 second time 32 33
e) Please provide the revenue impact of including the VBO in 2021 without 34 incurring those outages, and the rate impact of including VBO in 2022. 35
36 37 Response 38 39
a) Confirmed. 40 41
b) Confirmed. 42 43

Filed: 2021-04-19 EB-2020-0290
Exhibit L E2-01-CCC-044
Page 2 of 3
Witness Panel: Nuclear Operations & Nuclear Projects
c) In EB-2016-0152, the nuclear production forecast included 120 PN VBO specific 1 outage days in 2021. OPG is seeking approval of 150 PN VBO specific outage 2 days in 2022. 3
4 d) Contrary to the question, rates were not “increased in 2021 to account for the 5
impact of the VBO.” OPG is unique in that it recovers its revenue requirement 6 on a 100% volumetric basis. To set the payment amounts, the OEB approves a 7 production forecast based on its assessment of OPG’s generation plan, which 8 represents OPG’s best forecast of production at the time it is produced. When 9 events unfold differently than forecast, as they always do, OPG bears the risk. 10 Over the period during which the OEB has set OPG’s payment amounts, this 11 risk has resulted in OPG experiencing both under and over recovery as shown 12 in Ex. L-E2-01-CCC-042, Attachment, Table 2. 13 14 Undertaking a VBO is both disruptive to OPG, in terms of resource availability, 15 and to the Ontario electricity grid, given that a VBO requires a shutdown of all 16 units at Pickering (6) or Darlington (4). In operating its facilities, OPG is expected 17 to pursue continuous improvement and ratepayers have benefited from this 18 pursuit. As an example, the last VBO at Pickering in 2010 was 44 days per unit 19 in duration. In EB-2016-0152, OPG’s generation plan assumed a VBO of 30 20 days duration per unit, reflecting the technological advances and innovative 21 approaches OPG had taken to reduce VBO duration. While OPG continues to 22 explore ways to reduce the duration of the 2022 VBO, risks remain that could 23 cause the outages required to extend beyond 30 days. Building on the 24 experience of the 2022 VBO and consistent with continuous improvement, 25 OPG intends to reflect any lessons learned, operating experience, and 26 technological advances and innovative approaches to reduce the duration of 27 future Darlington VBOs, including the VBO currently planned for 2027. 28 29
e) The evaluation of the revenue or rate impact in any forecast year due to changes 30 in assumed generation, such as the rescheduling of the VBO, would require 31 evaluation of the key impacts to the generation plan in that future time period. 32 The key impacts would be the following: 33
i. Removal of the forecast planned outage days (increase in generation); 34 ii. A forced loss rate adjustment to the increase in generation related to (i) 35
above (decrease in generation); 36 iii. Adjustments for forecast fuel costs associated with the 37
increase/decrease of generation related to the above two factors. 38 39 Based on the above, the revenue (net of fuel) impact of not incurring the outages 40 associated with the VBO in 2021 is approximately $121M. In addition, there is 41 $35M in outage OM&A not incurred. 42 43

Filed: 2021-04-19 EB-2020-0290
Exhibit L E2-01-CCC-044
Page 3 of 3
Witness Panel: Nuclear Operations & Nuclear Projects
Based on the above factors, the forecast production impact of removing the 1 VBO in 2022 is an increase in forecast generation of approximately 1.8 TWh. 2 There is an additional rate impact of $17.9M ($28.1M in lower Outage OM&A 3 with an offsetting $10.2M in fuel costs). Combined, this would result in a change 4 of OPG’s smoothed payment amount from $101.51/MWh to $100.01/MWh, and 5 a change in the amounts recorded in the RSDA from $241.2M to $93.1M. 6

Filed: 2021-04-19 EB-2020-0290
Exhibit L E2-01-Energy Probe-049
Page 1 of 2
Witness Panel: Nuclear Operations & Nuclear Projects
Energy Probe Interrogatory #49 1 2 Interrogatory 3 4 Reference: 5 Exhibit E2, Tab 1, Schedule 1, Tables 1, and 2; Exhibit E2, Tab1, Schedule 2. Table 6 1b 7 8
a) Please provide a schedule that shows for the historic period 2015-2020: 9 • The installed Nuclear Capacity Gross (MW) 10 • The Net nuclear capacity and capacity factors (MW) (all outages included) 11 • The Annual Production (TWh) 12 • The ratio of Production to Gross and Net capacity 13 • The annual Nuclear Revenue Requirement ($) 14 • Cost per MW of Gross and Net Capacity. 15
16 b) Please provide the same schedule for the 2021-2026 IRM period. 17
18 19 Response 20 21 OPG, and the nuclear industry at large, does not calculate a number of the metrics 22 requested. Accurately doing so would require recalculating our historical metrics and 23 changing our forecasting model, something that would require extensive effort and 24 cannot be done in a reasonable amount of time. 25 26 OPG believes that the information that is being sought is available through industry 27 standard metrics for capacity, capability and cost. In particular, OPG has provided its 28 Net Capacity Factor, Unit Capability Factor, and Total Generating Cost metrics in Chart 29 1 below. OPG does not use installed gross or net capacity in its performance metrics. 30 31 The Unit Capability factor measures the amount of energy that the units(s) generated 32 over a period of time, based on gross production adjusted for any losses outside OPG’s 33 control (such as transmission or demand limitations), as a percentage of the amount 34 of energy that would have been produced over the same period had the unit(s) 35 produced maximum generation. The metrics are provided as actuals for the 2015-2020 36 period and on a forecast basis for the 2021-2026 and are adjusted for the impact of 37 units undergoing refurbishment. 38

Filed: 2021-04-19 EB-2020-0290
Exhibit L E2-01-Energy Probe-049
Page 2 of 2
Witness Panel: Nuclear Operations & Nuclear Projects
1
2015 2016 2017 2018 2019 2020 2021 2022 2023 2024 2025 2026Installed Gross Nuclear Capacity (MW) 6,980 6,980 6,980 6,980 6,980 6,980 6,980 6,980 6,980 6,980 5,896 3,736Installed Net Nuclear Capacity (MW) 6,606 6,606 6,606 6,606 6,606 6,606 6,606 6,606 6,606 6,606 5,576 3,512Net Capacity Factor (%) 77.0 81.0 81.3 81.8 86.9 83.7 76.7 77.2 77.6 79.1 80.9 87.6Annual Production (TWh) 44.5 45.6 40.7 40.9 43.5 43.9 38.3 33.2 30.8 33.3 30.2 21.5Unit Capability Factor (%) 78.0 82.7 82.4 83.5 87.5 84.5 78.2 78.5 79.0 82.8 82.5 89.4Nuclear Revenue Requirement ($M) 2,834 1 2,834 2 2,970 2,970 2,970 2,970 2970 3611 3541 3644 3325 2551Pickering Total Generating Cost per MWh ($/MWh)3 46.81 4 52.72 4 48.47 46.83 39.78 47.94 45.31 47.49 42.12 37.62 23.48 -Darlington Total Generating Cost per MWh ($/MWh)3 40.21 4 35.06 4 39.01 39.60 37.90 32.23 58.15 45.83 60.24 42.92 59.81 40.75
3 TGC per MWh values shown in the table are normalized. See L-F2-01-STAFF-196 for further Value for Money metrics.4 TGC per MWh values for 2015 & 2016, normalization was retroactively applied.
Chart 1 - Yearly Production Metrics
1 2015 reflects the average of 2014/2015 Revenue requirement which was the basis for EB-2013-0321 Nuclear base payment amounts2 EB 2016-0152 PAO Appendix C table 1 line 1
Actual Forecast
Filed: 2021-04-19 EB-2020-0290
Exhibit L E2-01-Energy Probe-050
Page 1 of 1
Witness Panel: Nuclear Operations & Nuclear Projects
Energy Probe Interrogatory #50 1 Interrogatory 2 3 Reference: 4 Exhibit E2, Tab 1, Schedule 1, page 6 5 6 Please explain how the forecast of the duration of post-refurbishment outages for each 7 unit was determined. Please show all calculations. 8 9 10 Response 11 12 The duration of post-refurbishment outages for each unit was based upon an 13 assessment of operating experience issues seen from other CANDU plants in the 14 immediate post-refurbishment period and the length of outage duration required to fix 15 major equipment issues (see Ex. L-E2-01-Staff-185). 16 17 The durations for post refurbishment outage #1 were generally based on the following 18 logic: 19 • 7 days required for cool-down, heat sinks and work protection; 20 • 30 days maintenance window to address potential scope based on repairs for 21
known post refurbishment industry issues such as high leakage to collection; 22 • 10 days to address discovery issues; 23 • 8 days for pressurization of Primary Heat Transport system, approach to critical, 24
heat up and low power testing and synchronization 25 26 Similarly, the durations for post refurbishment outage #2 were generally based on the 27 following logic: 28 • 7 days required for cool-down activities as set out above; 29 • 12 days maintenance window to address issues identified after post refurbishment 30
outage #1; 31 • 4 days to address discovery issues; 32 • 8 days for start up activities as set out above 33 34 This served as the planning basis for each of the Darlington Units’ post-refurbishment 35 outages. The specific split between the first and second post-refurbishment outages 36 may differ as OPG plans for the outages. 37
Filed: 2021-04-19 EB-2020-0290
Exhibit L E2-01-Energy Probe-051
Page 1 of 2
Witness Panel: Nuclear Operations & Nuclear Projects
Energy Probe Interrogatory #51 1 Interrogatory 2 3 Reference: 4 Exhibit E2, Tab 1, Schedule 1, page 12 5 6 Please explain the method of forecasting the forced loss rate. Please show sample 7 calculations. 8 9 10 Response 11 12 Each station’s forecast Forced Loss Rate is a target set during the annual business 13 planning process. It is developed by assessing a number of contributing factors as 14 discussed at Ex. E2-1-1, pp. 12-14, and Ex. F2-1-1, pp. 15-19 including: 15 16 • An assessment of the FLR historical trending performance 17 • An assessment of the latest industry benchmarking results 18 • An assessment of Equipment Reliability Index and Plant System Health, looking at 19
historical trends and expected future equipment condition, including fuel handling 20 equipment reliability 21
• A review of maintenance backlogs, both historical trends and expected future 22 performance 23
• An assessment of human performance, both historical trends and expected future 24 performance 25
• An assessment of capital and OM&A project investments, and the timing of specific 26 project availability for service 27
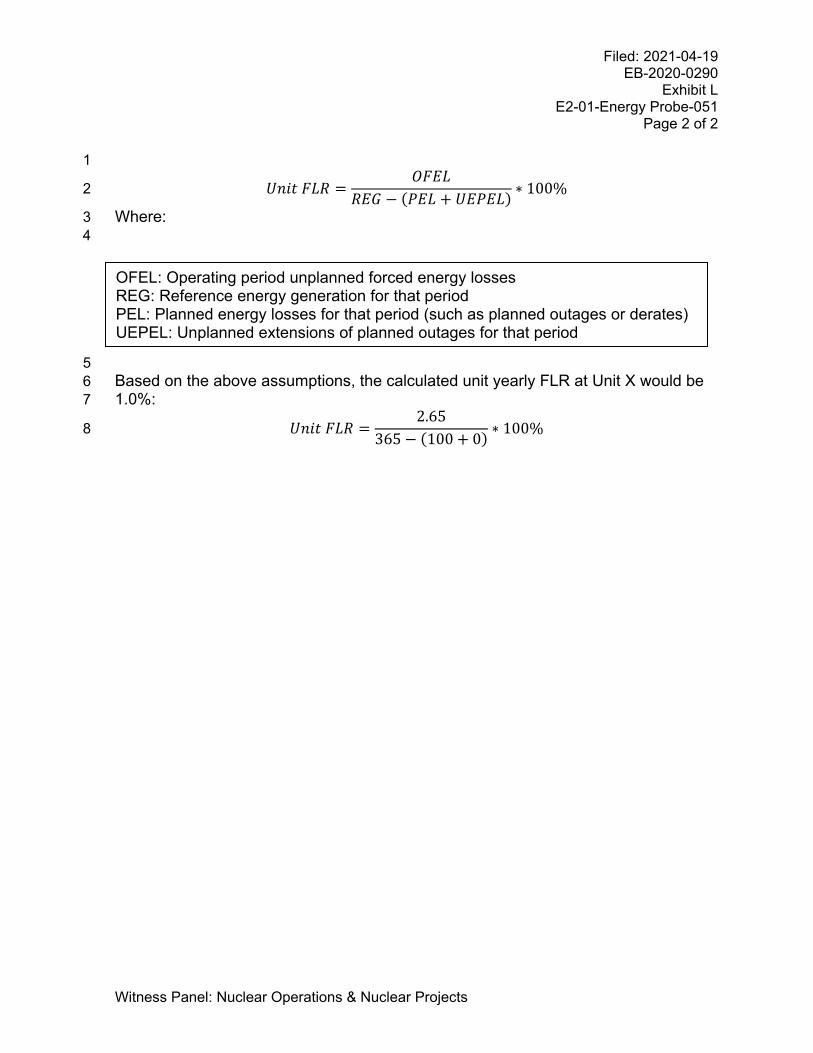
• Any known improvements or plant material condition issues 28 29 An example of a sample calculation would be a generation forecast that assumes a 30 single 100 day outage at Unit X in its yearly plan. OPG does not forecast unplanned 31 extensions to planned outages (i.e., assumes zero). Based on the contributing factors 32 identified above, OPG forecasts an expected 2.65 days of lost generation during that 33 year at Unit X due to unplanned production losses. 34 35 Mathematically, FLR is derived as follows: 36
Filed: 2021-04-19 EB-2020-0290
Exhibit L E2-01-Energy Probe-051
Page 2 of 2
Witness Panel: Nuclear Operations & Nuclear Projects
1
𝑈𝑈𝑈𝑈𝑈𝑈𝑈𝑈 𝐹𝐹𝐹𝐹𝐹𝐹 =𝑂𝑂𝐹𝐹𝑂𝑂𝐹𝐹
𝐹𝐹𝑂𝑂𝑅𝑅 − (𝑃𝑃𝑂𝑂𝐹𝐹 + 𝑈𝑈𝑂𝑂𝑃𝑃𝑂𝑂𝐹𝐹) ∗ 100% 2
Where: 3 4
5 Based on the above assumptions, the calculated unit yearly FLR at Unit X would be 6 1.0%: 7
𝑈𝑈𝑈𝑈𝑈𝑈𝑈𝑈 𝐹𝐹𝐹𝐹𝐹𝐹 =2.65
365 − (100 + 0) ∗ 100% 8
OFEL: Operating period unplanned forced energy losses REG: Reference energy generation for that period PEL: Planned energy losses for that period (such as planned outages or derates) UEPEL: Unplanned extensions of planned outages for that period
Filed: 2021-04-19 EB-2020-0290
Exhibit L E2-01-Environmental Defence-007
Page 1 of 1
Witness Panel: Nuclear Operations & Nuclear Projects
Environmental Defence Interrogatory #7 1 2 Interrogatory 3 4 Reference: 5 Ex. E2-1-1, Table 1 6 7 Question: 8 9
(a) Please provide the Darlington NGS annual production forecast (TWh) for each 10 year from 2027 to 2041 inclusive. 11
12 13 Response 14 15 OPG declines to respond to this question on the basis of relevance. The question does 16 not seek information that is relevant as OPG is not seeking approval of its Darlington 17 NGS annual production forecast for the period 2027 to 2041 in this application. 18 19 Without waiving the foregoing objection, Ex. L-I1-03-Staff-343 provides contextual 20 information regarding OPG’s anticipated Nuclear production from 2027-2036 for rate 21 smoothing purposes. 22
Filed: 2021-04-19 EB-2020-0290
Exhibit L E2-01-OAPPA-002
Page 1 of 1
Witness Panel: Nuclear Operations & Nuclear Projects
OAPPA Interrogatory #3 1 Interrogatory 2 3 Reference: 4 Exhibit E2-1-1 Pages 7 and 8, Section 3 confirms the basis and methodology used in 5 the Nuclear Production Forecast, including in lines 5 to 13 on Page 8 “The objective 6 is to establish a realistic and accurate annual nuclear production forecast based on the 7 generation and outage plan, with the following deliverables: A planned outage 8 schedule for all stations that includes unit outage start dates, end dates, and durations 9 based on the major elements comprising the scope of work that will be executed during 10 each outage”. The net result is provided in a monthly format as Exhibit E2-1-1, Table 11 2. However, OAPPA is unable to confirm the accuracy and appropriateness of this 12 forecast based on the currently filed information, finding instead that either the UCF’s 13 have been understated or its interpretation of the known outages are inconsistent with 14 OPG’s filed or public intentions. 15 16 a) Other than the DRP, which is well documented, would OPG please provide a 17
monthly forecast of the anticipated nuclear outages by station and generating unit, 18 during the IR term? 19
b) Alternatively, or additionally, can OPG identify the Planned Outage start and end 20 dates, by individual unit, during the IR term? 21
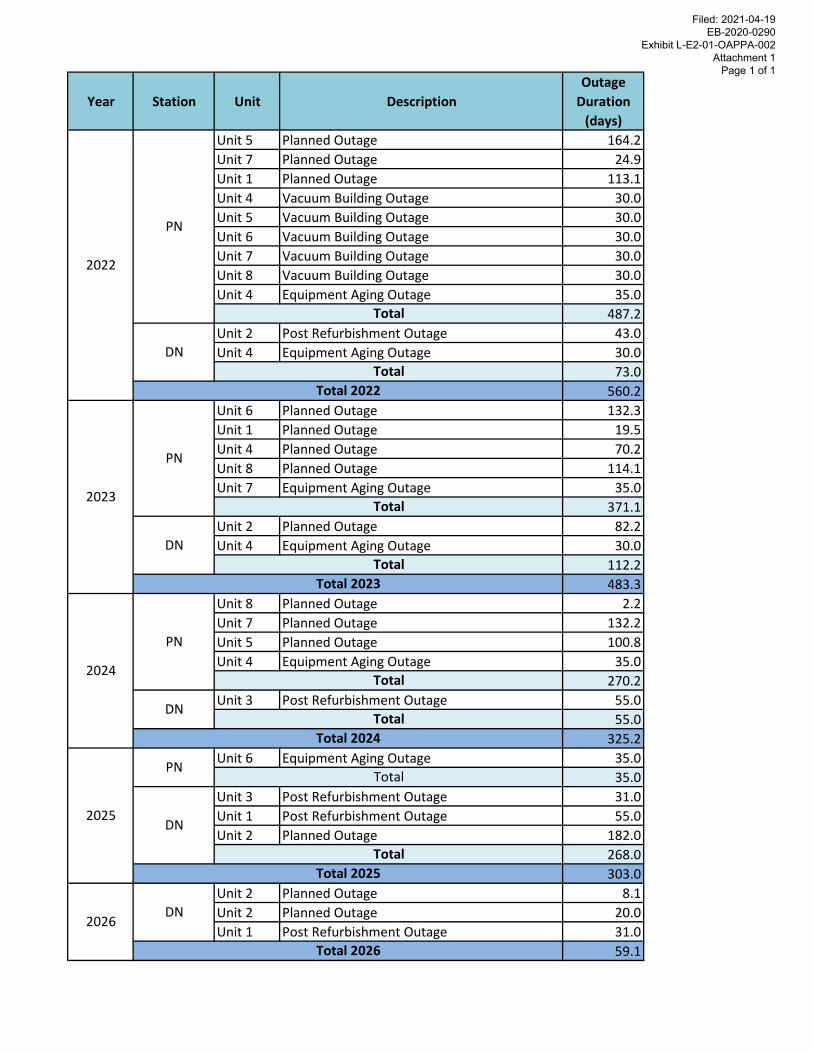
22 23 Response 24 25 a) and b) 26 27 In Attachment 1, OPG has provided the outage breakdown by year, station outage 28 name, unit, description, and outage duration (in days), for all nuclear outages in the 29 2022-2026 period. 30 31 OPG declines to produce a monthly forecast or the start and end dates requested on 32 the basis of relevance. This information is not relevant to the review of OPG’s 33 production forecast. OPG further notes this information is commercially sensitive. 34
Year Station Unit DescriptionOutage
Duration (days)
Unit 5 Planned Outage 164.2Unit 7 Planned Outage 24.9Unit 1 Planned Outage 113.1Unit 4 Vacuum Building Outage 30.0Unit 5 Vacuum Building Outage 30.0Unit 6 Vacuum Building Outage 30.0Unit 7 Vacuum Building Outage 30.0Unit 8 Vacuum Building Outage 30.0Unit 4 Equipment Aging Outage 35.0
487.2Unit 2 Post Refurbishment Outage 43.0Unit 4 Equipment Aging Outage 30.0
73.0560.2
Unit 6 Planned Outage 132.3Unit 1 Planned Outage 19.5Unit 4 Planned Outage 70.2Unit 8 Planned Outage 114.1Unit 7 Equipment Aging Outage 35.0
371.1Unit 2 Planned Outage 82.2Unit 4 Equipment Aging Outage 30.0
112.2483.3
Unit 8 Planned Outage 2.2Unit 7 Planned Outage 132.2Unit 5 Planned Outage 100.8Unit 4 Equipment Aging Outage 35.0
270.2Unit 3 Post Refurbishment Outage 55.0
55.0325.2
Unit 6 Equipment Aging Outage 35.035.0
Unit 3 Post Refurbishment Outage 31.0Unit 1 Post Refurbishment Outage 55.0Unit 2 Planned Outage 182.0
268.0303.0
Unit 2 Planned Outage 8.1Unit 2 Planned Outage 20.0Unit 1 Post Refurbishment Outage 31.0
59.1
Total
Total
Total 2024
Total
Total
Total
Total
2025
PN
2023
PN
2022
PN
Total 2023
Total 2022
Total
DN
DN
2024
PN
2026
Total 2026
Total 2025
Total
DN
DN
DN
Filed: 2021-04-19 EB-2020-0290
Exhibit L-E2-01-OAPPA-002 Attachment 1
Page 1 of 1
Filed: 2021-04-19 EB-2020-0290
Exhibit L E2-01-OAPPA-003
Page 1 of 1
Witness Panel: Nuclear Operations & Nuclear Projects
OAPPA Interrogatory #3 1 Interrogatory 2 3 Reference: 4 Reference: Exhibit E2-1-1, Page 6, lines 7-12 5 6 Has any consideration been given to coordinating the Unit 2, turbine generator controls 7 (TG Controls) installation outage concurrently with its second post-refurbishment 8 outage to further reduce the outage impact during the IR? 9 10 11 Response 12 13 OPG is not able to replace turbine generator controls during the second Unit 2 post-14 refurbishment outage as the same work will be performed on Unit 3 at the same time. 15 The station cannot support this work on more than one unit at a time due to space 16 considerations for materials and lay down areas, overlapping resources, and the 17 requirement to utilize the single turbine hall crane for each replacement. Refer to Ex. 18 L-E2-01-Staff-189 for more information regarding the timeline of this work. 19
Filed: 2021-04-19 EB-2020-0290
Exhibit L E2-01-OAPPA-004
Page 1 of 1
Witness Panel: Nuclear Operations & Nuclear Projects
OAPPA Interrogatory #4 1 2 Interrogatory 3 4 Reference: 5 Exhibit E2-1-1 Page 12 of 15, lines 5-8, describe the anticipated use of a new 6 technology for use during the scheduled Vacuum Building Outage (VBO) that would 7 notably reduce the outage duration “(currently 30 days duration for each of the 5 8 reactors not otherwise in a planned outage)”. 9 10 a) Please confirm the number of days that the revised technology application is 11
expected to reduce the VBO outage. 12 b) Please confirm the status of CNSC’s approval, if known, or the expected 13
confirmation time. 14 15 16 Response 17 18 a) See Ex. L-E2-01-Staff-190 b). 19
20 b) See Ex. L-E2-01-Staff-190 c). 21
Filed: 2021-04-19 EB-2020-0290
Exhibit L E2-01-OAPPA-005
Page 1 of 1
Witness Panel: Nuclear Operations & Nuclear Projects
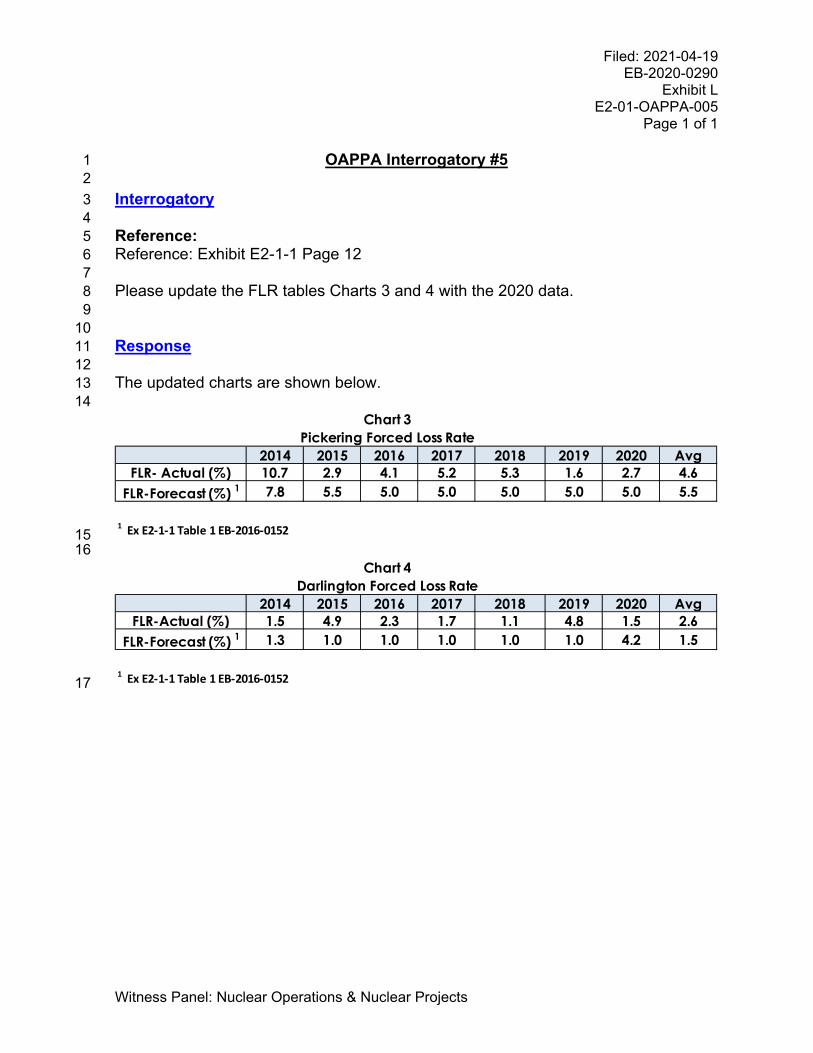
OAPPA Interrogatory #5 1 2 Interrogatory 3 4 Reference: 5 Reference: Exhibit E2-1-1 Page 12 6 7 Please update the FLR tables Charts 3 and 4 with the 2020 data. 8 9 10 Response 11 12 The updated charts are shown below. 13 14
15 16
17
2014 2015 2016 2017 2018 2019 2020 AvgFLR- Actual (%) 10.7 2.9 4.1 5.2 5.3 1.6 2.7 4.6
FLR-Forecast (%) 1 7.8 5.5 5.0 5.0 5.0 5.0 5.0 5.5
1 Ex E2-1-1 Table 1 EB-2016-0152
Chart 3Pickering Forced Loss Rate
2014 2015 2016 2017 2018 2019 2020 AvgFLR-Actual (%) 1.5 4.9 2.3 1.7 1.1 4.8 1.5 2.6
FLR-Forecast (%) 1 1.3 1.0 1.0 1.0 1.0 1.0 4.2 1.5
1 Ex E2-1-1 Table 1 EB-2016-0152
Darlington Forced Loss RateChart 4

Filed: 2021-04-19 EB-2020-0290
Exhibit L E2-01-OAPPA-006
Page 1 of 1
Witness Panel: Nuclear Operations & Nuclear Projects
OAPPA Interrogatory #6 1 Interrogatory 2 3 Reference: 4 Exhibit E2-1-1, Page 14, lines 3 to 6 describe OPG’s FLR challenges and targets, 5 despite DRP. At line 6 it reads, “However, OPG has decided to maintain this industry-6 leading FLR target in the 2020-2026 Business Plan with a view to continuous 7 improvement”. 8 9 Please explain why the production schedule of Exhibit E2-1-2, Table 1a uses much 10 higher FLR rates than the 1% FLR target considered by the Business Plan, necessarily 11 affecting lower production. 12 13 14 Response 15 16 As referenced in Ex. E2-1-1, p. 14, lines 3-6, the 1% FLR forecast is applied to each 17 unit in advance of refurbishment, with the 3 year FLR schedule post refurbishment 18 applied before returning to the 1% target, as described in Ex. E2-1-1, p. 14, lines 8-14, 19 again on a per unit basis. 20 21 The FLR rates shown in Ex. E2-1-2, Table 1a are a station average comprised of units 22 at various lifecycle stages of pre-refurbishment and post-refurbishment throughout 23 2020-2026. Units in refurbishment do not contribute to station FLR. 24
Filed: 2021-04-19 EB-2020-0290
Exhibit L E2-01-SEC-114
Page 1 of 1
Witness Panel: Nuclear Operations & Nuclear Projects
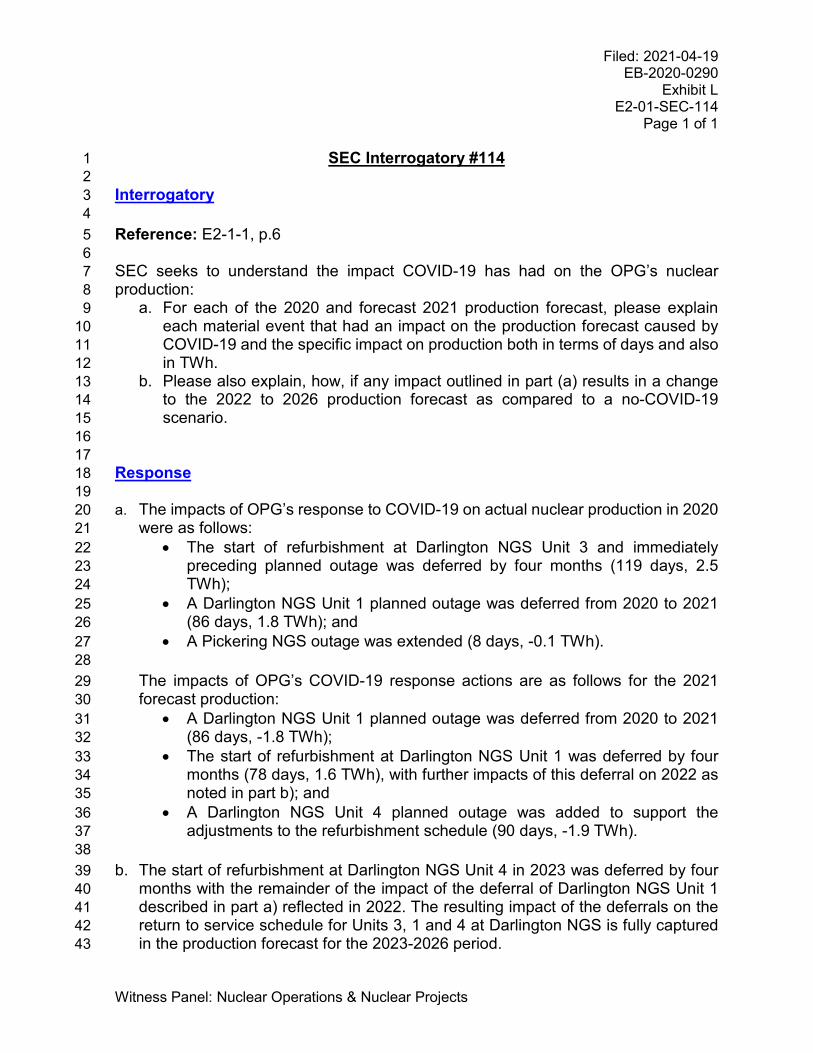
SEC Interrogatory #114 1 2 Interrogatory 3 4 Reference: E2-1-1, p.6 5 6 SEC seeks to understand the impact COVID-19 has had on the OPG’s nuclear 7 production: 8
a. For each of the 2020 and forecast 2021 production forecast, please explain 9 each material event that had an impact on the production forecast caused by 10 COVID-19 and the specific impact on production both in terms of days and also 11 in TWh. 12
b. Please also explain, how, if any impact outlined in part (a) results in a change 13 to the 2022 to 2026 production forecast as compared to a no-COVID-19 14 scenario. 15 16 17
Response 18 19 a. The impacts of OPG’s response to COVID-19 on actual nuclear production in 2020 20
were as follows: 21 • The start of refurbishment at Darlington NGS Unit 3 and immediately 22
preceding planned outage was deferred by four months (119 days, 2.5 23 TWh); 24
• A Darlington NGS Unit 1 planned outage was deferred from 2020 to 2021 25 (86 days, 1.8 TWh); and 26
• A Pickering NGS outage was extended (8 days, -0.1 TWh). 27 28 The impacts of OPG’s COVID-19 response actions are as follows for the 2021 29 forecast production: 30
• A Darlington NGS Unit 1 planned outage was deferred from 2020 to 2021 31 (86 days, -1.8 TWh); 32
• The start of refurbishment at Darlington NGS Unit 1 was deferred by four 33 months (78 days, 1.6 TWh), with further impacts of this deferral on 2022 as 34 noted in part b); and 35
• A Darlington NGS Unit 4 planned outage was added to support the 36 adjustments to the refurbishment schedule (90 days, -1.9 TWh). 37
38 b. The start of refurbishment at Darlington NGS Unit 4 in 2023 was deferred by four 39
months with the remainder of the impact of the deferral of Darlington NGS Unit 1 40 described in part a) reflected in 2022. The resulting impact of the deferrals on the 41 return to service schedule for Units 3, 1 and 4 at Darlington NGS is fully captured 42 in the production forecast for the 2023-2026 period. 43
Filed: 2021-04-19 EB-2020-0290
Exhibit L E2-01-SEC-115
Page 1 of 1
Witness Panel: Nuclear Operations & Nuclear Projects
SEC Interrogatory #115 1 2 Interrogatory 3 4 Reference: E2-1-1, Table 1 5 6 Please update Table 1 to include 2020 actuals. 7 8 9 Response 10 11 See Ex. L-A1-2-Staff-002, Attachment 1, Table 14. 12 13
Filed: 2021-04-19 EB-2020-0290
Exhibit L E2-01-SEC-116
Page 1 of 1
Witness Panel: Nuclear Operations & Nuclear Projects
SEC Interrogatory #116 1 2 Interrogatory 3 4 Reference: E2-1-2, Table 11 5 6 Please update Table 1a to include 2020 actuals. 7 8 9 Response 10 11 See Ex. L-A1-2-Staff-002, Attachment 1, Table 15. 12
Filed: 2021-04-19 EB-2020-0290
Exhibit L E2-01-SEC-162
Page 1 of 1
Witness Panel: Nuclear Operations & Nuclear Projects
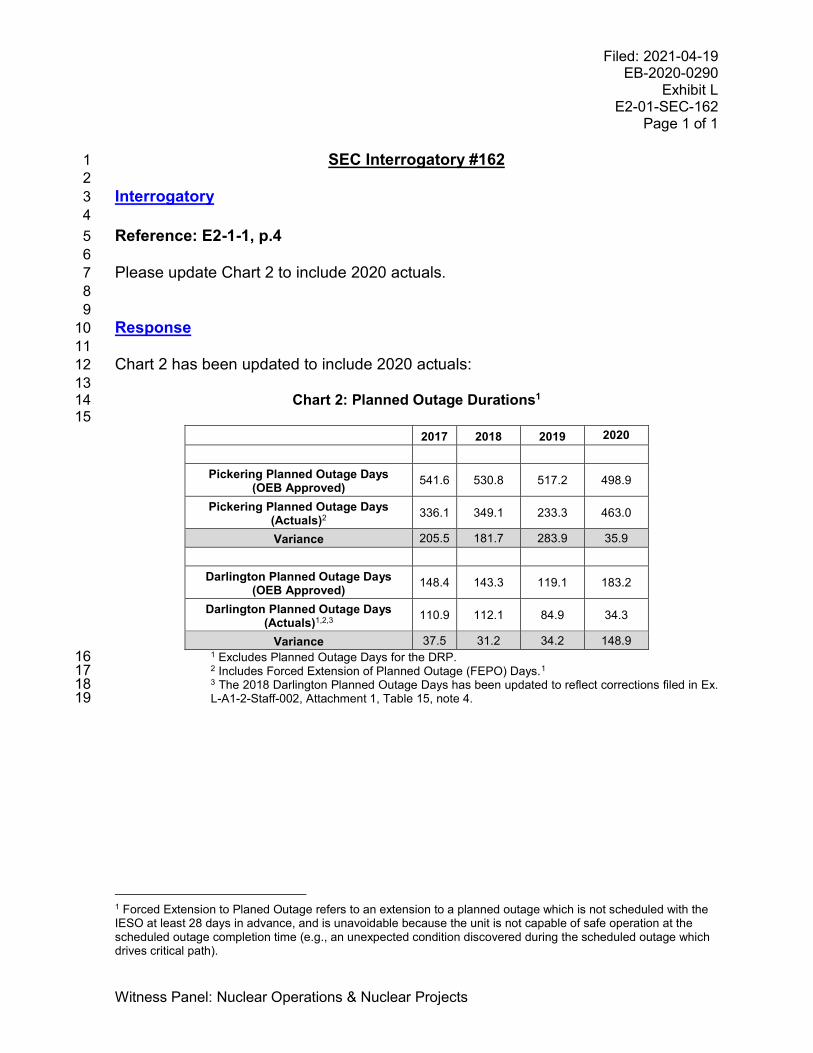
SEC Interrogatory #162 1 2 Interrogatory 3 4 Reference: E2-1-1, p.4 5 6 Please update Chart 2 to include 2020 actuals. 7 8 9 Response 10 11 Chart 2 has been updated to include 2020 actuals: 12 13
Chart 2: Planned Outage Durations1 14 15
2017 2018 2019 2020
Pickering Planned Outage Days (OEB Approved) 541.6 530.8 517.2 498.9
Pickering Planned Outage Days (Actuals)2 336.1 349.1 233.3 463.0
Variance 205.5 181.7 283.9 35.9
Darlington Planned Outage Days (OEB Approved) 148.4 143.3 119.1 183.2
Darlington Planned Outage Days (Actuals)1,2,3 110.9 112.1 84.9 34.3
Variance 37.5 31.2 34.2 148.9 1 Excludes Planned Outage Days for the DRP. 16 2 Includes Forced Extension of Planned Outage (FEPO) Days.1 17 3 The 2018 Darlington Planned Outage Days has been updated to reflect corrections filed in Ex. 18 L-A1-2-Staff-002, Attachment 1, Table 15, note 4. 19
1 Forced Extension to Planed Outage refers to an extension to a planned outage which is not scheduled with the IESO at least 28 days in advance, and is unavoidable because the unit is not capable of safe operation at the scheduled outage completion time (e.g., an unexpected condition discovered during the scheduled outage which drives critical path).
Filed: 2021-04-19 EB-2020-0290
Exhibit L E2-01-Staff-180
Page 1 of 1
Witness Panel: Nuclear Operations & Nuclear Projects
Board Staff Interrogatory #180 1 2
Interrogatory 3 4 Reference: 5 Exhibit E2 / Tab 1 / Schedule 1 / Table 1 6 7 Preamble: 8 9 The table at the above reference presents annual nuclear production between 2016 10 and 2019 and forecast annual nuclear production between 2020 and 2026 at a station-11 specific level (Darlington NGS total and Pickering NGS total). 12 13 Question(s): 14 15 a) Please provide the information in the table above at a unit-specific level. 16
17 b) Please provide the actual 2019 and 2020 production amounts (TWh) for the 18
hydroelectric facilities and the relative percentage of electricity produced by the 19 nuclear and hydroelectric generating stations. 20 21
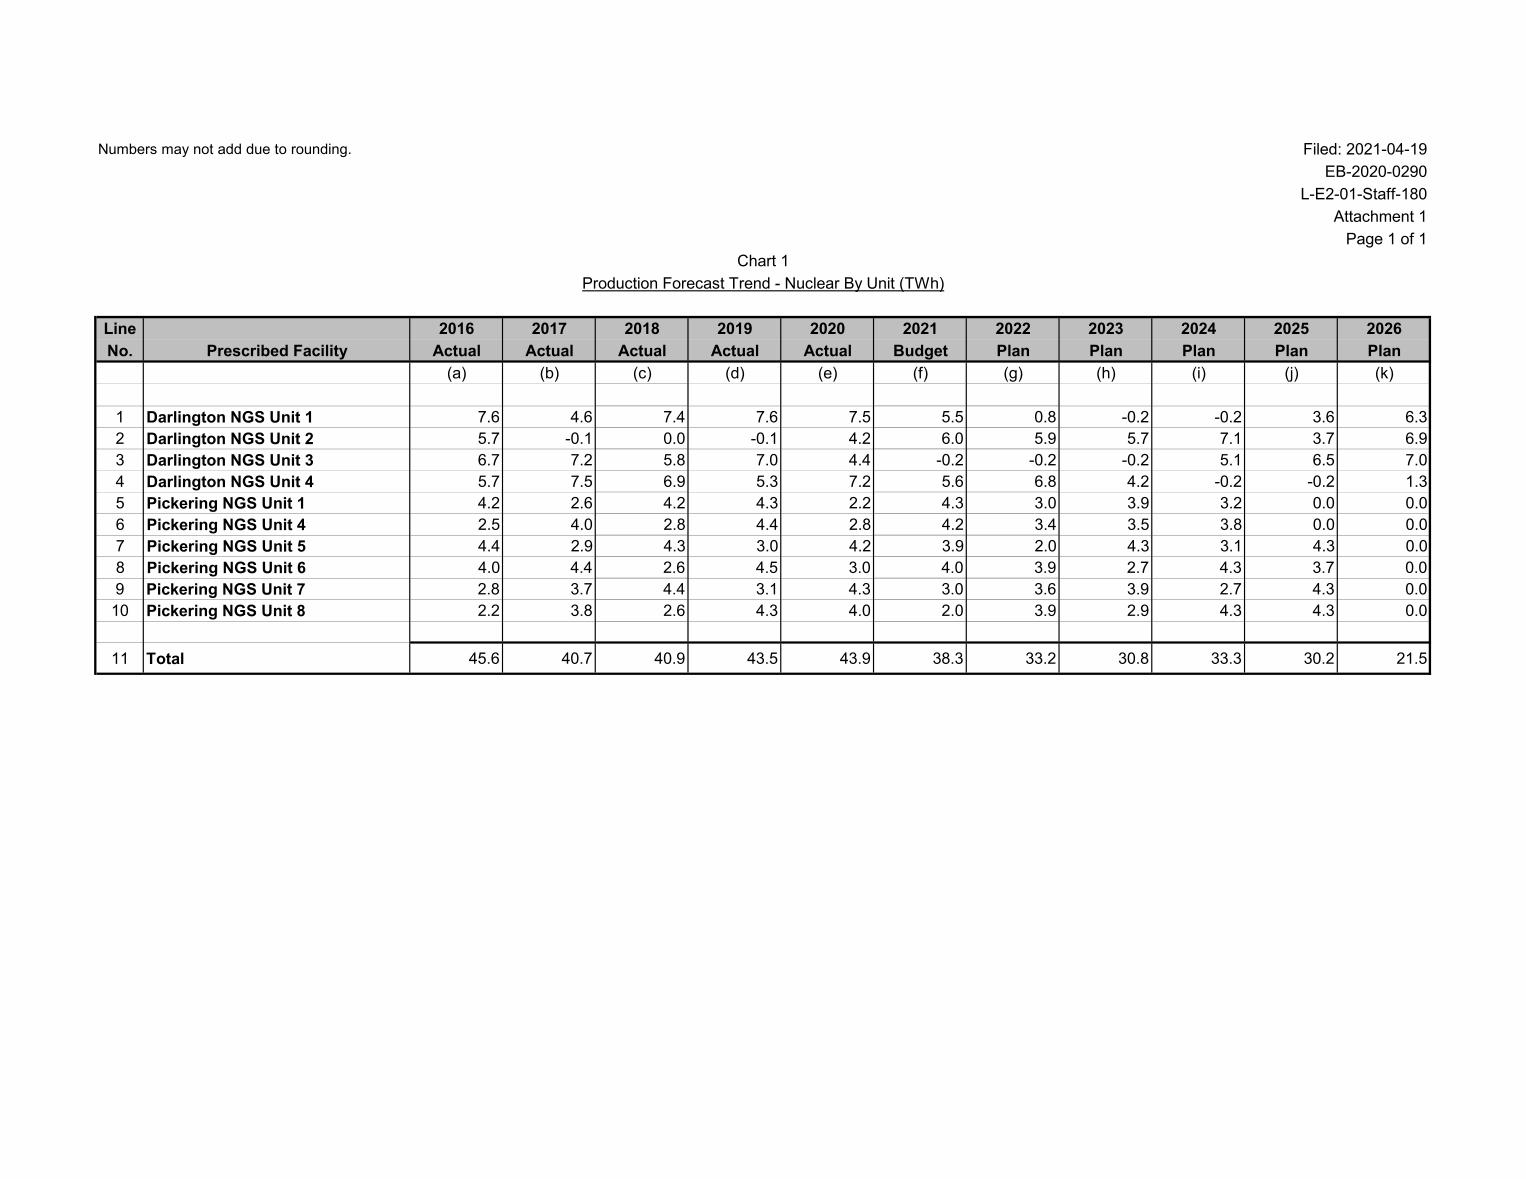
22 Response 23 24 a) See Attachment 1 for unit-specific level production, updated to 2020 actual 25
production. 26 27
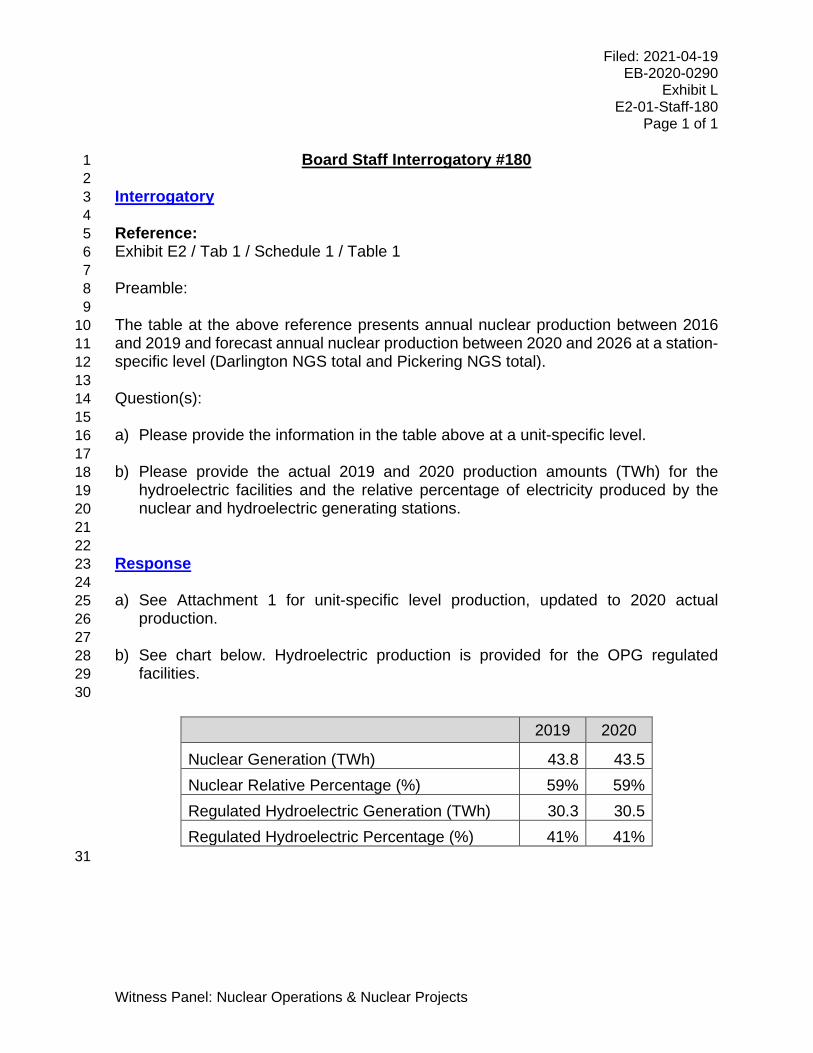
b) See chart below. Hydroelectric production is provided for the OPG regulated 28 facilities. 29
30
2019 2020
Nuclear Generation (TWh) 43.8 43.5 Nuclear Relative Percentage (%) 59% 59% Regulated Hydroelectric Generation (TWh) 30.3 30.5 Regulated Hydroelectric Percentage (%) 41% 41%
31
Numbers may not add due to rounding. Filed: 2021-04-19EB-2020-0290
L-E2-01-Staff-180Attachment 1
Page 1 of 1
Line 2016 2017 2018 2019 2020 2021 2022 2023 2024 2025 2026No. Prescribed Facility Actual Actual Actual Actual Actual Budget Plan Plan Plan Plan Plan
(a) (b) (c) (d) (e) (f) (g) (h) (i) (j) (k)
1 Darlington NGS Unit 1 7.6 4.6 7.4 7.6 7.5 5.5 0.8 -0.2 -0.2 3.6 6.32 Darlington NGS Unit 2 5.7 -0.1 0.0 -0.1 4.2 6.0 5.9 5.7 7.1 3.7 6.93 Darlington NGS Unit 3 6.7 7.2 5.8 7.0 4.4 -0.2 -0.2 -0.2 5.1 6.5 7.04 Darlington NGS Unit 4 5.7 7.5 6.9 5.3 7.2 5.6 6.8 4.2 -0.2 -0.2 1.35 Pickering NGS Unit 1 4.2 2.6 4.2 4.3 2.2 4.3 3.0 3.9 3.2 0.0 0.06 Pickering NGS Unit 4 2.5 4.0 2.8 4.4 2.8 4.2 3.4 3.5 3.8 0.0 0.07 Pickering NGS Unit 5 4.4 2.9 4.3 3.0 4.2 3.9 2.0 4.3 3.1 4.3 0.08 Pickering NGS Unit 6 4.0 4.4 2.6 4.5 3.0 4.0 3.9 2.7 4.3 3.7 0.09 Pickering NGS Unit 7 2.8 3.7 4.4 3.1 4.3 3.0 3.6 3.9 2.7 4.3 0.010 Pickering NGS Unit 8 2.2 3.8 2.6 4.3 4.0 2.0 3.9 2.9 4.3 4.3 0.0
11 Total 45.6 40.7 40.9 43.5 43.9 38.3 33.2 30.8 33.3 30.2 21.5
Chart 1Production Forecast Trend - Nuclear By Unit (TWh)
Filed: 2021-04-19 EB-2020-0290
Exhibit L E2-01-Staff-181
Page 1 of 3
Witness Panel: Nuclear Operations & Nuclear Projects
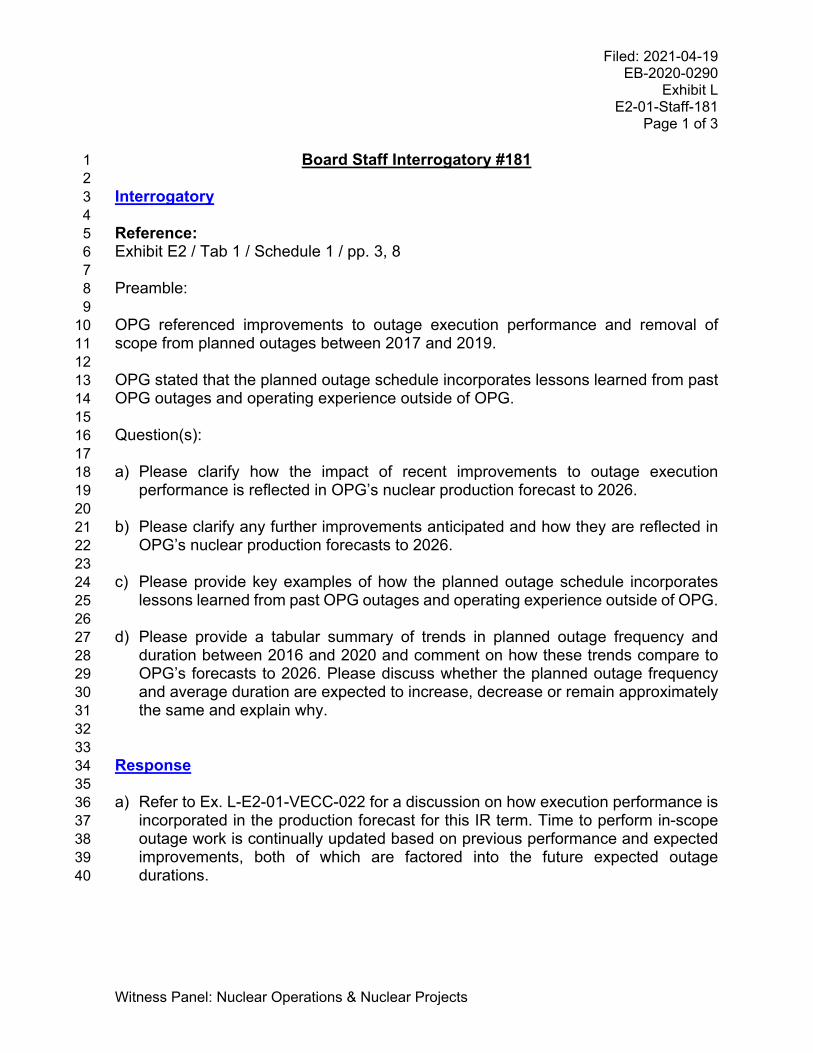
Board Staff Interrogatory #181 1 2
Interrogatory 3 4 Reference: 5 Exhibit E2 / Tab 1 / Schedule 1 / pp. 3, 8 6 7 Preamble: 8 9 OPG referenced improvements to outage execution performance and removal of 10 scope from planned outages between 2017 and 2019. 11 12 OPG stated that the planned outage schedule incorporates lessons learned from past 13 OPG outages and operating experience outside of OPG. 14 15 Question(s): 16 17 a) Please clarify how the impact of recent improvements to outage execution 18
performance is reflected in OPG’s nuclear production forecast to 2026. 19 20
b) Please clarify any further improvements anticipated and how they are reflected in 21 OPG’s nuclear production forecasts to 2026. 22 23
c) Please provide key examples of how the planned outage schedule incorporates 24 lessons learned from past OPG outages and operating experience outside of OPG. 25 26
d) Please provide a tabular summary of trends in planned outage frequency and 27 duration between 2016 and 2020 and comment on how these trends compare to 28 OPG’s forecasts to 2026. Please discuss whether the planned outage frequency 29 and average duration are expected to increase, decrease or remain approximately 30 the same and explain why. 31
32 33 Response 34 35 a) Refer to Ex. L-E2-01-VECC-022 for a discussion on how execution performance is 36
incorporated in the production forecast for this IR term. Time to perform in-scope 37 outage work is continually updated based on previous performance and expected 38 improvements, both of which are factored into the future expected outage 39 durations. 40
Filed: 2021-04-19 EB-2020-0290
Exhibit L E2-01-Staff-181
Page 2 of 3
Witness Panel: Nuclear Operations & Nuclear Projects
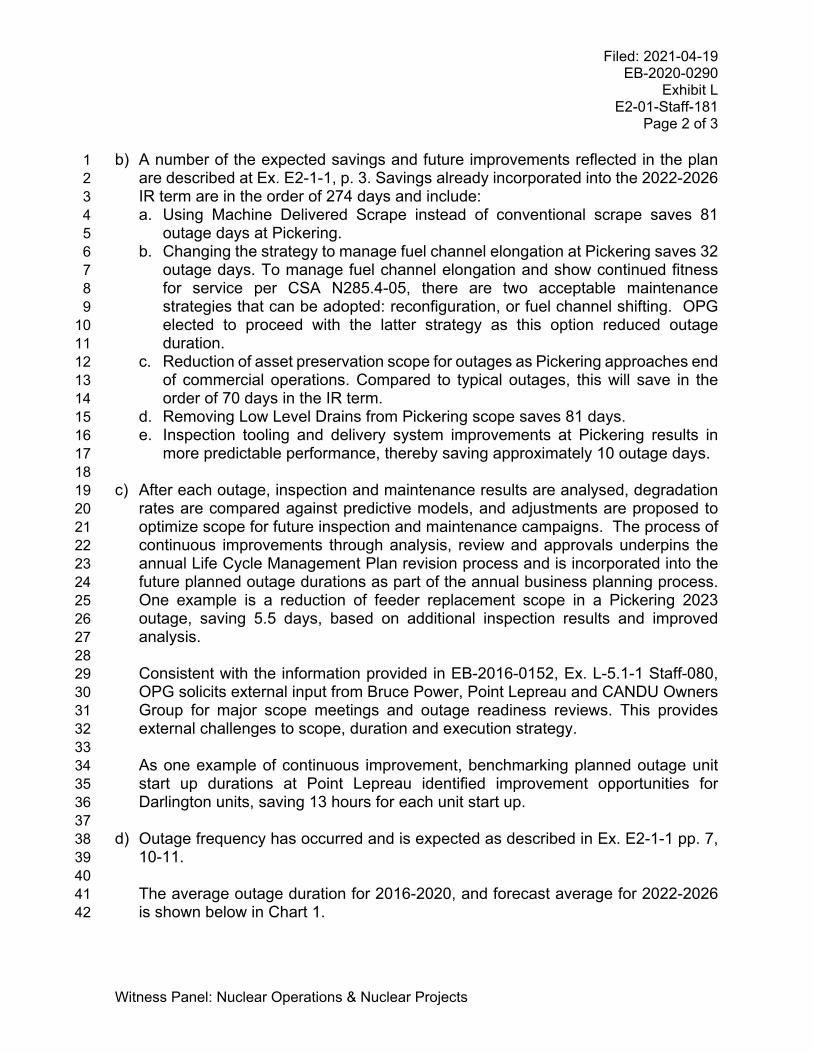
b) A number of the expected savings and future improvements reflected in the plan 1 are described at Ex. E2-1-1, p. 3. Savings already incorporated into the 2022-2026 2 IR term are in the order of 274 days and include: 3 a. Using Machine Delivered Scrape instead of conventional scrape saves 81 4
outage days at Pickering. 5 b. Changing the strategy to manage fuel channel elongation at Pickering saves 32 6
outage days. To manage fuel channel elongation and show continued fitness 7 for service per CSA N285.4-05, there are two acceptable maintenance 8 strategies that can be adopted: reconfiguration, or fuel channel shifting. OPG 9 elected to proceed with the latter strategy as this option reduced outage 10 duration. 11
c. Reduction of asset preservation scope for outages as Pickering approaches end 12 of commercial operations. Compared to typical outages, this will save in the 13 order of 70 days in the IR term. 14
d. Removing Low Level Drains from Pickering scope saves 81 days. 15 e. Inspection tooling and delivery system improvements at Pickering results in 16
more predictable performance, thereby saving approximately 10 outage days. 17 18
c) After each outage, inspection and maintenance results are analysed, degradation 19 rates are compared against predictive models, and adjustments are proposed to 20 optimize scope for future inspection and maintenance campaigns. The process of 21 continuous improvements through analysis, review and approvals underpins the 22 annual Life Cycle Management Plan revision process and is incorporated into the 23 future planned outage durations as part of the annual business planning process. 24 One example is a reduction of feeder replacement scope in a Pickering 2023 25 outage, saving 5.5 days, based on additional inspection results and improved 26 analysis. 27 28 Consistent with the information provided in EB-2016-0152, Ex. L-5.1-1 Staff-080, 29 OPG solicits external input from Bruce Power, Point Lepreau and CANDU Owners 30 Group for major scope meetings and outage readiness reviews. This provides 31 external challenges to scope, duration and execution strategy. 32 33 As one example of continuous improvement, benchmarking planned outage unit 34 start up durations at Point Lepreau identified improvement opportunities for 35 Darlington units, saving 13 hours for each unit start up. 36 37
d) Outage frequency has occurred and is expected as described in Ex. E2-1-1 pp. 7, 38 10-11. 39 40 The average outage duration for 2016-2020, and forecast average for 2022-2026 41 is shown below in Chart 1. 42

Filed: 2021-04-19 EB-2020-0290
Exhibit L E2-01-Staff-181
Page 3 of 3
Witness Panel: Nuclear Operations & Nuclear Projects
Chart 1 - Average Planned Outage Durations by Station (days)
Station Darlington Pickering 2016-2020 (actual) 61.8 123.4 2022-2026 (forecast) 56.7 89.9
1 The average regular cyclical outage duration is expected to decrease at Pickering 2 in 2022-2026 rate term. As the station approaches end of commercial operations, 3 the required asset preservation portion of regular cyclical planned outages is 4 reduced, decreasing outage duration. 5 6 Over the 2022-2026 rate term, the average planned outage duration at Darlington 7 is expected to decrease as all units except for Unit 2 are undergoing refurbishments 8 during that period, and thus are not subject to regular cyclical outages with pre-9 refurbishment scope. They will instead have two shorter post-refurbishment 10 outages each as described in Ex. E2-1-1, p. 6. It is not until after 2026 that regular 11 cyclical planned post-refurbishment outages resume on all units. 12
Filed: 2021-04-19 EB-2020-0290
Exhibit L E2-01-Staff-182
Page 1 of 2
Witness Panel: Nuclear Operations & Nuclear Projects
Board Staff Interrogatory #182 1 2
Interrogatory 3 4 Reference: 5 Exhibit E2 / Tab 1 / Schedule 1 / pp. 4-5 6 Exhibit F2 / Tab 4 / Schedule 1 / p. 9 7 8 Preamble: 9 10 OPG provided examples of unbudgeted planned outages at Pickering NGS and 11 Darlington NGS between 2017 and 2020 and identified the duration of those outages. 12 13 Question(s): 14 15
a) Please provide a table that presents total unbudgeted planned outage days and 16 associated production losses for each year between 2016 and 2020 at each of 17 Pickering NGS and Darlington NGS. 18 19
b) Please confirm that unbudgeted planned outages are not included in the 20 proposed 2022-2026 revenue requirement. 21
22 23
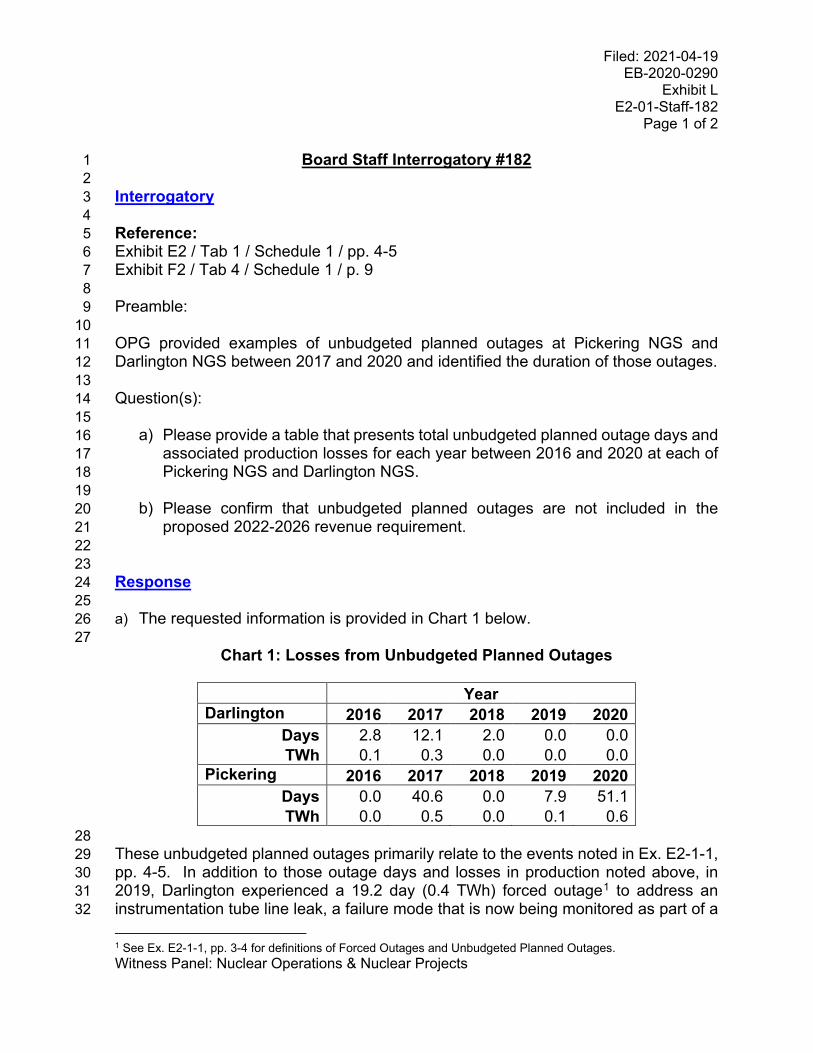
Response 24 25 a) The requested information is provided in Chart 1 below. 26 27
Chart 1: Losses from Unbudgeted Planned Outages
Year Darlington 2016 2017 2018 2019 2020
Days 2.8 12.1 2.0 0.0 0.0 TWh 0.1 0.3 0.0 0.0 0.0
Pickering 2016 2017 2018 2019 2020 Days 0.0 40.6 0.0 7.9 51.1 TWh 0.0 0.5 0.0 0.1 0.6
28 These unbudgeted planned outages primarily relate to the events noted in Ex. E2-1-1, 29 pp. 4-5. In addition to those outage days and losses in production noted above, in 30 2019, Darlington experienced a 19.2 day (0.4 TWh) forced outage1 to address an 31 instrumentation tube line leak, a failure mode that is now being monitored as part of a 32 1 See Ex. E2-1-1, pp. 3-4 for definitions of Forced Outages and Unbudgeted Planned Outages.

Filed: 2021-04-19 EB-2020-0290
Exhibit L E2-01-Staff-182
Page 2 of 2
Witness Panel: Nuclear Operations & Nuclear Projects
“run to maintenance” strategy prior to Unit refurbishment. So far in 2021, Pickering has 1 experienced 25.7 day (0.3 TWh) of unbudgeted planned outages, primarily to address 2 heat transport system leaks. 3 4 b) Confirmed. 5
Filed: 2021-04-19 EB-2020-0290
Exhibit L E2-01-Staff-183
Page 1 of 1
Witness Panel: Nuclear Operations & Nuclear Projects
Board Staff Interrogatory #183 1 2
Interrogatory 3 4 Reference: 5 Exhibit E2 / Tab 1 / Schedule 1 / p. 6 6 7 Preamble: 8 9 OPG stated that the extended operation of Units 1 and 4 from 2022 to 2024 results in 10 202.8 additional planned outage days and that the extended operation of Units 5-8 11 from 2024 to 2025 results in an additional 100.8 days at Unit 5. 12 13 Question(s): 14 15
a) Please estimate the production loss associated with these additional outage 16 days. 17 18
b) Please estimate the production gain associated with extended operation of 19 Units 1 and 4 from 2022 to 2024 and extended operation of Units 5-8 from 2024 20 to 2025. How does the production gain compare to the production loss required 21 to achieve it? 22
23 24 Response 25 26 a) The forecast production loss associated with the referenced planned outages is 27
approximately 3.8 TWh, including 2.6 TWh of production loss associated with the 28 two outages added in the pre-extension period. The third outage is in the period of 29 extended operation and as such does not result in incremental production loss. 30
31 b) The estimated net production gain inclusive of the production loss associated with 32
additional planned outages is approximately 29.1 TWh. The combined production 33 gain is more than eleven times the pre-extension period production loss required to 34 achieve it. 35
Filed: 2021-04-19 EB-2020-0290
Exhibit L E2-01-Staff-184
Page 1 of 2
Witness Panel: Nuclear Operations & Nuclear Projects
Board Staff Interrogatory #184 1 2
Interrogatory 3 4 Reference: 5 Exhibit E2 / Tab 1 / Schedule 1 / p. 6 6 7 Preamble: 8 9 OPG’s proposed planned derates at Pickering NGS, which will allow additional online 10 maintenance time to address a major contributor to station forced loss rate (FLR). 11 12 Question(s): 13 14 a) Please clarify how the planned derates allow for additional online maintenance. 15
16 b) Please clarify the connection between fuel handling equipment performance and 17
Pickering NGS reliability. 18 19
c) How have the planned derates been reflected in OPG’s FLR forecast for Pickering 20 NGS (i.e. has the FLR forecast been reduced as a result and by how much)? 21
22 23 Response 24 25 a) By design, CANDU nuclear units generally require daily online refueling to maintain 26
full power output. Fueling machines need to be well-maintained to perform online 27 refueling in order to avoid forced derates and outages as a result of fuel handling 28 machine unavailability. 29 30 Having planned derates of nuclear units allows the units to remain online but run at 31 a lower power output. This allows for longer periods of fueling machine 32 unavailability for planned maintenance, providing a longer duration for preventative 33 maintenance work on the fueling machine. This planned preventative maintenance 34 improves fueling machine reliability, which minimizes the occurrence of more 35 significant forced derates and nuclear unit shutdowns. 36 37 For additional context, any fueling machine maintenance performed during a unit 38 outage would extend the outage by the maintenance duration. Each unit outage 39 requires extensive support from a fueling machine in order to perform inspection 40 and maintenance activities of fuel channels, while the remaining machines are used 41 to fuel the online units. Therefore, it is more efficient to complete fueling machine 42

Filed: 2021-04-19 EB-2020-0290
Exhibit L E2-01-Staff-184
Page 2 of 2
Witness Panel: Nuclear Operations & Nuclear Projects
maintenance while the unit is online and derated, as opposed to when the unit is 1 shut down. 2
3 b) Yearly production losses attributed to derates and nuclear unit shutdowns as a 4
result of fuel handling systems issues have been a major contributor to Pickering’s 5 actual FLR. 6 7
c) Ensuring fuel handling system reliability through this additional planned 8 maintenance is an important part of OPG’s overall strategy in achieving Pickering’s 9 3.5% FLR target for the 2022-2026 IR term. For further discussion on how the FLR 10 targets are set, refer to Ex. L-E2-01-Energy Probe-051. 11
Filed: 2021-04-19 EB-2020-0290
Exhibit L E2-01-Staff-185
Page 1 of 2
Witness Panel: Nuclear Operations & Nuclear Projects
Board Staff Interrogatory #185 1 2
Interrogatory 3 4 Reference: 5 Exhibit E2 / Tab 1 / Schedule 1 / p. 14 6 7 Preamble: 8 9 OPG’s projected FLR for Darlington NGS units returning to service after refurbishment 10 is 12.0% for the first year, 6.0% for the second year, 2.0% for the third year and 11 returning to the 1.0% target thereafter. OPG stated that this three-year FLR schedule 12 is based on industry operating experience. 13 14 Question(s): 15 16 a) What was the FLR of Darlington NGS Unit 2 in its first year or year-to-date following 17
refurbishment outage? How many outage days was that FLR equivalent to? 18 19
b) Please provide FLR statistics from industry operating experience that support 20 OPG’s projected three-year FLR schedule for Darlington NGS units returning from 21 refurbishment outage. 22 23
c) How many outage days will OPG’s three-year FLR schedule equate to for Units 1,3 24 and 4 in each applicable year? How does this compare to the outage days 25 associated with OPG’s longer-term 1% FLR target for Darlington NGS? 26
27 28 Response 29 30 a) Since returning to service in June 2020, Darlington NGS Unit 2 has averaged 9.4% 31
FLR (25.5 equivalent days) up to February 2021. 32 33
b) The FLR statistics from industry operating experience (“OPEX”) are in the 14%-34 30% range during the first full year of operation post refurbishments. These also 35 show a 3 year average in the 8%-35% range. Experience from Pickering, Bruce 36 Power and Point Lepreau informed Darlington’s three year post-refurbishment unit 37 FLR targets: 38

Filed: 2021-04-19 EB-2020-0290
Exhibit L E2-01-Staff-185
Page 2 of 2
Witness Panel: Nuclear Operations & Nuclear Projects
Chart 1 – Post-refurbishment OPEX 1 2
3 4 The FLR targets post-refurbishment and the duration of the post-refurbishment 5 outages together reflect better than industry OPEX as captured in the chart above. 6
7 c) For the units returning to service in the 2022-2026 rate term, the FLR equivalent 8
days based on the referenced three-year FLR schedule is as shown in Chart 2. 9 10
Chart 2 - Darlington Unit Post Refurbishment FLR Equivalent Days
Year Unit 2022 2023 2024 2025 2026 U3 0 0 34.5 20.0 6.9 U1 0 0 0.0 24.4 27.2 U4 0 0 0.0 0.0 9.2
11 Once the Darlington units return to the targeted FLR of 1% upon returning to stable 12 operations post-refurbishment, each unit is expected to average 3.4 FLR equivalent 13 days per year. 14
FLR Performance (%) Industry Yr 1(Full Yr) 3-Yr Avg
External Plant Unit X 22.63 14.63
External Plant Unit Y 14.43 7.84
External Plant Unit Z 18.05 8.65
Pickering 1 19.09 35.68
Pickering 4 29.68 27.25
Post-Refurb FLR
Filed: 2021-04-19 EB-2020-0290
Exhibit L E2-01-Staff-186
Page 1 of 2
Witness Panel: Nuclear Operations & Nuclear Projects
Board Staff Interrogatory #186 1 2
Interrogatory 3 4 Reference: 5 Exhibit E2 / Tab 1 / Schedule 2 / p. 8 6 Exhibit E2 / Tab 1 / Schedule 2 / Tables 1a and 1b 7 8 Preamble: 9 10 OPG stated that the 2020 Budget reflects a 3.5% FLR target at Pickering NGS, 11 whereas the 2019 actual FLR was 1.6%. 12 13 Based on the data presented in Table 1a at Exhibit E2 / Tab 1 / Schedule 2, OEB staff 14 calculates that between 2016 and 2020, Pickering NGS’s actual cumulative FLR days 15 equivalent was approximately 16.3% lower (96 days equivalent) than approved / 16 budgeted (including the 2020 budgeted value). 17 18 Question(s): 19 20 a) Please explain why OPG proposed a 3.5% Pickering NGS FLR in its production 21
forecast for the 2022-2026 Custom IR term given that 3.5% would represent a near 22 doubling of the 2019 actual FLR and given that OPG has generally tended to over 23 forecast the Pickering NGS FLR in recent years. 24
25 Response 26 27 Pickering’s actual cumulative FLR days using the methodology described above is 28 16.3% lower than forecast, however this represents 69.1 days equivalent, not 96.0 29 days equivalent. 30 31 OPG’s generation plan methodology forecasts FLR targets that reflect the risk of forced 32 production losses at Darlington and Pickering. The FLR targets are based on the plants 33 historical performance, any known improvements or component condition issues and 34 initiatives to improve equipment reliability (Ex. E2-1-1, p. 12). Reliance on a single year 35 of exceptional performance as the basis for the 2022-2026 generation plan forecast of 36 FLR would be inappropriate. 37 38 Based on historical performance, the average FLR for Pickering is 5.0% over 2014-39 2019, as shown in Ex. E2-1-1, p. 12, Chart 3. For the period 2016-2020 actuals, the 40 average is 3.8%. 41
Filed: 2021-04-19 EB-2020-0290
Exhibit L E2-01-Staff-186
Page 2 of 2
Witness Panel: Nuclear Operations & Nuclear Projects
In setting the FLR targets, OPG additionally reviewed known improvements, 1 component condition issues and initiatives to improve equipment reliability. As such, 2 the target FLR in the 2020-2026 generation plan takes into account the 2015-2019 3 equipment reliability initiatives at both Pickering and Darlington that successfully: 4 5 • improved component life cycle management plan execution, 6 • improved preventative maintenance program, 7 • developed effective equipment reliability tools, and 8 • developed a leading system health program (Ex. F2-1-1, Attachment 6). 9
10 These initiatives have allowed OPG to lower its forecast of FLR to 3.5% at Pickering 11 over the period 2022-2026. 12

Filed: 2021-04-19 EB-2020-0290
Exhibit L E2-01-Staff-187
Page 1 of 2
Witness Panel: Nuclear Operations & Nuclear Projects
Board Staff Interrogatory #187 1 2
Interrogatory 3 4 Reference: 5 Exhibit E2 / Tab 1 / Schedule 1 / p. 5 6 7 Preamble: 8 9 OPG stated that in response to the COVID-19 pandemic, OPG revised the schedule 10 for the DRP by deferring the Unit 3 refurbishment outage to start in September 2020, 11 to be followed by Unit 1 in 2022, and Unit 4 in 2023. 12 13 Question(s): 14 15
a) For the period 2020 through 2026, please provide a table which shows: (i) 16 annual Darlington NGS production per the revised DRP schedule developed by 17 OPG in response to the COVID-19 pandemic; (ii) annual OEB-approved 18 production amounts for 2020 and 2021, and previously forecasted production 19 for the years 2022 through 2026 (i.e. forecasted by OPG before it revised the 20 DRP schedule in response to the COVID-19 pandemic); and (iii) differences 21 between (i) and (ii). 22 23
b) If changes were also made to OPG’s Pickering NGS production forecast as a 24 result of the COVID-19 pandemic, please also develop a similar table for 25 Pickering NGS. Otherwise, please confirm that OPG’s production forecast for 26 Pickering NGS was unaffected by the COVID-19 pandemic. 27
28 29 Response 30 31
a) The requested information is provided in Chart 1: 32 33
Chart 1: Darlington NGS Production Impacts for 2020-2021, COVID-19 Impacts for 2022-2026
TWh 2020 2021 2022 2023 2024 2025 2026
i 23.3 16.9 13.4 9.6 12.0 13.5 21.5 ii 17.7 16.6 12.5 9.5 12.3 15.8 24.1 iii 5.6 0.3 0.9 0.1 -0.3 -2.3 -2.6
34 The difference (iii) for 2020 and 2021 captures additional sources of variance 35 than the specific impact of OPG’s response to COVID-19. These specific 36
Filed: 2021-04-19 EB-2020-0290
Exhibit L E2-01-Staff-187
Page 2 of 2
Witness Panel: Nuclear Operations & Nuclear Projects
impacts (4.3 TWh in 2020 and -2.1 TWh in 2021) can be found at Ex. L-E2-01-1 SEC-114. 2
3 b) The actual impact of COVID-19 in 2020 at Pickering NGS is a 0.1 TWh decrease 4
in production as a result of longer single outage duration due to the pandemic. 5 There are no COVID-19 impacts at Pickering NGS in the 2021-2026 production 6 forecast period. 7

Filed: 2021-04-19 EB-2020-0290
Exhibit L E2-01-Staff-188
Page 1 of 1
Witness Panel: Nuclear Operations & Nuclear Projects
Board Staff Interrogatory #188 1 2
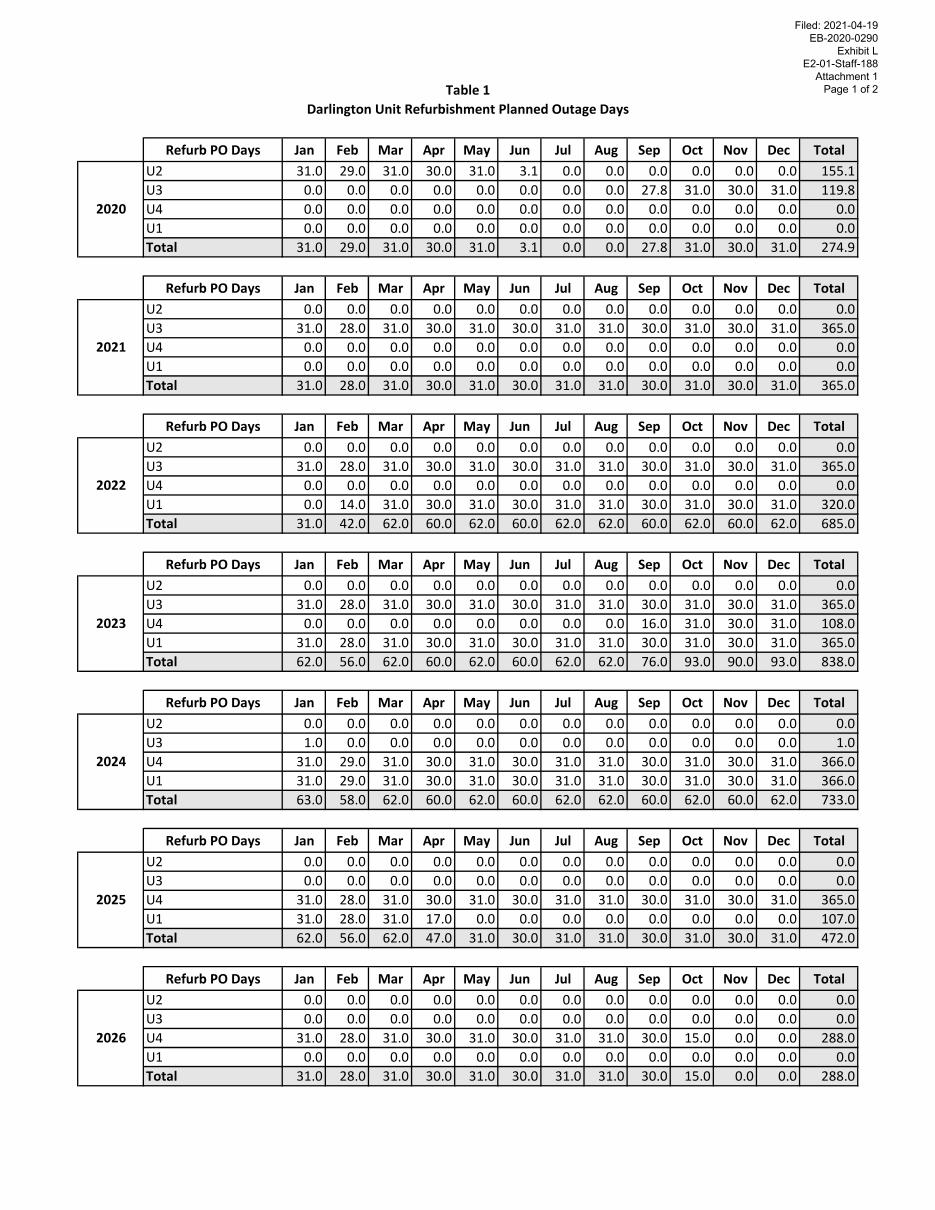
Interrogatory 3 4 Reference: 5 Exhibit E2 / Tab 1 / Schedule 1 6 7 Question(s): 8 9 a) For each year between 2020 and 2026, please prepare a table such as the one 10
below that shows monthly Refurb PO Days for each Darlington NGS unit. Please 11 also show monthly totals. 12
13 Jan Feb Mar Apr May Jun Jul Aug Sep Oct Nov Dec Total
2020
U2 Refurb PO Days
U3 Refurb PO Days
U4 Refurb PO Days
U1 Refurb PO Days
Total Darlington Refurb PO Days
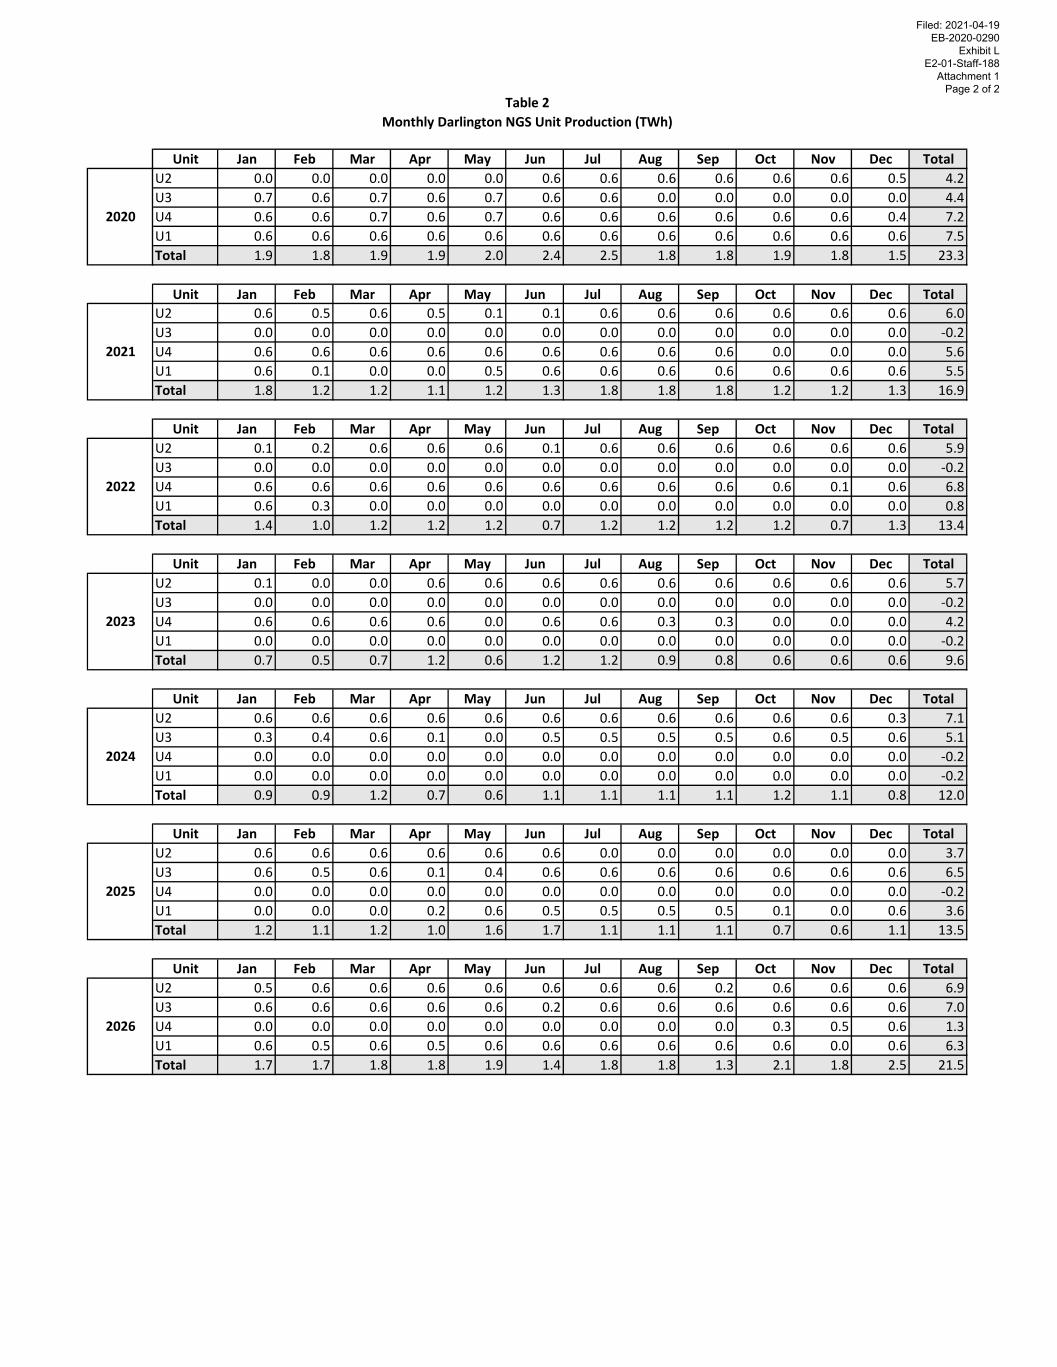
14 b) For each year between 2020 and 2026, please prepare a table such as the one 15
below that shows monthly production for each Darlington NGS unit. Please also 16 show monthly totals. 17
18 Jan Feb Mar Apr May Jun Jul Aug Sep Oct Nov Dec Total
2020
U2 GWh U3 GWh U4 GWh U1 GWh Total Darlington GWh
19 20 Response 21 22 a) See Attachment 1, Table 1. 23
24 b) See Attachment 1, Table 2. 25
Refurb PO Days Jan Feb Mar Apr May Jun Jul Aug Sep Oct Nov Dec TotalU2 31.0 29.0 31.0 30.0 31.0 3.1 0.0 0.0 0.0 0.0 0.0 0.0 155.1U3 0.0 0.0 0.0 0.0 0.0 0.0 0.0 0.0 27.8 31.0 30.0 31.0 119.8U4 0.0 0.0 0.0 0.0 0.0 0.0 0.0 0.0 0.0 0.0 0.0 0.0 0.0U1 0.0 0.0 0.0 0.0 0.0 0.0 0.0 0.0 0.0 0.0 0.0 0.0 0.0Total 31.0 29.0 31.0 30.0 31.0 3.1 0.0 0.0 27.8 31.0 30.0 31.0 274.9
Refurb PO Days Jan Feb Mar Apr May Jun Jul Aug Sep Oct Nov Dec TotalU2 0.0 0.0 0.0 0.0 0.0 0.0 0.0 0.0 0.0 0.0 0.0 0.0 0.0U3 31.0 28.0 31.0 30.0 31.0 30.0 31.0 31.0 30.0 31.0 30.0 31.0 365.0U4 0.0 0.0 0.0 0.0 0.0 0.0 0.0 0.0 0.0 0.0 0.0 0.0 0.0U1 0.0 0.0 0.0 0.0 0.0 0.0 0.0 0.0 0.0 0.0 0.0 0.0 0.0Total 31.0 28.0 31.0 30.0 31.0 30.0 31.0 31.0 30.0 31.0 30.0 31.0 365.0
Refurb PO Days Jan Feb Mar Apr May Jun Jul Aug Sep Oct Nov Dec TotalU2 0.0 0.0 0.0 0.0 0.0 0.0 0.0 0.0 0.0 0.0 0.0 0.0 0.0U3 31.0 28.0 31.0 30.0 31.0 30.0 31.0 31.0 30.0 31.0 30.0 31.0 365.0U4 0.0 0.0 0.0 0.0 0.0 0.0 0.0 0.0 0.0 0.0 0.0 0.0 0.0U1 0.0 14.0 31.0 30.0 31.0 30.0 31.0 31.0 30.0 31.0 30.0 31.0 320.0Total 31.0 42.0 62.0 60.0 62.0 60.0 62.0 62.0 60.0 62.0 60.0 62.0 685.0
Refurb PO Days Jan Feb Mar Apr May Jun Jul Aug Sep Oct Nov Dec TotalU2 0.0 0.0 0.0 0.0 0.0 0.0 0.0 0.0 0.0 0.0 0.0 0.0 0.0U3 31.0 28.0 31.0 30.0 31.0 30.0 31.0 31.0 30.0 31.0 30.0 31.0 365.0U4 0.0 0.0 0.0 0.0 0.0 0.0 0.0 0.0 16.0 31.0 30.0 31.0 108.0U1 31.0 28.0 31.0 30.0 31.0 30.0 31.0 31.0 30.0 31.0 30.0 31.0 365.0Total 62.0 56.0 62.0 60.0 62.0 60.0 62.0 62.0 76.0 93.0 90.0 93.0 838.0
Refurb PO Days Jan Feb Mar Apr May Jun Jul Aug Sep Oct Nov Dec TotalU2 0.0 0.0 0.0 0.0 0.0 0.0 0.0 0.0 0.0 0.0 0.0 0.0 0.0U3 1.0 0.0 0.0 0.0 0.0 0.0 0.0 0.0 0.0 0.0 0.0 0.0 1.0U4 31.0 29.0 31.0 30.0 31.0 30.0 31.0 31.0 30.0 31.0 30.0 31.0 366.0U1 31.0 29.0 31.0 30.0 31.0 30.0 31.0 31.0 30.0 31.0 30.0 31.0 366.0Total 63.0 58.0 62.0 60.0 62.0 60.0 62.0 62.0 60.0 62.0 60.0 62.0 733.0
Refurb PO Days Jan Feb Mar Apr May Jun Jul Aug Sep Oct Nov Dec TotalU2 0.0 0.0 0.0 0.0 0.0 0.0 0.0 0.0 0.0 0.0 0.0 0.0 0.0U3 0.0 0.0 0.0 0.0 0.0 0.0 0.0 0.0 0.0 0.0 0.0 0.0 0.0U4 31.0 28.0 31.0 30.0 31.0 30.0 31.0 31.0 30.0 31.0 30.0 31.0 365.0U1 31.0 28.0 31.0 17.0 0.0 0.0 0.0 0.0 0.0 0.0 0.0 0.0 107.0Total 62.0 56.0 62.0 47.0 31.0 30.0 31.0 31.0 30.0 31.0 30.0 31.0 472.0
Refurb PO Days Jan Feb Mar Apr May Jun Jul Aug Sep Oct Nov Dec TotalU2 0.0 0.0 0.0 0.0 0.0 0.0 0.0 0.0 0.0 0.0 0.0 0.0 0.0U3 0.0 0.0 0.0 0.0 0.0 0.0 0.0 0.0 0.0 0.0 0.0 0.0 0.0U4 31.0 28.0 31.0 30.0 31.0 30.0 31.0 31.0 30.0 15.0 0.0 0.0 288.0U1 0.0 0.0 0.0 0.0 0.0 0.0 0.0 0.0 0.0 0.0 0.0 0.0 0.0Total 31.0 28.0 31.0 30.0 31.0 30.0 31.0 31.0 30.0 15.0 0.0 0.0 288.0
Table 1Darlington Unit Refurbishment Planned Outage Days
2026
2020
2021
2022
2023
2024
2025
Filed: 2021-04-19 EB-2020-0290
Exhibit L E2-01-Staff-188
Attachment 1 Page 1 of 2
Unit Jan Feb Mar Apr May Jun Jul Aug Sep Oct Nov Dec TotalU2 0.0 0.0 0.0 0.0 0.0 0.6 0.6 0.6 0.6 0.6 0.6 0.5 4.2U3 0.7 0.6 0.7 0.6 0.7 0.6 0.6 0.0 0.0 0.0 0.0 0.0 4.4U4 0.6 0.6 0.7 0.6 0.7 0.6 0.6 0.6 0.6 0.6 0.6 0.4 7.2U1 0.6 0.6 0.6 0.6 0.6 0.6 0.6 0.6 0.6 0.6 0.6 0.6 7.5Total 1.9 1.8 1.9 1.9 2.0 2.4 2.5 1.8 1.8 1.9 1.8 1.5 23.3
Unit Jan Feb Mar Apr May Jun Jul Aug Sep Oct Nov Dec TotalU2 0.6 0.5 0.6 0.5 0.1 0.1 0.6 0.6 0.6 0.6 0.6 0.6 6.0U3 0.0 0.0 0.0 0.0 0.0 0.0 0.0 0.0 0.0 0.0 0.0 0.0 -0.2U4 0.6 0.6 0.6 0.6 0.6 0.6 0.6 0.6 0.6 0.0 0.0 0.0 5.6U1 0.6 0.1 0.0 0.0 0.5 0.6 0.6 0.6 0.6 0.6 0.6 0.6 5.5Total 1.8 1.2 1.2 1.1 1.2 1.3 1.8 1.8 1.8 1.2 1.2 1.3 16.9
Unit Jan Feb Mar Apr May Jun Jul Aug Sep Oct Nov Dec TotalU2 0.1 0.2 0.6 0.6 0.6 0.1 0.6 0.6 0.6 0.6 0.6 0.6 5.9U3 0.0 0.0 0.0 0.0 0.0 0.0 0.0 0.0 0.0 0.0 0.0 0.0 -0.2U4 0.6 0.6 0.6 0.6 0.6 0.6 0.6 0.6 0.6 0.6 0.1 0.6 6.8U1 0.6 0.3 0.0 0.0 0.0 0.0 0.0 0.0 0.0 0.0 0.0 0.0 0.8Total 1.4 1.0 1.2 1.2 1.2 0.7 1.2 1.2 1.2 1.2 0.7 1.3 13.4
Unit Jan Feb Mar Apr May Jun Jul Aug Sep Oct Nov Dec TotalU2 0.1 0.0 0.0 0.6 0.6 0.6 0.6 0.6 0.6 0.6 0.6 0.6 5.7U3 0.0 0.0 0.0 0.0 0.0 0.0 0.0 0.0 0.0 0.0 0.0 0.0 -0.2U4 0.6 0.6 0.6 0.6 0.0 0.6 0.6 0.3 0.3 0.0 0.0 0.0 4.2U1 0.0 0.0 0.0 0.0 0.0 0.0 0.0 0.0 0.0 0.0 0.0 0.0 -0.2Total 0.7 0.5 0.7 1.2 0.6 1.2 1.2 0.9 0.8 0.6 0.6 0.6 9.6
Unit Jan Feb Mar Apr May Jun Jul Aug Sep Oct Nov Dec TotalU2 0.6 0.6 0.6 0.6 0.6 0.6 0.6 0.6 0.6 0.6 0.6 0.3 7.1U3 0.3 0.4 0.6 0.1 0.0 0.5 0.5 0.5 0.5 0.6 0.5 0.6 5.1U4 0.0 0.0 0.0 0.0 0.0 0.0 0.0 0.0 0.0 0.0 0.0 0.0 -0.2U1 0.0 0.0 0.0 0.0 0.0 0.0 0.0 0.0 0.0 0.0 0.0 0.0 -0.2Total 0.9 0.9 1.2 0.7 0.6 1.1 1.1 1.1 1.1 1.2 1.1 0.8 12.0
Unit Jan Feb Mar Apr May Jun Jul Aug Sep Oct Nov Dec TotalU2 0.6 0.6 0.6 0.6 0.6 0.6 0.0 0.0 0.0 0.0 0.0 0.0 3.7U3 0.6 0.5 0.6 0.1 0.4 0.6 0.6 0.6 0.6 0.6 0.6 0.6 6.5U4 0.0 0.0 0.0 0.0 0.0 0.0 0.0 0.0 0.0 0.0 0.0 0.0 -0.2U1 0.0 0.0 0.0 0.2 0.6 0.5 0.5 0.5 0.5 0.1 0.0 0.6 3.6Total 1.2 1.1 1.2 1.0 1.6 1.7 1.1 1.1 1.1 0.7 0.6 1.1 13.5
Unit Jan Feb Mar Apr May Jun Jul Aug Sep Oct Nov Dec TotalU2 0.5 0.6 0.6 0.6 0.6 0.6 0.6 0.6 0.2 0.6 0.6 0.6 6.9U3 0.6 0.6 0.6 0.6 0.6 0.2 0.6 0.6 0.6 0.6 0.6 0.6 7.0U4 0.0 0.0 0.0 0.0 0.0 0.0 0.0 0.0 0.0 0.3 0.5 0.6 1.3U1 0.6 0.5 0.6 0.5 0.6 0.6 0.6 0.6 0.6 0.6 0.0 0.6 6.3Total 1.7 1.7 1.8 1.8 1.9 1.4 1.8 1.8 1.3 2.1 1.8 2.5 21.5
Table 2Monthly Darlington NGS Unit Production (TWh)
2026
2020
2021
2022
2023
2024
2025
Filed: 2021-04-19 EB-2020-0290
Exhibit L E2-01-Staff-188
Attachment 1 Page 2 of 2
Filed: 2021-04-19 EB-2020-0290
Exhibit L E2-01-Staff-189
Page 1 of 1
Witness Panel: Nuclear Operations & Nuclear Projects
Board Staff Interrogatory #189 1 2
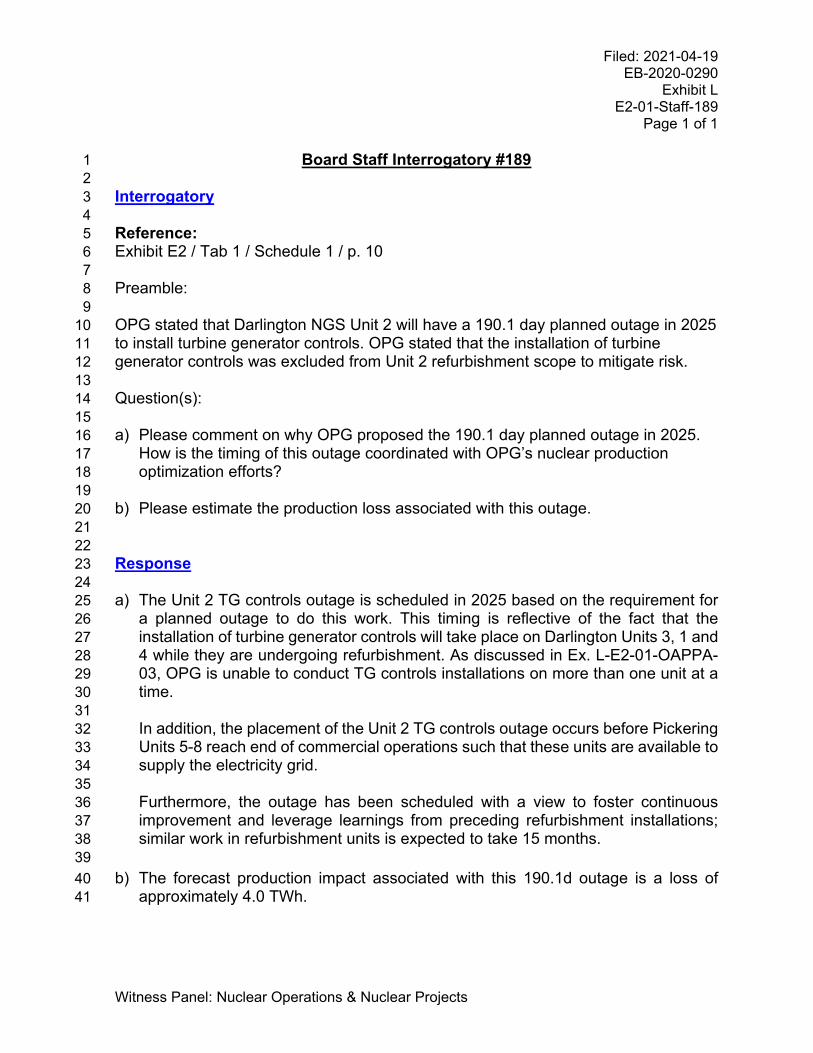
Interrogatory 3 4 Reference: 5 Exhibit E2 / Tab 1 / Schedule 1 / p. 10 6 7 Preamble: 8 9 OPG stated that Darlington NGS Unit 2 will have a 190.1 day planned outage in 2025 10 to install turbine generator controls. OPG stated that the installation of turbine 11 generator controls was excluded from Unit 2 refurbishment scope to mitigate risk. 12 13 Question(s): 14 15 a) Please comment on why OPG proposed the 190.1 day planned outage in 2025. 16
How is the timing of this outage coordinated with OPG’s nuclear production 17 optimization efforts? 18 19
b) Please estimate the production loss associated with this outage. 20 21
22 Response 23 24 a) The Unit 2 TG controls outage is scheduled in 2025 based on the requirement for 25
a planned outage to do this work. This timing is reflective of the fact that the 26 installation of turbine generator controls will take place on Darlington Units 3, 1 and 27 4 while they are undergoing refurbishment. As discussed in Ex. L-E2-01-OAPPA-28 03, OPG is unable to conduct TG controls installations on more than one unit at a 29 time. 30 31 In addition, the placement of the Unit 2 TG controls outage occurs before Pickering 32 Units 5-8 reach end of commercial operations such that these units are available to 33 supply the electricity grid. 34 35 Furthermore, the outage has been scheduled with a view to foster continuous 36 improvement and leverage learnings from preceding refurbishment installations; 37 similar work in refurbishment units is expected to take 15 months. 38 39
b) The forecast production impact associated with this 190.1d outage is a loss of 40 approximately 4.0 TWh. 41

Filed: 2021-04-19 EB-2020-0290
Exhibit L E2-01-Staff-190
Page 1 of 2
Witness Panel: Nuclear Operations & Nuclear Projects
Board Staff Interrogatory #190 1 2
Interrogatory 3 4 Reference: 5 Exhibit E2 / Tab 1 / Schedule 1 / pp. 11-12 6 7 OPG noted that it plans to take a Pickering Vacuum Building Outage (VBO) in 2022. 8 OPG stated that it is investigating the use of technology that, subject to CSNC 9 approval, may allow OPG to reduce the duration of the planned 2022 VBO. 10 11 OPG noted that it expects to seek the CNSC’s approval in the first quarter of 2021. 12 OPG stated that it will update its application should there be any resulting material 13 change related to the 2022 VBO. Absent CNSC approval, OPG must plan to execute 14 the 2022 VBO over the currently scheduled duration. 15 16 Question(s): 17 18 a) Please estimate the production loss associated with the planned 2022 VBO. 19
20 b) Please estimate the likely impact of the technology referenced above, if approved 21
by CNSC, on the duration and production loss of the 2022 VBO. 22 23
c) Please provide an update on the CNSC approval and discuss whether OPG 24 expects to update its application to reflect a shorter 2022 VBO. Please discuss 25 the potential timing of this update. 26 27
28 Response 29 30 (a) See Ex. L-E2-01-CCC-44, part e). 31
32 (b) OPG is unable to provide an estimate of reduced duration (and production loss) 33
resulting from the technology referenced above. This is a first of a kind proposal 34 for the CNSC and as such carries a high degree of uncertainty for approval. The 35 CNSC must decide, for each of the required VBO scope elements, if OPG’s 36 alternative assessment and inspection strategies meet licensing requirements. 37 38
(c) OPG intends to begin submitting a series of requests to CNSC in second quarter 39 2021 seeking to credit alternative assessment and inspection strategies for 40 required VBO scope elements. It is anticipated that the CNSC will provide 41 a decision by early 2022. 42
Filed: 2021-04-19 EB-2020-0290
Exhibit L E2-01-Staff-190
Page 2 of 2
Witness Panel: Nuclear Operations & Nuclear Projects
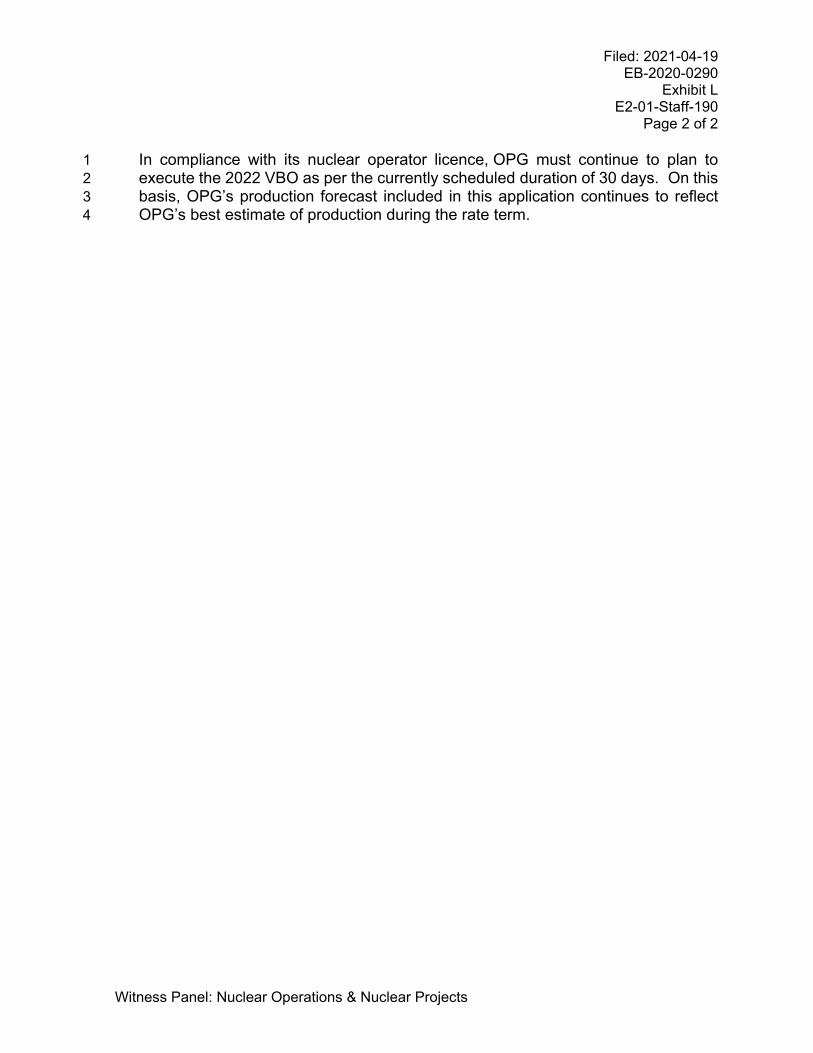
In compliance with its nuclear operator licence, OPG must continue to plan to 1 execute the 2022 VBO as per the currently scheduled duration of 30 days. On this 2 basis, OPG’s production forecast included in this application continues to reflect 3 OPG’s best estimate of production during the rate term. 4

Filed: 2021-04-19 EB-2020-0290
Exhibit L E2-01-Staff-191
Page 1 of 4
Witness Panel: Nuclear Operations & Nuclear Projects
Board Staff Interrogatory #191 1 2
Interrogatory 3 4 Reference: 5 Exhibit E2 / Tab 1 / Schedule 1 / p. 12 6 7 Question(s): 8 9
a) Please provide a tabular summary of trends in production losses per forced 10 outage between 2016 and 2020 and comment on how these trends compare 11 to OPG’s forecasts to 2026. Please discuss whether production losses per 12 forced outage are expected to increase, decrease or remain approximately the 13 same and explain why. 14
15 16 Response 17 18 Refer to Chart 1 below. 19 20
21
Year Station Forced Outage Days
GWh Lost
# Forced Outages
GWh lost / forced outage
DN 17.5 368.8 6 61.5PN 27.6 341.5 6 56.9
Total 45.1 710.2 12 59.2DN 13.0 273.9 5 54.8PN 57.1 706.4 8 88.3
Total 70.1 980.4 13 75.4DN 6.7 141.2 3 47.1PN 69.1 854.7 9 95.0
Total 75.8 995.8 12 83.0DN 44.0 927.2 3 309.1PN 12.5 154.7 3 51.6
Total 56.5 1081.8 6 180.3DN 2.0 42.1 1 42.1PN 25.0 308.7 4 77.2
Total 27.0 350.8 5 70.2DN 16.6 350.6 3.6 97.4PN 38.2 473.2 6.0 78.9
Total 54.9 823.8 9.6 85.8
Yearly Average
Chart 1 - OPG Forced Outage Trends 2016 - 2020
2016
2020
2019
2018
2017
Filed: 2021-04-19 EB-2020-0290
Exhibit L E2-01-Staff-191
Page 2 of 4
Witness Panel: Nuclear Operations & Nuclear Projects
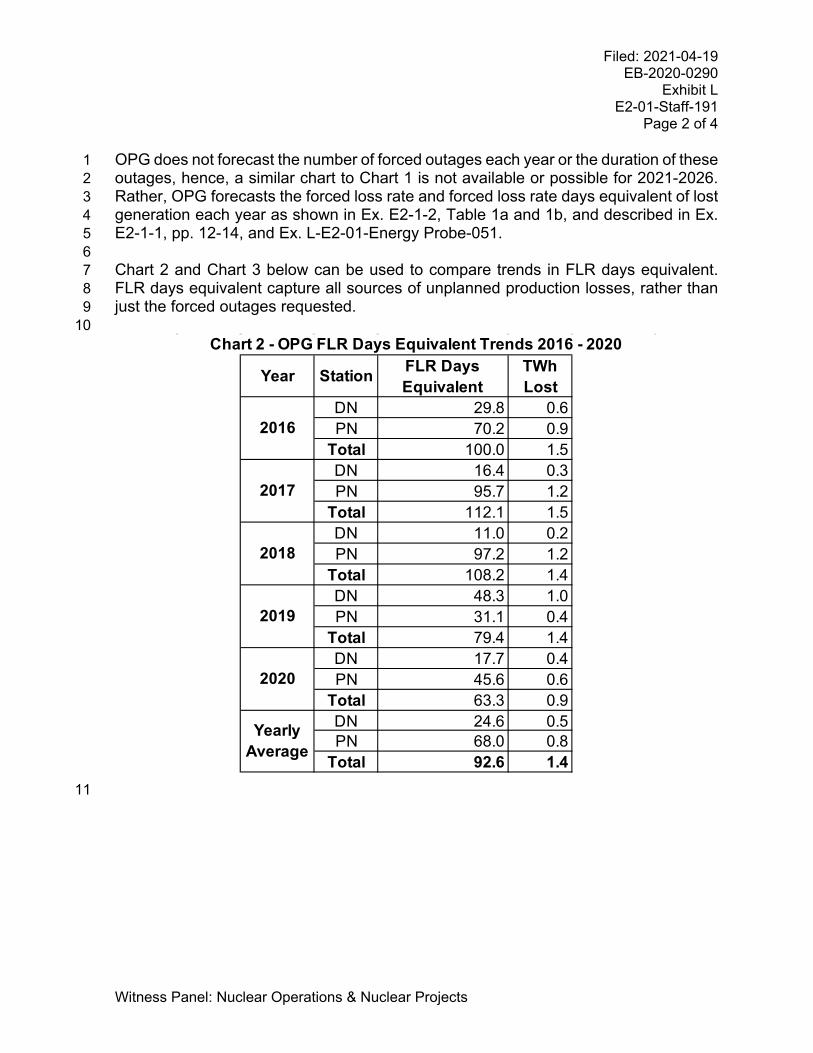
OPG does not forecast the number of forced outages each year or the duration of these 1 outages, hence, a similar chart to Chart 1 is not available or possible for 2021-2026. 2 Rather, OPG forecasts the forced loss rate and forced loss rate days equivalent of lost 3 generation each year as shown in Ex. E2-1-2, Table 1a and 1b, and described in Ex. 4 E2-1-1, pp. 12-14, and Ex. L-E2-01-Energy Probe-051. 5 6 Chart 2 and Chart 3 below can be used to compare trends in FLR days equivalent. 7 FLR days equivalent capture all sources of unplanned production losses, rather than 8 just the forced outages requested. 9 10
11
Year Station FLR Days Equivalent
TWh Lost
DN 29.8 0.6PN 70.2 0.9
Total 100.0 1.5DN 16.4 0.3PN 95.7 1.2
Total 112.1 1.5DN 11.0 0.2PN 97.2 1.2
Total 108.2 1.4DN 48.3 1.0PN 31.1 0.4
Total 79.4 1.4DN 17.7 0.4PN 45.6 0.6
Total 63.3 0.9DN 24.6 0.5PN 68.0 0.8
Total 92.6 1.4
Chart 2 - OPG FLR Days Equivalent Trends 2016 - 2020
Yearly Average
2016
2017
2018
2019
2020

Filed: 2021-04-19 EB-2020-0290
Exhibit L E2-01-Staff-191
Page 3 of 4
Witness Panel: Nuclear Operations & Nuclear Projects
1 Overall, the number of FLR equivalent days and associated generation losses will 2 remain approximately the same in the forecast. 3 4 At Darlington, there will be less operating units contributing to FLR days equivalent as 5 units enter their refurbishments. This is offset by units returning from refurbishment 6 that are forecast at much higher FLR for three years, as described in Ex. E2-1-1, pp. 7 13-14. 8 9 At Pickering, the target FLR for 2021-2025 is better than the yearly average from 2016-10 2020, contributing to a reduction in FLR equivalent days. This is offset by more 11 operating time, and thus more FLR equivalent days, as the units approach their end of 12
Year Station FLR Days Equivalent
TWh Lost
DN 32.8 0.7PN 63.9 0.8
Total 96.7 1.5DN 14.4 0.3PN 58.9 0.7
Total 73.3 1.0DN 5.9 0.1PN 63.1 0.8
Total 69.0 0.9DN 38.0 0.8PN 66.8 0.8
Total 104.8 1.6DN 46.2 1.0PN 49.4 0.6
Total 95.6 1.6DN 46.8 1.0PN 0.0 0.0
Total 46.8 1.0DN 30.7 0.6PN 60.4 0.7
Total 91.1 1.3
1Budget 2021, Plan 2022-2026
Yearly Average
2026
Chart 3 - OPG FLR Days Equivalent Trends 2021 - 20261
2021
2022
2023
2024
2025
Filed: 2021-04-19 EB-2020-0290
Exhibit L E2-01-Staff-191
Page 4 of 4
Witness Panel: Nuclear Operations & Nuclear Projects
commercial operations. There are no regular cyclical outages planned in the final year 1 of operation for each unit. 2
Filed: 2021-04-19 EB-2020-0290
Exhibit L E2-01-Staff-192
Page 1 of 1
Witness Panel: Nuclear Operations & Nuclear Projects
Board Staff Interrogatory #192 1 2
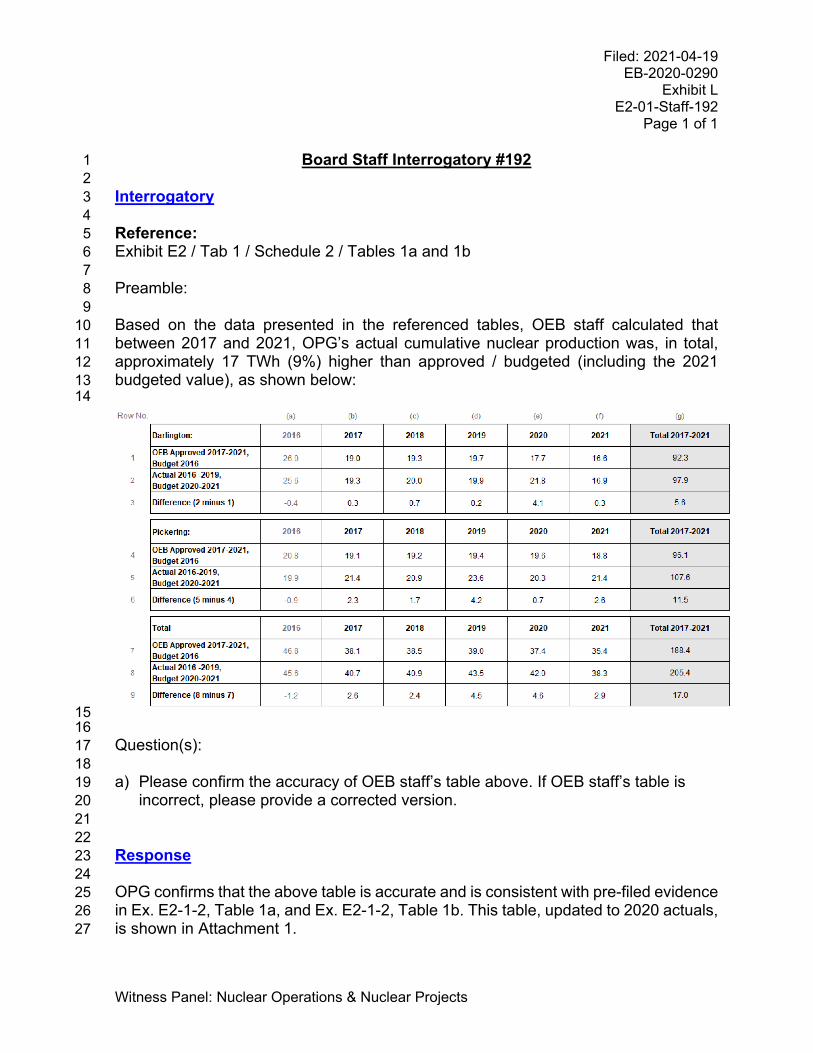
Interrogatory 3 4 Reference: 5 Exhibit E2 / Tab 1 / Schedule 2 / Tables 1a and 1b 6 7 Preamble: 8 9 Based on the data presented in the referenced tables, OEB staff calculated that 10 between 2017 and 2021, OPG’s actual cumulative nuclear production was, in total, 11 approximately 17 TWh (9%) higher than approved / budgeted (including the 2021 12 budgeted value), as shown below: 13 14
15 16 Question(s): 17 18 a) Please confirm the accuracy of OEB staff’s table above. If OEB staff’s table is 19
incorrect, please provide a corrected version. 20 21 22 Response 23 24 OPG confirms that the above table is accurate and is consistent with pre-filed evidence 25 in Ex. E2-1-2, Table 1a, and Ex. E2-1-2, Table 1b. This table, updated to 2020 actuals, 26 is shown in Attachment 1. 27

Numbers may not add due to rounding.
Row No (a) (b) (c) (d) (e) (f)Darlington 2016 2017 2018 2019 2020 2021 Total 2017-2021
1 OEB Approved 2017-2021, Budget 2016 26.0 19.0 19.3 19.7 17.7 16.6 92.3
2 Actual 2016-2020, Budget 2021 25.6 19.3 20.0 19.9 23.4 16.9 99.5
3 Difference (2 minus 1) -0.4 0.2 0.8 0.2 5.7 0.3 7.2
Pickering 2016 2017 2018 2019 2020 2021 Total 2017-2021
4 OEB Approved 2017-2021, Budget 2016 20.8 19.1 19.2 19.4 19.6 18.8 96.1
5 Actual 2016-2020, Budget 2021 19.9 21.4 20.9 23.6 20.5 21.4 107.8
6 Difference (5 minus 4) -0.8 2.3 1.7 4.2 0.9 2.6 11.7
Total 2016 2017 2018 2019 2020 2021 Total 2017-2021
7 OEB Approved 2017-2021, Budget 2016 46.8 38.1 38.5 39.0 37.4 35.4 188.4
8 Actual 2016-2020, Budget 2021 45.6 40.7 40.9 43.5 43.9 38.3 207.3
9 Difference (8 minus 7) -1.2 2.6 2.4 4.4 6.6 2.9 18.9
Table 1 - OPG Actual Cumulative Nuclear Production by Station (TWh)
Filed: 2021-04-19 EB-2020-0290
Exhibit L E2-01-Staff-192
Attachment 1 Page 1 of 1
Filed: 2021-04-19 EB-2020-0290
Exhibit L E2-01-VECC-021
Page 1 of 1
Witness Panel: Compensation and Corporate Costs
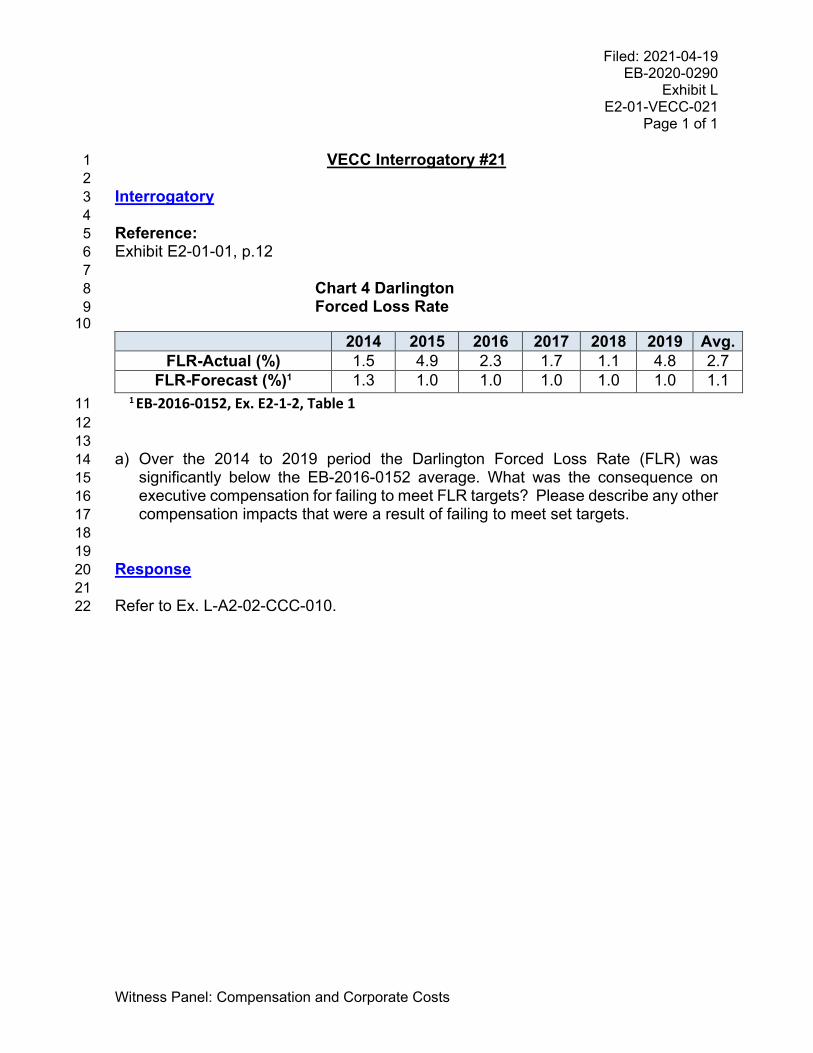
VECC Interrogatory #21 1 2 Interrogatory 3 4 Reference: 5 Exhibit E2-01-01, p.12 6
7 Chart 4 Darlington 8 Forced Loss Rate 9
10 2014 2015 2016 2017 2018 2019 Avg.
FLR-Actual (%) 1.5 4.9 2.3 1.7 1.1 4.8 2.7 FLR-Forecast (%)1 1.3 1.0 1.0 1.0 1.0 1.0 1.1
1 EB-2016-0152, Ex. E2-1-2, Table 1 11 12 13 a) Over the 2014 to 2019 period the Darlington Forced Loss Rate (FLR) was 14
significantly below the EB-2016-0152 average. What was the consequence on 15 executive compensation for failing to meet FLR targets? Please describe any other 16 compensation impacts that were a result of failing to meet set targets. 17 18
19 Response 20 21 Refer to Ex. L-A2-02-CCC-010. 22
Filed: 2021-04-19 EB-2020-0290
Exhibit L E2-01-VECC-022
Page 1 of 2
Witness Panel: Nuclear Operations & Nuclear Projects
VECC Interrogatory #22 1 2 Interrogatory 3 4 Reference: 5 Exhibit E2-01-02 6
7 a) OPG systemically under forecast its nuclear production in EB-2016-0152. The 8
under forecast ranges from approximately 6% to over 12% in any given year. In 9 no year did OPG produce less than its forecast. What changes has OPG made to 10 its forecasting methodology which would argue against making a reduction in the 11 proposed nuclear forecast in this proceeding? 12
13 14 Response 15 16 OPG rejects the notion that it systemically under forecasts its nuclear production. In 17 the eight year period 2008-2016, OPG produced less power than it had forecasted (see 18 Ex. L-E5-01-CCC-042). 19 20 As discussed in EB-2016-0152, OPG’s production forecast methodology is well 21 developed and appropriate. OPG provided its best forecast of production in its last 22 application which was thoroughly examined by all parties to the proceeding and which 23 the OEB ultimately approved. 24 25 The positive variance in production during the 2017-2021 period is because OPG 26 successfully implemented a number of outage-related improvement initiatives and 27 efficiencies. OPG provided detailed explanations for these positive variances against 28 forecast in Ex. E2-1-1, pp. 2-4 and Ex. E2-1-2, pp. 9-12. These outage improvements 29 have been incorporated into the 2022-2026 forecast, and OPG does not anticipate any 30 further change in this regard that would result in either a material decrease or increase 31 in production. 32 33 A major contributor to the positive variance between actual and forecast nuclear 34 production in 2018-2020 is the extension of the cyclical maintenance outage schedule 35 at Pickering from 24 to 30 months (Ex. E2-1-1, Section 3.2.1). In addition, OPG also 36 experienced a positive variance in 2020 largely driven by the impact of the company’s 37 response to the COVID-19 pandemic on the Darlington Refurbishment schedule (i.e. 38 delaying the start of Unit 3 refurbishment), which is not expected to be repeated, and 39 which was partially offset by associated changes in the station’s cyclical maintenance 40 outage schedule over 2020 and 2021, as discussed in Ex. E2-1-2. 41
Filed: 2021-04-19 EB-2020-0290
Exhibit L E2-01-VECC-022
Page 2 of 2
Witness Panel: Nuclear Operations & Nuclear Projects
As OPG’s production forecast methodology continues to be rigorous, OPG did not 1 make any major changes to its nuclear production forecast methodology in preparing 2 the 2022-2026 nuclear production forecast. 3

Filed: 2021-04-19 EB-2020-0290
Exhibit L E2-02-Energy Probe-052
Page 1 of 1
Witness Panel: Nuclear Operations & Nuclear Projects
Energy Probe Interrogatory #52 1 Interrogatory 2 3 Reference: 4 Exhibit E2, Tab 2, Schedule 1, page 4; Exhibit E2, Tab 1, Schedule 1, page 10 5 6 Preamble: “The 213.0 additional PO days at Darlington are primarily due to a 181.1 7 day turbine generator controls upgrade planned outage for Unit 2 in 2025 (Ex. E2-1-8 1).” 9 10 Please reconcile the 181.1 days for the turbine generator upgrade quoted in the 11 preamble with the 190.1 days mentioned in Exhibit E2, Tab 1, page 10. 12 13 14 Response 15 16 The TG controls outage is 190.1 days as referenced in Ex. E2-1-1, p. 10. This outage 17 starts in 2025 and extends through 2026. 18 19 As Ex. E2-1-2, p. 4, lines 9-27 compares yearly plans, it refers only to the portion of 20 the TG controls outage scheduled in 2025 and does not include the portion in 2026. 21 22 In the course of responding to this interrogatory it was determined that the yearly 23 portions referenced in Ex. E2-1-2, p. 4, line 21 and footnote 4 were incorrect; the 24 portion of this outage in 2025 is 182.0 days (as opposed to 181.1 days), with a further 25 8.1 days in 2026. The total duration continues to be 190.1 days. 26