cell-based image segmentation for 2d and 2d series ultrasound images...
TRANSCRIPT
Cell-Based Image segmentation for 2D and 2D series ultrasound images
以區域單元為基礎之超音波影像與超音波序列影像分割
Student: Cheng, Jie-ZhiThesis Adviser Dr. Chen, Chung-Ming1
Dr. Chou, Yi-Hong2
1Institute of Biomedical Engineering, NTU2Department of Radiology, TVGH

Outline
2D image segmentation– Augmented Cell Competition Algorithm
2D series image segmentation– Cell-Based Two Region Competition with MAP Framework (C2RC-MAP)
Performance Analysis Summary
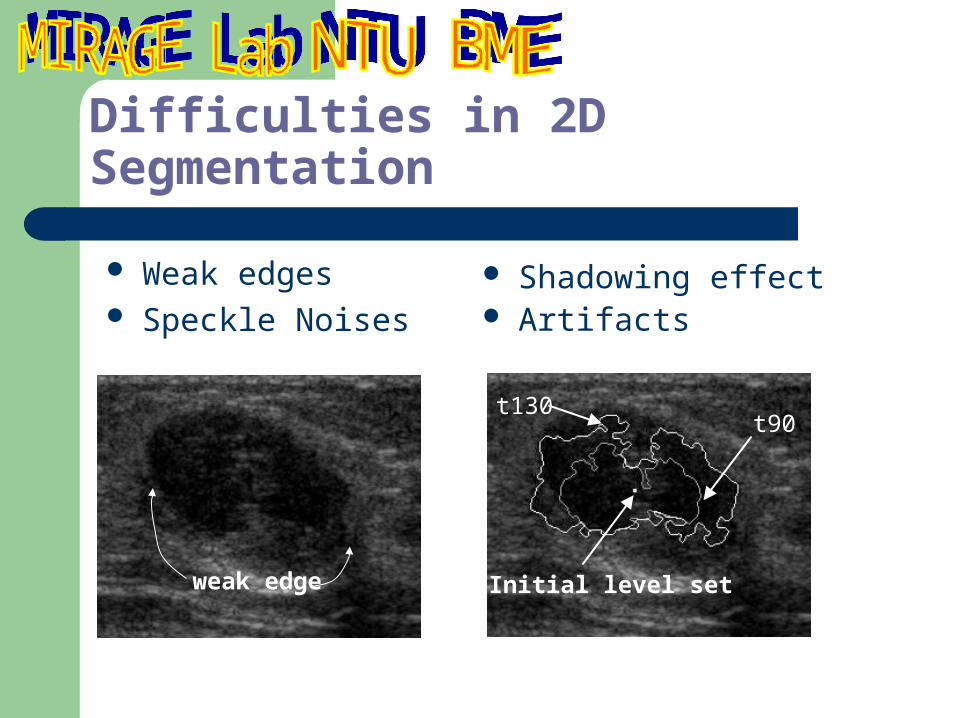
Difficulties in 2D Segmentation
Weak edges Speckle Noises
weak edge
Shadowing effect Artifacts
Initial level set
t130t90
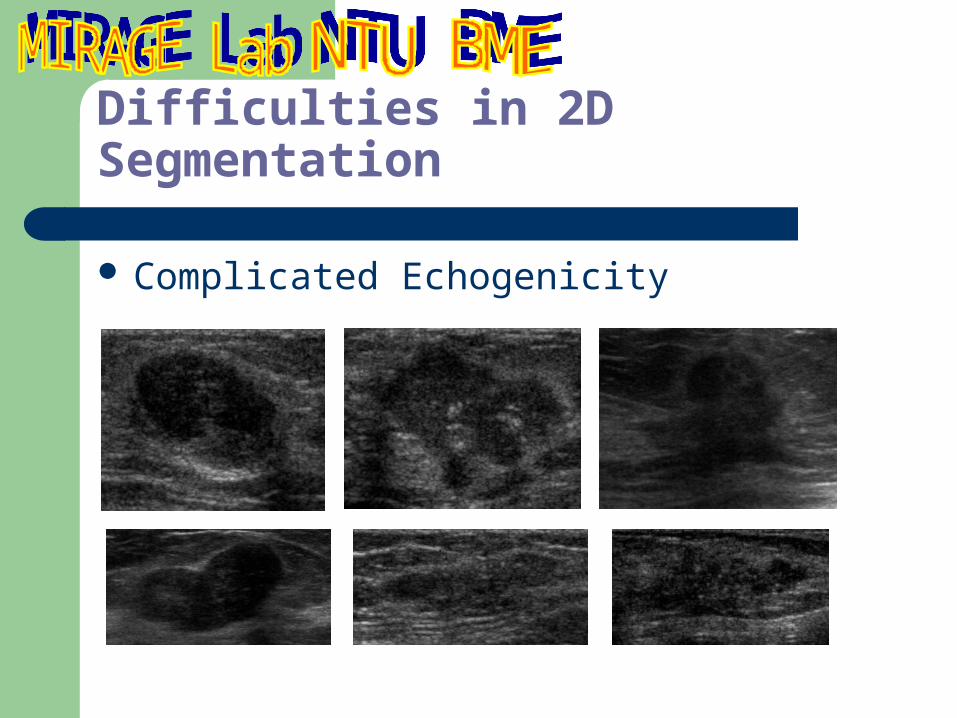
Difficulties in 2D Segmentation
Complicated Echogenicity

Augmented Cell Competition (ACCOMP) algorithm
A nearly automatic, data-driven, segmentation algorithm
Being composed of two phases– Image/ROI Partition: Cell Competition
Algorithm– Edge Grouping: Cell-Based Graph-Searching
Algorithm
Five best contours are suggested
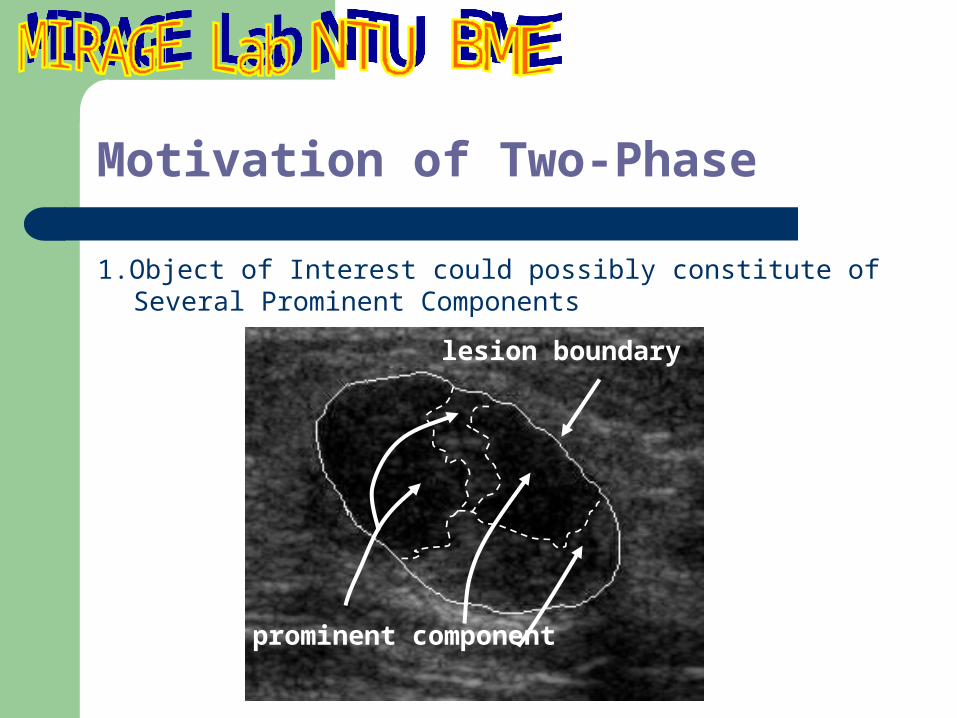
Motivation of Two-Phase
1.Object of Interest could possibly constitute of Several Prominent Components
lesion boundary
prominent component
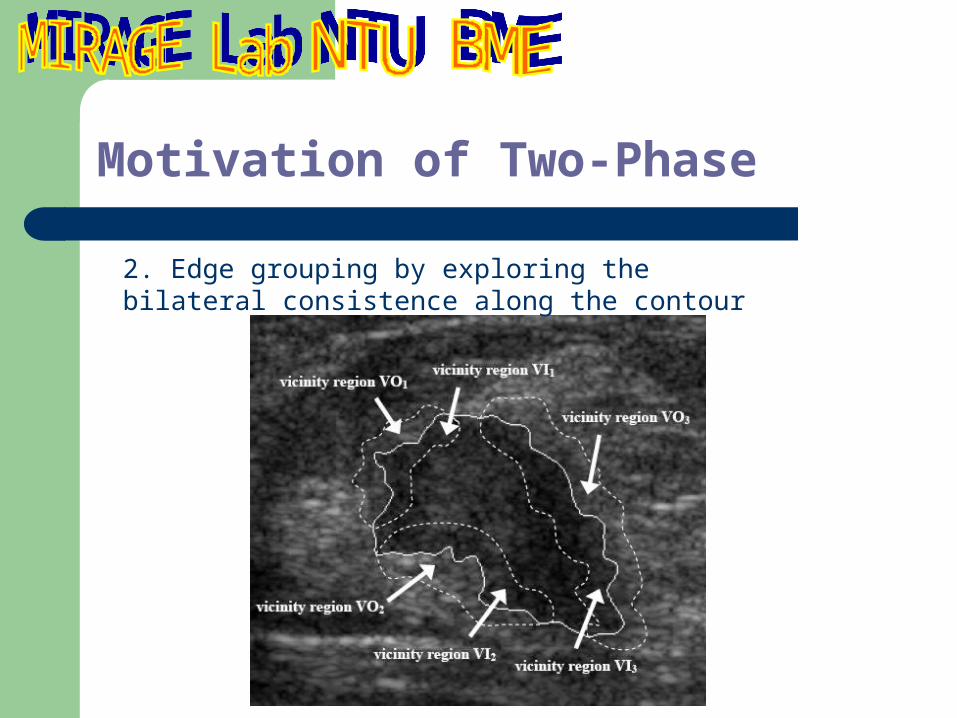
Motivation of Two-Phase
2. Edge grouping by exploring the bilateral consistence along the contour

Partition Phase/Cell Competition Algorithm- The Basic Ideas
ROI is first decomposed into cells, each of which is a homogeneous area
Cell-based deformation: Only the cell boundaries are considered as the candidate positions for deformation
Cell Competition: iteratively split/merge the cells into prominent components
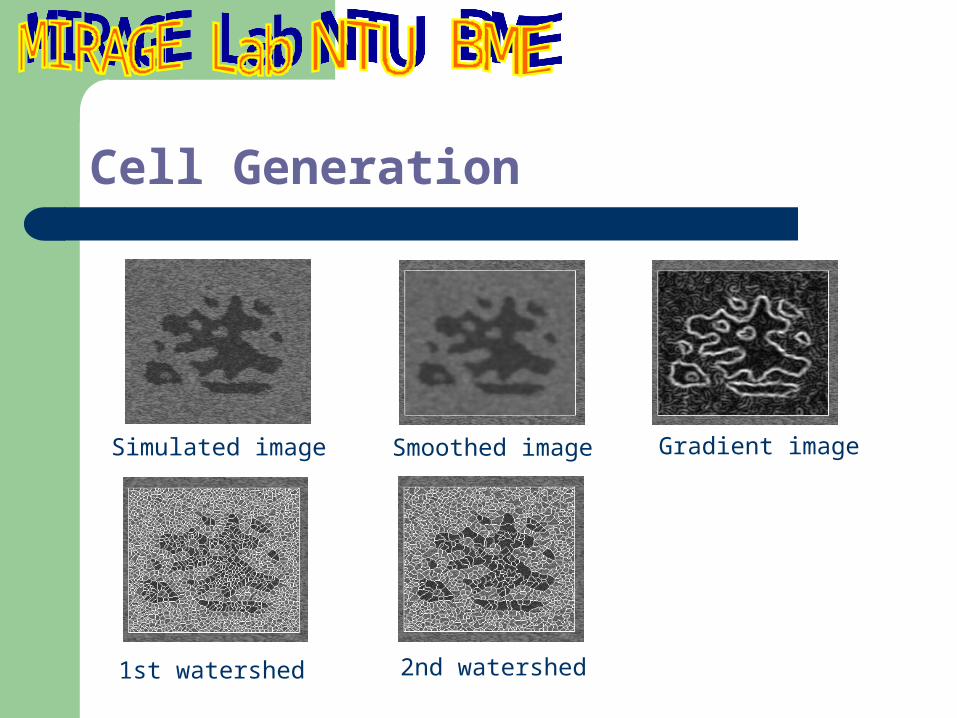
Cell Generation
Simulated image Smoothed image Gradient image
1st watershed 2nd watershed

Benefits of Cell-Based
More Efficient-- Less Search Space Concrete Structural Region and Edge
Information-- facilitate the integration of region and edge clues
Statistically More Robust to Noise-- cell is a region of pixels with similar intensities

Cell Competition: Three Action Types
Action A
Action B
Action C
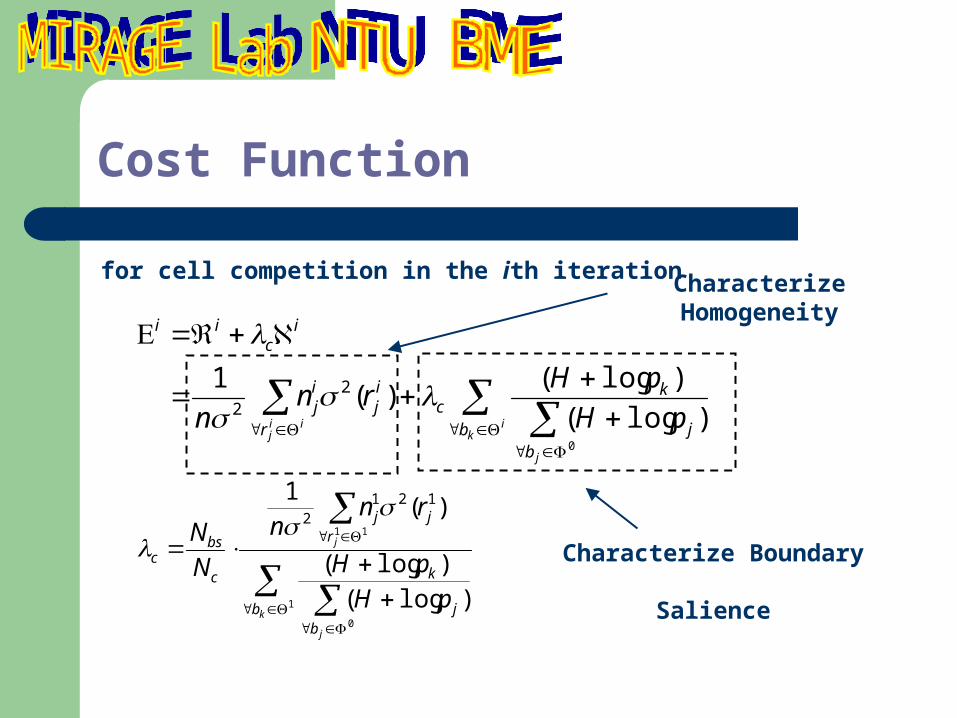
Cost Function
ik
j
iij b
bj
kc
r
ij
ij
ic
ii
pH
pHrn
n0
)log(
)log()(
1 22
for cell competition in the ith iteration
1
0
11
)log(
)log(
)(1 121
2
k
j
j
bb
j
k
rjj
c
bsc
pH
pH
rnn
N
N
Characterize Homogeneity
Characterize Boundary Salience
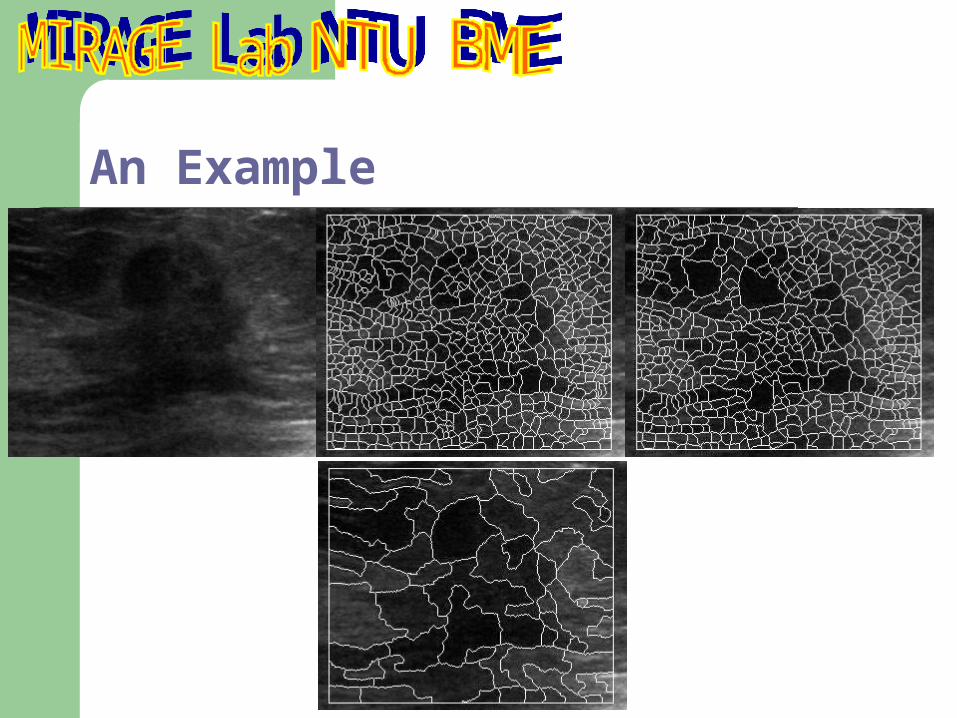
An Example
Edge Grouping Phase/Cell-Based Graph-Searching Algorithm- The Basic Ideas
Select And Group the edge segments in the prominent component tessellation
Propose five boundary candidates Bilateral Consistence Exploration Implement in Graph Traversing Scheme

Cell-based Graph-Search Algorithm- construct c-graph
ce2
ce3ce1
ce12
ce11 ce10
ce4
ce5
ce7
ce8
ce9
ce13
ce6
ce8
ce5
ce6
ce4
ce3
ce2
ce1
ce10
ce9ce13
ce12
ce11
ce7
Cell Edge
Prominent Component Tessellation
c-graph
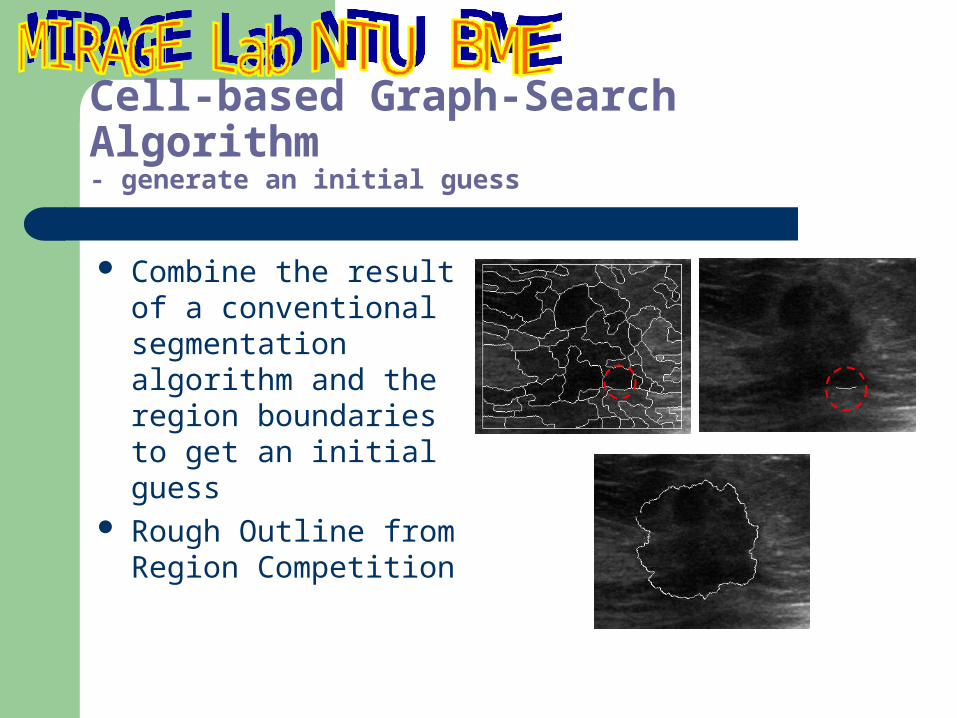
Cell-based Graph-Search Algorithm- generate an initial guess
Combine the result of a conventional segmentation algorithm and the region boundaries to get an initial guess
Rough Outline from Region Competition

Boundary of object of interest should be1. closed2. not self-intersected
Correspond to a cycle in c-graph Use Depth-First Search scheme Exploration of Bilateral Consistence within
the DFS scheme See an example
Cell-based Graph-Search- search potential boundaries

Cell-based Graph-Search- Select the best boundaries
Five best boundaries are suggested according to five cost functions
The cost function is a function of the gray level distribution of the banding area along the boundary.

Cell-based Graph-Search- Select the best boundaries
C1: Overall absolute difference of bilateral mean intensities:
C2: Continuity of mean gradient:
C3: Overall edge strength:
l
i
iR
iLl
C1
||1
1
1
1 11
12 ( | | | |)
l
i i li
Cl
l
iil
C1
13
maximize
minimize
maximize

Cell-based Graph-Search- Select the best boundaries
C4: Continuity of mean intensities:
C5: Sum of the continuity of mean intensities and the negative overall edge strength:
11 1 1 1
1
14 [ (| | | |) | | | |]
li i i i l lL L R R L L R R
i
Cl
435 CCC
minimize
maximize

Five Suggested BoundariesDemonstration
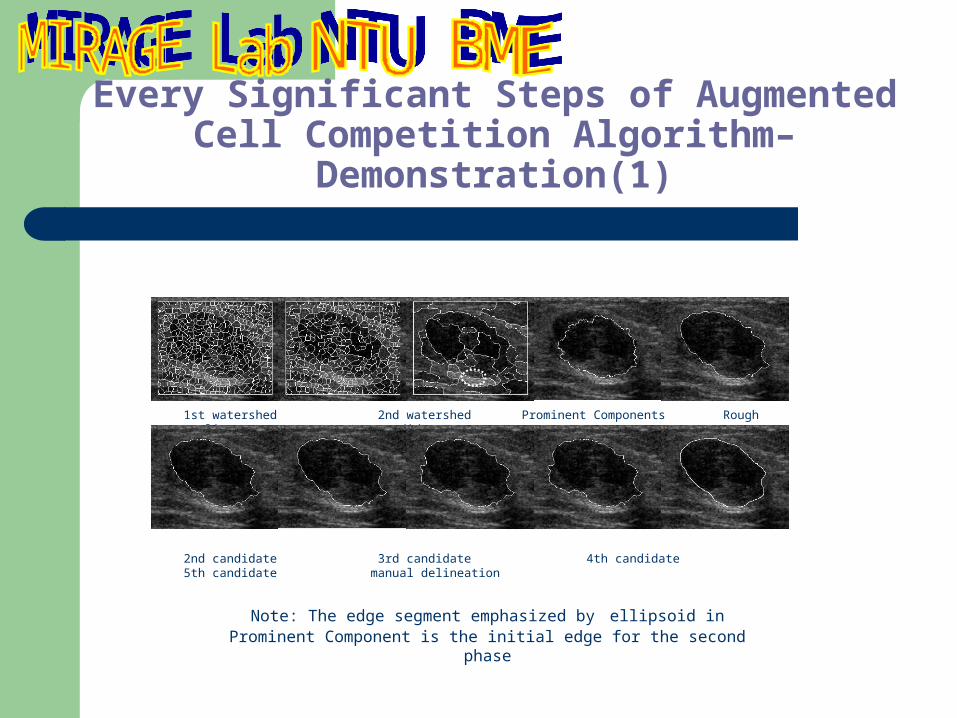
Every Significant Steps of Augmented Cell Competition Algorithm– Demonstration(1)
1st watershed 2nd watershed Prominent Components Rough outline 1st candidate
2nd candidate 3rd candidate 4th candidate 5th candidate manual delineation
Note: The edge segment emphasized by ellipsoid in Prominent Component is the initial edge for the second phase
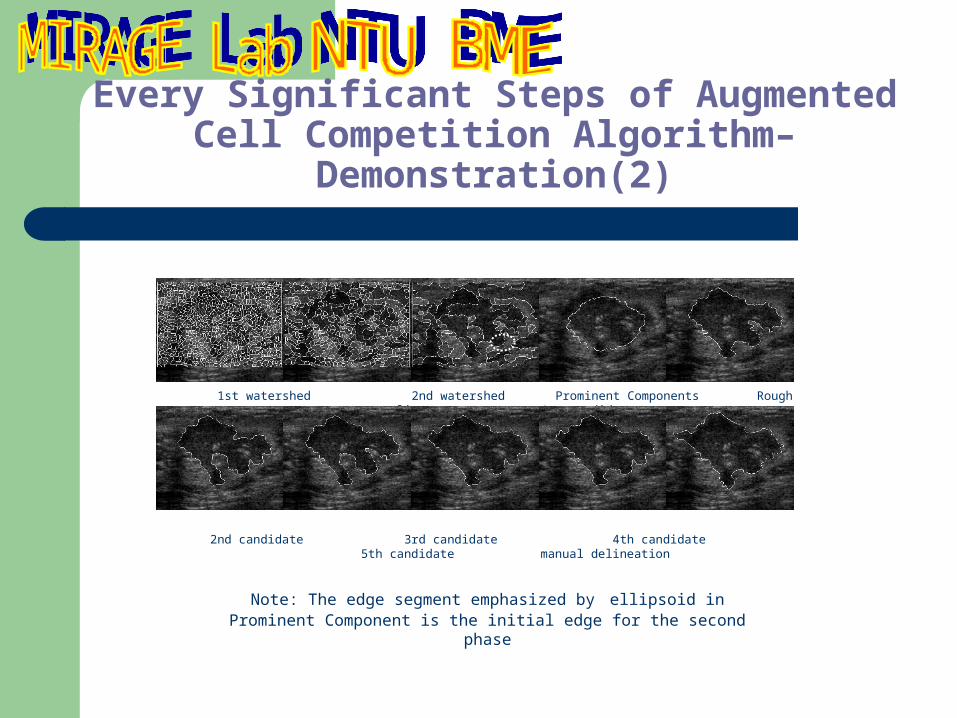
Every Significant Steps of Augmented Cell Competition Algorithm– Demonstration(2)
1st watershed 2nd watershed Prominent Components Rough outline 1st candidate
2nd candidate 3rd candidate 4th candidate 5th candidate manual delineation
Note: The edge segment emphasized by ellipsoid in Prominent Component is the initial edge for the second phase
ACCOMP Performance Analysis
Each image was manually delineated by four observers
Four contours were derived by ACCOMP algorithm for each images
Three assessments were carried out for each series The ACCOMP is tested upon 300 breast sonograms,
including 165 carcinomas and 135 fibroadenomas
ACCOMP Performance Analysis
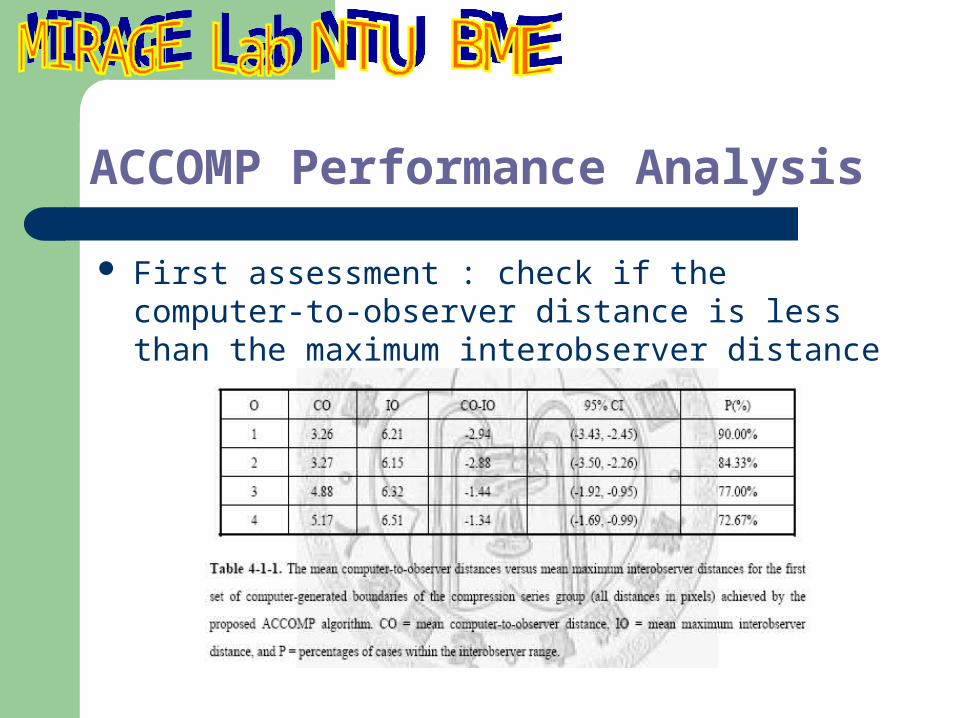
First assessment : check if the computer-to-observer distance is less than the maximum interobserver distance

Second assessment : tests if there is a significant difference among the four sets of computer-generated boundaries of a series group with respect to the average manually delineated boundaries.
The averaged distances of the four sets to the averaged manual delineations are 3.36±2.36, 3.41±2.32, 3.49±2.43, and 3.40±2.33 respectively.
Friedman test was used and The p value is 0.54.
ACCOMP Performance Analysis
Third assessment : computes the Pearson’s correlation of the lesion areas defined by the computer-generated boundaries and manually-delineated boundaries
The Pearson’s correlations were all higher than 0.98.
ACCOMP Performance Analysis
Summaries
The advantage of two phases:1. Partition phase: further scale down the search space with meaningful structure2. Edge Grouping: bypass the complicated echogenicity
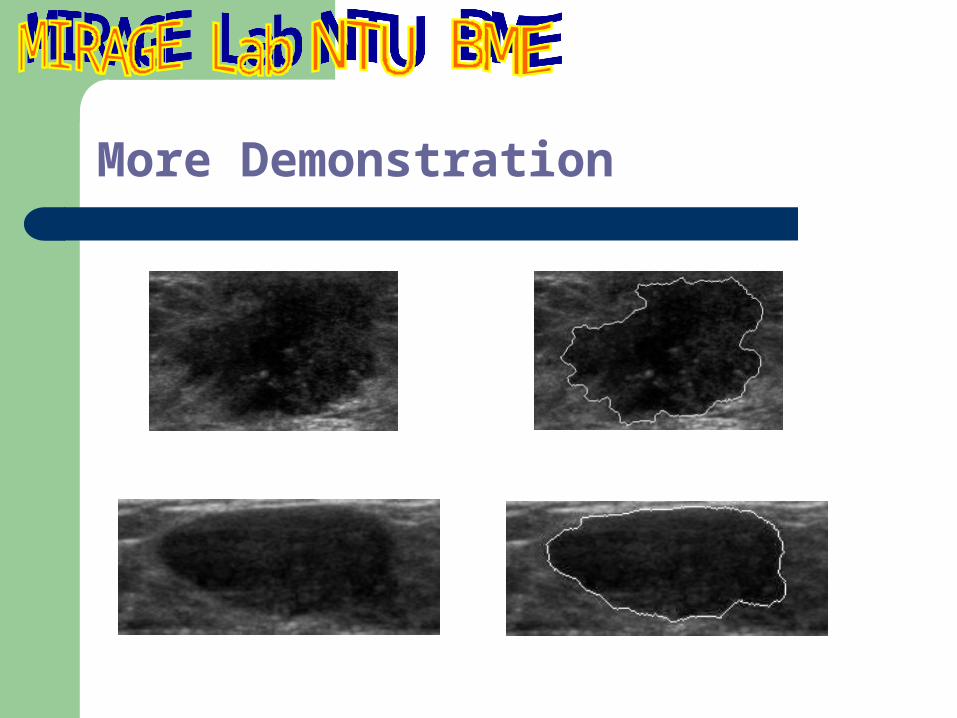
The ACCOMP algorithm is a model-free image segmentation method in which training scheme is not necessary.
The ACCOMP algorithm is capable of delineating highly winding boundaries and dealing irregular echo pattern within the boundary.
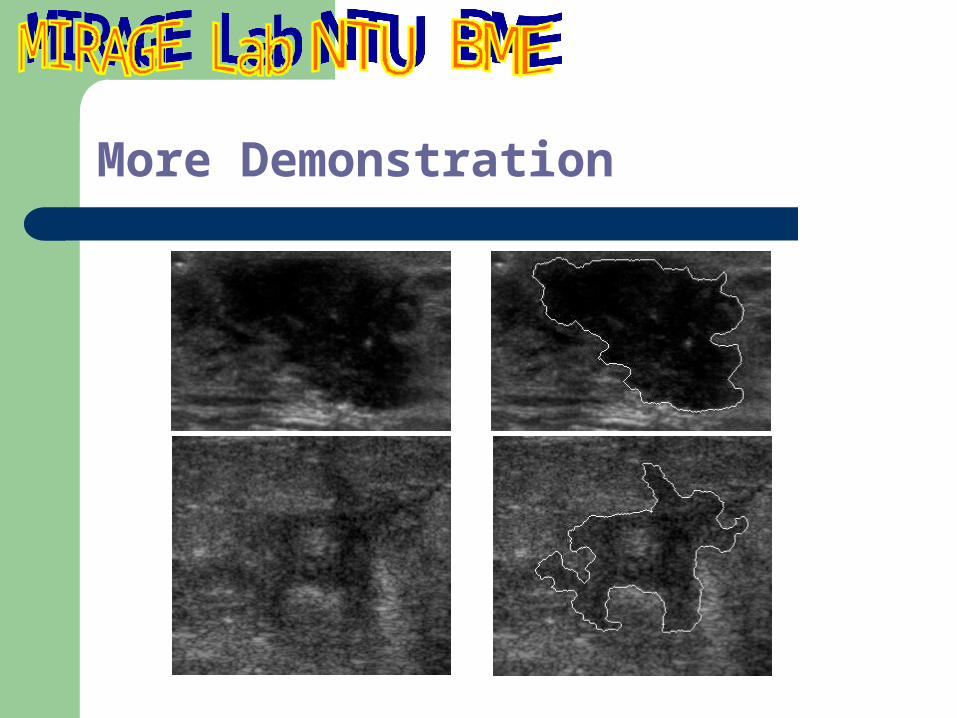
More Demonstration
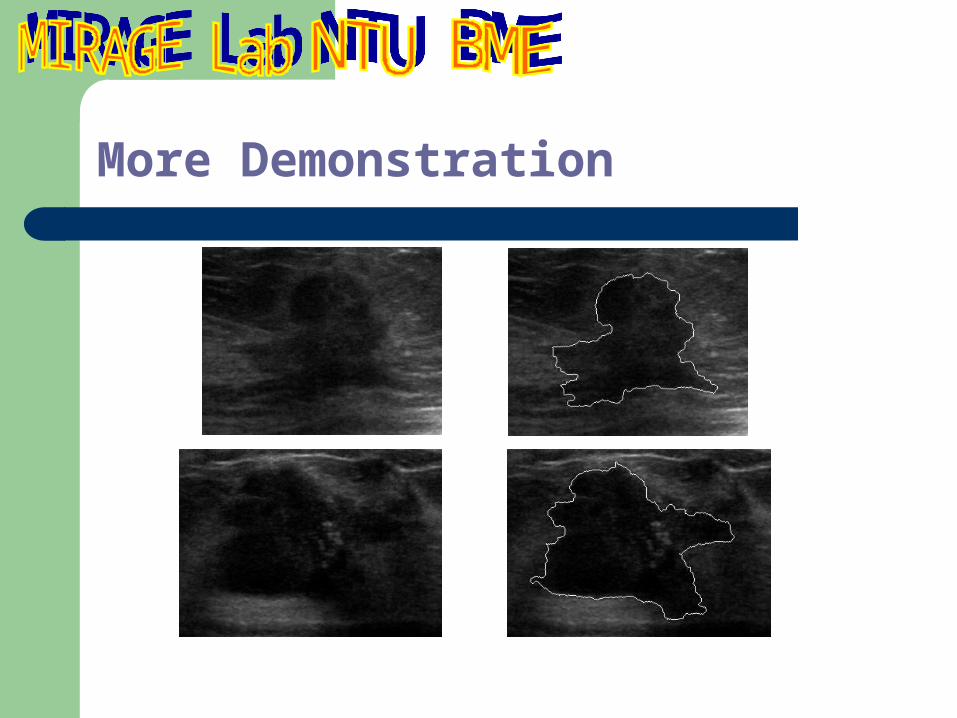
More Demonstration

More Demonstration
More Demonstration
Related Works
C. M. Chen, Y. H. Chou, C. S. K. Chen, J. Z. Cheng, Y. F. Ou, F. C. Yeh, K. W. Chen. "Cell Competition Algorithm: A New Segmentation Algorithm for Multiple Objects with Irregular Boundaries in Ultrasound Images," Ultrasound in Medicine and Biology, vol. 31, no. 12, pp. 1647-1664, 2005. (SCI; 2005 Impact Factor 2.221)
C. M. Chen, J. Z. Cheng, Y. H. Chou. “ACCOMP— Augmented Cell Competition Algorithm for Delineating Boundaries of Objects of Interest in Sonography,” Technical Report, Institute of Biomedical Engineering, National Taiwan University.
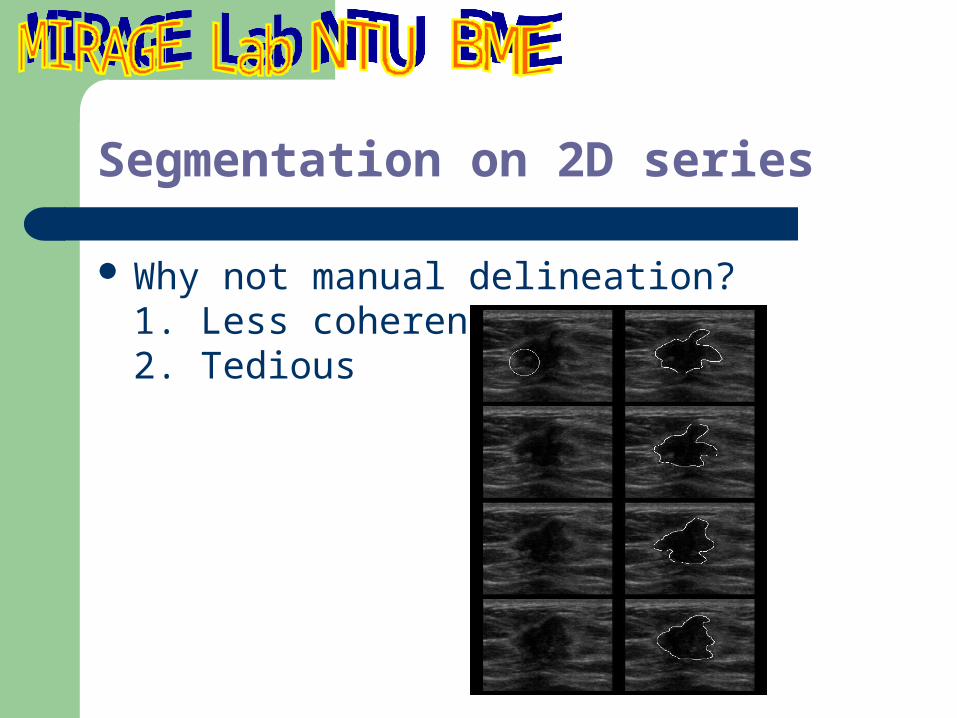
Segmentation on 2D series
Why not manual delineation?1. Less coherence2. Tedious
Segmentation on 2D series
Knowledge-basedModel-basedGeneral approach

Segmentation on 2D series- Knowledge-based
incorporating the intrinsic shape properties of the object of interest as the prior knowledge into the segmentation algorithms
For example: Dydenko et al. (2006) march the frontier of a level set constrained by the shape of myocardium.
Segmentation on 2D series- model-based
find the 2D boundaries based on the mathematical shape models describing the common characteristics of the objects of interest or the shape models constructed from the training data.
For example: Bosch et al. (2002) and Xie et al. (2005) represent the boundaries of the LV endocardial contours and the kidneys, respectively, as a linear combination of the mean shape and a set of eigenshapes computed from the training data.
Segmentation on 2D series- general approach
Without using prior shape knowledge or model information
For example: the contour points within a slice and between adjacent slices are modeled as a Markov random field (MRF) in Hass et al. (2000) to control the smoothness of the derived IVUS boundaries.

C2RC-MAP Algorithm
Based on two essential ideas– cell-based two-region competition– cell-based MAP framework
Starting from the boundary derived for the initial slice, the boundary of previous slice is used as a reference for the current slice.
Propagate the derived contour as a reference contour for the next slice

Segmentation on Initial Slice
Augmented Cell Competition Algorithm– A nearly automatic segmentation algorithm
composed of Cell Competition algorithm Cell-based graph-search algorithm
Five best contours are suggested

Cell-based Two-region Competition for Each Slice
In each iteration, the object- and background-regions compete the cells along the region contour and move the cell that results in the maximal improvement of the cost function.
reference contour
initial regional contour instance cell boundary
vertex
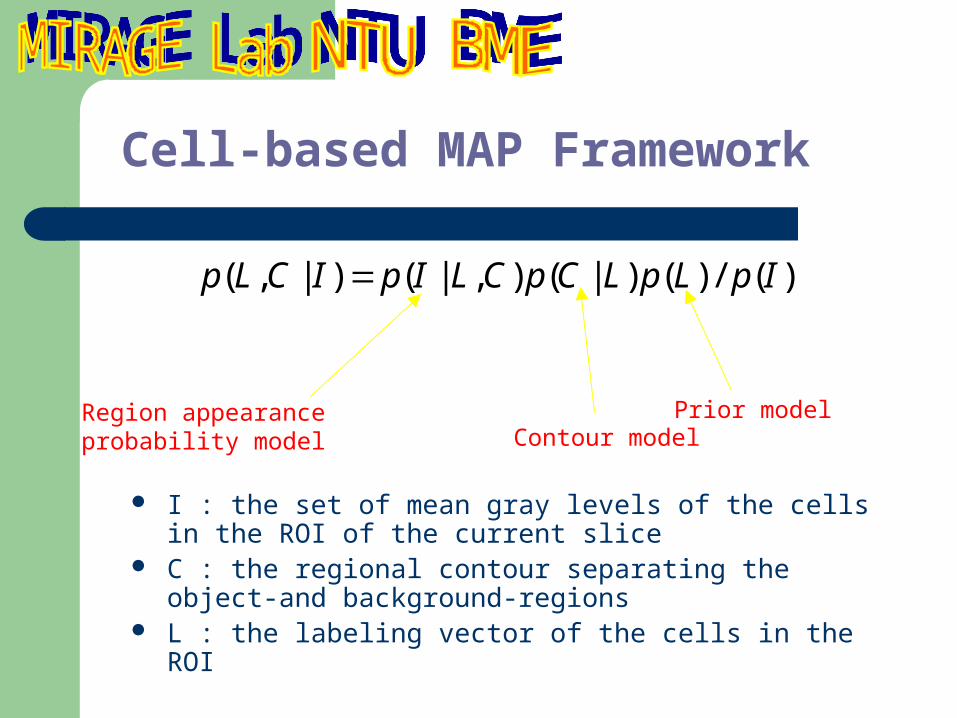
Cell-based MAP Framework
I : the set of mean gray levels of the cells in the ROI of the current slice
C : the regional contour separating the object-and background-regions
L : the labeling vector of the cells in the ROI
)(/)()|(),|()|,( IpLpLCpCLIpICLp
Region appearance probability model Contour model
Prior model

Roles of Three Models
Region Appearance Probability Model : quantifies the cell-based textural property for the object- and background-regions
Contour Model : emphasizes on the edge properties of the regional contour
Prior Model : regularizes the shape complexity of the object-region with a preference for a smooth regional contour to a protruding one
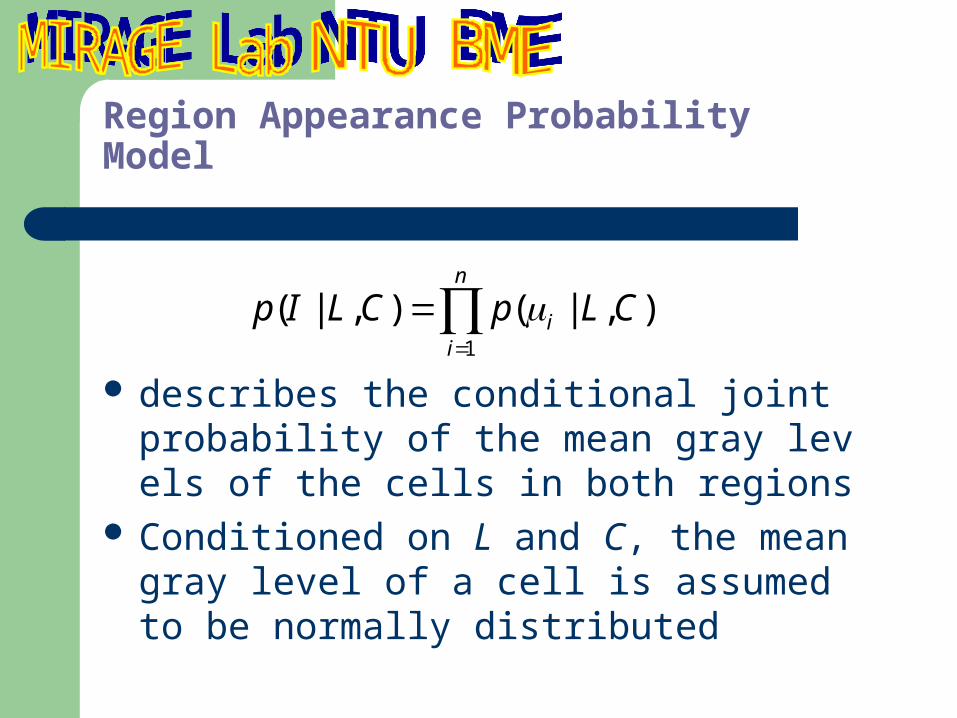
Region Appearance Probability Model
describes the conditional joint probability of the mean gray levels of the cells in both regions
Conditioned on L and C, the mean gray level of a cell is assumed to be normally distributed
n
ii CLpCLIp
1
),|(),|(
Contour Model
a likelihood function that characterizes the salience of the regional contour and the coherence of the regional contour to the reference contour given an instance of the cell labeling
Two terms:1. Coherence: Securing the contextual
coherence2. Salience: Characterize contour salience

Contour Model
)exp()1()|( Lb
jLL DpLCPLj
reference contour
initial regional contour instance cell boundary
vertex

Prior Model
)(exp)( 1 LUZLp
c
c LVLU )()(
i
ilULU
)(2
1)(
ij
ijc
ici lVlU )()(
ijic lVij
1)(
The labeling of each cell is modeled as Gibbs distribution
The more neighboring cells have the same label, the smaller U(L) would be, and hence the larger p(L) would be

Effect of Prior Model
1 2
3
0
1 2
3
0
3
2
1
0
Avoidance of Chaining

Optimized by EM Algorithm
E-step: Given model parameters, find the single-cell migration from one region to the other that results in the largest positive increment of the log-posterior:
M-step: Given the new cell labeling and the new regional contour, compute the new model parameters for next E-step
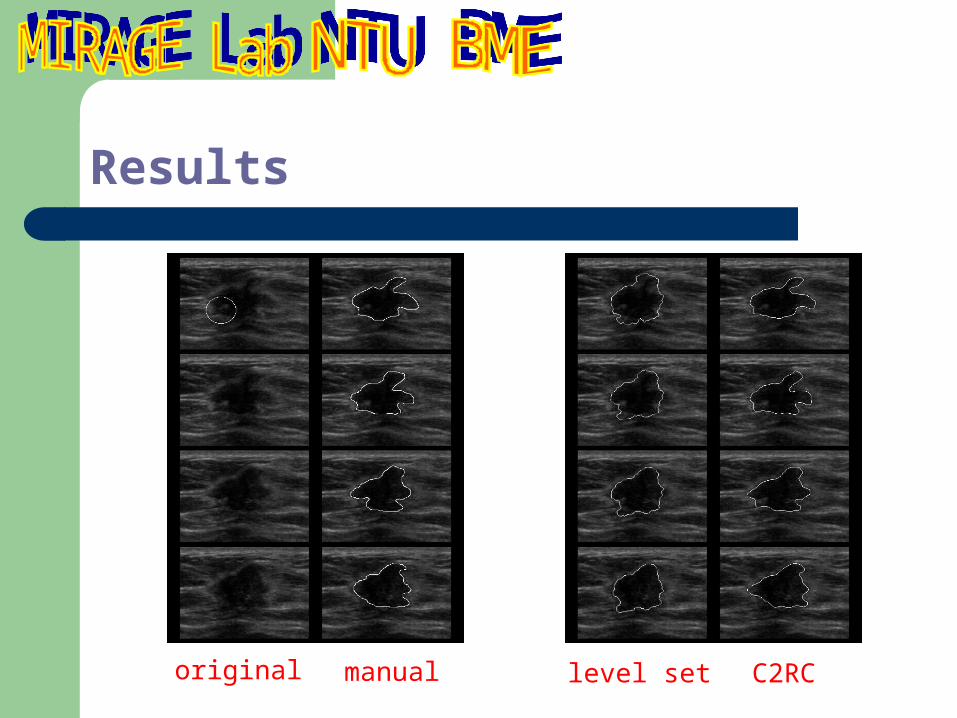
Results
original manual level set C2RC
C2RC-MAP Performance Analysis
Each image was manually delineated by four observers
Four contours were derived by C2RC-MAP algorithm for each images
Testing on 10 series, including 7 compression and 3 freehand
Three assessments were carried out for each series
C2RC-MAP Performance Analysis
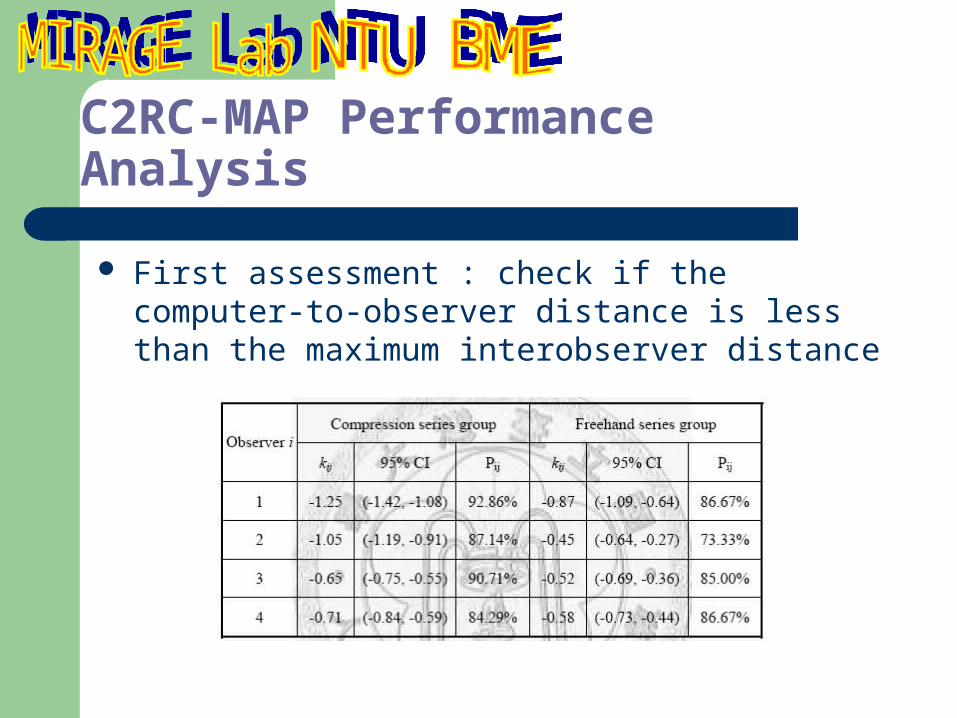
First assessment : check if the computer-to-observer distance is less than the maximum interobserver distance
C2RC-MAP Performance Analysis
Second assessment : tests if there is a significant difference among the four sets of computer-generated boundaries of a series group with respect to the average manually delineated boundaries.
Friedman test was used and The p values for the compression and freehand series groups were 0.517 and 0.352, respectively.
C2RC-MAP Performance Analysis
Third assessment : computes the Pearson’s correlation of the lesion areas defined by the computer-generated boundaries and manually-delineated boundaries
The Pearson’s correlations were all higher than 0.99.1. compression series: 0.995, 0.995, 0.994, and 0.9952. freehand series: 0.992, 0.994, 0.994, and 0.993

Summaries
The cell-based deformation ensures that all edges in the derived boundary are visually perceivable edges
The cell competition mechanism offers a chance to find a better solution
The cell-based MAP framework searches for a salient and coherent boundary with a preference to a smooth contour.

Related Works
J. Z. Cheng, C. M. Chen, Y. H. Chou, C. S. K. Chen, C. M. Tiu. “Cell-based Two-region Competition Algorithm with A MAP Framework for Boundary Delineation of A Series of 2D Ultrasound Images,” Ultrasound in Medicine and Biology, 2007. To appear.

Thanks for Your Listening
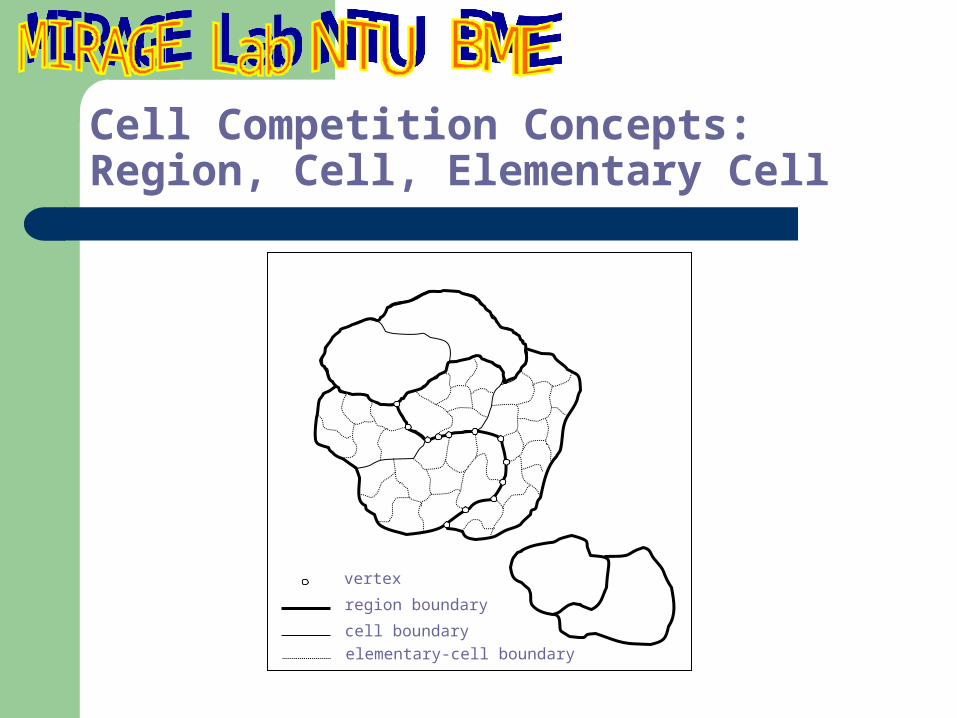
Cell Competition Concepts: Region, Cell, Elementary Cell
vertex
elementary-cell boundary
cell boundary
region boundary
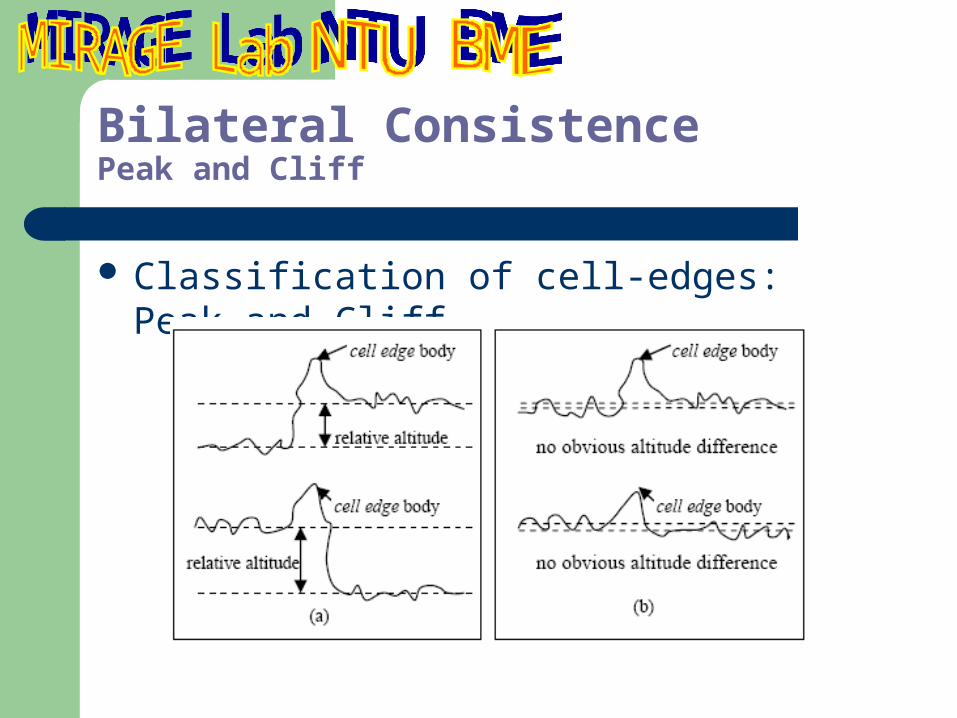
Bilateral ConsistencePeak and Cliff
Classification of cell-edges: Peak and Cliff

Bilateral ConsistencePeak and Cliff
Sample Bilateral Vicinity Two sample t-test
Hypothesis (95%CI)Accepted: PeakRejected: Cliff
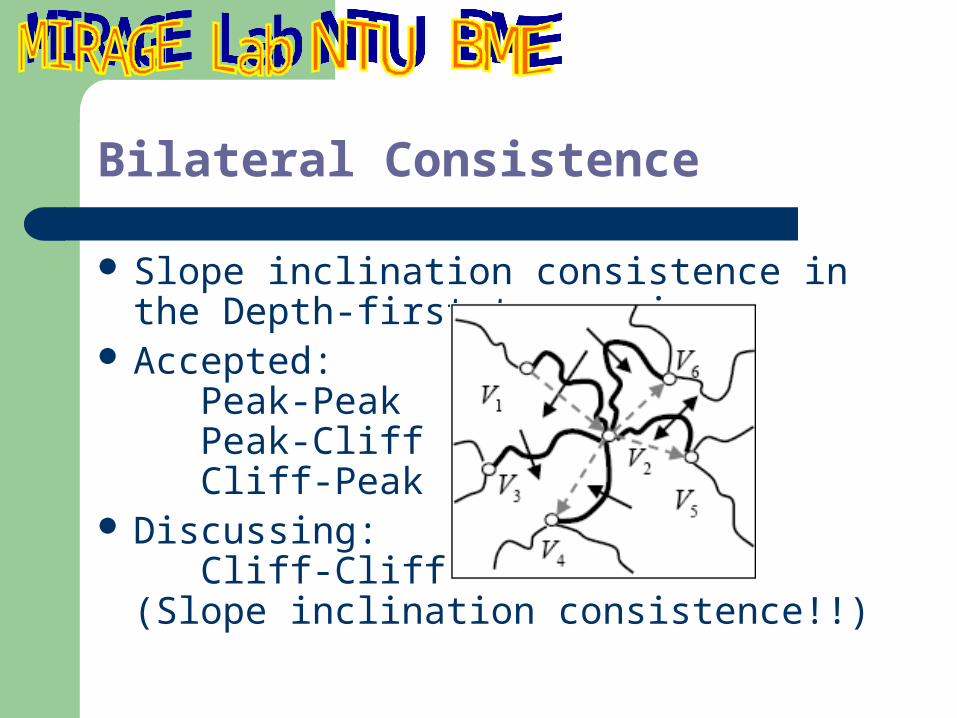
Bilateral Consistence
Slope inclination consistence in the Depth-first traversing
Accepted: Peak-Peak Peak-Cliff Cliff-Peak
Discussing: Cliff-Cliff (Slope inclination consistence!!)
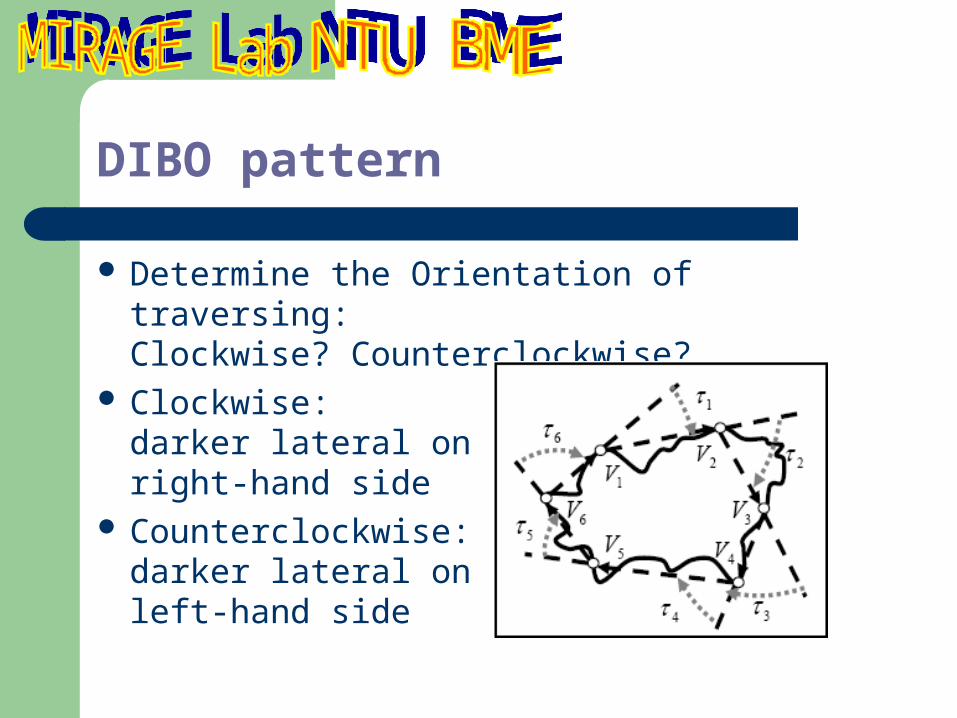
DIBO pattern
Determine the Orientation of traversing:Clockwise? Counterclockwise?
Clockwise:darker lateral onright-hand side
Counterclockwise:darker lateral on left-hand side
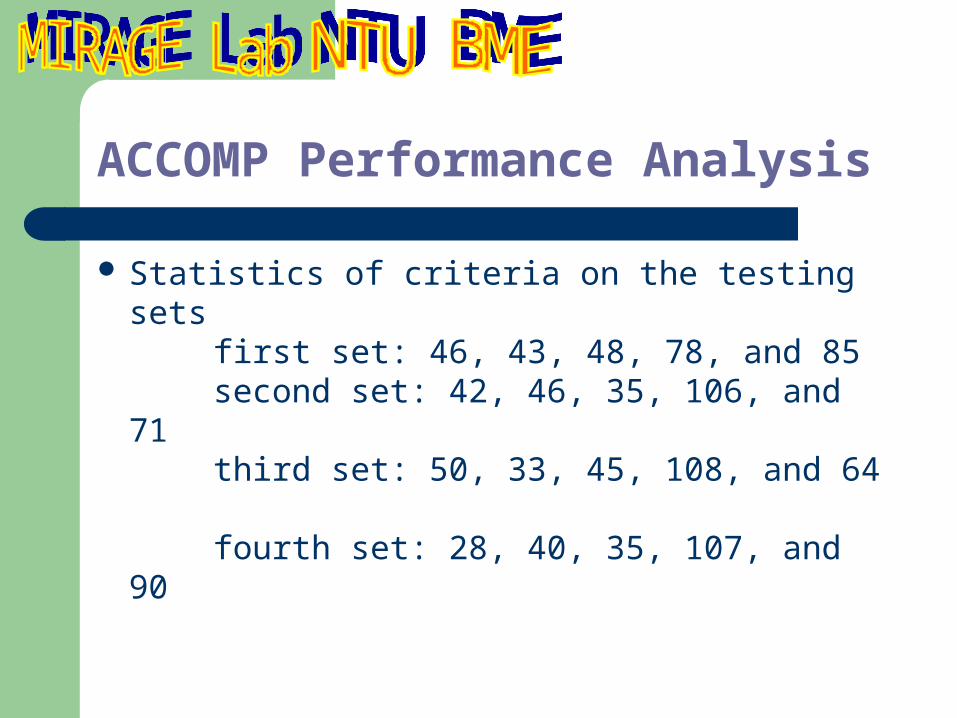
ACCOMP Performance Analysis
Statistics of criteria on the testing setsfirst set: 46, 43, 48, 78, and 85 second set: 42, 46, 35, 106, and 71 third set: 50, 33, 45, 108, and 64 fourth set: 28, 40, 35, 107, and 90
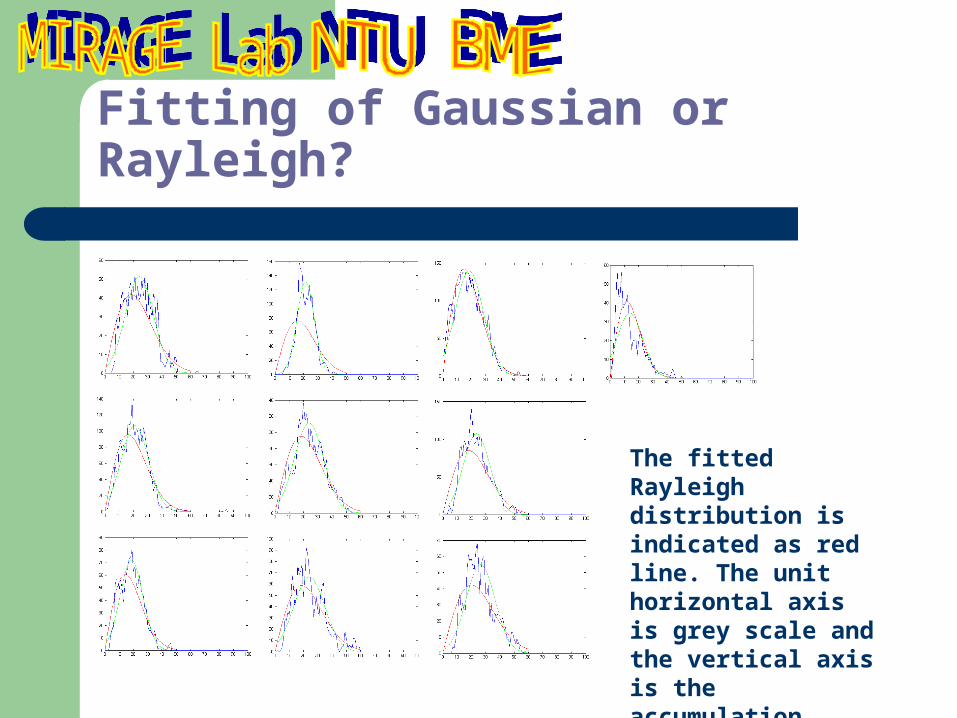
Fitting of Gaussian or Rayleigh?
The fitted Rayleigh distribution is indicated as red line. The unit horizontal axis is grey scale and the vertical axis is the accumulation count.

Fitting of Gaussian or Rayleigh?
Using Chi-Square test