cellular biology - circulation...
TRANSCRIPT

650
Cerebral arteries form an integrated network that controls the magnitude and distribution of tissue blood flow. Tone
within these structures is regulated by multiple stimuli includ-ing blood flow,1,2 neuronal activity,3,4 tissue metabolism,5 and in-traluminal pressure.6 These vasoactive stimuli alter myosin light chain phosphorylation through a dynamic process controlled by
myosin light chain kinase and phosphatase.7–9 Although the pre-cise signaling mechanisms do vary among stimuli, a global rise in cytosolic [Ca2+]
i is generally thought to be a key mediating
step.6 This global rise is in turn intimately tied to changes in the smooth muscle membrane potential (V
M) and the subsequent
activation of voltage-gated Ca2+ channels.6,10,11
Cellular Biology
© 2014 American Heart Association, Inc.
Circulation Research is available at http://circres.ahajournals.org DOI: 10.1161/CIRCRESAHA.114.304056
Rationale: T-type (CaV3.1/CaV3.2) Ca2+ channels are expressed in rat cerebral arterial smooth muscle. Although present, their functional significance remains uncertain with findings pointing to a variety of roles.
Objective: This study tested whether CaV3.2 channels mediate a negative feedback response by triggering Ca2+ sparks, discrete events that initiate arterial hyperpolarization by activating large-conductance Ca2+-activated K+ channels.
Methods and Results: Micromolar Ni2+, an agent that selectively blocks CaV3.2 but not CaV1.2/CaV3.1, was first shown to depolarize/constrict pressurized rat cerebral arteries; no effect was observed in CaV3.2−/− arteries. Structural analysis using 3-dimensional tomography, immunolabeling, and a proximity ligation assay next revealed the existence of microdomains in cerebral arterial smooth muscle which comprised sarcoplasmic reticulum and caveolae. Within these discrete structures, CaV3.2 and ryanodine receptor resided in close apposition to one another. Computational modeling revealed that Ca2+ influx through CaV3.2 could repetitively activate ryanodine receptor, inducing discrete Ca2+-induced Ca2+ release events in a voltage-dependent manner. In keeping with theoretical observations, rapid Ca2+ imaging and perforated patch clamp electrophysiology demonstrated that Ni2+ suppressed Ca2+ sparks and consequently spontaneous transient outward K+ currents, large-conductance Ca2+-activated K+ channel mediated events. Additional functional work on pressurized arteries noted that paxilline, a large-conductance Ca2+-activated K+ channel inhibitor, elicited arterial constriction equivalent, and not additive, to Ni2+. Key experiments on human cerebral arteries indicate that CaV3.2 is present and drives a comparable response to moderate constriction.
Conclusions: These findings indicate for the first time that CaV3.2 channels localize to discrete microdomains and drive ryanodine receptor–mediated Ca2+ sparks, enabling large-conductance Ca2+-activated K+ channel activation, hyperpolarization, and attenuation of cerebral arterial constriction. (Circ Res. 2014;115:650-661.)
Key Words: calcium channels calcium channels, T-type calcium signaling cerebral arteries muscle, smooth, vascular potassium channels, calcium-activated vasodilation
Original received March 28, 2014; revision received July 29, 2014; accepted July 31, 2014. In June 2014, the average time from submission to first decision for all original research papers submitted to Circulation Research was 15 days.
From the Department of Physiology and Pharmacology, Hotchkiss Brain and Libin Cardiovascular Institutes (O.F.H., R.R.A.E.-R., K.B.-S., S.E.B., R.E.M., B.D.K., A.P.B., D.G.W.), Department of Electrical and Computer Engineering (K.B.-S., E.J.V., A.N.), Department of Clinical Neurosciences (B.K.M., T.W., Y.S.), and Microscopy Imaging Facility (T.F.), University of Calgary, Calgary, Alberta, Canada; Department of Pharmacology and Toxicology, Alexandria University, Alexandria, Egypt (O.F.H.); Division of Pharmacology, Loma Linda University, CA (S.M.W., M.R.); Department of Biomedical Sciences, Colorado State University, Fort Collins (A.L.G.); Department of Pharmacology, University of Nevada, Reno (S.E.); LIRYC Institute and Lab IMB, University of Bordeaux, Bordeaux, France (E.J.V.); and Department of Biomedical Sciences, Grand Valley State University, Allendale, MI (P.R.M., D.T.K.).
*These authors are co-first authors and contributed equally to this article. The online-only Data Supplement is available with this article at http://circres.ahajournals.org/lookup/suppl/doi:10.1161/CIRCRESAHA.
114.304056/-/DC1. Correspondence to Donald G. Welsh, PhD, Department of Physiology and Pharmacology, GAA-14, Health Research Innovation Center, 3280 Hospital
Dr NW Calgary, Alberta T2N-4N1, Canada. E-mail dwelsh@ucalgary
CaV3.2 Channels and the Induction of Negative Feedback in Cerebral Arteries
Osama F. Harraz,* Rasha R. Abd El-Rahman,* Kamran Bigdely-Shamloo, Sean M. Wilson, Suzanne E. Brett, Monica Romero, Albert L. Gonzales, Scott Earley, Edward J. Vigmond,
Anders Nygren, Bijoy K. Menon, Rania E. Mufti, Tim Watson, Yves Starreveld, Tobias Furstenhaupt, Philip R. Muellerleile, David T. Kurjiaka, Barry D. Kyle,
Andrew P. Braun, Donald G. Welsh
by guest on June 12, 2018http://circres.ahajournals.org/
Dow
nloaded from
by guest on June 12, 2018http://circres.ahajournals.org/
Dow
nloaded from
by guest on June 12, 2018http://circres.ahajournals.org/
Dow
nloaded from
by guest on June 12, 2018http://circres.ahajournals.org/
Dow
nloaded from
by guest on June 12, 2018http://circres.ahajournals.org/
Dow
nloaded from
by guest on June 12, 2018http://circres.ahajournals.org/
Dow
nloaded from
by guest on June 12, 2018http://circres.ahajournals.org/
Dow
nloaded from
by guest on June 12, 2018http://circres.ahajournals.org/
Dow
nloaded from
by guest on June 12, 2018http://circres.ahajournals.org/
Dow
nloaded from
by guest on June 12, 2018http://circres.ahajournals.org/
Dow
nloaded from
by guest on June 12, 2018http://circres.ahajournals.org/
Dow
nloaded from
by guest on June 12, 2018http://circres.ahajournals.org/
Dow
nloaded from
by guest on June 12, 2018http://circres.ahajournals.org/
Dow
nloaded from
by guest on June 12, 2018http://circres.ahajournals.org/
Dow
nloaded from
by guest on June 12, 2018http://circres.ahajournals.org/
Dow
nloaded from
by guest on June 12, 2018http://circres.ahajournals.org/
Dow
nloaded from
by guest on June 12, 2018http://circres.ahajournals.org/
Dow
nloaded from
by guest on June 12, 2018http://circres.ahajournals.org/
Dow
nloaded from
by guest on June 12, 2018http://circres.ahajournals.org/
Dow
nloaded from
by guest on June 12, 2018http://circres.ahajournals.org/
Dow
nloaded from
by guest on June 12, 2018http://circres.ahajournals.org/
Dow
nloaded from
by guest on June 12, 2018http://circres.ahajournals.org/
Dow
nloaded from
by guest on June 12, 2018http://circres.ahajournals.org/
Dow
nloaded from
by guest on June 12, 2018http://circres.ahajournals.org/
Dow
nloaded from
by guest on June 12, 2018http://circres.ahajournals.org/
Dow
nloaded from

Harraz et al Vascular CaV3.2 and Negative Feedback 651
Voltage-gated Ca2+ channels are heteromultimeric complex-es that comprise a pore-forming α
1 subunit and auxiliary sub-
units that influence gating and protein trafficking to the plasma membrane.12 In cerebral arterial smooth muscle, the L-type Ca
V1.2 channel is the dominant Ca2+ entry pathway by which
vasoactive stimuli set cytosolic [Ca2+]i and consequently tone
development.6,13 Recent studies have noted that, in addition to Ca
V1.2, T-type channels (ie, Ca
V3.1 and Ca
V3.2) are also
expressed in rat and mouse cerebral arteries.14–16 It has been argued that the T-type conductance, like that of Ca
V1.2, plays
a direct role in elevating cytosolic [Ca2+]i, albeit at hyperpolar-
ized potentials attributable to a leftward shift in their voltage dependence.14,15,17 Earlier reports have, however, suggested that the relationship between T-type channels and arterial tone is more complex with Ca2+ influx via Ca
V3.2 potentially acting
in a discrete fashion to influence a defined target. Speculation of the downstream effector does vary, ranging from nitric ox-ide synthase in the endothelium to Ca2+-activated channels in the smooth muscle.18–20
The large-conductance Ca2+-activated K+ channel (BKCa
) is expressed in cerebral arterial smooth muscle, and its principal role is to feedback upon and limit excessive con-striction.21,22 Vasoconstrictor stimuli enhance BK
Ca activity
through arterial depolarization and augmentation of Ca2+ spark generation. Ca2+ sparks are discrete sarcoplasmic reticulum (SR)–driven events that arise in response to the transient opening of ryanodine receptors (RyRs).23 Although the functional significance of Ca2+ sparks is recognized,22–24 the mechanistic events that initiate repetitive SR release remain ambiguous, with current theories suggesting a role for Ca
V1.2 or transient receptor potential vanilloid 4 chan-
nel in triggering the cytosolic or luminal gate of RyR.25–27 Decidedly absent from this discussion has been a potential role for a T-type conductance.
The present study tested whether CaV3.2 channel triggers
Ca2+ spark generation, BKCa
channel activation, and ulti-mately negative feedback control of cerebral arterial tone. Our examination progressed from cellular to tissue level and involved the integrative use of pressurized vessel myogra-phy, electrophysiology, confocal and electron microscopy, and computational modeling. In rat cerebral arteries, we specifically show that Ca
V3.2 and RyR colocalize within a
microdomain and that steady-state depolarization activates Ca
V3.2 to trigger Ca2+ sparks. We subsequently show that
CaV3.2-evoked Ca2+ sparks activate BK
Ca channels, contrib-
uting to hyperpolarization that attenuates myogenic con-striction. We further demonstrate that this negative feedback mechanism is not limited to rat arteries but extends to the human cerebral circulation. Overall, this study is the first to illustrate that localized Ca2+ influx through T-type Ca2+
channels in vascular smooth muscle plays an important but indirect role in setting arterial tone by targeting key conduc-tances involved in V
M regulation.
Materials and MethodsFemale Sprague Dawley rats were euthanized by CO
2 asphyxiation as
approved by the Animal Care and Use Committee at the University of Calgary. Rat brains were removed, placed in cold PBS, and middle and posterior cerebral arteries were isolated. Human cerebral arteries were extracted from resected brain tissue according to the University of Calgary Institutional Review Board. Structural analysis was per-formed using confocal, electron, and epifluorescence approaches. Vasomotor/V
M responses were subsequently assessed with the aid
of pressure myography. Conventional, perforated, and on-cell patch clamp electrophysiology was used to record whole-cell and single-channel voltage-gated Ca2+ and BK
Ca currents. Data are presented as
means±SEM; paired or unpaired t tests were performed where ap-propriate, and a P<0.05 was considered statistically significant. An expanded version of the Materials and Methods can be found in the Online Data Supplement.
ResultsCaV3.2 Inhibition: Vasomotor and Electric Responses in Rat Cerebral ArteriesOur examination began by confirming the ability of 50 μmol/L Ni2+ or 200 nmol/L nifedipine to block Ca
V3.2 and
CaV1.2 currents, respectively, in tSA-201 cells. Figure 1A il-
lustrates that Ni2+ effectively abolished inward Ba2+ current through Ca
V3.2 channels without affecting charge movement
through CaV1.2 or Ca
V3.1 (Online Figure I). In comparison,
nifedipine selectively blocked CaV1.2 channels (Online
Figure I). Moving to rat cerebral arterial smooth muscle cells, we next monitored the nifedipine-insensitive Ba2+ current, a conductance that is dominated by T-type chan-nels and is stable over time (Online Figure IIA and IIB).28,29 Nickel partially attenuated this native inward current, a find-ing consistent with Ca
V3.2 channel expression (Figure 1B).
On-cell recordings further denoted T-type activity in rat ce-rebral arterial smooth muscle. While Ca
V1.2 channels were
blocked, single-channel activity was observed at hyperpolar-ized voltages (−50 to −20 mV), and slope conductance was 8.5 pS. The subsequent application of Ni2+ to endothelial-denuded arteries enhanced myogenic tone at 20 to 80 mm Hg (Figure 1C and 1D). Control experiments confirmed that arte-rial responses to pressure were repeatable over time (Online Figure IIC). Coincident with arterial constriction was an Ni2+-induced depolarization of 5±0.9 mV in pressurized ar-teries (Figure 1E and 1F). The latter observation inferred that Ca
V3.2-mediated Ca2+ influx could elicit hyperpolarization
and dilation through a smooth muscle signaling mechanism. In theory, this hyperpolarization could be triggered through localized Ca2+ entry initiating RyR-mediated Ca2+ sparks, SR events that activate BK
Ca channels.18,19,23 Nickel’s effects on
the nifedipine-insensitive Ba2+ current and arterial tone were reversible (not shown).
Microdomains and the Colocalization of CaV3.2 and RyRCa
V3.2 and RyR reside in the plasma and SR membranes,
respectively. For these proteins to functionally interact, there must be regions where the 2 membranes come into close
Nonstandard Abbreviations and Acronyms
BKCa large-conductance Ca2+-activated K+ channel
RyR ryanodine receptor
SR sarcoplasmic reticulum
STOC spontaneous transient outward K+ current
VM membrane potential
by guest on June 12, 2018http://circres.ahajournals.org/
Dow
nloaded from

652 Circulation Research September 12, 2014
apposition. With this in mind, 3-dimensional electron tomog-raphy assayed for microdomains; image analysis and model reconstruction revealed the presence of microstructures which comprised caveolae and SR (Figure 2A–2C). These discrete regions were ≈500 to 600 nm in length and were circumfer-entially discontinuous. Immunogold labeling subsequently confirmed that RyR localized to regions underneath caveolae, whereas Ca
V3.2 was confined to the plasma membrane in-or-
close to caveolae (Figure 2D–2F).To strengthen the emerging relationship between Ca
V3.2
and RyR, the preceding structural work was supplemented with an immunohistochemical analysis of fixed cerebral arteries using antibodies against actin, Ca
V3.2, and RyR.
Findings in Figure 3A first illustrate that actin labeling runs lengthwise in cerebral arterial smooth muscle cells, fading every 7 to 10 μm as actin leaves the viewing plane. Ca
V3.2
staining was circumferential and often observed in regions devoid of smooth muscle actin. A similar circumferential pattern was observed for RyR2, a finding indicative although not definitive for colocalization with Ca
V3.2 (Figure 3B).
Unlike CaV3.2 and RyR, Ca
V1.2 labeling was ribbon-like
and ran lengthwise in smooth muscle (Figure 3C). A prox-imity ligation assay was subsequently performed, and con-sistent with Ca
V3.2 and RyR2 residing within 40 nm of one
another, punctate red fluorescent product was observed in
myocytes treated with both primary and secondary anti-bodies (Figure 4A). Reaction product was absent in control experiments where one or both primary antibodies were re-moved (Figure 4B–4D).
CaV3.2, RyR-Mediated Ca2+ Release, and the Induction of BKCa ActivityTo ascertain at a conceptual level whether Ca2+ flux through Ca
V3.2 channels could activate RyR to initiate Ca2+ sparks, a
computational model was designed. The microdomain model (Figure 5A) was developed based on the preceding structural data, measurements of Ca
V channel activity, and mathemati-
cal representations of other Ca2+ transporters/binding proteins. Findings illustrate that a depolarizing stimulus (from −60 to −40 mV) elicits Ca2+ spark-like events in the subspace be-tween the plasma membrane and the SR (Figure 5B). These repetitive events fire at a frequency of ≈0.11 Hz and are fully abolished with RyR blockade (Figure 5C). In keeping with a role for Ca
V3.2, the elimination of this conductance attenu-
ated these spark-like events (≈59% inhibition, Figure 5D). A broader voltage-dependent analysis also revealed that the frequency of Ca2+ spark-like events rose with depolarization (Figure 5E).
Moving forward to experimentally explore the CaV3.2/RyR
relationship, Ca2+ imaging and line scan analysis were used to monitor Ca2+ sparks in rat cerebral arteries (Figure 6A). In
Figure 1. Effects of Ni2+ on CaV3.2 currents, myogenic tone, and membrane potential (VM). A, Representative traces and summary data of inward currents in CaV3.2-transfected tSA-201 cells in the absence and presence of Ni2+ (CaV3.2 blocker, 50 μmol/L). A voltage step from −90 to −10 mV was used to evoke inward Ba2+ current (n=5; *P<0.05, paired t test). B, T-type current in rat cerebral arterial smooth muscle before and after Ni2+ (50 μmol/L). Experiments were performed in the presence of nifedipine (200 nmol/L) to block L-type Ca2+ channels. A voltage step from −90 to 0 mV was used to elicit inward current (n=8; *P<0.05, paired t test). C and D, Single-channel recordings and summary current–voltage relationship (n=5; slope conductance=8.5 pS) of T-type Ca2+ currents in cerebral arterial myocytes. On-cell recording was performed at −50 to −10 mV in the presence of nifedipine (200 nmol/L), 60 mmol/L Ca2+, and 50 mmol/L TEA-Cl (tetraethylammonium chloride) to block K+ channels. E and F, Rat middle or posterior cerebral arteries were pressurized from 20 to 100 mm Hg, whereas diameter was monitored under control conditions, in the presence of Ni2+ (50 μmol/L) and in Ca2+-free medium. Representative traces (E) and summary data (F) display augmented arterial tone in response to Ni2+ (n=7; *P<0.05, paired t test). G and H, Arterial VM in pressurized cerebral arteries (60 mm Hg) in the absence and presence of Ni2+ (50 μmol/L). Illustrative traces (G) and summary data (H) reveal the depolarizing effect of Ni2+ (n=6; *P<0.05, paired t test).
by guest on June 12, 2018http://circres.ahajournals.org/
Dow
nloaded from

Harraz et al Vascular CaV3.2 and Negative Feedback 653
opened tissues, Ca2+ sparks were observed in 57% of 291 line scans with a mean frequency of 0.0148 sparks/μm per sec-ond. Subsequent application of Ni2+ reduced event frequency by 53% (Figure 6A–6C) and had a significant effect on the spatial/temporal characteristics of Ca2+ sparks (Online Figure III). Given these positive observations, we next used perfo-rated patch clamp electrophysiology to monitor spontane-ous transient outward K+ currents (STOCs), BK
Ca-mediated
events in response to Ca2+ spark generation.21–23 Findings in Figure 6D show that STOCs were robustly observed in ce-rebral arterial myocytes and their frequency increased as the holding V
M was stepped from −40 to −20 mV. The subsequent
application of 50 μmol/L Ni2+ reduced STOC frequency at −40 but not −20 mV, a finding consistent with the voltage dependence of Ca
V3.2 channels. The reduction in STOC fre-
quency occurred without effect on amplitude (Figure 6D). In comparison, STOCs were abolished by 1 μmol/L paxilline, a BK
Ca inhibitor (Figure 6E). Control experiments (Online
Figure IV) confirmed that peak inward/outward current in myocytes, slowly ramped from −60 to +20 mV, was unaffect-ed by Ni2+. They also confirmed that 200 nmol/L nifedipine does not reduce STOC frequency at −40 mV (n=4: control, 70±15 events/min; nifedipine, 62±12 events/min). Overall,
these results support the view Ca2+ influx via CaV3.2 channels
drives BKCa
activity via a mechanism involving RyR and the induction of Ca2+ sparks.
Further functional experiments were sought to empha-size the relationship between Ca
V3.2, BK
Ca activity, and the
attenuation of arterial constriction. First, Figure 7A and 7B reveals that BK
Ca blockade (paxilline, 1 μmol/L) enhanced
myogenic tone at intravascular pressures <80 mm Hg, akin to Ni2+ (Figure 1C and 1D). Second, when Ni2+ and paxil-line were sequentially added, the first agent induced con-striction, whereas the second had little or no additional effect (Figure 7C–7F). Control experiments confirmed that Ni2+-induced constriction at 60 mm Hg was absent in mes-enteric arteries isolated from Ca
V3.2−/− mice (Figure 7G and
7H). Overall, these results are consistent with CaV3.2 and
BKCa
channels working cooperatively within a common signaling pathway.
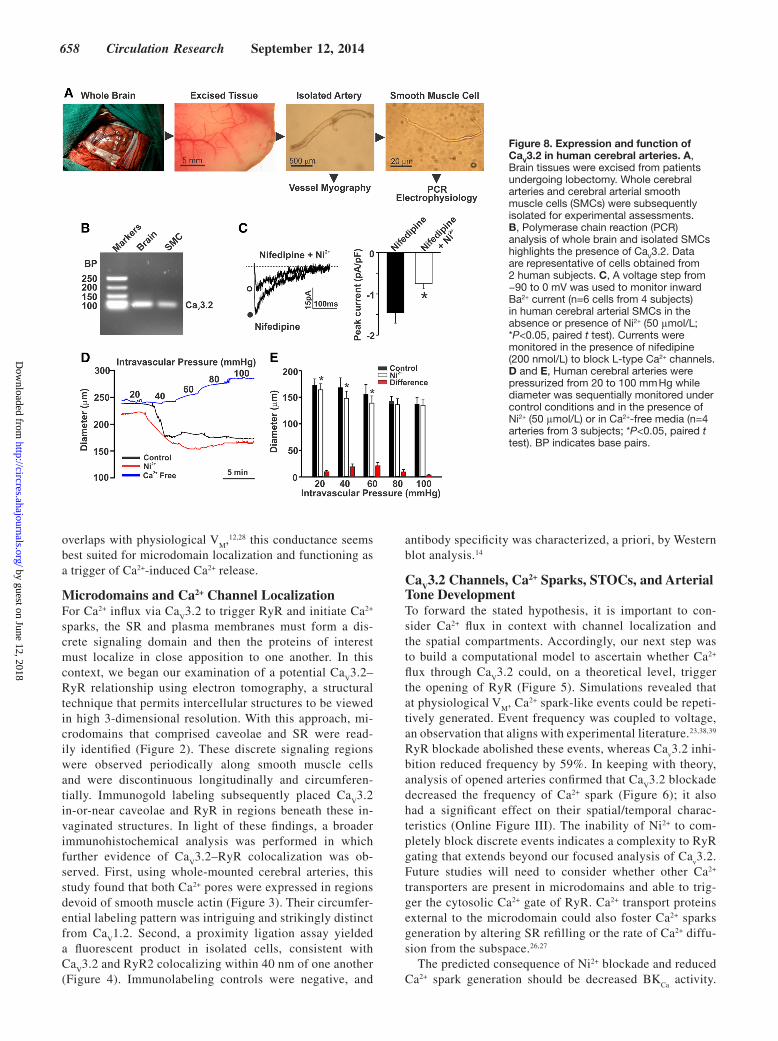
CaV3.2 in Human Cerebral ArteriesA final set of experiments was conducted on human cerebral arteries to ascertain the translational impact of the preced-ing findings. Cerebral arteries were isolated from brain tis-sues resected from patients undergoing temporal lobectomy
Figure 2. Electron microscopic imaging of rat cerebral arterial smooth muscle cells (SMCs). A, Tissue sections (300 nm thick) were used to generate a contiguous stack of 2-dimensional photomicrographs (≈3.5 nm resolution); subcellular structures were subsequently traced on each section. B and C, Three-dimensional models of discrete membranous regions where caveolae and sarcoplasmic reticulum are in close apposition to one another. D and E, Transmission electron microscopy and immunogold labeling of ryanodine receptor (RyR; D) or CaV3.2 channels (E) in rat cerebral arteries. RyR labeling (arrowheads) can be observed in membranes localized beneath the plasma membrane. CaV3.2 labeling (arrowheads) was confined to the plasma membrane in association with caveolae. Boxed areas were magnified in the lower micrographs. F, Control experiments showed no electron-dense particles. Each photomicrograph is representative of 3 independent preparations.
by guest on June 12, 2018http://circres.ahajournals.org/
Dow
nloaded from

654 Circulation Research September 12, 2014
(Figure 8A). Polymerase chain reaction analysis on iso-lated smooth muscle cells, prescreened for endothelial con-tamination, illustrated that Ca
V3.2 mRNA was expressed
(Figure 8B). Whole-cell patch clamp electrophysiology subsequently confirmed the presence of a nifedipine-insen-sitive current that was partially sensitive to 50 μmol/L Ni2+
Figure 3. CaV3.2 displays localization patterns similar to ryanodine receptor 2 (RyR2) in rat cerebral arteries. A, Cerebral arteries were labeled with antibodies against smooth muscle actin (green) and CaV3.2 (red). Labeling of CaV3.2 ran perpendicular (arrowheads) to the longitudinal axis of smooth muscle cells (SMCs; arrow) in regions devoid of smooth muscle actin. Bottom, Smooth muscle actin and CaV3.2 are displayed separately. B, Immunohistochemical staining of RyR (red) localized to areas where actin (green) was absent. Magnified panels show RyR was perpendicular to the longitudinal axis of SMCs. C, CaV1.2 labeling (arrowheads) was parallel to the longitudinal axis of SMCs (arrow). Right, The boxed area (middle) is magnified. Photomicrographs are representative of 3 independent experiments.
Figure 4. Proximity ligation assay of CaV3.2 and ryanodine receptor 2 (RyR2) in rat cerebral arterial smooth muscle cells. A, A gallery representation reveals the presence of red fluorescent product consistent with CaV3.2 and RyR colocalization within 40 nm of one another. Nuclei were labeled with Hoechst 33342 (blue). B, Assay was performed with no primary antibodies. C and D, Assay controls were developed with 1 primary antibody. Scale bars are 10 μm, and optical section depth in each image is 0.3 to 0.5 μm. Photomicrographs are representative of ≈10 to 20 smooth muscle cells, and the assay was tested 2 to 3 times for each panel.
by guest on June 12, 2018http://circres.ahajournals.org/
Dow
nloaded from

Harraz et al Vascular CaV3.2 and Negative Feedback 655
(Figure 8C). Analogous to rat, Ni2+ application to human ce-rebral arteries elicited constriction and enhanced myogenic tone at pressure values ≤60 mm Hg (Figure 8D and 8E). These findings confirm that Ca
V3.2 is not only expressed in
human myocytes, but its paradoxical role in tone develop-ment is likely akin to the rat.
DiscussionThis study delineated Ca
V3.2 channels in cerebral arterial
smooth muscle and determined whether this T-type con-ductance triggers Ca2+ sparks and consequently BK
Ca chan-
nels to elicit feedback control of arterial tone. Experiments progressed from cells to tissues and incorporated
electrophysiology, cellular imaging, and computational modeling. Patch clamp electrophysiology confirmed the presence of a Ca
V3.2 current in cerebral arterial smooth mus-
cle cells, a conductance selectivity blocked by micromolar Ni2+. In pressurized arteries, Ca
V3.2 blockade induced unex-
pected depolarization and constriction, a result indicative of Ca
V3.2 involvement in a dilatory process. A combination of
structural and protein localization techniques revealed that Ca
V3.2 channels localize to microdomains in close appo-
sition to RyR. Computational modeling then conceptually revealed that Ca
V3.2 could gate RyR, elicit Ca2+ sparks, and
activate BKCa
channels. Consistent with these predictions, Ni2+ inhibited Ca2+ spark production and STOC generation
Figure 5. Computational modeling of the role of CaV3.2 in smooth muscle Ca2+ dynamics. A, A computational model was developed using structural and electrophysiological data. The model consists of an 8.5-μm slice of an arterial smooth muscle cell. The microdomain is 600 nm in length and 15 nm from the sarcoplasmic reticulum (SR). Membrane proteins have been distributed, and the level of expression was set by optimization procedures. Key proteins include CaV1.2, CaV3.1, CaV3.2, ryanodine receptor (RyR), Na+/ Ca2+ exchanger (NCX), SERCA (sarco/endoplasmic reticulum Ca2+ ATPase)/PMCA (plasma membrane Ca2+ ATPase) pumps, calmodulin, and calsequestrin. Concentration of Ca2+ was calculated in the subspace region ([Ca2+]ss). B, Simulations display repetitive Ca2+ spark-like events in response to depolarization from −60 to −40 mV. C and D, Spark-like events were fully abolished by RyR inhibition and attenuated by CaV3.2 blockade. E, Frequency of Ca2+ sparks increased with depolarization.
by guest on June 12, 2018http://circres.ahajournals.org/
Dow
nloaded from

656 Circulation Research September 12, 2014
at physiological voltages. Further functional analysis rein-forced this linkage by extending experiments to humans. In summary, this study is the first to demonstrate that Ca
V3.2
drives a local Ca2+-induced Ca2+ release event that restrains cerebral arterial constriction by triggering Ca2+ sparks and BK
Ca channel activation.
BackgroundThe depolarization of cerebral arterial smooth muscle aug-ments extracellular Ca2+ influx through the activation of voltage-gated Ca2+ channels. This response elevates global [Ca2+]
i, enhances myosin light chain phosphorylation, and
augments arterial tone development.6,9 Ca2+ channels are categorized according to the pore-forming α
1−subunit,12
and in cerebral arterial smooth muscle, the L-type Cav1.2 is
considered the primary conductance governing Ca2+ entry.6 Although Ca
V1.2 is a dominant conductance, recent studies
have begun to acknowledge the expression of low-voltage activated Ca2+ channels in cerebral arteries.14,15,28 T-type channels are the sole members of this subfamily, and as their name suggests, their activation/inactivation pro-files are leftward shifted compared with the high-voltage
activated L-type Ca2+ channels.12,28 CaV3.1 and Ca
V3.2 are
expressed in arterial smooth muscle, and recent work sug-gests that Ca2+ entry through one or both T-type channels could elevate global [Ca2+]
i, albeit at more hyperpolar-
ized potentials, to modestly facilitate myogenic tone.14–17,29 Although Ca2+ entry through T-type channels could drive bulk [Ca2+]
i changes, it could also elicit localized increases
to gate conductances tied to VM
regulation.18,19 To date, evi-dence of discrete Ca2+ signaling is limited in vascular tis-sue although studies have alluded to this possibility given the unexpected impairment of arterial dilation after Ca
V3.2
blockade.19,30
Cav3.2 Channels in Cerebral ArteriesStudying vascular T-type channels is challenging because pharmacological tools display minimal subtype selectiv-ity. The one exception is Ni2+ which, at low micromolar concentrations, selectively blocks Ca
V3.2 over Ca
V3.1
or CaV1.2, the primary Ca2+ channels in vascular smooth
muscle.28,31 We confirmed Ni2+ selectivity by transfecting the preceding Ca
Vx.x subunits into tSA-201 cells and moni-
toring the inward Ba2+ current (Figure 1; Online Figure I).
Figure 6. CaV3.2 suppression attenuates the generation of Ca2+ sparks and spontaneous transient outward K+ currents (STOCs). A, Line scan imaging performed on posterior and middle rat cerebral arteries to ascertain Ca2+ spark generation under control conditions and in the presence of Ni2+ (50 μmol/L). Arrowheads denote the presence of Ca2+ sparks. B and C, Summary data highlight Ca2+ sparks frequency (sparks/μm per second) and the number of line scans in which Ca2+ sparks were detected (n=6 arteries, 291 line scans in total; *P<0.05, paired t test). D, Representative traces and summary data of STOC measurements under control conditions and in the presence of Ni2+ (50 μmol/L; n=8; *P<0.05, paired t test). Holding membrane potentials were set at −40 or −20 mV. E, STOCs were monitored before and after the application of paxilline (1 μmol/L; n=8; *P<0.05, paired t test). SMC indicates smooth muscle cell.
by guest on June 12, 2018http://circres.ahajournals.org/
Dow
nloaded from

Harraz et al Vascular CaV3.2 and Negative Feedback 657
Moving into cerebral arterial myocytes and focusing on the nifedipine-insensitive current dominated by T-type activ-ity,28,29 Ni2+ attenuated but did not abolish this conductance, consistent with expression of both Ca
V3.2 and Ca
V3.1. On-
cell electrophysiology further confirmed successful single-channel recordings with a slope conductance consistent with T-type channels.32 Although only a handful of vascular studies have exploited differential Ni2+ sensitivity to isolate Ca
V3.2 currents,19,28,33 this approach is commonly used in
cardiac/neuronal tissues to isolate this conductance and to ascertain its cellular function.34,35 In this context, we show for the first time that selective Ca
V3.2 blockade augmented
myogenic tone, findings paradoxical to typical vasodilatory effects of Ca2+ channel blockers.6,14,15 The enhancement of tone resulted from the ability of Ni2+ to depolarize arterial V
M. These observations along with earlier reports19 indicate
that Cav3.2 might elicit localized rise in cytosolic [Ca2+]
i
that gates a K+ conductance that limits arterial constriction.In the cerebral circulation, BK
Ca channels moderate vaso-
constriction to agonists and elevated intravascular pressure.
The channel comprises 4 pore-forming α1-subunits and 4
β1-subunits to confer Ca2+ sensitivity.24,36 To activate BK
Ca,
[Ca2+]i must discretely rise to micromolar levels and this is
achieved through Ca2+ spark generation, SR events depen-dent on RyR gating.21,22,24 The opening of RyR is an inte-grated process, partially reliant on extracellular Ca2+ entry triggering the RyR cytosolic Ca2+ sensor. The identity of this entry channel is uncertain although past studies have alluded to candidates including transient receptor potential vanil-loid 4 channel25 and L-type channels.26,27,37 Although both are plausible candidates, their intrinsic properties are some-what inconsistent with a triggering role. Transient receptor potential vanilloid 4 channel displays voltage-independent properties, yet Ca2+ spark generation is graded in a voltage-dependent manner. L-type channels exhibit Ca2+-dependent inactivation and if positioned in a diffusion-restriction mi-crodomain, high [Ca2+]
i would elicit strong inactivation,
impinging on its ability to activate the RyR cytosolic gate. Because Ca
V3.2 channels are voltage gated, free of Ca2+-
dependent inactivation, and display a voltage window that
Figure 7. Effects of Ni2+ and paxilline on myogenic tone in rat cerebral arteries. A, Middle and posterior cerebral arteries were gradually pressurized from 20 to 100 mm Hg while diameter was monitored. The experiment was performed under control conditions and in the presence of paxilline (1 μmol/L) or in Ca2+-free media. B, Summary data of the experiment in A (n=6; *P<0.05, paired t test). C and D, Traces and summary data illustrate the effects of sequential exposure to Ni2+ (50 μmol/L) followed by paxilline (1 μmol/L; n=7; *P<0.05, paired t test). E and F, The order of Ni2+ and paxilline in C was reversed (n=6; *P<0.05, paired t test). G and H, Traces and summary data illustrate the effects of Ni2+ (50 μmol/L) on pressurized mesenteric arteries (60 mm Hg) from wild-type (WT; n=4) and CaV3.2 knockout (n=6) mice (*P<0.05, unpaired t test).
by guest on June 12, 2018http://circres.ahajournals.org/
Dow
nloaded from
658 Circulation Research September 12, 2014
overlaps with physiological VM
,12,28 this conductance seems best suited for microdomain localization and functioning as a trigger of Ca2+-induced Ca2+ release.
Microdomains and Ca2+ Channel LocalizationFor Ca2+ influx via Ca
V3.2 to trigger RyR and initiate Ca2+
sparks, the SR and plasma membranes must form a dis-crete signaling domain and then the proteins of interest must localize in close apposition to one another. In this context, we began our examination of a potential Ca
V3.2–
RyR relationship using electron tomography, a structural technique that permits intercellular structures to be viewed in high 3-dimensional resolution. With this approach, mi-crodomains that comprised caveolae and SR were read-ily identified (Figure 2). These discrete signaling regions were observed periodically along smooth muscle cells and were discontinuous longitudinally and circumferen-tially. Immunogold labeling subsequently placed Ca
V3.2
in-or-near caveolae and RyR in regions beneath these in-vaginated structures. In light of these findings, a broader immunohistochemical analysis was performed in which further evidence of Ca
V3.2–RyR colocalization was ob-
served. First, using whole-mounted cerebral arteries, this study found that both Ca2+ pores were expressed in regions devoid of smooth muscle actin (Figure 3). Their circumfer-ential labeling pattern was intriguing and strikingly distinct from Ca
V1.2. Second, a proximity ligation assay yielded
a fluorescent product in isolated cells, consistent with Ca
V3.2 and RyR2 colocalizing within 40 nm of one another
(Figure 4). Immunolabeling controls were negative, and
antibody specificity was characterized, a priori, by Western blot analysis.14
CaV3.2 Channels, Ca2+ Sparks, STOCs, and Arterial Tone DevelopmentTo forward the stated hypothesis, it is important to con-sider Ca2+ flux in context with channel localization and the spatial compartments. Accordingly, our next step was to build a computational model to ascertain whether Ca2+ flux through Ca
V3.2 could, on a theoretical level, trigger
the opening of RyR (Figure 5). Simulations revealed that at physiological V
M, Ca2+ spark-like events could be repeti-
tively generated. Event frequency was coupled to voltage, an observation that aligns with experimental literature.23,38,39 RyR blockade abolished these events, whereas Ca
v3.2 inhi-
bition reduced frequency by 59%. In keeping with theory, analysis of opened arteries confirmed that Ca
V3.2 blockade
decreased the frequency of Ca2+ spark (Figure 6); it also had a significant effect on their spatial/temporal charac-teristics (Online Figure III). The inability of Ni2+ to com-pletely block discrete events indicates a complexity to RyR gating that extends beyond our focused analysis of Ca
v3.2.
Future studies will need to consider whether other Ca2+ transporters are present in microdomains and able to trig-ger the cytosolic Ca2+ gate of RyR. Ca2+ transport proteins external to the microdomain could also foster Ca2+ sparks generation by altering SR refilling or the rate of Ca2+ diffu-sion from the subspace.26,27
The predicted consequence of Ni2+ blockade and reduced Ca2+ spark generation should be decreased BK
Ca activity.
Figure 8. Expression and function of CaV3.2 in human cerebral arteries. A, Brain tissues were excised from patients undergoing lobectomy. Whole cerebral arteries and cerebral arterial smooth muscle cells (SMCs) were subsequently isolated for experimental assessments. B, Polymerase chain reaction (PCR) analysis of whole brain and isolated SMCs highlights the presence of CaV3.2. Data are representative of cells obtained from 2 human subjects. C, A voltage step from −90 to 0 mV was used to monitor inward Ba2+ current (n=6 cells from 4 subjects) in human cerebral arterial SMCs in the absence or presence of Ni2+ (50 μmol/L; *P<0.05, paired t test). Currents were monitored in the presence of nifedipine (200 nmol/L) to block L-type Ca2+ channels. D and E, Human cerebral arteries were pressurized from 20 to 100 mm Hg while diameter was sequentially monitored under control conditions and in the presence of Ni2+ (50 μmol/L) or in Ca2+-free media (n=4 arteries from 3 subjects; *P<0.05, paired t test). BP indicates base pairs.
by guest on June 12, 2018http://circres.ahajournals.org/
Dow
nloaded from

Harraz et al Vascular CaV3.2 and Negative Feedback 659
We assessed the latter using perforated patch clamp elec-trophysiology to monitor STOCs in arterial myocytes. As denoted in Figure 6D and 6E, Ni2+ application reduced STOC frequency at physiological voltages (−40 mV) and had an insignificant effect at depolarized potentials where Ca
v3.2 channels reside in the inactive state. In comparison,
paxilline abolished all STOC activity at both voltages. The voltage-dependent effect of Ni2+ is intriguing, and one that suggests that the ability of Ca
V3.2 to drive a feedback re-
sponse might be confined to a specific VM
range. Functional observations in Figure 1 align with this perspective in that the Ni2+ effect on myogenic was greatest at intravascular pressures (40–60 mm Hg) where arterial V
M will overlap
with the peak window current of CaV3.2. Given that pax-
illine augmented myogenic tone in an analogous manner to Ni2+, we can further suggest that Ca
V3.2 channels are
likely a dominant trigger of BKCa
in intact cerebral arteries (Figure 7). This view is further supported by our observa-tions that placing one blocker on another had no additive effect on arterial tone.
In interpreting the preceding findings, it is important to consider the possible off-target effects of Ni2+. Past studies have noted that under certain conditions this divalent can af-fect voltage-gated K+ and depolarizing transient receptor po-tential currents.40–43 Two lines of evidence indicate that such off-target effects are minimal in this study. First, electrophysi-ology revealed that Ni2+ had no effect on peak inward/outward current in smooth muscle cells ramped from −60 to 20 mV (Online Figure IV). Second, Ni2+ failed to alter tone in pax-illine-pretreated cerebral arteries or in vessels isolated from Ca
V3.2 knockout mice (Figure 7).
Translation to HumansOur work in rat cerebral arteries highlights a structural and functional association among Ca
V3.2, RyR, and BK
Ca, where-
by voltage-dependent Ca2+ influx drives Ca2+ sparks genera-tion and consequently arterial hyperpolarization. Although these foundational observations are unique and provocative, questions remained as to whether they translate to human tissue. In this context, we harvested human cerebral arteries from resection surgeries and repeated key experiments. We show that Ca
V3.2 mRNA is indeed present in human cerebral
arterial myocytes. Further, CaV3.2 is functionally expressed
because patch clamp electrophysiology delineated a Ni2+-sensitive T-type current. Finally, consistent with Ca
V3.2 driv-
ing arterial hyperpolarization, we found that Ni2+ constricted pressurized human cerebral arteries with an effect peaking at 60 mm Hg, where arterial V
M likely resides at −45 mV. These
findings are the first to note T-type Ca2+ channel expression in human cerebral circulation and that it has a unique physi-ological role.
SummaryVascular Ca2+ channels have been targets of investigative in-terest with Ca
v1.2 receiving particular attention given that
dihydropyridines induce profound arterial dilation. With the recent isolation of T-type Ca2+ channels,14,28,33 interest
has begun to shift toward defining their physiological func-tion.17,18,33 Vascular studies using blockers that do not dis-criminate among the T-type subunits have argued that they contribute modestly to global [Ca2+]
i albeit at hyperpolar-
ized potentials.14,17 The present study challenges this stereo-typic view by arguing that Ca2+ influx through Ca
V3.2 acts
in a localized manner to alter Ca2+-sensitive conductances involved in V
M regulation. Although this study focused
specifically on CaV3.2, RyR, and BK
Ca, it is intriguing to
speculate that CaV3.1 might also regulate a Ca2+-activated
target such as transient receptor potential melastatin 4 chan-nel or transmembrane member 16A channel, a Ca2+-activated Cl− conductance.44,45 Both conductances have been identified in arterial smooth muscle and linked to pressure-induced depolarization.44–46
In summary, this study delineated CaV3.2 channels, ex-
plored their cellular expression, and examined their relation-ship to tone development in the cerebral circulation. Our examination used theoretical and experimental approaches from computational modeling to structural analysis, electro-physiology, and pressure myography. Ca
V3.2 channels were
readily identified, shown to colocalize in microdomains with RyR to initiate Ca2+ sparks. These discrete events activate BK
Ca channels to facilitate arterial hyperpolarization and
drive a feedback response that moderates constrictor events including those initiated by intravascular pressure. Because Ca
V3.2 channels are present in other vascular beds,17,19,20,30
their feedback mechanism likely extends beyond the cerebral circulation. These findings also provide a straightforward explanation how Ca
V3.2 deletion paradoxically affects arte-
rial relaxation.19,30 This atypical CaV3.2 vasomotor response
entails further attention given the emerging potential use of therapeutic T-type blockers for hypertension, cerebral vaso-spasm, or pain.47–49
AcknowledgmentsWe thank Dr Gerald Zamponi and Lina Chen for providing rCa
Vx.x-
transfected cells. We thank Dr Frank Visser for polymerase chain re-action analysis and Dr Ray Turner and Mirna Kruskic for their help in the immunohistochemical analysis.
Sources of FundingThis work was supported by an operating grant from the Canadian Institutes of Health Research (MOP-69088 to D.G. Welsh). D.G. Welsh is an Alberta Innovates-Health Sciences (AIHS) senior scholar and holds a Canada Research Chair. O.F. Harraz is a Vanier Scholar (Canadian Institutes of Health Research) and is supported by salary studentships from Alberta Innovates (AIHS award) and Achievers in Medical Sciences. R.R. Abd El-Rahman was supported by Queen Elizabeth II Scholarship. Imaging was performed in the LLUSM Advanced Imaging and Microscopy Core with support of NSF grant No. MRI-DBI 0923559 to S.M. Wilson and the Loma Linda University School of Medicine. Calcium imaging was also supported in part by USPHS grant HD069746 to S.M. Wilson.
DisclosuresNone.
by guest on June 12, 2018http://circres.ahajournals.org/
Dow
nloaded from

660 Circulation Research September 12, 2014
References 1. Garcia-Roldan JL, Bevan JA. Flow-induced constriction and dilation of
cerebral resistance arteries. Circ Res. 1990;66:1445–1448. 2. Bevan JA, Garcia-Roldan JL, Joyce EH. Resistance artery tone is
influenced independently by pressure and by flow. Blood Vessels. 1990;27:202–207.
3. Si ML, Lee TJ. Alpha7-nicotinic acetylcholine receptors on cerebral peri-vascular sympathetic nerves mediate choline-induced nitrergic neurogenic vasodilation. Circ Res. 2002;91:62–69.
4. Brayden JE, Bevan JA. Neurogenic muscarinic vasodilation in the cat. An example of endothelial cell-independent cholinergic relaxation. Circ Res. 1985;56:205–211.
5. Filosa JA, Bonev AD, Straub SV, Meredith AL, Wilkerson MK, Aldrich RW, Nelson MT. Local potassium signaling couples neuronal activity to vasodilation in the brain. Nat Neurosci. 2006;9:1397–1403.
6. Knot HJ, Nelson MT. Regulation of arterial diameter and wall [Ca2+] in cerebral arteries of rat by membrane potential and intravascular pressure. J Physiol. 1998;508 (pt 1):199–209.
7. Gallagher PJ, Herring BP, Stull JT. Myosin light chain kinases. J Muscle Res Cell Motil. 1997;18:1–16.
8. Johnson RP, El-Yazbi AF, Takeya K, Walsh EJ, Walsh MP, Cole WC. Ca2+ sensitization via phosphorylation of myosin phosphatase targeting subunit at threonine-855 by Rho kinase contributes to the arterial myogenic re-sponse. J Physiol. 2009;587:2537–2553.
9. Cole WC, Welsh DG. Role of myosin light chain kinase and myosin light chain phosphatase in the resistance arterial myogenic response to intravas-cular pressure. Arch Biochem Biophys. 2011;510:160–173.
10. Welsh DG, Nelson MT, Eckman DM, Brayden JE. Swelling-activated cat-ion channels mediate depolarization of rat cerebrovascular smooth muscle by hyposmolarity and intravascular pressure. J Physiol. 2000;527 (pt 1):139–148.
11. Welsh DG, Morielli AD, Nelson MT, Brayden JE. Transient receptor po-tential channels regulate myogenic tone of resistance arteries. Circ Res. 2002;90:248–250.
12. Catterall WA. Voltage-gated calcium channels. Cold Spring Harb Perspect Biol. 2011;3:a003947.
13. Cheng X, Pachuau J, Blaskova E, Asuncion-Chin M, Liu J, Dopico AM, Jaggar JH. Alternative splicing of Cav1.2 channel exons in smooth muscle cells of resistance-size arteries generates currents with unique electrophysiological properties. Am J Physiol Heart Circ Physiol. 2009;297:H680–H688.
14. Abd El-Rahman RR, Harraz OF, Brett SE, Anfinogenova Y, Mufti RE, Goldman D, Welsh DG. Identification of L- and T-type Ca2+ channels in rat cerebral arteries: role in myogenic tone development. Am J Physiol Heart Circ Physiol. 2013;304:H58–H71.
15. Kuo IY, Ellis A, Seymour VA, Sandow SL, Hill CE. Dihydropyridine-insensitive calcium currents contribute to function of small cerebral arter-ies. J Cereb Blood Flow Metab. 2010;30:1226–1239.
16. Howitt L, Kuo IY, Ellis A, Chaston DJ, Shin HS, Hansen PB, Hill CE. Chronic deficit in nitric oxide elicits oxidative stress and augments T-type calcium-channel contribution to vascular tone of rodent arteries and arteri-oles. Cardiovasc Res. 2013;98:449–457.
17. Björling K, Morita H, Olsen MF, Prodan A, Hansen PB, Lory P, Holstein-Rathlou NH, Jensen LJ. Myogenic tone is impaired at low arterial pres-sure in mice deficient in the low-voltage-activated CaV 3.1 T-type Ca(2+) channel. Acta Physiol (Oxf). 2013;207:709–720.
18. Harraz OF, Welsh DG. T-type Ca²+ channels in cerebral arteries: approach-es, hypotheses, and speculation. Microcirculation. 2013;20:299–306.
19. Chen CC, Lamping KG, Nuno DW, Barresi R, Prouty SJ, Lavoie JL, Cribbs LL, England SK, Sigmund CD, Weiss RM, Williamson RA, Hill JA, Campbell KP. Abnormal coronary function in mice deficient in al-pha1H T-type Ca2+ channels. Science. 2003;302:1416–1418.
20. Svenningsen P, Andersen K, Thuesen AD, Shin HS, Vanhoutte PM, Skott O, Jensen BL, Hill C, Hansen PB. T-type Ca channels facilitate NO-formation, vasodilatation and NO-mediated modulation of blood pressure. Pflugers Arch. In press.
21. Pérez GJ, Bonev AD, Patlak JB, Nelson MT. Functional coupling of ry-anodine receptors to KCa channels in smooth muscle cells from rat cere-bral arteries. J Gen Physiol. 1999;113:229–238.
22. Pérez GJ, Bonev AD, Nelson MT. Micromolar Ca(2+) from sparks acti-vates Ca(2+)-sensitive K(+) channels in rat cerebral artery smooth muscle. Am J Physiol Cell Physiol. 2001;281:C1769–C1775.
23. Jaggar JH, Wellman GC, Heppner TJ, Porter VA, Perez GJ, Gollasch M, Kleppisch T, Rubart M, Stevenson AS, Lederer WJ, Knot HJ, Bonev AD, Nelson MT. Ca2+ channels, ryanodine receptors and Ca(2+)-activated K+ channels: a functional unit for regulating arterial tone. Acta Physiol Scand. 1998;164:577–587.
24. Brenner R, Peréz GJ, Bonev AD, Eckman DM, Kosek JC, Wiler SW, Patterson AJ, Nelson MT, Aldrich RW. Vasoregulation by the beta1 subunit of the calcium-activated potassium channel. Nature. 2000;407:870–876.
25. Earley S, Heppner TJ, Nelson MT, Brayden JE. TRPV4 forms a novel Ca2+ signaling complex with ryanodine receptors and BKCa channels. Circ Res. 2005;97:1270–1279.
26. Essin K, Welling A, Hofmann F, Luft FC, Gollasch M, Moosmang S. Indirect coupling between Cav1.2 channels and ryanodine receptors to generate Ca2+ sparks in murine arterial smooth muscle cells. J Physiol. 2007;584:205–219.
27. Takeda Y, Nystoriak MA, Nieves-Cintrón M, Santana LF, Navedo MF. Relationship between Ca2+ sparklets and sarcoplasmic reticulum Ca2+ load and release in rat cerebral arterial smooth muscle. Am J Physiol Heart Circ Physiol. 2011;301:H2285–H2294.
28. Harraz OF, Welsh DG. Protein kinase A regulation of T-type Ca2+ channels in rat cerebral arterial smooth muscle. J Cell Sci. 2013;126:2944–2954.
29. Harraz OF, Brett SE, Welsh DG. Nitric oxide suppresses vascular voltage-gated T-type Ca2+ channels through cGMP/PKG signaling. Am J Physiol Heart Circ Physiol. 2014;306:H279–H285.
30. Poulsen CB, Al-Mashhadi RH, Cribbs LL, Skøtt O, Hansen PB. T-type voltage-gated calcium channels regulate the tone of mouse efferent arteri-oles. Kidney Int. 2011;79:443–451.
31. Lee JH, Gomora JC, Cribbs LL, Perez-Reyes E. Nickel block of three cloned T-type calcium channels: low concentrations selectively block al-pha1H. Biophys J. 1999;77:3034–3042.
32. Fox AP, Nowycky MC, Tsien RW. Single-channel recordings of three types of calcium channels in chick sensory neurones. J Physiol. 1987;394:173–200.
33. Kuo IY, Howitt L, Sandow SL, McFarlane A, Hansen PB, Hill CE. Role of T-type channels in vasomotor function: team player or chameleon? Pflugers Arch. 2014;466:767–779.
34. Niwa N, Yasui K, Opthof T, Takemura H, Shimizu A, Horiba M, Lee JK, Honjo H, Kamiya K, Kodama I. Cav3.2 subunit underlies the functional T-type Ca2+ channel in murine hearts during the embryonic period. Am J Physiol Heart Circ Physiol. 2004;286:H2257–H2263.
35. Autret L, Mechaly I, Scamps F, Valmier J, Lory P, Desmadryl G. The in-volvement of Cav3.2/alpha1H T-type calcium channels in excitability of mouse embryonic primary vestibular neurones. J Physiol. 2005;567:67–78.
36. Plüger S, Faulhaber J, Fürstenau M, Löhn M, Waldschütz R, Gollasch M, Haller H, Luft FC, Ehmke H, Pongs O. Mice with disrupted BK channel beta1 subunit gene feature abnormal Ca(2+) spark/STOC coupling and elevated blood pressure. Circ Res. 2000;87:E53–E60.
37. Cheng X, Jaggar JH. Genetic ablation of caveolin-1 modifies Ca2+ spark coupling in murine arterial smooth muscle cells. Am J Physiol Heart Circ Physiol. 2006;290:H2309–H2319.
38. Nelson MT, Cheng H, Rubart M, Santana LF, Bonev AD, Knot HJ, Lederer WJ. Relaxation of arterial smooth muscle by calcium sparks. Science. 1995;270:633–637.
39. Jaggar JH, Stevenson AS, Nelson MT. Voltage dependence of Ca2+ sparks in intact cerebral arteries. Am J Physiol. 1998;274:C1755–C1761.
40. Cheng YM, Fedida D, Kehl SJ. Kinetic analysis of the effects of H+ or Ni2+ on Kv1.5 current shows that both ions enhance slow inactivation and induce resting inactivation. J Physiol. 2010;588:3011–3030.
41. Wang J, Shimoda LA, Sylvester JT. Capacitative calcium entry and TRPC channel proteins are expressed in rat distal pulmonary arterial smooth muscle. Am J Physiol Lung Cell Mol Physiol. 2004;286:L848–L858.
42. Ene FA, Kalmbach A, Kandler K. Metabotropic glutamate receptors in the lateral superior olive activate TRP-like channels: age- and experience-dependent regulation. J Neurophysiol. 2007;97:3365–3375.
43. Luebbert M, Radtke D, Wodarski R, Damann N, Hatt H, Wetzel CH. Direct activation of transient receptor potential V1 by nickel ions. Pflugers Arch. 2010;459:737–750.
44. Bulley S, Neeb ZP, Burris SK, Bannister JP, Thomas-Gatewood CM, Jangsangthong W, Jaggar JH. TMEM16A/ANO1 channels contribute to the myogenic response in cerebral arteries. Circ Res. 2012;111:1027–1036.
45. Earley S, Waldron BJ, Brayden JE. Critical role for transient receptor po-tential channel TRPM4 in myogenic constriction of cerebral arteries. Circ Res. 2004;95:922–929.
by guest on June 12, 2018http://circres.ahajournals.org/
Dow
nloaded from

Harraz et al Vascular CaV3.2 and Negative Feedback 661
46. Gonzales AL, Garcia ZI, Amberg GC, Earley S. Pharmacological inhibi-tion of TRPM4 hyperpolarizes vascular smooth muscle. Am J Physiol Cell Physiol. 2010;299:C1195–C1202.
47. Abe M, Okada K, Soma M. T-type Ca channel blockers in patients with chronic kidney disease in clinical practice. Curr Hypertens Rev. 2013;9:202–209.
48. Ball CJ, Wilson DP, Turner SP, Saint DA, Beltrame JF. Heterogeneity of L- and T-channels in the vasculature: rationale for the efficacy of combined L- and T-blockade. Hypertension. 2009;53:654–660.
49. François A, Laffray S, Pizzoccaro A, Eschalier A, Bourinet E. T-type calcium channels in chronic pain: mouse models and specific blockers. Pflugers Arch. 2014;466:707–717.
What Is Known?
• T-type (CaV3.1/Ca
V3.2) Ca2+ channels are expressed in cerebral arterial
smooth muscle.• T-type Ca2+ channels are thought to mediate arterial tone development
although the mechanisms remain uncertain.
What New Information Does This Article Contribute?
• CaV3.2 channels mediate a paradoxical dilation in pressurized cerebral
arteries.• Ca
V3.2 channels are located in microdomains in association with the
sarcoplasmic reticulum and ryanodine receptors.• Ca2+ influx through Ca
V3.2 channels triggers ryanodine receptors, gen-
erates transient Ca2+ sparks, and activates large-conductance Ca2+-activated K+ channels to elicit hyperpolarization.
T-type (CaV3.1/Ca
V3.2) Ca2+ channels are present in rat cerebral
arterial smooth muscle, but their functional significance is uncer-tain. We tested whether Ca
V3.2 channels might mediate dilation
rather than constriction by triggering Ca2+ sparks, discrete events
that initiate arterial hyperpolarization by activating large-con-ductance Ca2+-activated K+ channels. Micromolar Ni2+, a Ca
V3.2
blocker, constricted pressurized rat cerebral arteries. Structural analysis revealed microdomains that comprised sarcoplasmic reticulum and caveolae, with Ca
V3.2 and ryanodine receptors
residing next to each another. Modeling showed that Ca2+ influx through Ca
V3.2 could activate ryanodine receptors, and consistent
with theory, Ca2+ imaging and electrophysiology demonstrated that Ni2+ suppressed Ca2+ sparks and downstream large-con-ductance Ca2+-activated K+ channel activity. Ca
V3.2 channels are
also present in human cerebral arteries and drive a comparable response. In summary, we show for the first time that Ca2+ in-flux through Ca
V3.2 channels discretely activates Ca2+ sparks
and large-conductance Ca2+-activated K+ channels to elicit arte-rial hyperpolarization and dilation. This feedback mechanism will prevent cerebral arteries from overly constricting to strong stimuli such as intravascular pressure. This new knowledge challenges the stereotypical view that Ca2+ channels are singularly involved in mediating arterial constriction.
Novelty and Significance
by guest on June 12, 2018http://circres.ahajournals.org/
Dow
nloaded from
Donald G. WelshFurstenhaupt, Philip R. Muellerleile, David T. Kurjiaka, Barry D. Kyle, Andrew P. Braun and
Anders Nygren, Bijoy K. Menon, Rania E. Mufti, Tim Watson, Yves Starreveld, TobiasSuzanne E. Brett, Monica Romero, Albert L. Gonzales, Scott Earley, Edward J. Vigmond, Osama F. Harraz, Rasha R. Abd El-Rahman, Kamran Bigdely-Shamloo, Sean M. Wilson,
3.2 Channels and the Induction of Negative Feedback in Cerebral ArteriesVCa
Print ISSN: 0009-7330. Online ISSN: 1524-4571 Copyright © 2014 American Heart Association, Inc. All rights reserved.is published by the American Heart Association, 7272 Greenville Avenue, Dallas, TX 75231Circulation Research
doi: 10.1161/CIRCRESAHA.114.3040562014;115:650-661; originally published online August 1, 2014;Circ Res.
http://circres.ahajournals.org/content/115/7/650World Wide Web at:
The online version of this article, along with updated information and services, is located on the
http://circres.ahajournals.org/content/suppl/2014/08/01/CIRCRESAHA.114.304056.DC1Data Supplement (unedited) at:
http://circres.ahajournals.org//subscriptions/
is online at: Circulation Research Information about subscribing to Subscriptions:
http://www.lww.com/reprints Information about reprints can be found online at: Reprints:
document. Permissions and Rights Question and Answer about this process is available in the
located, click Request Permissions in the middle column of the Web page under Services. Further informationEditorial Office. Once the online version of the published article for which permission is being requested is
can be obtained via RightsLink, a service of the Copyright Clearance Center, not theCirculation Researchin Requests for permissions to reproduce figures, tables, or portions of articles originally publishedPermissions:
by guest on June 12, 2018http://circres.ahajournals.org/
Dow
nloaded from

SUPPLEMENTAL MATERIAL
CaV3.2 Channels and the Induction of Negative Feedback in Cerebral Arteries
Osama F. Harraz1,2,*, Rasha R. Abd El-Rahman1,*, Kamran Bigdely-Shamloo1,3, Sean M. Wilson4, Suzanne E. Brett1, Monica Romero4, Albert L. Gonzales5, Scott Earley6, Edward J.
Vigmond3,7, Anders Nygren3, Bijoy K. Menon8, Rania E. Mufti1, Tim Watson8, Yves Starreveld8, Tobias Furstenhaupt9, Philip R. Muellerleile10, David Kurjiaka10,
Barry D. Kyle1, Andrew P. Braun1 and Donald G. Welsh1,#
* OFH and RRA are co-first authors and contributed equally to the manuscript
1 Dept. of Physiology and Pharmacology, Hotchkiss Brain and Libin Cardiovascular Institutes, University of Calgary, Calgary, AB, Canada 2 Dept. of Pharmacology and Toxicology, Alexandria University, Alexandria, Egypt 3 Dept. of Electrical and Computer Engineering, University of Calgary, Calgary, AB, Canada 4 Division of Pharmacology, Loma Linda University, Loma Linda, CA, USA 5 Dept. of Biomedical Sciences, Colorado State University, Fort Collins, CO, USA 6 Dept. of Pharmacology, University of Nevada, Reno, NV, USA 7 LIRYC Institute and Lab IMB, University of Bordeaux, Bordeaux, France 8 Dept. of Clinical Neurosciences, University of Calgary, Calgary, AB, Canada 9 Microscopy Imaging Facility, University of Calgary, Calgary, AB, Canada 10 Dept. of Biomedical Sciences, Grand Valley State University, Allendale, MI, USA
Running Title: Vascular CaV3.2 and Negative Feedback
# Corresponding Author: Donald G. Welsh, PhD ([email protected])

SUPPLEMENTAL MATERIALS AND METHODS
Animal Procedures
Animal procedures were approved by the Animal Care and Use Committee at the University of Calgary. Briefly, female Sprague–Dawley rats (10–12 weeks of age) were killed via CO2 asphyxiation. The brain was carefully removed and placed in cold phosphate-buffered saline (PBS, pH 7.4) solution containing (in mM): 138 NaCl, 3 KCl, 10 Na2HPO4, 2 NaH2PO4, 5 glucose, 0.1 CaCl2 and 0.1 MgSO4. Middle and posterior cerebral arteries were carefully dissected out of surrounding tissue and cut into 2–3 mm segments. Human brain samples, from which small cerebral arteries (150 to 250 μm-diameter), were obtained with institutional review board approval and written informed consent according to the Declaration of Helsinki.
Isolation of Cerebral Arterial Smooth Muscle Cells
Smooth muscle cells from middle and posterior cerebral arteries were enzymatically isolated as previously described. Briefly, arterial segments were placed in an isolation medium (37 °C, 10 min) containing (in mM): 60 NaCl, 80 Na-glutamate, 5 KCl, 2 MgCl2, 10 glucose and 10 HEPES with 1 mg/ml bovine serum albumin (pH 7.4). Vessels were then exposed to a two-step digestion process that involved: 1) 12-15 min incubation in isolation medium (37 °C) containing 0.5 mg/ml papain and 1.5 mg/ml dithioerythritol; and 2) a 15 minutes incubation in isolation medium containing 100 μM Ca2+, 0.7 mg/ml type F collagenase and 0.4 mg/ml type H collagenase. Following incubation, tissues were washed repeatedly with ice-cold isolation medium and triturated with a fire-polished pipette. Liberated cells were stored in ice-cold isolation medium for use the same day within ~5 hr.
Electrophysiological Recordings
Conventional patch-clamp electrophysiology was used to monitor whole-cell voltage-gated Ca2+ channel currents in isolated smooth muscle cells as reported earlier. Recording electrodes (5-8 MΩ) were pulled from borosilicate glass microcapillary tubes (Sutter Instruments, Novato, CA) using a micropipette puller (Narishige PP-830, Tokyo, Japan), and backfilled with pipette solution (in mM): 135 CsCl, 5 Mg-ATP, 10 HEPES, and 10 EGTA (pH 7.2). Cells were voltage-clamped and equilibrated in bath solution (in mM): 110 NaCl, 1 CsCl, 10 BaCl2, 1.2 MgCl2, 10 glucose, and 10 HEPES (pH 7.4). A NaCl-agar bridge was used between the reference electrode and the bath solution. To record whole-cell currents, isolated cells held at -60 mV were exposed to a pre-pulse (-90 mV, 200 ms) and then voltage steps ranging from -50 to +40 mV (10 mV interval, 300 ms).
Perforated patch-clamp electrophysiology was used to measure whole-cell K+ currents in isolated smooth muscle cells. The bath solution contained (in mM): 134 NaCl, 4 KCl, 2 MgCl2, 2 CaCl2, 10 glucose, and 10 HEPES (pH 7.4). The pipette solution contained (in mM): 110 K aspartate, 30 KCl, 10 NaCl, 2 MgCl2, 10 HEPES, and 0.05 EGTA (pH 7.2) with 200 µg/ml amphotericin B. Membrane currents were recorded while the cells were: 1) held at a steady membrane potential of -40 and -20 mV; or 2) slowly ramped from -60 to +20 mV (4mV/s). Whole-cell currents were recorded using an Axopatch 200B patch-clamp amplifier (Molecular Devices, Sunnyvale, CA), filtered at 1 kHz, digitized at 5 kHz, and were stored on a computer for offline analysis with Clampfit 10.3 software (Molecular Devices, Sunnyvale, CA). Whole-cell capacitance averaged 14-18 pF and was measured with the cancellation circuitry in the voltage-clamp amplifier. A 1 M NaCl–agar salt bridge between the reference electrode and the bath
solution was used to minimize offset potentials (<2 mV). All electrophysiological experiments were performed at room temperature (~22oC). STOC analysis was performed with customized software provided by B. Hald (University of Copenhagen); threshold for detection was set at 3 times the BKCa single channel conductance.
In a small complement of experiments, single channel currents were monitored using the on-cell configuration. The bath solution contained: 145 mM KCl, 1 mM CaCl2, 10 mM HEPES, and 200 nM nifedipine (pH 7.4). The pipette solution contained: 60 mM CaCl2, 50 mM TEA-Cl, 10 mM HEPES, and 200 nM nifedipine (pH 7.2). Single channel currents were filtered at 2 kHz, digitized at 5 kHz, and stored on a computer for offline analysis with Clampfit 10.3 software (Molecular Devices, Sunnyvale, CA). Cellular patches were voltage-clamped at a holding VM of -60 mV. To elicit single channel currents, a pre-pulse (-90 mV, 250 ms) was followed by test pulses (300 ms, -60 to -10 mV; 10 mV intervals). Recordings were performed at 22 °C. Slope conductance was calculated as described previously (Fox AP, Nowycky MC, Tsien RW (1987) Single-channel recordings of three types of calcium channels in chick sensory neurons.J Physiol 394:173-200).
Vessel Myography and Membrane Potential Measurement
Arterial segments were mounted in a customized arteriograph and superfused with warm (37 °C) physiological salt solution (PSS; pH 7.4; 21% O2, 5% CO2, balance N2) containing (in mM): 119 NaCl, 4.7 KCl, 20 NaHCO3, 1.1 KH2PO4, 1.2 MgSO4, 1.6 CaCl2 and 10 glucose. To limit the endothelial influence on myogenic tone development, air bubbles were passed through the vessel lumen (1–2 min); successful removal of the endothelium was confirmed by the loss of bradykinin-induced dilation. Arteries were equilibrated at 15 mmHg and the contractile responsiveness was assessed by brief application of 60 mM KCl. Following equilibration, intravascular pressure was incrementally elevated from 20 to 100 mmHg and arterial external diameter was monitored under control conditions and in the presence of paxilline (1 μM, BKCa inhibitor) and/or Ni2+ (50 μM, CaV3.2 blocker). Maximal arterial diameter was subsequently assessed in Ca2+-free PSS (zero externally added Ca2+ + 2 mM EGTA). Smooth muscle membrane potential (VM) was assessed by inserting a glass microelectrode backfilled with 1 M KCl (tip resistance = 120–150 MΩ) into the vessel wall. Measurements of VM were first made at 60 mmHg and then in the presence of Ni2+ (50 μM). The criteria for successful cell impalement included: 1) a sharp negative VM deflection upon insertion; 2) a stable recording for at least 1 min following entry; and 3) a sharp return to baseline upon electrode removal.
Electron Tomography
Whole animals were fixed similarly to immunohistochemical analysis. Brains were then removed and post-fixed in 4% paraformaldehyde (22 °C, 1 h) and cerebral arteries were isolated. Arteries were immersed in 1.6% paraformaldehyde and 2.5% glutaraldehyde in 0.1 M cacodylate buffer at pH 7.4 at 4 °C overnight. After washing three times with the same previous buffer, the samples were post-fixed in 1% osmium tetroxide buffered with cacodylate for 1 h at 22 °C, dehydrated through a graded series of acetone concentration (30–100%) and embedded in Epon 812 mixture resin. Thick sections (300-400 nm) were cut on a Reichert-Jung Ultracut E microtome using a diamond knife and collected on single hole grids with Formvar supporting film. The sections were first stained with 20% aqueous uranyl acetate/Reynolds’s lead citrate and then placed on one side of a transmission electron microscopy slot grid (1×2 mm slot) covered with a continuous formvar film (∼40 nm) to dry (10 min). Colloidal gold particles (10 nm

diameter) were then placed on both sides of the grid to serve as fiducial markers, and a thin carbon coating was applied for mechanical stabilization and to reduce electric charging. Once prepared, sections were viewed on a Tecnai F20 transmission electron microscope (200 keV), regions of interest were defined, and images were captured on a 1,024 × 1,024 charge-coupled device camera (GIF 794, Gatan, Pleasanton, CA). To perform dual-axis transmission electron-microscopic tomography, Serial EM software34 was employed to capture one image per degree of sample rotation (136 degrees in total). Tomographic reconstruction was performed by weighted back-projection with the IMOD software package; this yielded a contiguous stack of two-dimensional photomicrographs with ∼4 nm resolution. The same software was used to trace subcellular structures on each section of the contiguous stack. We then compiled the traces to produce a 3-D rendition of the microdomain structure.
Immunogold Labeling
Whole animals were fixed similarly to immunohistochemical analysis. Brains were then removed and post-fixed in 4% paraformaldehyde (22 °C, 1 h) and cerebral arteries were isolated. In accordance with the Aurion immunogold reagent kit, fixed arteries were exposed to 0.1% sodium borohydride in PBS (15 min), 0.05% Triton X-100 (30 min), blocking solution 1 h at 4 °C and then PBS (2x10 min). Primary antibodies (1:100 dilution) were subsequently added to the buffer and incubated for 48 h at 4 °C. Tissues were subsequently washed with buffer (6x10 min), exposed to incubation medium containing ultra-small gold particles (0.8 nm labeled goat anti rabbit, 1:100 dilution, 48 h at 4 °C) and then washed with incubation buffer (6x10 min) and PBS (2x10 min). Prepared arteries were fixed again in PBS containing 2.5% glutaraldehyde (2 h) and then washed in PBS (2x10 min). Arteries were sequentially processed as follows: 1)enhancement conditioning solution (ECS, 4x10 min); 2) Silver enhancement solution (2 h); 3) 0.03 M sodium thiosulphate in ECS (10 min); 4) ECS wash (4x10 min); and 5) PBS wash (2x10 min). Tissues were then post-fixed for 1 h in a 1% osmium tetroxide-PBS solution, dehydrated in ethanol, and embedded in Epon resin. Ultrathin sections of about ~70 nm were cut, lightly stained with 2% aqueous uranyl acetate and Reynold’s lead citrate (15 min), and viewed/photographed using a Hitachi H7650 transmission electron microscope (80 keV) and an AMT 16000 digital camera.
Immunohistochemistry
Rats were anaesthetized with sodium pentobarbital and perfused intra-cardially with 250 ml of PBS (pH 7.4), followed by 100 ml of 4% paraformaldehyde (pH 7.4) in PBS at room temperature. Brains were then removed and post-fixed in 4% paraformaldehyde for 1 h (22 °C). Posterior and middle cerebral arteries were subsequently excised and placed in a conical vial with standard working PBS solution containing 3% donkey, horse or goat serum, 0.1% Tween, and 1% dimethylsulphoxide (DMSO). Primary antibodies against smooth muscle actin (1:25 dilution), CaV1.2 (1:25 dilution), CaV3.1 (1:100 dilution), CaV3.2 (1:100 dilution), and RyR (1:100 dilution) were added to the working solution and incubated for 48 h (4 °C). Next, tissues were washed 3 times with PBS (15 min each, 22 °C) and incubated with working PBS solutions containing secondary antibodies (4 hr, 22 °C). Following washes with PBS, sections were mounted on gel-coated slides and covered with anti-fade medium, covered slips were sealed with nail polish and stored (-20 °C). Controls were obtained by omitting the 1ry antibodies or pre-adsorbing excess purified peptide. All reactions involved the use of fluorophore-conjugated secondary antibodies (1:1000 dilution): Alexa Fluor 488-donkey anti-mouse IgG, and Alexa

Fluor 555-goat anti-rabbit IgG. Immunolabelling was assessed using an Olympus FV300 BX50 confocal microscope equipped with Cy3 (555 nm, red) and FITC (488 nm, green) filter sets.
Proximity Ligation Assay (PLA)
The Duolink in situ PLA detection kit was employed using freshly isolated smooth muscle cells. Briefly, cells were fixed in PBS containing 4% paraformaldhyde (15 min), permeabilized in PBS containing 0.1% Tween (15 min), and quenched in PBS containing 100 mM glycine (5 min). Cells were then washed with PBS, blocked in Duolink blocking solution (30 min, 37 °C), and incubated overnight (4 °C) with primary antibodies (rabbit anti-CaV3.2 and mouse RyR2) in Duolink antibody diluent solution. Control experiments employed no primary antibody or only one primary antibody. Cells were labelled with Duolink PLA PLUS and MINUS probes for 2 h (37 °C). The secondary antibodies of PLA PLUS and MINUS probes are attached to synthetic oligonucleotides that hybridize when in close proximity (<40 nm). The hybridized oligonucleotides are then ligated prior to rolling circle amplification. The amplification products extending from the oligonucleotide arm of the PLA probes were detected using red fluorescent fluorophore-tagged, complementary oligonucleotide sequences and a Zeiss Apotome epifluorescence microscope.
Computational Modeling
We have constructed a mathematical model that incorporates crucial ultrastructure and calcium handling features of the vascular smooth muscle cell in cerebral arteries. The smooth muscle cell is described as a cylinder, 76.5 μm in length and 5 μm in diameter, as shown in Fig. 5. For simulation purposes, a cell was subdivided into segments with each 8.5 μm in length.Based on microscopic data, in each segment there is a circumferential band, which is interrupted in approximately two locations, thus forming two discrete sections circumferentially. In the model, each segment is therefore further sub-divided into two semi-cylindrical “slices”. Simulations presented in this paper are based on the behavior of one slice. The frequency of Ca2+ spark-like events have been scaled to represent the whole cell, assuming that individual slices act independently. The model includes only mechanisms responsible for dynamic Ca2+ handling in the smooth muscle cell. This includes the sodium-calcium exchanger (NCX), plasma membrane Ca2+ ATPase (PMCA), sarco/endoplasmic reticulum Ca2+ ATPase (SERCA), ryanodine receptor (RyR), calmodulin, calsequestrin, and the Ca2+ channels CaV1.2, CaV3.1 and CaV3.2. In its present form, the model is limited to Ca2+ dynamics evoked by voltage-clamp stimuli. As illustrated in Fig. 5, the model explicitly accounts for an interaction between CaV3.2 and RyR in a restricted microdomain (subspace), representing the ~15 nm space between caveolae in the plasma membrane and the sarcoplasmic reticulum. Mathematically, the model comprises 12 ordinary differential equations, which were solved using the “ode15s” ODE solver in MATLAB (The MathWorks, Natick, MA, USA). See Supplemental appendix for a complete description of the model’s formulation.
Ca2+ Spark Measurements
Ca2+ sparks were measured in rat myocytes in situ using the en-face preparation technique38 with the Ca2+ sensitive dye Fluo-4 AM using a Zeiss LSM 710 NLO laser scanning confocal imaging workstation on an inverted microscope platform (Zeiss Axio Observer Z1). Fluo-4 AM was dissolved in DMSO and added from a 1 mM stock to the arterial suspension at a final concentration of 10 μM, along with 0.1% pluronic F127 for 1-1.5 h at room temperature in

the dark in balanced salt solution. Arterial segments were then washed (30 min) to allow dye esterification and then cut into linear strips. The arterial segments were pinned to Sylgard blocks and placed in an open bath imaging chamber mounted on the confocal imaging stage. Cells were illuminated at 488 nm with a krypton argon laser and the emitted light was collected using a photomultiplier tube. Line scans were imaged at 529 fps with the emission signal recorded at 493-622. The acquisition period for Ca2+ spark recordings was 18.9 s. The resultant pixel size ranged from 0.068 to 0.11 μm per pixel. To ensure that sparks within the cell were imaged, the pinhole was adjusted to provide an imaging depth of 2.5 μm. This depth is roughly equivalent to the width of 50% of the cell based on morphological examination of live preparations, and was equivalent to our previous studies (data not shown). We performed analysis to characterize the percentage of cells with Ca2+ sparks and the frequency of firing. Sparks per 100 μm per second and the percentage of cells firing were computed from these observed sparks. Spatial and temporal characteristics of the Ca2+ spark events were calculated using the SparkMaster plug-in for ImageJ. These characteristics included: fractional fluorescence intensity; full duration at half maximum; full width at half maximum; and time to peak. The threshold for spark detection was 3.2 times the standard deviation of the background noise above the mean background level. Prior to analysis the background fluorescence was subtracted from each image assuming homogeneous background levels in each cell.
PCR Analysis
Smooth muscle cells (~200) isolated from cerebral arteries were placed in RNase- and DNase-free collection tubes. Total RNA was isolated from human cerebral artery smooth muscle cells using the RNeasy mini kit (Qiagen) whereas total RNA from human brain was purchased from Clontech. The RNA was reverse-transcribed using the Quantitect reverse transcription kit (Qiagen) according to manufacturer's instructions. A total of 1 ng cDNA was used to PCR amplify a 98 bp amplicon corresponding to CaV3.2 using the primer sequences CaV3.2-F (TGATTACCAGCATGCTCACG) and CaV3.2-R (GGTCTTCTTCTGCCTCGGTC) with Q5 DNA ploymerase (New England Biolabs) according to manufacturer's instructions. The PCR reactions were electrophoresed on a 1% agarose-TAE gel. Lane 1 is the PCR marker, lane 2 is the CaV3.2 amplicon from brain and lane 3 is the CaV3.2 amplicon from isolated smooth muscle cells.
Statistical Analysis
Data are expressed as means ± S.E., and n indicates the number of vessels or cells. No more than two different experiments were performed on vessels from a given animal. Where appropriate, paired, unpaired t-tests, or one way ANOVA were performed to compare the effects of a given condition/treatment on arterial diameter, or whole-cell current (see figure legends for specific details). *P values ≤ 0.05 were considered statistically significant.
Solutions and Chemicals
All buffers, chemicals and reagents originated from Sigma-Aldrich unless otherwise stated. Donkey and goat serum was purchased from Jackson Immuno-Research. Primary antibodies against smooth muscle actin were obtained from Abcam Inc. whereas those directed against CaV1.2, CaV3.1, CaV3.2, and RyR were purchased from Alomone. Secondary antibodies, which included Alexa Fluor 488-goat anti-mouse IgG and Alexa Fluor 555-goat anti-

rabbit IgG, were obtained from Invitrogen life Technologies. Aurion immunogold reagent and the PLA detection kit were purchased from Electron Microscopy Sciences and Olink, respectively.

Online Figure I
Online Figure I. Effects of Ni2+ and nifedipine on CaV1.2, CaV3.1 and CaV3.2 currents. Summary data of inward currents in tSA-201 cells transfected with rCaV1.2, rCaV3.1 or rCaV3.2-cDNA. Experiments were performed in the absence and presence of Ni2+ (50 µM) or Nifedipine (200 nM). A voltage step from -90 to 0 mV was used to evoke inward Ba2+ current (n=5 each,
P<0.05, paired t-test). Ni2+ and nifedipine selectively block CaV1.2 and CaV3.2, respectively.*

Online Figure II
Online Figure II. Time control experiments. (A,B) Representative traces and summary data of T-type current in rat cerebral arterial smooth muscle cells over time (n=8). Experiments were performed in the presence of nifedipine (200 nM) to block L-type Ca2+ channels. A voltage step from -90 to 0 mV was used to elicit inward current. (C) Rat middle or posterior cerebral arteries were pressurized from 20 to 100 mmHg twice under control conditions; passive responses were ascertained in Ca2+-free media (n=7). Electrical and vasomotor measurements were stable and repeatable over time.

Online Figure III
Online Figure III. Effects of Ni2+ on the kinetic characteristics of Ca2+ sparks. Line scan imaging performed on posterior and middle rat cerebral arteries to ascertain Ca2+ spark generation under control conditions and in the presence of Ni2+ (50 μM). Summary data characterizes the influence of Ni2+ on spatial (A & B) and temporal (C & D) characteristics of Ca2+ sparks (n=6 arteries, 291 line scans in total, *P<0.05, paired t-test). Ni2+ elicited a limited but significant effect on the spatial and temporal characteristics of Ca2+ sparks.

Online Figure IV
Online Figure IV. Ni2+ control experiments. (A,B) Representative traces and summary data of inward and outward current in rat cerebral arterial smooth muscle cells under control conditions and in the presence of Ni2+ (50 μM, n=10). Cells were slowly ramped from -60 to +20 mV (4 mV/s). Ni2+ had no effect on peak inward/outward current.

Supplemental Model Summary
1 Model and MethodRecent work has revealed a microdomain in cerebral arterial smooth muscle comprised of caveolae andsarcoplasmic reticulum. Immunolabeling techniques indicate that T-type Ca2+ channels and ryanodinereceptors localize to this microdomain while L-type Ca2+ channels do not [3]. Given these observations,Cav3.2 channels were hypothesized to regulate a CICR response. To address this hypothesis, a mathematicalmodel of a microdomain of rat cerebral vascular smooth muscle Ca2+ handling was developed. This modelwas based on parameters arising from tomographic, immunolabeling and electrical measurements of our laband previous studies. It includes only the components responsible for Ca2+ dynamics in the SMC. In thefollowing sections, the details of the model are explained.
2 SliceA typical vascular smooth muscle cell from rat cerebral artery has a fusiform shape. In our model, we considerit as a cylinder with a length of about 80 µm and a diameter of 5 µm (Figure 1). A slice is considered to bethe volume of the cell that is devoid of actin and includes the peripheral SR, its adjacent caveolae and thespace between them which is denoted the subspace. Based on microscopic data [3], in each ≈8.5 µm lengthof the cell, there is a circumferential band which includes 2 discrete slices. Therefore, each slice is a halfcylinder of length of 8.5 µm as illustrated in Figure 1.
The model includes only the components responsible for Ca2+ dynamics in the SMC. This comprisesthe Sodium-Calcium Exchanger (NCX), Plasma membrane Ca2+ ATPase (PMCA), Sarcoplasmic reticulum,Sarco/endoplasmic reticulum Ca2+ ATPase (SERCA), Ryanodine receptor, Calmodulin, Calsequestrin, ansthe calcium channels Cav1.2, Cav3.1 and Cav3.2. The model is based on a set of 11 ordinary differentialequations (Equations 1, 3, 6, 8, 13, 18, 24, 27, 32, 33 and 34).
3 Myoplasmic CalciumThe subspace (the dark blue area in Figure 1 immediately under the cell membrane) has a depth of 10 to15 nm [3]. Two channels inject their currents into the subspace: T-type Ca2+ (ICav3.2), and RyR (J rel).The Ca2+ concentration within the subspace, denoted [Ca2+]SS , diffuses into the cytosol (J xfer). The buffercalmodulin (CMDN) was also assumed present in the subspace:
d[Ca2+]SSdt
= BSS
(Jrel
VJSRVSS
− JxferVmyoVSS
+ ICav3.2AcapCm2VSSF
)(1)
BSS =
1 +
[CMDN ]totKCMDNm
(KCMDNm + [Ca2+]SS)2
−1(2)
Calcium in the cytosol, [Ca2+]i, is further influenced by leak from the sarcoplasmic reticulum (J leak),uptake by the SERCA pump (J up), extrusion by the PMCA pump (IPCMA), L-type Ca2+ channels (ICaL),the sodium calcium exchanger (INCX), T-type Ca channels (Icav3.1) and a background Ca2+ channel (ICa,b).Again, calmodulin was present:
d[Ca2+]idt
= Bi
(Jleak + Jxfer − Jup − (ICa,b + IPMCA + ICa,L + ICav3.1 − 2INCX)
AcapCm2VmyoF
)(3)
Bi =
1 +
[CMDN ]totKCMDNm
(KCMDNm + [Ca2+]i)2
−1(4)
Jxfer =[Ca2+]SS − [Ca2+]i
τxfer(5)

Modeling Figure 1: Top: One smooth muscle cell (A) is divided into cylindrical segments (B) which are composed of two slices(C). Bottom: Schematic representation of a slice. The slice includes Sodium-Calcium Exchanger (NCX), Plasma membrane Ca2+ ATPase (PMCA), the Sarcoplasmic Reticulum which has two parts: Uptake (lower pink) and Release (upper pink), Sarco/Endoplasmic Reticulum Ca2+ ATPase (SERCA), Ryanodine Receptor (RyR), Buffers: Calmodulin, Calsequestrin, and Ca2+ Channels: Cav1.2 , Cav3.1 and Cav3.2

Myoplasmic Calcium parametersParameter Definition Value Unit
Vmyo Volume of the cytoplasm 6.5450e-08 µL
VJSR Junctional SR volume 3.2725e-10 µL
VNSR Network SR volume 6.54509e-10 µL
Vss Subspace volume 8.325e-11 µL
Cm membrane capacitance 1.0 µF/cm2
Acap Capacitive membrane area 5.2360e-07 cm2
F Faraday’s constant 96.5 Col /mol
[CMDN ]totalTotal myoplasmic calmodulin
concentration 50 µM
KCMDNm
half-saturation constant forcalmodulin 0.238 µM
τxferTime constant for transfer from
subspace to cytoplasm 6.96 ms
4 Sarcoplasmic ReticulumThe model of sarcoplasmic reticulum consists of two parts: uptake (also called the network sarcoplasmicreticulum, NSR) and release (also called the junctional sarcoplasmic reticulum, JSR). The uptake partcontains the SERCA pump. Moreover, Ca2+ passive release, also called Ca2+ leak, is modeled to take placein the uptake portion. The release compartment contains the Ca2+ buffer calsequestrin (CSQN) and RyRchannels. The Ca2+ flux between these two subcompartments is designated by Jtr.
Ca2+ uptake into the SR (Jup) was described by the Hill equation (Eq. 11). The value of SR Ca2-ATPase maximum pump rate and half-saturation constant have been adjusted. The mathematical relationsdescribing the sarcoplasmic reticulum are derived from [2]:
d[Ca2+]JSRdt
= BJSR(Jtr − Jrel) (6)
BJSR =
1 +
[CSQN ]totKCSQNm
(KCSQNm + [Ca2+]JSR)2
−1(7)
d[Ca2+]NSRdt
= (Jup − Jleak)VmyoVNSR
− JtrVJSRVNSR
(8)
Jleak = νleak([Ca2+]NSR − [Ca2+]i) (9)
Jtr =[Ca2+]NSR − [Ca2+]JSR
τtr(10)
Jup = νup[Ca2+]2i
K2m,up + [Ca2+]2i
(11)
SR ParametersParameter Definition Value Unit
νleak maximum Ca2+ leak rate from the NSR to cytosol 2.5463e-05 ms-1
νup maximum uptake rate of SERCA pump 0.5352 µM/ms

τtr Time constant for transfer from NSR to JSR 20 ms
[CSQN ]total Total junctional SR calsequestrin concentration 15000 µM
KCSQNm Ca2+ half-saturation constant for calsequestrin 800 µM
Km,up Half-saturation constant of SERCA pump 0.7766 µM
5 T-type Ca2+ ChannelsTwo isoforms of the T-type Ca2+ channel exist in vascular smooth muscle cell: Cav3.1 and Cav3.2 [3]. Basedon Immunolabeling data [3], the former has a diffusive distribution throughout the membrane. In contrast,Cav3.2 is mainly expressed in the caveolae. They are found mostly in clusters directly opposed to ryanodinereceptors on the sarcoplasmic reticulum [3]. We hypothesized that Ca2+ which enters the cell as ICav3.2results in a localized increase in [Ca2+]ss. We put the Cav3.1 splice variant along the cell and Cav3.2 werelocalized only in the caveolae. We have adopted the T-type Ca2+ channel mathematical model from Purkinjefibers in rabbit heart [1] for both isoforms.
The equations describing the channel are given below with b and g being gating variables. For channelX, x∞ is the steady state value, τX is the time constant, αX is the transition rate from non-permissive topermissive state, and βX is rate of the opposite transition.
ICav3.X = gCav3.X b g (V − ECaT ) (12)db
dt=b∞ − b
τb(13)
b∞ =1
1 + e(v+28)/6.1(14)
τb =1
αb + βb(15)
αb = 1.068e(v+16.3)/30 (16)
βb = 1.068e−(v+16.3)/30 (17)dg
dg=g∞ − g
τg(18)
g∞ =1
1 + e(v+60)/6.6(19)
τg =1
αg + βg(20)
αg = 0.015e−(v+71.7)/83.33 (21)
βg = 0.015e−(v+71.7)/15.38 (22)
T-type Channel parameters
Parameter Definiton Value Units
gCav3.1 maximum Cav3.1 conductance 0.0684 mS/cm2
gCav3.2 maximum Cav3.2 conductance 0.1026 mS/cm2
ECaT Reversal potential 50 mV
6 L-type Ca2+ ChannelL-type Ca2+ channels (Cav1.2) are spread along the long axis of the smooth muscle cell [3] and have a distinct distribution in comparison with Cav3.2 channels which run perpendicular to the long axis of SMC.

Modeling Figure 2: T-type Ca2+ channel (both Cav3.1 and Cav3.2) activation and inactivation curves
Thus, we have placed L-type Ca2+ channel throughout the slice but out of the caveolae as there is no spatialcorrelation between them and the caveolae.
Innate smooth muscle L-type Cav1.2 calcium channels have been shown to contain a fraction of Ca2+
currents with a window current that is close to resting potential[8]. The voltage-dependence of the activationcurve of smooth muscle L-type Ca2+ channels shows a hyperpolarized shift of -15 mV in comparison withthose of cardiac cells [7]. If the voltage-dependence of L-type Ca2+ channels of smooth muscle cells weresimilar to that of cardiac cells, only a small amount of contraction would be generated by smooth musclecells[7]. Therefore, we modified an L-type model of rabbit cardiac cells [1] by shifting the activation to theleft by 15 mV (Figure 3) and scaling the conductance, gCaL, according to the experimental data obtainedfrom rat cerebral arteries in our lab [3]. Equations for the channel are given below with d and f being thegating variables:
ICaL = gCaL(1− fCa) d f (V − ECaL) (23)dd
dt=d∞ − d
τd(24)
d∞ =1
1 + e−(v+11)/6.74(25)
τd =0.59 + 0.8e0.52(v+28)
1 + e0.132(v+28)(26)
df
dt=f∞ − f
τf(27)
f∞ =1
1 + e(v+40)/10(28)

τf = 0.005(v + 12.5)2 + 4 (29)
L-type Channel parameters
Parameter Definiton Value Units
gCaL maximum conductance 0.0641 mS/cm2
ECaL Reversal potential 63 mV
-80 -40 0 400
0.01
0.02
0.03
0.04
0.05
dfd*f
-80 -60 -40 -20 0 20 40 60Vm ( mV )
0
0.2
0.4
0.6
0.8
1
prob
abilit
y
dfd*f
Modeling Figure 3: L-type Ca2+ Channel Activation and Inactivation Curves. f and d are the inactivation and activation parameters. The inset zooms in on the product of d and f .
There is another important difference between smooth muscle L-type Cav1.2 Ca2+ channels and thoseof the cardiac tissue. Data obtained in our lab show that the smooth muscle splice does not exhibit Ca2+-dependent inactivation in steady-state current (Figure 4). It is known that Ba2+ does not cause Ca2+-dependent inactivation because it does not affect the channel chemically to inactivate it. Thus, if theBa2+ and Ca2+ traces are the same for the channel, it means the channel does not go through Ca2+-dependent inactivation. Figure 4 shows the percentage of the channels which are in the inactivation state forBa2+ and Ca2+ at different times. At 1500 ms, there is no difference between the Ba2+ and Ca2+ traces,indicating that the steady-state Ca2+-dependent inactivation does not exist for smooth muscle L-type Cav1.2Ca2+ channels.
7 Background Calcium CurrentThe background calcium current was modelled as a simple ohmic leak:
ICa,b = gCa,b(V − ECaL) (30)
Background Ca2+ Channel parametersParameter Definition Value Unit
gCaB Maximum conductance 3.670e-05 µS/cm2
8 Ryanodine Receptor Channel

Modeling Figure 4: Some smooth muscle splice variants show minimal Ca2+-dependent steady state inactivation
The model of Keizer, J et al.[5] with some modifications in their rates has been adopted. The modificationswere determined using parallel multi-objective genetic algorithm [4] in order to reproduce experimental data.More specifically, the object functions were set to produce repetitive CICR responses with an appropriateperiod, [Ca2+]ss amplitude, average [Ca2+]i amplitude and basal [Ca2+]i level.
This RyR model consists of two close and two open states. See Figure 5. State C1 and C 2 are closedstates while O1 and O2 are open states. These states are considered to be states of the entire RyR ratherthan states of the four subunits. A channel is in one of the states, X, with probability PX . Transition fromC1 to O1 and from O1 to O2 were considered to be Ca2+ dependent. The second open state, O2 has theimportant role of increasing the open probability during the plateau as [Ca2+]ss is elevated . The plateauopen probability is shown in Figure 7.
Figure 6 shows RyR open probability when [Ca2+]ss is stepped from 0.1 uM to 5 uM. The initial increaseto peak happens on the millisecond time scale, whereas the decline to the plateau level occurs over severalhundreds of milliseconds. The extent of opening immediately after Ca2+ stimulation (the peak open proba-bility) and that after inactivation (the plateau) both increase with increasing [Ca2+]ss. Figure 7 illustratesthe peak and the plateau (steady-state value) open probabilities at different [Ca2+]sslevels. At lower con-centrations, the open probability rises quickly and then decreases to the plateau slowly. However, at higher[Ca2+]ss, after reaching the peak, RyR stays open and inactivation is negligible.
Jrel = ν(PO1 + PO2)([Ca2+]JSR − [Ca2+]SS) (31)
dPC1
dt= k−a PO1 − k+a [Ca
2+]nSSPC1 (32)
dPO2
dt= k+b [Ca
2+]mSSPO1 − k−b PO2 (33)
dPC2
dt= k+c PO1 − k−c PC2 (34)
PO1 = 1− (PC1 + PC2 + PO2) (35)
RyR Channel parametersParameter Definition Value Unit
ν Maximum permeability 4.5 ms−1

Modeling Figure 5: Schematic diagram of transition among the four states of RyR channel. C1 and C2 are closed states whereas O1 and O2 are open states. Transition from C1 to O1 and also transition from O1 to O2 are Ca2+ dependent.
k+a PC1 – PO1 rate 0.02050 µM−nms−1
k−a PO1 - PC1 rate 0.05205 ms-1
k+b PO1 – PO2 rate 0.0094 µM−mms−1
k−b PO2 – PO1 rate 0.1920 ms-1
k+c PO1 – PC2 rate 0.0778 ms-1
k−c PC2 – PO1 rate 0.0035 ms-1
m PO1 – PO2 cooperativity 3 dimensionlessn PC1 – PO1 cooperativity 4 dimensionless
This RyR model consists of two close and two open states. State C1 and C 2 are closed states. StatesO1 and O2 are open states. These states are considered to be states of the entire RyR rather than statesof the four subunits. As it is illustrated in Figure 5, transition from C1 to O1 and from O1 to O2 areconsidered to be Ca2+ dependent. The second open state, O2 has an important role of keeping the plateauopen probability increasing as [Ca2+]ss is elevated [5]. The plateau open probability is shown in Figure 7.
Figure 6 shows the RyR open probability when [Ca2+]ss is elevated from 0.1 µM to 5 µM . The initialincrease to peak happens on the millisecond time scale, whereas the decline to the plateau occurs withinseveral hundreds of milliseconds. The extent of opening immediately after Ca2+ stimulation (the peakopen probability) and that after inactivation (the plateau) both increase with increasing [Ca2+]ss . Figure 7illustrate the peak and the plateau (steady-state value) of open probability at different [Ca2+]ss level. Atlower concentrations, the open probability rises quickly and then decreases to the plateau slowly. Howeveras the figures indicates, at higher [Ca2+]ss, after reaching the peak, RyR stays open and inactivation isnegligible. This shows that RyR inactivation is Ca2+-dependent in the model.
9 Ca2+ Extrusion MechanismsThe model of NCX and PMCA were adopted from Bondarenko et al. [2] and the exchanger scaling factor(kNaCa) was adjusted (by using GA) so that the basal level of [Ca2+]i agreed with physiological values.
INCX =kNaCa1
k3mNa + [Na+]3o
1
kmCa + [Ca2+]o
1
1 + κ(η−1)V F/RTsat
× (36)eηV F/RT [Na+]3i [Ca
2+]o − e(η−1)V F/RT [Na+]3o[Ca2+]i
IPCMA =ImaxPCMA
[Ca2+]2iK2m,pCa + [Ca2+]2i
(37)

Modeling Figure 6: A simulation of the rapid rise to peak open probability of a single RyR following an increase of [Ca2+]ss from 0.1 to 5 µM.
NCX parametersParameter Definition Value Unit
kNaCa scaling factor 1.464e+02 µA/cm2
KmNa Na+ half-saturation constant 87500 µM
KmCa Ca2+ half-saturation constant 1380 µM
Ksatsaturation factor for large
negative potentials 0.1 dimensionless
η voltage dependence 0.35 dimensionless
T temperature 293.15 K
R Ideal gas constant 8.314 JK−1mol−1
[Ca2+]o Extracellular Ca2+ concentration 1800 µM
[Na]o Extracellular Na concentration 1.400e+04 µM
[Na]i Intracellular Na concentration 1.4237e+04 µM
PMCA parameters
Parameter Definition Value Unit
ImaxPMCA max rate 1.2 µA/cm2
Km,pCaCa2+ half-saturation con-stant 0.500 µM
10 Initial Conditions

Modeling Figure 7: The peak and the plateau open probabilities increases with increasing [Ca2+]ss indicating RyR inactivation is a Ca2+-dependent process

Initial ConditionsParameter Definition Value Unit
t Time 0.0 ms
V Membrane Potential -60 mV
[Ca2+]i Cytosolic Ca2+ concentration 0.1209 µM
[Ca2+]SS Subspace Ca2+ concentration 0.1505 µM
[Ca2+]JSR JSR Ca2+ concentration 0.300 µM
[Ca2+]NSR NSR Ca2+ concentration 0.300 µM
PC1 Fraction of channels in State PC1 0.4298 dimensionless
PC2 Fraction of channels in State PC2 0.4298 dimensionless
PO1 Fraction of channels in State PO1 0.1404 dimensionless
PO2 Fraction of channels in State PO2 1.0030e-05 dimensionless
11 Numerical MethodsThe model was implemented in MATLAB™ and 12 differential equations were solved with the ode15s routinefor stiff systems [6]. We used multi-objective parallel genetic algorithm to adjust various parameters in themodel in order to obtain experimentally-consistent results. To implement the optimization, the ParallelComputing toolbox and Global Optimization toolbox of MATLAB™ software package were used.
We chose this multi-objective optimization as there were several (and conflicting) objective functions.These objective functions rewards sets of parameters that cause the behaviors of model to be to be consistentwith the experimental data including the following items:
• Frequency of oscillation ˜1 Hz
• Steady-state [Ca2+]i of 100 nM
• Average [Ca2+]i in the range 200-250 nM at -40 mV
• No oscillations at ˜-60 mV
• Sustained oscillations at a reduced frequency after Cav1.2 blockade
The optimization was used to modify the RyR transition rates ( k−a ,k+a , k−b , k
+b ,k−c ,k+c ), leakage current
from SR into the cytosol (νleak), the NCX maximum rate (kNaCa) and the diffusion rate from the subspaceinto the cytosol (τxfer). Changes in those parameters were mostly within 20% of the original values. Themost appropriate solution was selected among the Pareto optima.
As the each run of simulation took 10s, for speeding up the GA convergence, we used a parallel multi-objective GA. This optimization algorithm was run on an Intel(R) 4-Core(TM) i7-2600K CPU @ 3.40GHz.
References[1] Oleg V. Aslanidi, Rakan N. Sleiman, Mark R. Boyett, Jules C. Hancox, and Henggui Zhang. Ionic
mechanisms for electrical heterogeneity between rabbit purkinje fiber and ventricular cells. Biophys J,98(11):2420–2431, Jun 2010.
[2] Vladimir E. Bondarenko, Gyula P. Szigeti, Glenna C L. Bett, Song-Jung Kim, and Randall L. Rasmusson.Computer model of action potential of mouse ventricular myocytes. Am J Physiol Heart Circ Physiol,287(3):H1378–H1403, Sep 2004.
[3] R. A. El-Rahman, S. E. B. Welsh, Y. Anfinogenova, O. Harraz, R. Turner, and D. G. Welsh. L- and t-type calcium channels in cerebral arteries. In The FASEB Journal, volume vol. 25, page 1024.18, 2011.
[4] D. E. Goldberg. Genetic Algorithms in Search. Optimization, and machine Learning. Addison-WesleyLongham Publishing Co, Inc, Boston, MA, USA, 1st edition, 1989.
[5] J. Keizer and L. Levine. Ryanodine receptor adaptation and ca2+(-)induced ca2+ release-dependentca2+ oscillations. Biophys J, 71(6):3477–3487, Dec 1996.
[6] Mark W. Reichelt Lawrence F. Shampine. The Matlab ODE suite. SIAM Journal Scientific Computing,18(1):1, 1997.
[7] Ping Liao, Tan Fong Yong, Mui Cheng Liang, David T. Yue, and Tuck Wah Soong. Splicing for alternativestructures of cav1.2 ca2+ channels in cardiac and smooth muscles. Cardiovasc Res, 68(2):197–203, Nov2005.
[8] Ping Liao, Dejie Yu, Guang Li, Tan Fong Yong, Jia Lin Soon, Yeow Leng Chua, and Tuck Wah Soong.A smooth muscle cav1.2 calcium channel splice variant underlies hyperpolarized window current andenhanced state-dependent inhibition by nifedipine. J Biol Chem, 282(48):35133–35142, Nov 2007.