center foa iiiuiiii - ctr library on june 1, 1963, a research program to study design criteria for...
TRANSCRIPT

~ ~c=c~ =~~=~~=~~~~~~ ~~ ~=~~=~ ========~~~~_~~~~~~ __ ~_~~ ~-~~~~-~~~-~-~ .. --~~~~--~-~~~~-~~~~~~~ -~ --~~~-~~~~~-==--~~~~~~-~--
DEVELOPMENT LENGTH FOR ANCHOR BOLTS
by
John E. Breen
Final Report for Project No. 3-5-63-53 "Development Length for Anchor Bolts"
Conducted for
TEXAS HIGHWAY DEPARTMENT Interagency Contract No. 4413 - 830
and
U. S. DEPARTMENT OF COMMERCE BUREAU OF PUBLIC ROADS
by
CENTER FOR HIGHWAY RESEARCH THE UNIVERSITY OF TEXAS
Austin, Texas
April 15, 1964
CENTER FOA tRANSPORTAT1~ RESEARCH LrIlAAAY
IIIUIIII
PREFACE
On June 1, 1963, a research program to study design criteria for the proper
lengths for anchor bolt embedment into footings was undertaken by the University
of Texas Center for Highway Research in cooperation with the Texas Highway
Department and the Bureau of Public Roads. The program included a series of
tests on thirty-six anchor bolts with varying embedment conditions. The anchor
bolts were embedded near the edge of a square footing specimen and were under
a combination of flexural tension, bond, and splitting conditions closely
approximating those in the prototype footing specimens. In these tests loaded
end slip behavior was determined at nominal working loads, at first yielding,
and in many cases at ultimate capacity. This report presents the results of
these tests and a survey of the trends indicated thereby.
I

ACKNOWLEDGEMENTS
The tests described herein were conducted as a part of the over-all
research program of the University of Texas Center for Highway Research under
the administrative direction of Dean John J. McKetta. The work was sponsored
jointly by the Texas Highway Department and the Bureau of Public Roads under
an interasency contract between the University of Texas and the Texas Highway
Department. Liaison with the Texas Highway Department was maintained through
the advisory committee for this project consisting of Mr. Wayne Henneberger,
Mr. Larry G. Walker, and Mr. De Leon Hawkins, the contact representative. The
study was directed by John E. Breen, Assistant Professor of Civil Engineering.
II

~--.. --------------------------------------------------------------------------................ ...
Object and Scope
CHAPTER 1
INTRODUCTION
The general objective of this investigation was the establishment of the
development length or the embedment length required to develop the tensile
yield capacity of ASTM A-7 anchor bolts with a yield strength of 33 ksi. At
the same time it Was to explore the effect of various types of end anchorages
and certain other variables. A substantial amount of recent test data has
been compiled on the proper development length for the ASTM A305 deformed
reinforcing bars. Very little material is available concerning the length
required to develop the strength of large size anchor bolts. The main infor
mation existing is a series of concentric pullout tests reported by Duff 1 Abrams which involved plain bars anchored with both nuts and nuts with washers.
In this type test the concrete around the bolt is under compression. As has
been shown by Ferguson, Thompson, and Turpin2
the results of such concentric
pullout tests do not reflect the bond-slip behavior of elements which are in
the tension zone of beam or footing members such as the prototype sign support
footings. In addition the only slips which were measured in the Abrams series
were those at the free end of the embedded bolt. Tests on anchorage lengths
of high strength reinforcement using a modified eccentric pullout specimen have
indicated that the measurement of free end slips is very unreliable in members
which have sizable water gain effects. 3
Since the requirements of modern sign structures for the interstate highway
program require a great number of such anchor bolts, it was felt desirable to
obtain basic information concerning the required development length as affected
by present design and construction practices. In order to closely simulate the
behavior as found in typical footing structures, the test specimen shown in Fig.
1 was developed. The bolt is embedded near the edge and tension is applied
through a flexural loading. In this type specimen, the anchor bolt is under a
combination of tension, bond, and splitting conditions closely approximating
those in the prototype footing structures.
This investigation reports on tests of twelve footing specimens of this
type. In some specimens four separate anchor bolts were tested, while in others

=
r
r h r I r h REACTION BEAM
I I
I I . ~~LOAD CELL
1-4- YOKE ,,",~RAM yOKE ....... BEARING BLOCK-... rr
L IJ
t STEEL BEAM
OPTICAL SLI P TARGETS
..J:
't:
Jd ;;JI ......
( a )
(b)
... --- -- ----:lJ t----------i ~TEST
'r-I:: = _-_-_ -_-__ -:.:1:1 BOLT I I
PLATE
Jd
AMES DIAL
.-
FIG. I TEST ARRANGEMENT
L U
t
T
2

3
only two bolts were used. The total number of bolts involved was thirty-six.
The anchor bolt sizes ranged from 1 1/4" to 3" with embedment lengths of 10
and 15 diameters. End anchorages consisted of either a standard nut or a
combination of a standard nut and washer.

Specimens
CHAPTER 2
TEST PROGRAM
4
All of the footing specimens used in this program were of the same general
type. When 1 1/4" through 2" diameter bolts were used, four anchor bolts were
embedded in each footing specimen. However, only two bolts were used in each
specimen with the 2 1/2" and 3" diameter anchor bolts. The individual anchor
bolt specimens are designated by a four part code symbol. The first number
represents the nominal bolt diameter. This is followed by the letter N for a
specimen with a nut anchorage only, W for a specimen with a nut and washer anchor
age and S for the series with special type of end anchorage. This letter is
followed by a number which is the embedment length in terms of number of bar
diameters. The final letter indicates the designation of individual companion
specimens. For example, the designation 1-1/4 W lOa designates a specimen in
which a 1-1/4" bolt with a nut and washer anchorage was embedded for 10 diameters
in a footing specimen. The a indicates that it was the first of this type tested.
In a few cases this code designation is followed by a -2. This indicates a
retest to failure of a specimen which was taken up only to yield in the initial
testing.
Figs. 2 through 4 show the entire set of test specimens with critical
dimensions. A tabulation of the important variables and a summary of the test
results is provided in appendix Table A. The specimens have been grouped
according to bolt diameter and have been subdivided in these groups according
to the type of end anchorage.
Materials
Concrete. In all test specimens a concrete conforming to Texas Highway
Department Standard Specifications for Road and Bridge Construction "Class A"
concrete was used. 4 The 1-1/4" and 1-1/2" specimens were cast with a job
mixed concrete. The 1-3/4" through 3" specimens were cast with a ready mixed
concrete procured from a local source. The cement used in all test specimens
was a high-early strength cement (type III). The fine aggregate met the speci
fications for aggregate grade no. 1 of Section 421.2.4. The coarse aggregate
met the requirements of aggregate grade no. 3 of Section 421.2.3. The maximum

.. 1 I"" 24% ~
/o---a ....... / ,
/ \
10 d\ I \ I , \ T..:- 80/a
ll
8 3/a'~ I \0 0/ '\ /
\. / " ,/ "-0 0 ....... ~--."...".
~ ~ (\J
I1i 6" 6'-0" ..Jv. I" "I ;1 . I I 3
11
III , III , - -F--=--"1--=---=-f -~~1~ -,; t --Jtr---f\---1----t~ 1\ I ~-+_\ -I-'r-J~-I-f =~ - -:-\--+-1' --L-u:d, \ I \ ~ \1111111 -~-\--I----I--~:' \ I -- I \ \r
1 llt-\--t - -, r -~rl-n -
~........t-- -- JL _--.4L--- 4L.r:~,\ I 11111111 _ -iJ---=-=b----Y ~~L_
# 2 SPIRAL - 2 WRAPS AT TOP
-1-1-1: ~-rl \_-.1i_£ \ / \ I;
\ I \ 1\ 'i \-I-~-WI \/ \/ \/ I
_.'i_~_~~
I WRAP AT BOTTOM 6" PITCH
8-#9BARS '
r4 BARS 5 '-611
LONG} ALTERNATELY] L4 BARS 4'-0" LONG PLACED
FIG. 2 TYPICAL SPECIMEN DETAIL
1Jl

I~ B .1 ..",.-----~
...... 0 0,
/ " / , / \
b 0\ / \ I I
I 0/ \0 I
\ / \ /
0" .., II
E=3
ANCHOR BOLT ,--_{4-#7X5
1
-S11
4-#7 X 4 1-0
11
1--. ___ #2 SPI RAL (PITCH Sll)
SPECIMENS B
ALL IY411, IY2" 223/4
11
~II ALL 13 4 , 211 24y411
ALL 2 Y2" 3211
ALL 3" 32"
1 '$.. {\J {\J
II
m
E
3"
4"
4"
4"
I~ B ~I _I
l " ..... --- ......
/"0 d'-, / "
/ " /0 0\
I 8 3 1." 8 3 1." \ I 78 ,8 I I I \ I \~ 0/ , \ /
/' o / ,:;...-
E=4"
ANCHOR BOLT L....-_{4-#9 x5
1
-S11
4-#9x41-011 '---___ #2 SPIRAL
(PITCH S")
LONG BARS
8-#7
8-#9
8-#9
6-#11
1--- B ~I 1-
1 ..... ---.-- -...... ..... /,- ,~
/ '-' '-' " / " =. / \
~ I \ v I \ {\J I \ .. , (\J m ,
1-' 24" 1'" fl)
'-- -, II
\ I m \ I \ I \ I ,
/ () /
/'
-..... '-" - -I E =411
ANCHOR BOLT S-#llx5 1-S"
#2 SPIRAL (PITCH S")
FIG. 3 SPECIMEN DETAILS
0\

E FACE OF CONCRETE
"SA" ~ ~ __ ~/_I_%'~'¢ 1~~m~\~~~~*~~~\\I------------~I-J
I-- 6" »-1. 17.5" »--1
.. 243A
I.... 24 3/411 ,.1
FIG. 4 DETAILS OF SPECIAL ANCHORAGE
SERIES "5"
"SS"
"SC"
)1111( 8 75" • )10 I
"So ..
l\\\\\\\\\\W\\\\\\\\~ I ~ 6 11
.111( 17.5" "/--.j

=
8
size was 1". The cement factor was five sacks per cubic yard and the slump
range was 3" to 4". In general, the water-cement ratio was seven gallons per
sack. The water used was Austin city water with no admixtures added. When
ready mixed concrete was used inspectors were provided at the plant to insure
proper batching and mixing procedures.
Anchor Bolts. The anchor bolts used were specified to be manufactured from
ASTM A7 steel with a minimum yield strength of 33 ksi. In all cases the bolts
were fabricated in local commercial machine shops from round bar stock. In one
set of 1-3/4" bolts, the companion specimen indicated that a high carbon or other
alloy steel Was substituted and the yield point was substantially above that
required. Appendix Figs. A1 and A2 shaw typical stress strain curves for the
bolts used. The threaded sections were machined to conform to USS thread
specifications. The anchor bolts were not galvanized.
Reinforcing Steel. The reinforcing steel used was deformed (ASTM A305)
bars meeting ASTM A15 intermediate grade specifications. The spirals were
wound and furnished by a commercial supplier using number 2 (not deformed) bars
of ASTM A15 intermediate grade steel.
Forms. All the footing specimens were cast in wooden forms as shown in
Fig. 5. The bolts were cast in a vertical position at the top of the forms.
In all specimens the height of the footing specimen was maintained at 6 feet.
This insured that the water gain effect would remain relatively constant in
all tests and would closely approximate that found under field conditions. The
form joints were taped inside and the forms were wiped with form oil prior to
each use.
Reinforcing Cage. Reinforcing steel was saw cut to length and the spirals
were procured wound to the proper diameter. The main longitudinal reinforce
ment was arranged in the proper configuration inside the spirals and then the
whole was tied with wire into a stiff cage which could be set directly into
the form. After the reinforcing cage was in place in the form, the anchor
bolts were set into position. In order to position the bolts properly a set
of cross members was used on top of the forms. These cross members had holes
of exactly the same diameter as the bolts drilled in the proper position. The
bolts were then positioned and held firmly in place with a nut above and below
the cross member. This insured that the anchor bolt would be correctly position-/
ed in the specimen after casting.
Casting Proced:~. Concrete was placed in the forms using a standard

9
Fig. 5. Specimen prior to concrete placement

10
concrete bucket and an overhead traveling crane. The concrete was vibrated
into place with a large internal vibrator. Standard compression test cylinders
and modulus of rupture beams Were cast from each of the mix batches. In
general the concrete samples were taken from the portion of the batch which
was placed in the top half of the footing specimen. This was the portion of
the concrete surrounding the test bolts. Because of the slumps used good
compaction was obtained.
Curing. The specimens were trowled to a smooth finish and then left over
night in the forms in the laboratory without any special protection other than
a piece of moist burlap placed over the open end of the form. In general this
burlap covering was kept in place until the sixth day. Then the curing cover "
and wooden side forms were removed and the specimen was moved into position and
prepared for testing. Wire rope slings were utilized for handling the specimens.
At no time was the specimen lifted by using the embedded anchor bolts.
Test Procedure. While the general procedure used in testing all of the
bolts was identical, it was found necessary to increase the capacities of
some of the elements of the testing rig to handle the 2-1/2" and 3" diameter
bolts. However, this was mainly a scaling operation. No distinction will
be made between the two sets of equipment in the text or figures other than
to note that no monitor load cell could be used in the 2 ... 1/2" and 3" diameter
bolt tests since the ranges of loads applied were beyond the capacities of
available load cells.
On the day of test a calibrated hydraulic ram (A) and an electronic load
cell (B) were inserted between the specimen and a reaction beam as shown in
Fig. 6a. The ram load was distributed to the specimen through a thick steel
bearing plate. (C) This plate was plastered onto the specimen to insure an
even bearing surface. Then a specially fabricated steel wide-flange section (D)
was attached to the footing specimen as shown in Fig. 6b. Reaction straps (E,F)
were positioned to yoke the test assembly to the heavy reaction beam. (G) It
can be seen in Fig. 6c that the footing specimen Was mounted on large rollers.
In addition it should be noted that a gap was left between the heavy plate on the
end of the wide-flange and the concrete surface around the tension anchor bolt.
This was to permit visual observation of the loaded end slip. In Fig. 6d the
mounting on the compression face of the footing specimen can be seen. A heavy
plate assembly was provided to concentrate the compression force over a relative
ly shallow but wide area. This insured an accurate determination of the location

11
Fig. 6a. Loading system
Fig. 6b. Loading arrangement .

12
Fig. 6c. Slip measurement system
Fig. 6d. Compression zone loading

13
Fig. 6e. Test arrangement (large bolts) as viewed from above specimen
Fig. 6£. Compression zone (large bolts)

14
of the compression centroid.
The instrumentation utilized was relatively simple. In addition to the
pressure gage to measure the hydraulic pressure applied to the ram, and a load
cell to check the applied load, measurements were made of deflections and loaded
end slip. Dial gages were used as indicated at H, I, and J in Fig. 6b to
measure the deflection at the two reaction straps and in the footing specimen
directly under the applied load. In addition an optical micrometer mounted on
the theodolite shown at K in Fig. 6c was used to measure the relative slip
between the anchor bolt and the concrete face. In order to make this measure
ment, three targets were installed on the specimen. Two of these targets were
mounted (one 1" above the bolt, the other 1" below the bolt) on steel rods that
were embedded in the concrete during casting. The third target was mounted
(using a strong permanent magnet) on the bolt one half inch from the face of
the concrete. (L). The optical micrometer was used to read the relative dis
placement between the target mounted on the bolt and the targets which were
fixed to the concrete. This micrometer attachment has a sensitivity of 0.001".
This system proved to be a reasonably satisfactory method of taking the slip
measurements in an otherwise remote and fairly inaccessible region.
The loads were applied in increments and held until the deflection dials
and the optical micrometer could be read and any cracking marked and recorded.
Loading for a particular test would require approximat,ely one to two hours.
Because of the fact that each footing specimen contained a multiple number of
anchor bolt specimens, the loading pattern had to be varied to preserve the
over-all footing specimen until all bolts were tested. This was accomplished
by initially loading the specimens only up till apparent yielding. At this
point the test on an individual bolt would be discontinued. The specimen would
be rotated and the testing begun on a different bolt. This bolt would then be
taken to apparent yielding and the same cycle followed. This would continue
until the testing of the last anchor bolt specimen for a particular footing.
This bolt would then be loaded until complete failure occurred. If the condition
of the specimen still permitted after this, it would be rotated and another
bolt would be retested until complete failure occurred. This sequence was
followed as long as the specimen was operative. Thus, most of the initial data
obtained is for ranges up to and slightly over the yield point. A fairly large
number of the tests were ultimately taken to failure. Much of this data repre
sents retesting of a fairly well damaged specimen. However, since the specimens

with 2-1/2" and 3" diameter anchor bolts only contained two bolts in each
footing, these tests were taken to failure without retesting.
Specimen Behavior and Failure
15
Loaded end slip started almost immediately upon initial loading and pro
gressed with gradually increasing increments. In a few cases splitting of the
cover started over the bolt at the loaded end and progressed towards the
anchored end. In most cases very definite flexural cracks opened up across
the face of the beam. Usually the largest flexural crack occurred at the
vicinity of the anchorage of the bolt (which represents the "cutoff point").
The final failure of those specimens which were taken to ultimate fell into
three different classes;
1. Specimens in which very definite and pronounced splitting appeared
along the full length of the bolt at ultimate load, as shown in Figs. 7a and
7b. It can be seen in Fig. 7b that a very wide splitting crack extends from
bolt 1-1/2 N lOa to the face of the specimen. It can also be seen that the
concrete cover over this bolt is breaking off into two distinct wedges. This
is similar to failures found in pullout tests of deformed bars.
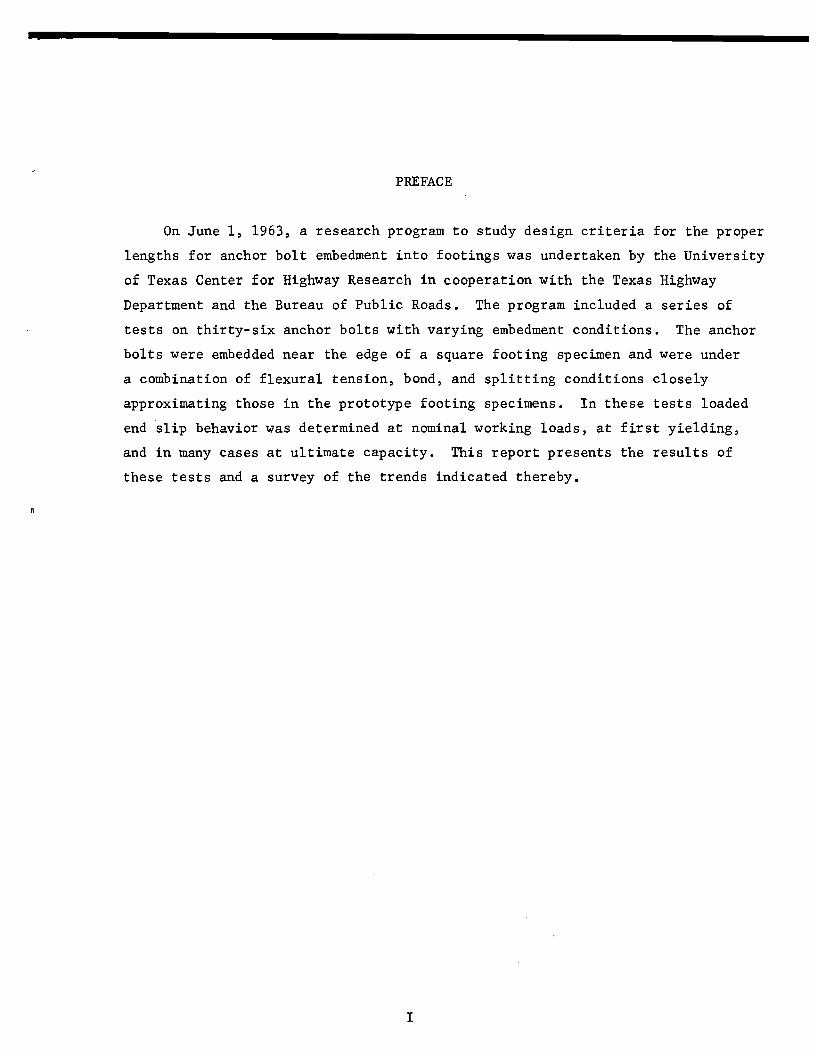
2. Specimens in which very little longitudinal splitting appeared prior
to or at failure but in which very intensive spalling and crushing of the
concrete in the vicinity of the anchorage of the bolt appeared. Most of the
cracking and crushing indicated did not become apparent until failure occurred.
A typical case is shown in Fig. 8a for specimen 2-1/2 W 15. Fig, 8b shows
this same specimen with the concrete ·cover chipped off following the test.
A slight gap can be seen between the head of the nut and the concrete.
3. Specimens in which the full tensile strength of the bolt was developed
and failure occurred in the steel anchor bolt itself. Two types of such
failures were observed as follows:
a. In two specimens the bolt failed inside the concrete in the root
of the thread immediately in front of the anchor nut. One of these cases
is shown in Fig. 9a.
b. In two other specimens the bolt failed outside of the concrete at
the root of the thread where the loading nut was attached. One of these
specimens is indicated by the arrow in Fig. 9b.·
Although these four cases were the only ones in which the full ultimate tensile
strength of the bolts were developed, the nominal yield points of the bolts were
4

16
Fig. 7a. Splitting failure
Fig. 7b. Splitting failure--end view
17
Fig. 8a. Crushing and spalling failure
Fig. 8b. Crushing failure ..... cover removed

18
Fig. 9a. Fracture of bolt inside concrete
Fig. 9b. Fracture of bolt outside concrete

19
developed in over 90% of all the specimens tested.
In addition to these three general cases there is one other specialized
type of failure. In the series to check special forms of end anchorage, one
anchor bolt was used which had no anchorage. (That is, it was just a smooth
round bar.) This specimen failed by simply pulling out of the concrete at a
fairly low stress.
Basic Calculations
Since the loading system was statically determinate, the applied moment
at the concrete bearing face can be calculated as a function of the known ram
load. The calculated steel stress f can be found approximately as f = M/(A jd). s s s
Because of some apparent discrepancies in preliminary calculations, it was
decided that the values for calculated steel stress should be computed for both
the gross bolt area ignoring the threads and for the mean thread area as
recommended by ASTM standards. 5 Tests have shown that the strength computed
on the area at the root of the thread gives a fictitiously high value. It
has also been shown that if the strength is computed on the pitch area it gives 6 .
a fictitiously low value. Slaughter has observed that the mean diameter is
closer to the diameter of an equivalent bar in tension than either of these
other two diameters. The mean area can be calculated from Eq. 1.
A sm
where
0.7854 [n _ 0.~74j 2
A = mean stress area sm
D the nominal diameter of the bolt
n threads per inch
(1)
Because of the design of the loading assembly, the compression force was
concentrated on a very small line area of the compression zone. Hence it was
felt that the lever arm jd was known within an accuracy of 5%. Thus all steel
stresses could be accurately calculated from f = M/(A jd). sm sm
The unit bond stress, u, is that which would be obtained by dividing the
calculated bolt tension by the entire surface of the bolt from the beginning
of the embedment to the point of attachment of the washer and nut, as though
the bond were uniformly distributed. In all cases when we speak of a number
of diameters of bolt embedment we are speaking of this same distance, that is,
from the point of embedment to the beginning of the head of the anchorage nut.

paz
Variables
CHAPTER 3
ANALYSIS OF DATA
20
The primary variables in this investigation were three in number, namely,
bolt size, bolt length, and type of end anchorage. Accompanying the variation
in bolt size was the corresponding variation in the size of the standard nuts
and washers used for the end anchorages. A complete tabulation of the bolt,
nut, and washer dimensions is given in Table 1.
In addition three secondary variables were introduced due to the nature
of the test specimens used and to the construction practices. The first of
these is the ratio of the clear cover over a bolt to the bolt diameter. Follow
ing the standard practices of the Texas Highway Department, bolts in a footing
specimen of a given depth were located with a fixed center to center dimension.
Inherent in this method of detailing is a decreasing clear cover for larger
bolt sizes. This can be represented both as an absolute decrease in cover and
as a decreasing ratio of cover to bolt diameter. These values are also tabu
lated and are given in Table 1.
Secondly, the concrete strength varied somewhat during the test program.
While it was desired that all concrete should have the same f " due to the c
inherent nature of scatter in the concrete mixes some deviation was noted. A
histogram of the concrete strength f ,
is shown in Fig. 10. It can be seen c that the average f I was 4650 psi. However, in two footing specimens a substan-c tial deviation from this value was noted. Although in many bond investigations
using deformed bars a correction for variation in concrete strength has been made
assuming that the bond strength will vary as the square root of f I, there is no c
evidence that this same relationship would apply for the steel or bond stress
developed at a given slip in these specimens. Since very meager data is avail
able for variation of concrete strength in this series, it was felt that the
basic data could not be corrected for the variation in concrete strength. How
ever, attention will be called to this point in later sections of this report.
Lastly, it has previously been mentioned that two of the anchor bolts
delivered and tested were machined from a high strength steel with no well
defined yield point. These specimens illustrate some of the effects of using
higher yield point steels. In the original proposal it was indicated that an
-
t'
, ..
"
, .. ,>,
,I/:
.. I.

21
TABLE 1
ANCHORAGE DETAILS
Bolt Nut Washer Clear Clear Cover
Diameter, Diameter,(l) Diameter, Cover, Diameter
in. in. in. in.
1 1/4 1 7/8 (2) 3 (4) 2 3/8 1.90
1 1/2 2 1/4(2) 3 1/2(4) 2 1/4 1.50
1 3/4 2 3/4(3) 4 (4) 3 1/8 1. 79
2 3 1/8(3) 4 1/2(4) 3 1.50
2 1/2 3 3/4(2) 5 (5)
2 3/4 1.10
3 4 5/8(3) 5 1/2(6) 2 1/2 0.83
Notes: (1) Measured Across Flats
(2) Finished Hexagon Nut (Ref. 7)
(3) Heavy Semifinished Hexagon Nut (Ref. 7)
(4) Type B, Regular Series (Ref. 8)
(5) Type A (Ref. 8)
(6) Type B, Narrow Series (Ref. 8)

(/) Z IJJ ~ U IJJ a.. (/)
LL 0
0 z
22
12~----------------------------~----------------~ r-- AVERAGE
10 -
8 ~
I
6 ~
4 ~
I
2 ~
,
O~~~~~~~~l~~~~ 2.75 3.00 3.25 3.50 3.75 4.00 4.25 4.50 4.75 5.00 5.25 5.50 5.75
CONCRETE CYLINDER STRENGTH, f~ KSI
FIG. 10 HISTOGRAM OF CONCRETE STRENGTH, f~
.',
,r
',.
".

23
exploratory specimen would be provided utilizing such high strength steel. The
tests of these two bolts achieved this purpose.
Steel Stresses
As has been previously mentioned, a fundamental question which had to be
determined in the interpretation of the data was the basis for computation of
the steel stress on a partially threaded bolt. After a study of the available
references it was decided to run a single companion test program to verify the
accuracy of the mean thread area method. Accordingly, two tensile test speci
mens were ordered from the manufacturer of the bolts. The first was a piece
of unthreaded 1-1/2" bar stock. The second was a piece of the same stock
threaded over its full 18" length with standard 1-1/2" USS threads. The two
specimens were then tested using an identical 5" gage length to measure the
strains. The resulting stress-strain diagrams are shown in Fig. 11. The
diagram for the unthreaded bar is indicated by the curve OA. The correspond
ing stress-strain diagram for the threaded bar based on the root area is
indicated by the curve OB. It will be noted that for a given strain, the
latter indicates a stress several percent greater than that of the unthreaded
section. The stress-strain curve for the threaded bar as computed on the
basis of the mean thread area is indicated by curve ~C. Computations by this
method indicate a stress for a given strain several percent less than that of
the unthreaded bar. It was felt that, in the interpretation of the test results,
steel stress computations should be based on the mean thread area so that the
steel stresses indicated would be on the conservative side. Thus all steel
stresses referred to in the remainder of the report pertain to the mean thread
area.
Loaded End Slip
The optical micrometer system did not measure slip alone but also included
the elongation of the bolt between the position at which the target was attached
to the bolt and whatever portion of the bolt was no longer bonded to the concrete.
Since this length was highly indeterminate no attempt was made to reduce the
apparent slip measurement to correct for the elongation of the bolt. Therefore
in the remainder of this report when the term slip is used it will be taken
to include the total extension of the bolt as measured at the face of the

.... (/) ~
50~i----------------------------------------------------------------------~
40 " .............. - -------~-------------------------------------
en 30 (/) UJ Q: l(/)
-I ~ 20 t;
10
TENSION TESTS
I VI!, BARS
--- A SMOOTH BAR - - - B THREADED BAR
(ROOT AREA)
------ C THREADED BAR (ASTM "MEAN AREA")
O~'--------~------~------~------~~------~------~--------~----~ o 0.001 0.002 0.003 0.004 0.005 0.006 0.007 0.008
STRAIN, in/in
FIG. II EFFECT OF METHOD OF CALCULATION OF STRESS IN A THREADED SECTION
. '
N .p.

25
concrete.
The plot of this slip against either load, bolt stress, or bond stress
gives the same curve shape for any given specimen since a combination of given
bolt size and length establishes fixed ratios between load, tensile stress,
and average bond stress.
It has been mentioned that in the test procedure many of the specimens
were loaded initially only until apparent yielding. Then the specimens were
unloaded and a corresponding set of zero load readings were taken. Upon
completion of the testing of the other bolts in the footing specimen, many
of the bolts were reloaded until failure became evident. After examination
of the data observed in these tests it was found that all of the reloaded
specimens seem to have a common behavior. As indicated in Fig. 12 the steel
stress-slip curve OA indicates the results of the initial testing of specimen
1-1/4 W lOb. Testing was discontinued at A and the load released. The total
permanent slip upon removal of the load was observed as indicated by the
descending branch AB. After testing of several of the bolt specimens, test
1-1/4 W 10b-2 was run. In this test the steel stress-slip curve BCD was
observed. On the same figure is illustrated the results of a generally
similar test specimen in which the bolt was initially tested to a much higher
slip level. This steel stress-slip curve (1-1/2 N lOb) is shown by curve ~C.
It should be noted that the last observation agrees with an observed value
for the retesting of 1-1/4 W lOb. If one extends curve OA by the light dashed
line shown until it intersects curve CD, it -is reasonable to assume that a
credible cumulative steel stress-slip curve for this specimen is described
by the resulting total curve OACD. In the remainder of the report such a
construction has been used to eliminate the unloading and reloading branches
of the steel stress-slip curves, since this construction always takes place
substantially above the nominal yield point value. It is felt that this
hypothesized curve will serve as a reasonable indication of the measure of
ductility observed. However, in all cases a dashed line will be used to indicate
the portion of the curve which is not primary observed data.
The resulting mean area steel stress-slip curves are plotted as follows:
Figure 13. 1-1/4" bolts Figure 16. 2" bolts
Figure 14. 1-1/2" bolts Figure 17. 2-1/2" bolts
Figure 15. 1-3/4" bolts Figure 18. 3" bolts
Figure 19. The special anchorage group
1&
" '"

H (/)
60
50
~ 40 ~
(/) (/) w a:: l(/)
~ 30 w l(/)
Z « w ::E 20 ~
E en ....
10
0..2
A ~ ... .-" ....
1'/4 WIOb~ /f - I
/ I
c ---
IY4NIOb
I J /-1'14 W IOb-2
.02
I t J /
I t J, It
1/
B
.04 .06 .08 .10
GROSS END SLI P, in.
D
-'-=IY4WIOb-2
.12 .14 .16
FIG. 12 EFFECT OF INTERRUPTED LOADING ON STEEL STRESS-SLIP RELATION
N 0'\

1-4 oo ~ .. oo oo I.IJ a: l-(/)
..J I.IJ I.IJ l-(/)
Z <t I.IJ ::?!
60
50 , .. /' -. I \~ .. ~~U;{/
40
30
20
10
~ -------;:::...------- '-=--------- --- ----."",.. .".".- I Y 4 W lOb
~IY4NIOb
IY4 N 150
/ . . I • . I • . I . . I
0' I
0.02 0.04 o
0.06 0.02
0.08 0.04
0.10 0.06
GROSS SLI P - in.
0.12 0.08
0.14 0.10
FIG. 13 STEEL STRESS-SLIP CURVES FOR IY4" BOLTS
0.16 0.12
'" -.!
,
~

.... (/)
~ .. (/) (/) UJ a: l(/)
...J UJ UJ l(/)
Z <l UJ ~
60
50
40
I 30~
I 20
10
0
ff " ,. r
IY2 N 100
_------------ _00-- - - 0-:';'-0 __ ~o - 00
"" .. .".".,.,..- - - - - - --
o ----
/
0 ----------------- ---,- ------
,:/ / •
."."'" ,,'
IY2 W 150
~IJ. IY2 N lOb r I ~ 1'12 N 150 I IY2 WIOo
rl 1
a ,
II
0.02 0.04 0.06 0.08 0.10 0.12 0.14 0.16 0 0.02 0.04 0.06 0.08 0.10 0.12
GROSS SLIP - in.
FIG. 14 STEEL STRESS - SL I P CURVES FOR I Y2" BOLTS
N 00

60
50
tot (/) 40 ~
(/) (/) UJ 0: l-(/) 30 ..J UJ UJ
t; Z
~ 20 ::!
10
0 0.02
FIG. 15
-----~ .. - .. -~- - - --II"'''~ - ---7"" .. ."""....- - -------" ---, , - -.. ~ ---- - - - - -
" -~ .. --- ---13/4 N 100 (HI-STRENGTH BOLT)
,. .". ."." ./"""" .
/" /;"A /./ ./
/' ,,4---1 3/4 N 150
" • if 13/4 W 100 (HI-STRENGTH BOLT)
,. I I~ W 15 a
_-__ .. 1.10/4 :~~~.~ORAGE)
0.04 0.06 0.08 0.10 0.12 0.14 0.16 0 0.02 0.04 0.06 0.08 0.10 0.12
GROSS SLI P - in.
II
STEEL STRESS- SLIP CURVES FOR 10/4 BOLTS
N \0

60
50
..... (J) 40 ~
.,.. (J) (J) LLJ a:: I-(J)
30 ...J LLJ LLJ I-(J)
Z <:(
20 LLJ :E
0 0.02
FIG. 16
__ ------ r2 WIOo ."..,.,." ---.1_-
~- -~~-....",. --""," 12N'Ob --------
- 2 N 100 - - - - - - -- - -~ ......... ..,.-: ........ -:=--==-=----- ,."",.,.,..-.--------~-----___ - _---- ~t'" -- .~..;...".-..- --_ ... - - _ ... - --
;;""--- - -,.",,--
0.04 0
..."....,.--1IfIIIIIt~"" ."
• •
/ ~ 2 N 150
!-, " 2WI50
0.06 0.08 0.10 0.02 0.04 0.06
GROSS SLIP - in.
0.12 0.08
STEEL STRESS-SLIP CURVES FOR 2" BOLTS
0.14 0.10
0.16 0.12
w 0

o 10
0 0
10 0
~
z ~
(\J
00
0
V
rt) (\J
IS~ 'SS3~lS
l33
1S
N~3~
v 0 (\J
0 0 0 OJ
0 d to 0 d V
0
0 d
10
Z
(\J
0 d
o o
31 CJ)
~
0 CD
-~
C\J
a:: 0 IJ..
CJ)
c W
I
>
Q.
0:: :::>
...J U
t()
(/) a..
(/) ....J
0 a:: C
J) (!)
I
CJ)
CJ)
w
0:: ..... C
J)
....J W
W
..... C
J)
I'-
(!)
IJ..

111'"""','"
50
..... (J) 40 ~
.. (J)
~ 3J / ./ £3WIOO
I ~~-~ '-'~ ....J lLI lLI J-(J)
Z
~ 20t- /'''-.- I 3W 150 ~
10
O~'------------~---------~---------~------------~---------~------------~---------~ 0.02 0.04 0.06 0.08 0.10 0.12 0.14
GROSS SLIP - in.
FIG. 18 STEEL STRESS- SLIP CURVES FOR 3" BOLTS W N

50
H
~ 40 ..
en en I.IJ a:: I-en 30 ..J I.IJ I.IJ
t; Z
~ 20 :E
10
y4 SC 10 (45°)
I .",/~ ,- -.,.,. --Ii-,..., I 13/4 S8 10 (30°)
,.... 13/4 SA 10 (SAME AS 13/4 N 10 SERIES)
__ ----- .£10/4 SO ~~~~~:'~--
O~·--------~------~--------~------~~------~--------~--------0.02 0.04 0.06 0.08 0.10 0.12
GROSS SLIP - in.
FIG. 19 STEEL STRESS - SLIP CURVES FOR 10/411
BOLTS
WITH SPECIAL ANCHORS
0.14
w w

p
34
These figures allow comparisons to be made between the main variables in each
bolt size grouping. In all of these figures an x has been shown at the point
of discontinuance of the testing because of apparent yielding if the bolts
were not retested. Hence a curve which ends in an x should not imply lack
of ductility in the particular test but rather incomplete data.
Since there is an extremely large amount of data presented in these
figures, selected portions of the significant data will be rearranged in the
succeeding sections to facilitate analysis.
End Slip at Critical Steel Stresses
In order to illustrate service load behavior the measured end slip corres
ponding to a steel stress of 20 ksi is shown in Fig. 20 as a function of the
bolt diameter. This steel stress corresponds closely to the present service
load design stress used by the Texas State Highway Department Bridge Division
for sign structures. The bolts with 10 D embedment lengths tend to indicate
slightly greater slip than do those with 15 D embedment lengths. However,
there is not a clear cut definite pattern and in several cases the longer bolts
actually show a greater slip than the shorter bolts. Except with the 3" bolts
the combination nut and washer anchorage (W) shows somewhat less slip than
the plain nut anchorage (N). The 3" bolts with nut and washer anchorages show
more slip than the corresponding specimens with nut anchorages alone. This is
discussed later with regard to the reduced cover over the washers.
In the analysis of pullout tests of deformed bars it has normally been
assumed that the slip at the loaded end might be considered as half of the
crack width that would be developed in a beam at that bar stress. Under these
conditions a crack 0.02" wide would correspond to an end slip of 0.01". The
0.02" crack is about an upper limit on suggestions that have been made as to
maximum permissible crack widths in beams at working loads. It is realized
that this crack width limitation is not necessarily applicable to the slip
occurring at the end of an anchor bolt. Indeed a good justification may be
given for selecting the limiting service load value of slip as 0.02" in this
type application.
If the more stringent slip limit of 0.01" is applied, all of the anchor
bolts of less than 2" diameter meet this requirement regardless of the embedment
length or type of anchorage. (Note the 1-3/4" special anchorage series is
omitted.) For all practical purposes this statement could be extended to
c

0.030 fsm = 20 KSI
I.ll ..

36
include the 2" diameter bolts since only one of these shows a slip in excess
of this limit. Both 2-1/2" bolts with nut and washer anchorages meet the
criteria although those with nut anchorages do not. However, the 3" bolts
have an exactly opposite behavior. Bolts with nuts developed much less slip
than those with nuts and washers. This is apparently due to the extremely
shallow cover (1-1/4" clear cover) over the washer in this series which led
to early cracking. If the criteria of 0.02" is accepted, all of the bolts
would meet the criteria.
Figure 21 illustrates the observed slip at the nominal yield point of the
bolts, that is a mean area steel stress of 33 ksi. While the allowable slip
criteria for this case cannot be easily formulated, it is interesting to note
that all specimens except three of the 3" bolts indicate less than 0.03" end
slip at the nominal yield. In the case of the 3" bolts, the specimens with
10 D embedment length had failed (as indicated) at less than 33 ksi, while
the 15 D specimen with nut and washer anchorage had a slip of approximately
0.046" at this stress level. It can again be noted that generally the 15 D
specimens with washers show the least amount of slip at this stress level. In
the 10 D specimens, slip does not seem to vary consistently with the type of
end anchorage. In some cases, specimens with nuts show less slip than speci
mens with nuts and washers. The opposite .is true in other cases.
In order to provide a qualitative indication of the relative relation
between slip and elastic elongation, two additional curves are given in Figs.
20 and 21. Assuming that the anchor bolt is unbonded between the face of the
concrete and the head of the anchor and using the stress as computed on the
unthreaded area in this region, one can determine the theoretical elastic
elongation of the bolt. This approximate elongation is shown for both· 10 D
and 15 D embedment lengths. In Fig. 20, the 10 D bolts tend to indicate an
end movement fairly close to that which might be expected if no bond were
present, while the 15 D bolts indicate substantially higher bonding characteris
tics. In Fig. 21 the 10 D bolts generally indicate an even greater end movement
than that calculated. This indicates two important factors. The first is
that the effect of bond at this level must be very small. Since the 1-3/411 bolt
with no end anchorage and a 10 D embedment length pulled out of the specimen
at a stress of about 13.6 ksi, the major portion of the tensile development must
be by bearing on the end anchorage device. Only a minor portion can be credited
to friction bond. Second, since the measured end movement is greater than the
total elastic elongation computed assuming zero bonding, the end anchorage
, ,
J k
. "

0.06 ,
0.05r-
0.041-
. c ..
I 0.. ...J fJ) 0.03 fJ) fJ) 0 0: C)
• 0.02_
0.01--
oW:: I
Ill···
+ • (SLIP OF .071" AT 32.2 KSI)
• /' /'
~~3KSIJ ;I'
./ "" /' ~ II
" .JI
"
• •
IY4 IY2 13/4 2 2V2 3
BOLT DIAMETER, in.
FIG. 21 SLIP AT A STEEL STRESS OF 33 KSI
f sm = 33KSI
~ ... f"""t..., • • "
ELONGATION
(COMPLETELY UNBONOEO BOLT
100
~ ANCHOR
o 10 N • lOW II 15 N • 15 W
L.<> .....r

38
device must have moved. After completion of the testing, the cover over the
bolts on many specimens was carefully removed. As can be seen in Fig. 22 a
definite separation was visible between the rear end of the nut and the con
crete immediately adjacent to it. Similarly, as shown in Fig. 23, in the
cases of specimens with nut and washer anchorages both a gap behind the nut
and a definite bending of the washer around the nut were observed. This
simply reinforces the conclusions arrived at by Abrams l that a certain amount
of slip is essential to bring the end anchorage into action, and that the
amount of movement required to bring this end anchorage into bearing will
almost completely destroy the bars adhesion and sliding resistance. However,
the 15 D bolts generally have less end movement than if completely unbonded.
Therefore, it can be concluded that the longer embedment length does not
rely so completely on end anchorage to develop the nominal yield pOint of the
bolt.
Steel Stress at Limiting End Slip
Another way of illustrating the concept of a limiting slip criteria is
to rearrange the basic data to show the steel stress developed at a particular
end slip. Using the criteria of a limiting service load end slip of 0.01"
as discussed in the previous section, the relation between steel stress, bolt
size, embedment length, and type of anchorage is illustrated in Fig. 24. As
shown previously, all 1-1/4" through 1-3/4" bolts (with the exception of the
unanchored 1-3/4" bolt) developed greater than 20 ksi at this end slip. All
of the 2" bolts except one developed greater than 20 ksi. Only the 2-1/2"
and 3" bolts pose a serious problem with the development lengths used. Two
factors must be considered for these bolts. First, should the allowable slip
criteria be relative to bolt size? Is it realistic to expect that a 3" bolt
should meet the same deformation criteria as a 1-1/4" bolt? Secondly, in a
subsequent section the cover used with these bolts will be shown as possibly
inadequate. With revised cover and a more realistic criteria for the large
bolts, all sizes should fulfill service load demands.
Ultimate Strength Behavior
In addition to meeting service load requirements, it is important to
ensure that the anchor bolts will not fail due to loss of end anchorage or
L

39
Fig. 22. End movement of nut
Fig. 23. Movement and distortion of nut and washer

--------, ... ' .... "...,..,~~~.~. -,~"~.--"-,.~." .... ~"., .. "~"-"" ... "~.-."-" .. ~-- ---,.- "·-··-··--··-·-,· .. ·-··,·· __ • __ ."_"."M'" .. '~." ..• ,,_ ., .....
50 I-L 15' ANCHOR
o 10 N
• 10 W [] 10 SO
40 l- II 15 N
• 15 W .... (f) ~ • ~
.. 30 j (f)
0 • (f) • 0 141 a: l- • • (f) ~ ...J
Il 0 • LL.I 20 8 i • 8 LL.I I-
0 • (f) 0 II • [] (NO ANCHOR)
10
OLI--------------------~--~--~--~------~------~-----------------------I Y4 I Y2 I 3/4 2 2Y2 3
BOLT DIAMETER tin.
FIG. 24 STEEL STRESS AT A SLIP OF 0.01 in.
Po

I t
41
bearing capacity prior to the development of their full yield point stress.
Unless this yield point can be developed, the structural design will not have
the desired factor of safety. Accordingly, even though it is realized that
the extreme amounts of slip occurring at high loads would be undesirable, a
study has been made of the ultimate strength characteristics of the specimens.
Fig. 25 shows the ultimate steel stress (f ) as a function of the bolt su
diameter, D. All specimens tested to failure except the 10 D 3" bolts developed
the nominal yield point of 33 ksi. In general the 15 D embedment was somewhat
more effective than the 10 D embedment. However, this effectiveness was
definitely much less than the 50% increase in embedment length. Upon study
of the data it was felt that one variable in the test was not reflected in
this figure. This was the amount of clear cover over the bars. As has been
discussed previously in the section on specimen behavior and failure, the
larger bolt specimens with less cover failed due to crushing of the concrete
over the anchor. After an attempt to relate ultimate steel stress to clear
cover proved unsatisfactory it was decided to investigate the relationship
between ultimate steel stress and the ratio clear cover divided by bolt
diameter. This relationship is illustrated in Fig. 26. Comparison with
Fig. 25 indicates clear cover as a function of bolt size seems to be a
significant parameter. Two distinct curves are visible, one for the 10 D and
the other for the 15 D embedment length. In addition, the nature of the
failures have been shown. It can be seen that usually with low cover to dia
meter ratios, failure occurs due to crushing and spalling in the vicinity of
the anchor. With higher cover to diameter ratios, the failure occurs due to
splitting above the bolt. Unless sufficient cover is provided, the concrete
above the anchor will crush prior to splitting of the cover or the development
of the tension force in the bolt.
Bearing Stresses
In Abram's study of the concentric pullout specimen he had reported
bearing stresses of an much as 13,000 psi in the specimens with nut anchorages.
His concrete had a compressive cube strength of 2240 psi. In terms of
cylinder strength, this would be equivalent to f ' of about 1850 psi. Thus, c
the calculated bearing stresses would be as high as 7.0 f '. Of course, it c
must be realized that this is a case of a concrete element under a great deal
of confinement and it should be possible to develop very high compressive

•
0:
0 z~
z ~
:r.: 0
0
10 10
U
---
z ct
..Jlo oe <
] .....
<3 ..... •
0
<3 •
0
..... <3 0 • •
o I'-
• <
]0
eo
o 0
0 0
~
10 V
~
1S>I 'SS3!::11S
13
31
S
3JJ1WI.l1n ,n
sl
~
o (.\J (.\J
(.\J
c: .. 0:
UJ
t-UJ
:i ct 0
~
0 CD 42 en en w
0::
to ..J W
W
~
en W
ti ~ ~
:::>
It) N
(!)
lL.
..

., • i ;
j
!
I I
I 1
43
stresses under such a triaxial stress condition. However, even considering
this, such magnitudes of stress are surprising.
In order to check the general magnitude of the bearing stresses developed
by the anchorage devices, a simplified set of computations were made. Since
the ultimate bond characteristics of the 1-3/4" bolt without an anchorage
device were comparatively small, it was assumed that at failure the total
tension force in the bolt was taken by the anchor device. This certainly
was true in the cases of the two ultimate tension failures occurring at the
anchors inside the specimen. It was probably true in the majority of other
specimens. Since only the general magnitude of the bearing stress is sought,
no further precision is justified. Equating the tensile force in the bolt
to the bearing stresses on the nut or anchor we see that
A f = A f s su c c
where A is the mean area of the bolt, s
f is the steel stress on the mean
area as tabulated in Appendix A, su
f is the concrete bearing c
is the area of the concrete in direct bearing. Therefore,
A = ...@. f
A su c
stress, and A c
The ratio A /A is given in Table 2. It can be seen that the average value s c
of this ratio for all the specimens with nut anchorage is about 0.5. The
value for the specimens with washers varied from about 0.18 to 0.36. Using
the values for the tests with nuts, we see that the bearing stress developed
at ultimate would be approximately one-half of the ultimate steel stress.
From Fig. 26 illustrating ultimate steel stresses it can be seen that
computed bearing stresses would range from 15,000 to 32,000 psi. This is for
a concrete with an average f I of about 4650 psi and hence ranges from 3 to 6 c
f !. This seems to be in reasonable agreement with Abrams' test. It should c
be noted that in both Abrams' tests and in these specimens, spiral reinforce-
ment was provided. This will be extremely helpful in containing internal
splitting and increasing lateral stresses. For the specimens with nut and
washer anchorages, the bearing stresses developed are approximately 2 to 3
f ' if the full area of the washer is used. However, since so many of the c
specimens displayed only a slight increase in ultimate steel stress when the

" ,
D
Nominal
Bolt
Diameter
in.
1 1/4
1 1/2
1 3/4
2
2 1/2
3
A s Mean
Stress
Area,
Sq. in.
0.969
1.405
1.899
2.498
3.999
5.967
TABLE 2
BEARING AREAS
A A A cn cw --L Net Net A cn Nut Washer
Area, Area,
Sq. in. Sq. in.
1.82 5.84 0.533
2.61 7.84 0.538
4.13 10.14 0.460
6.00 14.59 0.417
7.29 14.73 0.548
10.48 16.66 0.570
44
A A A s cr --L A Critical A cw cr Stress
Area
Sq. in.
0.166 27.0 0.036
0.180 26.5 0.053
0.187 47.9 0.040
0.172 47.0 0.053
0.272 45.3 0.088
0.358 43.2 0.138
,f
/'
"
/"

70
H 60 oo ~
.. I~
oo oo UJ
FAI LURE TYPE 0::
~ 50
-I T = BOLT TEN SION S = SPLITTING UJ
UJ C = COVER CRUSHING r-oo
UJ 40 ~ :i!
~
~ ANCHOR j 30l XsS-C S-C 0 10 N
• lOW II 15 N .. 15 W
20 CLEAR COVER
.833 1.1 1.5 1.79 1.9 BOLT DIAMETER
BOLT SIZE, in. 3 2V2 IY2,2 10/4 IY4 .j::-VI
FIG. 26 ULTIMATE STEEL STRESS AS A FUNCTION OF CLEAR COVER

46
washers were used, it can be concluded that the total area of the washer was
not fully effective in developing bearing. Examination of the specimens after
failure indicated that the washers were generally bent back over the nuts.
This would indicate a diminished effectiveness in bearing.
Bond Stresses
Any single curve for steel stress vs. slip, by a change in vertical
scale, can be turned into a bond stress vs. slip curve. However, the change
in scale is different for each bolt size and for each embedment length.
Because of the way in which the average bond stress has been defined, speci
mens of identical bolt size but different embedment lengths and with almost
identical steel stress vs. slip curves would yield quite different bond stress
vs. slip curves. For instance, in Fig. 17 specimens 2-1/2 W 10 and 2-1/2 W 15
have practically identical steel stress-slip curves up to about 30 ksi. Yet,
if the bond stress was computed at any given slip, the bond stress for
specimen 2-1/2 W 15 would be only 2/3 that for 2-1/2 W 10. This is probably
not reflected physically since it is possible that the local bond stresses
at a particular point might be almost identical. As a matter of fact, near
ultimate, local bond stresses for the two cases are probably close to zero
since it is the end anchorage which seems important. Therefore, it was felt
unnecessary to present the basic data in terms of bond stresses.
Effect of Clear Cover
It was indicated in connection with the discussion of ultimate strength
that one of the main variables in developing the ultimate strength of a
given anchor bolt was the effect of the clear cover over the bolt. More
precisely, it seems to be the effect of the clear cover over the bolt as
related to the diameter of the bolt used. In order to investigate this in
more detail, several studies were undertaken to attempt to determine the
effect of the clear cover. Unfortunately, in this particular program there
was not a great variation of cover to diameter ratios. However, there does
seem to be enough information to indicate certain trends.
In the cases in which failures occurred prematurely (that is, before
the desired tensile strengths of the bolts were developed) the failure seemed
to be one of compression crushing and spalling of the cover immediately over
the anchor device. A view of such spalling is indicated in Figs. 27a and 27b. •

47
Fig. 27a. Cover spalling

48
Fig. 27b. Spalling over anchor
Fig. 27c. Anchor after removal of cover

49
By matching the actual location of the anchor and the cracking patterns shown
in Fig. 27c with those of Fig. 27b, the location of the nut and washer have
been indicated. It can be seen that the crushing seems to radiate from the
anchor in a pyramidal pattern at angles somewhere between 30 and 45 degrees.
Postulating that this same type stress distribution might be taking place in
three dimensions, leads to the idea of a truncated cone of stress radiating
out from the head.
The following hypothesis is advanced: Assume that the critical stress
area for bearing will occur not at the end anchor, but on the base of the
cone defined where this cone of stresses intersects the surface of the speci
men. This is illustrated in Fig. 28. This area which we will call the
critical stress area can be computed as
where ~ is the total cover measured from the center line of the bolt and D
is the diameter of the bolt. The values of this critical stress area are
given for the various bolt size and cover combinations in Table 2. By
recomputing the bearing stresses on this fictious stress area, a new index
can be obtained which will include cover. Since
f A su sm
= f A cr cr
f cr
= Asm A
cr f
su
The fictious ultimate bearing stresses f have been computed and are given cr in Table A. In Fig. 29 these computed stresses are plotted as a function of
the parameter clear cover/diameter. The results tend to group quite well.
The data points indicated with the letter D represent specimens in which the
tests were discontinued at yielding and represent proof loads. It can be
noted that the values of f for the low cover/diameter ratios are in the cr general vicinity of cylinder strength. They represent the larger bolts which
failed principally in crushing and spalling. In order to recognize the
variation of the concrete strength in the specimens, it was felt that this
data should be corrected for variation in cylinder strength. Since much of
the failure phenomena involved splitting and since this is affected to a
great extent by the tensile strength, any correction for concrete strength

" " " ''t'o T .....-----1- _________ I !-:-~
~, - - - - - - - - - -LJ--of 1)-_" )
/ /
.,/
PLAN
T - - - - - - - - - - t ,+.:~ ....... , - - - - - - - - - \'" +-f
1,..)--'
ELEVATION
SECTION AA
.". 2 2 Acr = 4"" (C -0 )
FIG. 28 CRITICAL BEARING AREA HYPOTHESIS
50

51
7
0 ION to--t e lOW (f) 6 6 15N ~
... A 15W
~I~ 6S-c FAI LURE TYPE II
""' A S-C T = BOLT TENSION c.J 5 - AC S = SPLITTING ... C = COVER CRUSHI NG (f)
e S-C (f) D = DISCONTINUED UJ 6C a::: AT YIELD
~ OS-C (f)
C) 4 ec z a::: « OS
t~ UJ CD
...J :3 CtI§ «
u ~ C~SS ~t a::: u C
ef ~8 e§ 2
S«>S D
D~~ D
O----------------~--------------~--------------------~ 0.5 1.0 1.5 2.0
CLEAR COVER/BOLT DIAMETER
FIG. 29 CRITICAL BEARING STRESS

<
90
80
70
60
40
30
20
II S-C ~ S-C
"'" .S-C
~C
llC
Ai~-C ec
'" . ~
o ION e lOW II 15 N ~ 15W
FAI LURE TYPE
T = BOLT TENSION S = SPLITTING
52
C = COVER CRUSHING o = 01 SCONTINUEo
AT YIELD
, C~S
"" C~~ ..
~ T~~ 00 00 eo
, eT
~.s ~~ ~o o
10~--------------~------------~~------------~ 0.5 1.0 1.5 2.0
CLEAR COVER IBOLT DIAMETER
FIG. 30 CRITICAL BEARING STRESS RELATED TO CONCRETE STRENGTH
."
.' ,
~'
, . ..

53
should possibly reflect the general variation of tensile strength with com
pressive strength. Since many investigations in bond, shear, diagonal
tension, and tensile capacity of concrete have shown that these values tend
to vary with the square root of f I rather than as a linear function of f I, C c
this correction was used as an index of the variation of concrete strength.
In Fig. 30, the same data are re-expressed as a function of the ratio f / ~ cr -.j.l.c and the parameter clear cover/bolt diameter. Comparison of Figs. 29 and 30
will indicate that much of the scatter has diminished. This is especially
true in the low cover-diameter ratios. The 3" bolt specimens for 10 D and
15 D now plot almost together reducing a great deal of the scatter of the
previous figure.
It was felt that the relation shown in Fig. 30 might prove helpful in
formulating some rough guides for design criteria. Since it is desirable
that any such criteria be on the conservative side, a lower envelope Was
drawn in the form of the straight line AB indicated on Fig. 30.* This line
can be expressed by the equation
In order to have a clearer idea about the relationship proposed, it is
necessary to investigate what happens at the limits and what the overall shape
of the curve might be. As % approaches D, that is, the clear cover approaches
zero, if we have a bolt with a finite value of tensile force T, f /~ must cr c approach infinity. Similarly as £2 becomes much greater than D, then A cr approaches infinity. If the critical stress area approaches infinity, the
stress must approach zero. Hence we see that the over-all form of the
relationship expressed should be a hyperbola as shown in Fig. 31. The
straight line portion AB previously predicated may only be valid for the
very small range of variables for which we have test data. However, a few
other points are available. In a pilot series of tests run prior to this
investigation, a footing specimen was tested with a 1-3/4" anchor bolt and
approximately 10 D embedment. The anchorage was a standard nut and a cut
washer. This bolt failed in tension with a nominal steel stress of 76 ksi.
*Note that the points marked as "D" do not represent failure loads and were ignored in selection of the criteria.

100
80. . RANGE OF DATA
REPORTED
1-- ~l I \
60
fer -Jif
40 1 EXPRESSION DERIVED
20
ABRAMS
I I O' 2 3 4 5 6
CLEAR COVER/BOLT DIAMETER
FIG. 31 PROBABLE GENERAL FORM OF CRITICAL BEARING STRESS - COVER
RELATIONSHIP
\.II .p..

55
However, in this particular specimen a greater amount of cover was used than
in the present series. The clear cover over the bolt was 4-1/4". This makes
the ratio clear cover/diameter equal to 2.43. The computed f = The concrete strength was 5734 psi and hence the ratio f /~ = cr c
1640 psi.
21.5. This
point is plotted on Fig. 31. In addition, in Abrams' original set of pullout
specimens he tested some 3/4" bars with a nut and washer anchorage embedded
for 8" in a 8" diameter concrete specimen. The length of embedment is again
approximately 10 diameters. For these specimens the ratio clear cover/diameter
equals 4.84. The specimens failed by splitting of the concrete. He reports
only average bond stresses but from these it can be calculated that f = 349 cr psi for the specimens with nuts and 385 psi for the specimens with nuts and
washers. The cylinder strength would be approximately 1860 psi, hence the
ratios f /~ = 8.1 and 8.95 respectively. These values are also shown in cr c Fig. 31 and tend to indicate the general trend of the results. However, it
must be emphasized that any conclusions as to the desirable amount of cover
deduced from these results are extremely approximate and should be considered
within the limits of test data available in developing these expression~. As
in all empirical expressions a great danger exists in extrapolating limited
test results. However, in this case it is felt that an attempt should be
made to give some guidance as to the magnitude of adjustment of cover in order
to increase anchor bolt performance. Further testing should be done to
validate such changes.
If we accept the validity of this expression over a limited range we
can compute some desirable cover dimensions. Since
and,
f cr
since for
A cr
A f s s A cr
design f s
(94 - 14.9.) D
should equal f y' A f sm y
Jf7 c
If we work with design values of f = 33,000 and f ' = 3,000 then f /~ ; y c y c
600. Substituting these values along with the value for the critical area,
we can obtain the expression
60A sm

-56
For each standard bolt there is a fixed relation between D and A Substituting sm
these in the previous equation we can get an expression which is a cubic function
of C. Solving this numerically and obtaining C to the nearest quarter inch we
obtain the following results.
D C Calculated C Actual
1.25
1.5
1. 75
2.00
2.50
3.00
4.25
5.00
6.00
6.75
8.50
10.75
6~'::
6~"
8
8
8
8
A comparison of the minimum desired cover and the cover utilized indicates
that the present cover is satisfactory except for the 2-1/2 11 and 311 bolt sizes.
This would be expected from the nature of the test results. The specimens
which suffered from apparent lack of cover were the largest sizes. The results
would indicate that the 2-1/211 bolt cover should be increased slightly. (The
cover from the center of the bolt to the outer edge is equal to C/2.) This
indicates that the cover should be increased from 4 to 4-1/4". However, for
the 311 bolt a more substantial change is indicated. The present 411 cover
from the center of the bolt should be increased to approximately 5-1/2".
Accepting the general limitations of the method, it is felt that this will
give a general idea of how to compute the required cover over the bolt. While
a different set of relationships could be developed for the 15 D embedment
lengths, it is not felt that the precision of the method warrants it. In
preliminary computations such an expression was developed and it was found
that virtually no changes in cover were indicated other than those found by
the preceding expression.
Pilot Tests-Bent Bolts
In order to get a general idea of what the effect might be of bending the
bolt so as to get more cover over the anchorage zone, a limited series of
tests were run. In this series a single footing specimen with 4 bolts was
*Present design standards actually use C 8 but in the test specimen C = 6.

57
used. SA was a standard 1-3/4" bolt 10 D embedment and a standard nut. Bolt
SB was the same as SA except for the 300 bend at midpoint. Bolt SC was similar
to bolt SB except that a 450
bend was put in the bolt. Bolt SD simply had
17-1/2" of plain unthreaded bar with no anchorage. The bent part of the bolts
were placed along a radius towards the center as illustrated in Fig. 4. The
results of this series is shown in Fig. 19. It has been previously mentioned
that the specimen with no end anchorage simply slipped out at a very low stress
level. Specimen SA behaved the same as the other specimens with similar embed
ment. Specimens SB and SC indicated a slightly stiffer load-slip response.
However, when the values are compared to those shown in Fig. 15 for the similar
1-3/4" bolts, it will be noted that they did not develop as high an ultimate
strength. Possibly this was due to very severe internal splitting. The higher
bearing stresses developed in the other specimens could not be obtained.
Another possibility is that the bend in the bar reduces the effective embedment
length and causes a stress raiser with an adverse effect. Unfortunately the
results of this series must be regarded as somewhat inconclusive in that
while the bending of the bolt seems to give somewhat better service load
characteristics, the ultimate strengths found were lower than in the unbent
anchor bolts.
Pilot Tests-High Strength Bolts
A very limited series of tests of high strength bolts was included in the
over-all program. The bolts used for specimens 1-3/4 N lOa and 1 3/4 W lOa
had no well defined yield point as shown from the stress-strain curve in Fig. A 2.
Their yield strength based on a 0.002 offset was 91 ksi. As can be seen in
Fig. 15 the specimens were loaded until end slips of greater than 0.02 inches
developed. Shortly after this the specimens failed by splitting. Both bolts
developed an ultimate steel stress of 54.1 ksi. Their companion specimens
with A7 bolts (1-3/4 N lOb and 1-3/4 W lOb) were the pair of specimens in
which the bolt failed in the thread area at the face of the anchor nut. The
latter pair developed ultimate steel stresses of 62.7 and 58.9 ksi. Since
the high strength bolts did not develop as high an ultimate stress as the A7
bolts due to failure of the concrete, it might be initially felt that there
is no advantage to their use. However, design for A7 bolts would be based on
a minimum yield point of 33 ksi, which is less than 60% of the ultimate steel
stress developed. Design for higher strength bolts would be based on a higher

>
58
stress level and could be based on the more realistic limit of concrete con
trol. However, it is important to note the observed reduction in ductility
when high strength bolts are used. This might be adverse in some structures.

59
CHAPTER 4
DISCUSSION OF RESULTS AND CONCLUSIONS
General Behavior
The testing of a group of anchor bolts in footing specimens similar to
those in use with sign structures has indicated certain important trends in
behavior. Observations of gross end slip developed at yield levels of
computed steel stress indicate that with an embedment length of 10 diameters
the load transfer is primarily through bearing of the end anchor against the
concrete. With an embedment length of 15 diameters an increased portion of
the load is transmitted through bond. However, the increase in load developed
is much less than the increase in embedment length.
The failure patterns noted indicated that the specimens could fail
either in tension by exceeding the ultimate tensile capacity of the bolts,
by splitting of the concrete block along the bolt axis or by crushing and
spalling of the concrete immediately over the end anchorage of the bolt.
In some cases a combination of these failures occurred. In almost all cases
yielding of the bolt occurred before final failure.
Comparison of the test results with a pilot test of a bolt with no
end anchorage indicated that the end anchorage is extremely important. It
appears that a standard nut will be sufficient anchorage on most bolts. Results
of tests with a combination nut and washer indicate only minor increase in
load capacity at ultimate. However, it is possible that the effect of heavier
washers would have been more significant. In the specimens with a low ratio
of cover/bolt diameter, the addition of the washer seems to have had a
detrimental effect. A limited series of tests with bent bolts were inconclusive.
Conclusions and Recommendations
The test series included anchor bolts ranging from 1-1/4" to 3" in diameter
with embedment lengths of 10 and 15 diameters. The bolts were anchored with a
standard nut or a combination of a standard nut and washer. All specimens had
a #2 intermediate grade spiral at 6" pitch. Only a limited range of clear
cover was investigated. All conclusions must be restricted to this range of
physical dimensions.

F
The following conclusions were made:
1. The pullout tests indicated that A7 (33 ksi yield point)
steel anchor bolts can be fully developed with a 15 dia
meter embedment length in all bolt sizes. (Steel stress
computations are based on the mean diameter stress area.)
2. Anchor bolts of A7 (33 ksi yield point) steel with dia
meters of 2-1/2" or less can be fully developed with a 10
diameter embedment length.
3. An important variable affecting the developable tensile
strength is the amount of cover over the anchor. Results
of calculations based on a limited empirical expression
indicate that the clear cover should be increased for the
2-1/2" and 3" diameter bolts over the 2-3/4" and 2-1/2"
used in these tests.
4. Considering a 0.01" gross end slip at service loads as a
limit, the following mean area steel stresses were
developed in 4650 psi concrete: (see Fig. 24)
D
in. 10 D Embedment 15 D Embedment
1 1/4 28 ksi 32 ksi
1 1/2 26 " 24 " 1 3/4 20 " 24 II
2 16 " 21 II
2 1/2 19 \I 16 " 3 18 " 15 "
It should be noted that because the development of these
anchor bolts depended primarily on end anchorage, the
longer embedment lengths often show larger end slips due
to the elastic elongation of the partially unbonded steel
bolt. The slip limit of 0.01" may not be realistic for
service conditions anticipated. Possibly any such limit
should vary with the size of the bolt. A similar table
can be prepared for any other slip criteria.
As a result of the evaluation of this test series, it is recommended:
60
••
, . ..

''-
61
1. The clear cover over the large bolts (2-1/2" and 3" diameter) should
be increased if possible. The clear cover should be at least as
great as that used with the smaller (1-3/4" and 2" D) bolts. A more
detailed recommendation for determining the cover required is given
in Chapter 3.
2. Additional specimens should be tested to investigate the effect of
clear cover, particularly with respect to the development of large
bolts. The data provided by this program is quite limited in this
respect.
3. Consideration should be given to the effect of repeated loadings on
the anchorage characteristics. Literature searches have indicated
that very little information is available in this area.
4. Further study should be given to the use of higher strength steel
bolts. The limited pilot tests indicate these may be more efficient
at service load levels than the larger bolts. It is possible that
some of the cover modifications associated with the very large dia
meter bolts could be partially avoided by providing reduced diameter,
high strength bolts.

F
62
REFERENCES
1. Abrams, D. A., "Tests of Bond Between Concrete and Steel," University of Illinois Engineering Experiment Station Bulletin No. 71, December, 1913, pp. 97-99.
2. Ferguson, P. M., Turpin, R. D., and Thompson, J. N., "Minimum Bar Spacing as a Function of Bond and Shear Strength,1I Journal of the American Concrete Institute, Vol. 50, June 1954, pp. 869-888.
3. Ferguson, P. M., Breen, J. E., and Thompson, J. N., "Comparative Bond Efficiency of Large High-Strength Deformed Bars," report to the Committee of Concrete Reinforcing Bar Producers, American Iron and Steel Institute, February 1962, pp. 66.
4. Texas Highway Department, "Standard Specifications for Road and Bridge Construction," January 2, 1962.
5. American Society for Testing Materials, Tentative Specification for "Low Carbon Steel Externally and Internally Threaded Standard Fasteners," ASTM Designation: A 307-58T, 1958 Standards, Part I, p.,749.
6. Slaughter, E. M., "Tests on Threaded Sections Show Exact Strengthening Effect of Threads," Metal Progress, Vol. 23, No.3, March 1933, pp. 18-20.
7. American Standard ASA B18.2-l960 "Square and Hexagon Bolts and Nuts," published by American Society of Mechanical Engineers, p. 17, p. 26.
8. American Standard ASA B27.2-l958 "Plain Washers," published by American Society of Mechanical Engineers, p. 7, pp. 9-10.

63
APPENDIX

64
TABLE A
SUMMARY OF DATA
fs at Slip= Slip'" Slip at ~I: Clear Cover
Specimen fc' f 0.01 0.02 fs:: 20 f == 33 fsu Failure fcr ~Diameter kYo s
ksi s~ ksi ksi in. in. ksi psi
1-1/4N10a 3.16 33.7 30 40 .005 .012 43.5 D 1560 27.9 1.9
1-1/4N10b 5.04 " 32 39 .004 .011 58.0 S 2085 29.3 " 1-1/4W10a 3.16 " 37 .002 .007 41.2 D 1480 26.5 " 1-1/4W10b 5.04 " 27 39 .006 .014 47.3 D 1700 24.0 " 1-1/4W:j.Ob-2 5.04 " 60.3 S 2170 30.6 " 1-1/4N15a 4.04 " 33 40 .005 .010 41.9 D 1520 24.0 " 1-1/4W15a 4.04 " 37 42 .002 .007 42.7 D 1540 24.5 II
1-1/2N10a 3.16 37.0 26 40 .008 .013 50.0 S 2640 47.2 1.5
1-1/2N10b 5.04 " 33 40 .005 .010 41.1 D 2170 30.6 " 1-1/2W10a 3.16 " 32 41 .004 .010 41.6 D 2200 39.2 " 1-1/2W10a-2 3.16 " 55.8 S 2950 52.8 " 1-1/2W10b 5.04 " 23 39 .008 .014 38.9 D 2060 29.0 " 1-1/2N15a 4.04 " 25 37 .007 .016 41.1 D 2170 34.5 " 1-1/2N15a-2 4.04 " 51.1 S 2700 43.2 tI
1-1/2W15a 4.04 " 33 41 .003 .010 62.2 S 3280 52.2 "
1-3/4N10a 4.66 91.0 22 34 .008 .019 54.1 S 2140 31.6 1.785
1-3/4N10b 4.74 38.0 20 32 .010 .021 62.7*-1: T 2480 36.0 " 1-3/4W10a 4.66 91.0 24 34 .008 .018 54.1 S 2140 31.5 " 1-3/4W10b 4.74 38.0 28 38 .004 .014 43.8 D 1740 25.3 " 1-3/4W10b-2 4.74 38.0 58.9ml: T 2340 34.0 " 1-3/4N15a 5.30 40.5 24 38 .008 .015 51.6 D 2050 28.2 " 1-3/4N15a-2 5.30 40.5 65.3** T 2590 35.6 " 1-3/4W15a 5.30 40.5 33 42 .006 .010 67 • 9*i~ T 2690 36.7 ,II
*T = Bolt tension; S :: Splitting; C = Crushing over anchorage; D = Discontinued after apparent yield; SL = Bolt sliding out.
**Average tensile ultimate of 3 companion specimens--63.8 ksi. It

TABLE A (con' t)
SUMMARY OF DATA
fs at Slip= Slip=
Slip at
Specimen f ' c f k Yo
S1.
0.01 0.02 fs= 20 f = 33 s ksi ksi ksi in. in.
4.66 36.7 18 32
4.74 30.6 24 34
4.74 30.6
.011 .021
.006 .018
2N10a
2N10b
2N10b-2
2W10a
2W10a-2
2W10b
2W10b-2
2N15a
2N15a-2
2W15a
2W15a-2
4.66 36.7 20 34 .010 .018
4.66 36.7
4.74 30.6 24 31 .006 .024
4.74 30.6
5.17 33.5 21 29
5.17 33.5
5.17 33.5 28 37
5.17 33.5
2-1/2N10a 4.63
2-1/2W10a 4.68
2-l/2N15a 5.06
2-1/2W15a 5.46
3N10a
3W10a
3N15a
3W15a
4.88
4.75
4.18
3.55
1-3/4SD10 4.90
1-3/4SA10 4.44
1-3/4SA10-2 4.90
1-3/4SB10 4.44
1-3/4SC10 4.44
30.7
"
"
"
45.0
"
" "
35.5
" " " "
19 34
25 30
16 30
24 32
21
19
23
26
24
31
15 23
12
16
29
12
32
21 41
.009 .027
.007 .016
.011 .019
.006 .024
.011 .024
.006 .021
.008
.012
.008 .023
.016 .046
.012 .022
.007 .012
.010 .015
65
Clear Cover
fsu Failure fcr ~c' piameter ksi psi "Ic'
42.5 D 2260 33.2
38.5 D 2045 29.7
49.0 C 2600 37.8
50.3 D 2670 39.3
48.3 C 2570 37.8
38.5 D 2045 29.8
56.8 S 3020 43.8
41.8 D 2220 43.2
56.2 C 2990 41.5
45.7 D 2430 33.6
64.0 C 3400 47.3
39.7 S 3510 51.5
45.0 C 3980 58.4
30.7 C 4470 63.0
55.9 C 4940 66.8
30.4 S-C 4200 60.1
33.3 S-C 4600 60.8
42.0 S-C 5800 89.2
36.9 S-C 5100 86.5
16.1 SL 640 9.1
36.5 D 1450 21.8
43.3. S 1720 24.6
34.0 S 1350 20.2
44.1 S 1750 26.2
1.5
" " " " " " " " " "
1.1
" " "
0.833
" " "
1.785
" " " "

~~;'~f1tjF>?1"
r ~ ... ""
50
40
In 30 ~ .. Ul Ul w a:: :n 20
10
.001 .002 .003 .004 .005 .006 .007
STRAIN (in.lin.)
FIG. AI MILD STEEL ANCHOR BOLT STRESS STRAIN DIAGRAMS
.008
0\ 0\

.... (f) ~ ..
120
100
eo
~ 60 UJ a: t(J)
40
20
.001
/
I /
.002
/ I
I
/ I
I
I
/ /
I
.003
/ /
/ /
/
/
/ I
/
/
(Q) 13/4 "
.004 .005
STRAIN (in.lin.)
YIELD STRENGTH AT 0.002 OFFSET
91 KSI
.006 .007
FIG. A2 HIGH STRENGTH ANCHOR BOLT STRESS STRAIN DIAGRAM
.008
0'> ---J
•