cepii ntm-map: a tool for assessing the economic impact … · we provide a comprehensive dataset...
TRANSCRIPT

Highlights
We provide a comprehensive dataset on non-tariff measures, dedicated to analytical work, for descriptive , trade policies or econometric analysis.
Based on UNCTAD-TRAINS Data over the 2010-2012 period and for five different types of non-tariff measures.
Gives three indicators: Frequency index, coverage ratio and prevalence score.
CEPII NTM-MAP: A Tool for Assessing the Economic
Impact of Non-Tariff Measures
No 2014-24 – December Working Paper
Julien Gourdon

CEPII Working Paper CEPII NTM-MAP
Abstract This paper documents NTM-MAP, CEPII’s database measuring the incidence of Non-Tariff Measures through different methodologies, based on UNCTAD multilateral database. Three indexes are proposed as proxies for NTMs occurrence: frequency index, coverage ratio and prevalence score. Those indices are systematically computed for several countries and products classifications and for five different categories of NTMs (SPS, TBT, PSI, Price Control and Quantitative Restrictions). 63 countries are covered, with reference year 2010, 2011 or 2012, using two different product disaggregation levels (HS-2 and HS-Section). This comprehensive dataset on non-tariff measures is intended for descriptive, trade policy or econometric analysis.
KeywordsCommerce international et mesures non tarifaires.
JELF13, F15, O19.
CEPII (Centre d’Etudes Prospectives et d’Informations Internationales) is a French institute dedicated to producing independent, policy-oriented economic research helpful to understand the international economic environment and challenges in the areas of trade policy, competitiveness, macroeconomics, international finance and growth.
CEPII Working PaperContributing to research in international economics
© CEPII, PARIS, 2014
All rights reserved. Opinions expressed in this publication are those of the author(s) alone.
Editorial Director: Sébastien Jean
Production: Laure Boivin
No ISSN: 1293-2574
CEPII113, rue de Grenelle75007 Paris+33 1 53 68 55 00
www.cepii.frPress contact: [email protected]
Working Paper

CEPII Working Paper CEPII NTM-MAP
3
CEPII NTM-MAP: A Tool for Assessing the Economic Impact of Non-Tariff Measures
Julien Gourdon*
1. Introduction
While a number of studies have attempted to capture and quantify the impact of some of the
hidden costs of trading1 these attempts are greatly constrained by the available data. The
existing data on trade costs is largely related to tariffs, and only a few databases provide
information on non-tariff measures and behind the border trade costs (e.g. the Doing Business
database, the Trade Facilitation Database, the Logistic Performance Index, and the
UNCTAD/TRAINS NTM database). Moreover, most of the existing data is too aggregated to
be utilized for detailed policy analysis and often provides information only on the effects of
trade impediments rather than on the impediment themselves. In practice, the analysis must
compromise in terms of policy coverage focusing on the aggregate effects of the few
countries or sectors where the data is available.
A particularly relevant issue for both researchers and policymakers is related to the impact of
non-tariff measures (NTMs) on trade. There are several reasons to focus attention on NTMs
as one of the main sources of trade costs. One reason is that their impact on trade is still
poorly understood and not easily measured. NTMs encompass a wide set of policies that can
have very diverse effect son trade. For example, requirements on marking, labeling and
packaging, although adding to costs of production, generally are not discriminatory and have
low compliance costs, and thus have relatively unimportant trade effects. On the other hand,
* CEPII
1 Djankov S., C. Freund and C. S. Pham, (2010) "Trading on Time," The Review of Economics and Statistics, 92(1),
166-173. Hoekman, B, and A. Nicita (2011) “Trade Policy, Trade Costs and Developing Country Trade” World Development, 39(12), 2069-2079. Maskus, K., Otsuki, T. and J.S. Wilson (2005), The costs of compliance with product standards for firms in developing countries: an econometric study, working paper 3590, World Bank, Washington DC.
CEPII Working Paper CEPII NTM-MAP
4
quotas, voluntary export restraints and non-automatic import authorizations often have much
more significant effects.
The second reason to examine NTMs is their proliferation. While NTMs have been around for
years, the use of NTMs to regulate trade has been rising since the 1990s both in terms of
countries adopting these measures as well as in their variety. Third reason is that NTMs can
be discriminatory. Even when NTMs are indiscriminately applied to all imported goods, many
NTMs discriminate among a country's trading partners because costs of compliance are often
different across exporters. Compliance costs are generally higher in low income countries, as
NTM related production processes and export services are often more expensive, or need to
be outsourced abroad. Another reason to investigate NTMs is that they could be protectionist.
Governments are using increasingly sophisticated methods about how they protect domestic
industries. While trade barriers have historically taken more obvious forms, such as tariffs or
quotas, trade barriers are now taking different forms which are harder to identify and quantify.
A mounting concern is that liberalization in tariffs may be countered by the increasing
number of restrictive NTMs.
Broadly defined, NTMs include all policy-related trade costs incurred from production to
final consumer, with the exclusion of tariffs. For practical purposes, NTMs are categorized
depending on their scope and/or design and are broadly distinguished in technical measures
(Sanitary and Phytosanitary Standards, SPS; and Technical Barriers to trade, TBT) and non-
technical measures.
The paucity of data on trade policy measures has been the main problem behind the study of
the effect of NTMs on trade. Seemingly simple questions such as “what are the policy
measures countries impose” or “what type of measures are faced by particular products”
cannot be answered for most goods and countries because of the lack of detailed information.
The fact that NTMs are increasingly used to regulate international trade makes the need to
update data even more compelling.

CEPII Working Paper CEPII NTM-MAP
5
The reason behind the scarcity of databases on NTMs is largely related to the difficulty in
collecting the data and in assembling a consistent cross-country database. Unlike tariffs, NTM
data are not merely numbers; the relevant information is often hidden in legal and regulatory
documents. Moreover, these documents are generally not centralized but often reside in
different regulatory agencies. All these issues make the collection of NTM data a very
resource-intensive task. The first attempt to collect and categorize NTMs was conducted by
UNCTAD in the late 1990s, and the data is available in the UNCTAD Trade Analysis and
Information System database (TRAINS – accessible via WITS). However, the TRAINS
NTMs database has not been consistently updated in the last 10 years. To fill this gap and in
response to the increased interest of both researchers and policymakers, UNCTAD and the
World Bank in collaboration with the International Trade Center and the African
Development Bank, have initiated a new effort on NTMs data with the objectives of
improving the coverage and classification of NTMs and to update, consolidate and freely
disseminate NTM data. This joint effort has produced an updated NTM classification as well
as detailed new data for about 40 countries plus the EU, with data from more countries in the
pipeline.
Based on this raw data, NTM-MAP measures the incidence of non-tariff measures through
different methodologies, by country, sector and type of NTMs. Given the limited coverage of
the new data, the database favors simple indicators (an inventory approach based on
frequency, coverage ratio and prevalence score) rather than trying to produce more complex
measures such as price gaps or ad-valorem equivalents.
The rest of this paper is organized as follows. Next section provides some details on the
definition and classification of NTM data. The bulk of the descriptive analysis is in Section 3.
There we provide descriptive statistics on the incidence of NTMs in terms of frequency
(number of product lines exposed to NTMs) and coverage (share of total imports exposed to
NTMs). In doing so, we analyze differences both in terms of countries and product groups.
The last section summarizes the main findings and offers some policy conclusions.
CEPII Working Paper CEPII NTM-MAP
6
2. Definition, classification and data collection of Non-Tariff Measures
To better identify NTMs, and distinguish among the various forms of NTMs, a detailed
classification is of critical importance. To facilitate data collection and analysis, the multitude
of NTMs are often aggregated in various groups: hard measures (e.g. price and quantity
control measures), threat measures (e.g. antidumping and safeguards), sanitary and
phytosanitary standard (SPS), technical barriers to trade (TBT), and other categories such as
“export measures”, “trade-related investment measures”, “distribution restrictions”,
“restrictions on post-sales services”, “subsidies”, “measures related to intellectual property
rights” and “rules of origin”. Each of these groups comprises various and often very different
forms of NTMs.
The classification proposed by UNCTAD and agreed by the Group of Eminent Persons on
NTBs2 takes this into account and develops a tree/branch structure where measures are
categorized into chapters depending on their scope and/or design. Each chapter is then further
differentiated into several sub-groups to allow a finer classification of the regulations
affecting trade. In practice, the NTMs classification encompasses 16 chapters (A to P) and
each individual chapter is divided into groupings with depth up to three levels (1, 2, and 3
digits). Although a few chapters reach the 3-digits level of disaggregation, most of them stops
at 2-digits. The complete classification can be found in UNCTAD (2010).
The classification organizes NTMs into various chapters, each comprising measures with
similar purposes. All chapters reflect the requirements of the importing country on its imports,
with the exception of measures imposed on exports (chapter P). The effect on trade of each
group of measures varies considerably. While some groups of NTMs have clear restrictive
impacts, others produce uncertain effects. For example, the subset of measures under
categories (A) through (C) has a relatively clear relationship with the market imperfections
they try to address. These measures are largely regulatory policies in response to a variety of 2 UNCTAD (2010). Non-tariff Measures: Evidence from Selected Developing Countries and Future Research Agenda.
Developing Countries in International Trade Studies. United Nations Publication ISSN: 1817-1214. New York and Geneva.

CEPII Working Paper CEPII NTM-MAP
7
concerns raised by society in many areas such as the environment, animal welfare, food safety
and consumers’ rights.
These policies are not necessarily restrictive because these types of instruments can also
enhance consumer demand for goods by increasing quality attributes (technical requirements)
or by reducing informational asymmetries (standards). However, many of these policies
involve considerations of institutional capacity and likely have distortionary impacts on trade.
Sometime they are imposed to address the possible capacity failures of trade partners; and
often they require an extensive domestic institutional capacity to implement these policies.
Although different types of requirements affect different inputs and stages of production,
most of these policies also affect overall trade costs (e.g. certification, inspections, etc). In
addition, compliance costs often vary depending on infrastructure and institutional capacity of
the exporting country, and thus ultimately these costs do affect trade flows.
Figure 1 – Non tariff measure classification (1st tier - chapters)
Source: UNCTAD 2012
3.
3 Classification of Non-tariff Measures, UNCTAD (2012)

CEPII Working Paper CEPII NTM-MAP
8
Non-technical measures vary considerably by intent and scope. However, their effect on trade
is generally more understood and easier to quantify. The effects of price control measures are
relatively simple to measure, especially anti-dumping and safeguards. Quantity control
instruments have been extensively examined in the analysis of quotas, tariff rate quotas and
their administration. Para-tariff measures can be analyzed as conventional tax instruments and
their incidence is straightforward to perceive. Finance, anti-competitive, and trade related
investment measures have indirect effects on trade, and their actual impact is more difficult to
assess. Box 1 provides some more details on the measures contained in each chapter.
Box 1 – Brief description of NTMs chapters Chapter A, on sanitary and phytosanitary measures, refers to measures affecting areas such as restriction for substances, restrictions for non eligible countries’ hygienic requirements, or other measures for preventing dissemination of diseases, and others. Chapter A also includes all conformity assessment measures related to food safety, such as certification, testing and inspection, and quarantine. Chapter B, on technical measures, refers to measures such as labelling, marking, packaging, restrictions to avoid contamination or other measures protecting the environment, standards on technical specifications, and quality requirements. Chapter C classifies the measures related to customs formalities. Chapter D groups the contingent measures, i.e. those measures implemented to counteract particular adverse effects of imports in the market of the importing country, including measures aimed at unfair foreign trade practices. They include antidumping, countervailing, and safeguard measures. Chapter E, licensing, quotas and other quantity control measures, groups the measures that have the intention to limit the quantity traded, such as quotas. It also covers licenses and import prohibitions that are not SPS or TBT related. Chapter F lists price-control measures implemented to control or affect the prices of imported goods. Among the examples are those to support the domestic price of certain products when the import prices of these goods are lower. This category also includes measures other than tariffs measures that increase the cost of imports in a similar manner (para-tariff measures). Chapter G, on finance measures, refers to measures restricting the payments of imports, for example

CEPII Working Paper CEPII NTM-MAP
9
when the access and cost of foreign exchange is regulated. It also includes measures imposing restrictions on the terms of payment. Chapter H, on anticompetitive measures, refers mainly to monopolistic measures, such as state trading, sole importing agencies, or compulsory national insurance or transport. Chapter I, on trade related investment measures, groups the measures that restrict investment by requesting local content and thus restricting imports, or requesting that investment should be related to export in order to balance imports. Chapter J, on distribution restrictions, refers to restrictive measures related to the internal distribution of imported products. These measures would hinder trade from taking place because there would be difficulty in distributing the products once entering the country. Chapter K, on the restriction on post sales services, refers to difficulties in allowing technical staff to enter the importing country to install or repair technological goods imported. Chapter L, contains measures that relate to the subsidies that affect trade. Chapter M, on government procurement restriction measures, refers to the restrictions bidders may find when trying to sell their products to a foreign government. Chapter N, on intellectual property measures, refers to the problems arising from intellectual property rights. Chapter O, on rules of origin, groups the measures that restrict the origin of products so that they could benefit from reduced tariffs according to certain rules often set in multiple simultaneous agreements with different countries. Chapter P, on export measures, groups the measures a country applies to its exports. It includes export taxes, export quotas or export prohibitions, etc.
The classification discussed above greatly simplifies the data collection. However, being able
to classify laws and regulations into the appropriate NTM category is only part of the
challenge in assembling a database of NTMs. Besides a proper classification, one of the
problems related to data collection is that, in most cases, there is not one sole national
repository agency of NTMs data as laws and regulations affecting trade are often promulgated
by different government agencies and regulatory bodies. This makes the assembly of an
exhaustive NTMs database quite a challenging task. In practice, the data has to be carefully

CEPII Working Paper CEPII NTM-MAP
10
scrutinized for possible duplications, omissions, or any other problems in order to minimize
inaccuracies.
CEPII’s NTM-MAP provides indicators measuring the incidence of Non-Tariff Measures by
using different methodologies and those newly collected UNCTAD multilateral database
based comprising 40 developing countries plus the European Union and Japan. The data in
NTM-MAP contains three indexes as proxies for NTMs occurrence; frequency index,
coverage ratio and prevalence score. Those indices are systematically computed for several
countries and products classifications and for five different categories of NTM, from chapters
A to E (SPS, TBT, PSI, Price Control and Quantitative Restrictions).4 The data follows the
HS classification at the 6 digit level covering more than 5,000 different products. The index
is then provided for 63 countries for one year over the period 2010-2012 at the country level
and two different product disaggregation levels (HS-2 and HS-Section). This is a
comprehensive dataset on non-tariff measures, dedicated to analytical work, for descriptive,
trade policies or econometric analysis.
3. Incidence of Non-Tariff Measures: The inventory approach
There are various approaches for identifying the importance of trade measures and assessing
their effects on international trade. Methodologies include simple inventory measures,
computation of price gaps and the estimation of ad-valorem equivalents. As for the simple
inventory approach, CEPII’s NTM-MAP provides three base indices: the frequency index,
the coverage ratio and the prevalence score. The frequency index simply captures the
percentage of products that are subject to one or more NTMs. The coverage ratio captures the
percentage of imports that is subject to one or more NTMs. The prevalence score captures the
average number of NTMs which apply to a product.
4 Because of objective difficulties in the collection of data on some measures, data covering measures from chapters F to P is partial

CEPII Working Paper CEPII NTM-MAP
11
Box 2 – Description of variables:
isor is the country of interest (i.e. the importer country);
line is the number of hs-6 digit products under the selected aggregation
hs2 or hs-section indicates the sector of interest (respectively HS-2 and HS-Section);
Num is the prevalence score of different NTMs and of 5 sub-categories of NTMs
Pres is the number of products with at least one NTM / one of 5 sub-categories of NTMs
Freq is the frequency index of different NTMs and of 5 sub-categories of NTMs
Cov is the coverage ratio of different NTMs and of 5 sub-categories of NTMs
The frequency index accounts only for the presence or absence of an NTM, and summarizes
the percentage of products i to which one or more NTMs are applied. In more formal terms,
the frequency index of NTMs imposed by country j is calculated as:
100⋅
=
∑∑
i
iij M
MDF
where D is a dummy variable reflecting the presence of one or more NTMs and M indicates
whether there are imports of good i (also a dummy variable). Note that frequency indices do
not reflect the relative value of the affected products and thus cannot give any indication of
the importance of the NTMs on overall imports.
A measure of the importance of NTMs on overall imports is given by the coverage ratio
which measures the percentage of trade subject to NTMs for the importing country j. In
formal terms the coverage ratio is given by:
100⋅
=
∑∑
i
iij V
VDC

CEPII Working Paper CEPII NTM-MAP
12
where D is defined as before, and V is the value of imports in product i. One drawback of the
coverage ratio, or any other weighed average, arises from the likely endogeneity of the
weights (the fact that imports are dependent on NTMs). This problem is best corrected by
using weights fixed at trade levels that would arise in a NTM (and tariff) free world.
Otherwise, the coverage ratio would be systematically underestimated. While one cannot get
to that benchmark, it is possible to soften the endogeneity problem (and testing for the
robustness of the results) by using trade values of past periods.
Frequency and coverage ratios illustrated above do not take into account whether more than
one type of NTM is applied to the same product. In practice, a large number of products have
more than one regulatory measure applied to them. For example, a product could be subject to
a sanitary standard as well as a technical measure on quality, and finally to some licensing.
Arguably, the greater the number of NTMs applied to the same product, the more regulated
the commerce of that product is, especially if measures are from different Chapters5. To
measure the prevalence of NTMs, the score P below gives the average number of NTMs N,
affecting an imported product M.
=
∑∑
i
iij M
MNP
We start the descriptive analysis by aggregating all the data collected and examining the
incidence of various types of NTMs. Figures 2 to 4 illustrate the incidence of NTMs for the
40 countries collected so far (the EU being considered as one single country). It summarizes
the data in terms of frequency index, the coverage ratio and the pervasiveness score for each
country for all NTMs as a whole. In NTM-MAP, those indicators are calculated at three
different levels: country level, country HS-Section level and country-HS-2 digit level.
5 The rationale is that measures within the same Chapter are similar in nature and thus often impose relatively less burden than
measures from different Chapters.

CEPII Working Paper CEPII NTM-MAP
13
From Figure 2, we observe that the use of NTMs varies considerably not only across regions
but more so among countries. On average, countries apply some form of NTMs for slightly
less than half of the about 5000 products included in the HS 6-digit classification. This figure
greatly varies by country.
For example, within Africa, Tanzania and Senegal use NTMs substantially less than Egypt,
Kenya or Uganda. In Latin America, Argentina use of NTMs is double than that of Chile of
Paraguay. In Asia, Bangladesh, Syria and the Philippines utilize NTMs much more than
Cambodia or Indonesia. Although this large variance might be due to some extent to different
primary data collection methods6, this is likely to explain only part of the differences, as a
large variance is also found for Latin American countries whose data is collected by the same
agency: the Associación Latinoamericana de Integración (ALADI). Such large differences
suggest that the use of NTMs greatly varies across countries, even within the same geographic
areas.
Figure 2 – Frequency index by country (percentage)
Source: NTM-MAP: CEPII’calculations using UNCTAD multilateral NTM database.
6 Data have been collected by different agencies across regions and they have sometimes different ways of collecting
such information : some start with customs registry which list import measures while others start with regulations from ministry of health, environment etc…
0%10%20%30%40%50%60%70%80%90%
100%
AR
GB
OL
BR
AC
HL
CO
LC
RI
ECU
GTM
MEX PE
RPR
YV
ENU
RY
BD
IB
FA CIV
KEN
MD
GM
US
SEN
TZA
UG
AZA
FB
GD
IND
LKA
NPL
PAK
CH
NID
NK
HM
LAO
PHL
EGY
LBN
MA
RSY
RTU
N EU JPN
Latin America Africa Asia MENA Developed

CEPII Working Paper CEPII NTM-MAP
14
Similar conclusions on the heterogeneity of NTMs incidence can be reached by looking at
coverage ratios in Figure 3 (the percentage of import subject to NTMs) as these are found to
be highly correlated with frequency indices. Although correlated, coverage ratios are often
higher than frequency indices for most of the countries. The difference is particularly striking
for Tanzania (from 5 to 35 percent) and Lebanon (from 15 to 40 percent). A relatively higher
coverage ratio can be explained by two factors. First, import composition. Countries,
especially low income countries, often import larger volumes of products where NTMs are
more extensively used (agriculture). Second, a high coverage ratio may reflect a larger use of
NTMs policies on most traded products (e.g. for consumer protection). This is often the case
in developed countries.
This shows that the endogeneity issue described above (NTMs may restrict trade and this will
bias downward the coverage ratio) is not at stake in those figures. This endogeneity issue was
more important in the past when measures imposing quantity restrictions were still important.
Figure 3 – Coverage ratios by country (percentage)
Source: NTM-MAP: CEPII’calculations using UNCTAD multilateral NTM database.
The incidence of the use of NTMs depends on both the percentage of products (or imports)
affected by NTMs, and the number of NTMs affecting each product. Frequency and coverage
ratios illustrated above do not take into account whether more than one type of NTM is
applied to the same product. In practice, a large number of products have more than one
regulatory measure applied to them. First it is often the case that countries apply a wide
0%10%20%30%40%50%60%70%80%90%
100%
AR
GB
OL
BR
AC
HL
CO
LC
RI
ECU
GTM
MEX PE
RPR
YV
ENU
RY
BD
IB
FA CIV
KEN
MD
GM
US
SEN
TZA
UG
AZA
FB
GD
IND
LKA
NPL
PAK
CH
NID
NK
HM
LAO
PHL
EGY
LBN
MA
RSY
RTU
N EU JPN
Latin America Africa Asia MENA Developed

CEPII Working Paper CEPII NTM-MAP
15
number of NTMs within each chapter. For example, one specific good may be subject to
geographical restriction, labeling, fumigation and some conformity assessments which all fall
under the SPS chapter (A). Although some of these measures may impose few additional
costs, some others are quite distinct. A large number of measures within a chapter could
imply an even stricter regulatory framework. Thus, it is important to provide some
information on the actual number of NTMs applied to single products. This information is
given by simply calculating the average number of NTMs applied to each HS 6-digit product.
Figure 4 reports for each country the average number of NTMs applied to the products.
Figure 4 – Prevalence score by country (average number of NTM by product)
Source: NTM-MAP: CEPII’calculations using UNCTAD multilateral NTM database
Also, a product could be subject to a sanitary standard as well as a technical measure on
quality, and finally to some licensing. Arguably, the greater the number of NTMs applied to
the same product, the more regulated the commerce of that product is. especially if measures
are from different Chapters. The rationale is that measures within the same Chapter are
similar in nature and thus often impose relatively less burden than measures from different
Chapters. To better illustrate the pervasiveness of NTMs, Figure 5 reports the number of
products affected by 1, 2, 34 or 5 types of NTMs, where types are differentiated by Chapter.
Although a large share of products affected by NTMs are subject to NTMs from only one
Chapter, a substantial number of products are affected by multiple types of NTMs. For
example, among about 3450 products where Argentina imposes NTMs, about 838 are subject
0.0
1.0
2.0
3.0
4.0
5.0
6.0
7.0
AR
GB
OL
BR
AC
HL
CO
LC
RI
ECU
GTM
MEX PE
RPR
YV
ENU
RY
BD
IB
FA CIV
KEN
MD
GM
US
SEN
TZA
UG
AZA
FB
GD
IND
LKA
NPL
PAK
CH
NID
NK
HM
LAO
PHL
EGY
LBN
MA
RSY
RTU
N EU JPN
Latin America Africa Asia MENA Developed

CEPII Working Paper CEPII NTM-MAP
16
to NTMs from only one Chapter, about 1986 are affected by NTMs from two different
Chapters, and about 250 by NTMs from 3 or more Chapters. Although the EU frequency
index and coverage ratio are higher to that of Argentina, EU imports can be considered
relatively less regulated, as most of Argentina’s imports (50 percent) are affected by NTMs
from two or more Chapters while in EU the majority of imports (55 percent) are affected by
NTMs from one chapter.
Figure 5 – Number of NTMs from different Chapters affecting HS 6 digit products
Source: NTM-MAP: CEPII’calculations using UNCTAD multilateral NTM database.
0% 10% 20% 30% 40% 50% 60% 70% 80% 90%
100%
No NTMs 1 type of NTMs 2 types of NTMs 3 types of NTMs 4 types of NTMs 5 and more
0% 10% 20% 30% 40% 50% 60% 70% 80% 90%
100%
CEPII Working Paper CEPII NTM-MAP
17
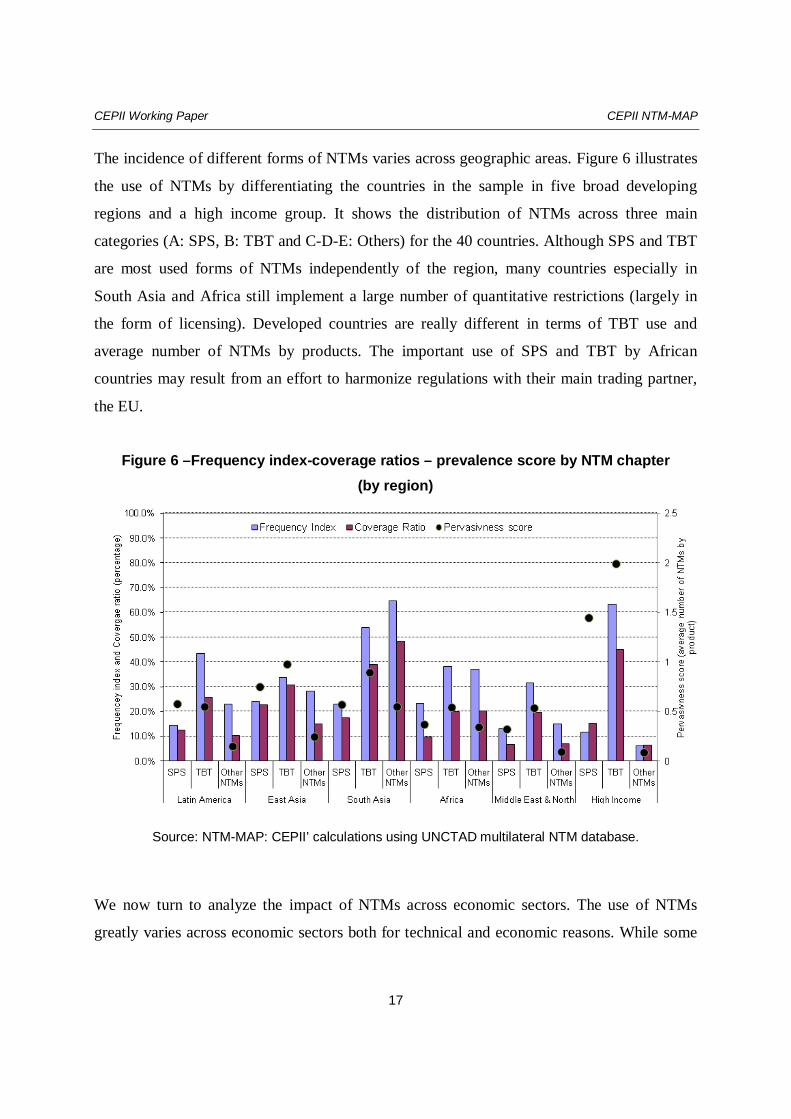
The incidence of different forms of NTMs varies across geographic areas. Figure 6 illustrates
the use of NTMs by differentiating the countries in the sample in five broad developing
regions and a high income group. It shows the distribution of NTMs across three main
categories (A: SPS, B: TBT and C-D-E: Others) for the 40 countries. Although SPS and TBT
are most used forms of NTMs independently of the region, many countries especially in
South Asia and Africa still implement a large number of quantitative restrictions (largely in
the form of licensing). Developed countries are really different in terms of TBT use and
average number of NTMs by products. The important use of SPS and TBT by African
countries may result from an effort to harmonize regulations with their main trading partner,
the EU.
Figure 6 –Frequency index-coverage ratios – prevalence score by NTM chapter
(by region)
Source: NTM-MAP: CEPII’ calculations using UNCTAD multilateral NTM database.
We now turn to analyze the impact of NTMs across economic sectors. The use of NTMs
greatly varies across economic sectors both for technical and economic reasons. While some

CEPII Working Paper CEPII NTM-MAP
18
products, such as agriculture, electric machinery, weapons, are highly regulated because of
consumers and environmental protection and technical standards, some other goods are by
their nature less subject to laws and regulation. Table 1 reports frequencies indices of 5 broad
categories of NTMs for 20 economic sectors.
Table 1 – Frequency indices across economic sectors (HS-Sections) across all countries
A: SPS
B: TBT
C: Pre-Shipment
D: Contingent
E: Quantity control
Live animals 38.5 30.2 6.2 1.4 6.8 Vegetable products 39.5 32.1 6.6 1.0 5.1 Fats and Oil 61.9 51.8 10.6 1.7 5.4 Processed food 66.1 57.8 12.3 1.6 8.8 Minerals products 4.4 27.8 3.5 1.3 2.7 Chemical products 8.9 46.3 5.8 1.5 3.0 Rubber and Plastics 4.6 50.6 6.5 1.4 2.7 Raw hide and skins 15.9 18.7 3.7 0.7 12.2 Wood 15.1 16.8 4.0 0.6 0.7 Paper 3.5 28.0 6.1 1.4 3.2 Textile 2.4 47.9 13.7 1.0 15.1 Footwear 1.0 45.1 7.7 1.2 3.0 Stone and Cement 3.3 29.7 5.5 1.1 1.5 Base Metals 3.2 35.9 11.3 1.5 8.9 Machinery & Electrical Equipment
4.8 37.1 6.5 1.2 4.9
Motor Vehicles 1.4 43.2 6.4 1.7 8.8 Optical and Medicals instruments
1.1 36.1 9.9 1.2 2.6
Miscellaneous goods 3.2 32.1 5.8 2.2 2.0
Source: NTM-MAP: CEPII’calculations using UNCTAD multilateral NTM database
The use of SPS measures is largely limited to agricultural sectors and products from animal
origin, as their control is essential for ensuring the health and well being of consumers and the
protection of the environment. As a result, more than 60 percent of food related products are
found to be affected by at least one form of SPS. On the contrary, TBTs can suit a much
wider set of products and indeed these are found to be more uniformly applied across
economic sectors with peaks in textiles, footwear, processed food, and chemicals. Measures

CEPII Working Paper CEPII NTM-MAP
19
involving pre-shipment requirement are widely distributed across economic sectors but
concern a more limited number of products. Pre-shipment inspections are found to be more
relevant for agricultural products, wooden products, textiles and footwear. Contingent
measures are trade defensive policies that by their nature are applied only to very specific
products and thus result in low frequency indices. Like pre-shipment requirements, price
control measures are more concentrated in agricultural products, textiles and footwear.
Finally, quantity control measures are applied more or less uniformly across economic sectors
with peaks on agricultural goods, animal products, motor vehicles, and chemical products.
These are sectors where particularly sensitive products are often regulated by non-automatic
licenses, quotas, and sometimes outright prohibitions.
4. Conclusions
CEPII’s NTM-MAP database, presented in this paper, makes use of data newly collected by
UNCTAD and the World Bank to investigate the use of NTMs in about 63 countries. The
incidence of various types of NTMs is analysed across countries and economic sectors, based
on simple inventory methods: frequency indices, coverage ratios and prevalence score.
Although our results have to be taken as mainly descriptive, preliminary, and not to be
generalized given the limited number of countries covered by the data, they reveal some
important issues. The results find that the incidence of NTMs varies considerably across
countries, across economic sectors and across types of NTMs. Across countries, overall
inventory measures range from less than 10 percent to more than 90 percent of products or
trade covered by NTMs.
Regarding the incidence of technical measures (SPSs and TBTs), these are found to be widely
used. TBT are found to affect a large share (about 39 percent for the frequency index, 48
percent with the coverage ratio) of international trade. SPS are also frequently used, but they
are exclusively related to agriculture and food products. Given the more limited scope for
SPS, they affect only about 15 percent of trade but more than 60 percent of agricultural

CEPII Working Paper CEPII NTM-MAP
20
products. The large incidence of SPS and TBT raises concerns for developing countries’
exports. Although these measures are generally not protectionist in intent, they often result in
diverting trade from developing countries where production processes and certification bodies
are inadequate, or where the cost of compliance to these measures is higher. In practice, SPS
and TBT may erode the competitive advantage that low income developing countries have in
terms of labor costs and preferential access.
The use of non-technical measures varies greatly across countries and economic sectors.
Among these measures the use of quantity controls has increased but they are now largely
limited to non-automatic licenses while the use of quotas has declined since most of them
were made illegal by WTO rules. As a whole, quantity control measures affect about 6
percent of products and 12 percent of trade. Pre-shipment inspection requirements affect
about 13 percent of trade. These are implemented especially in low income countries to help
custom administrations in the correct evaluation of imports and their proper taxation.
CEPII Working Paper CEPII NTM-MAP
21
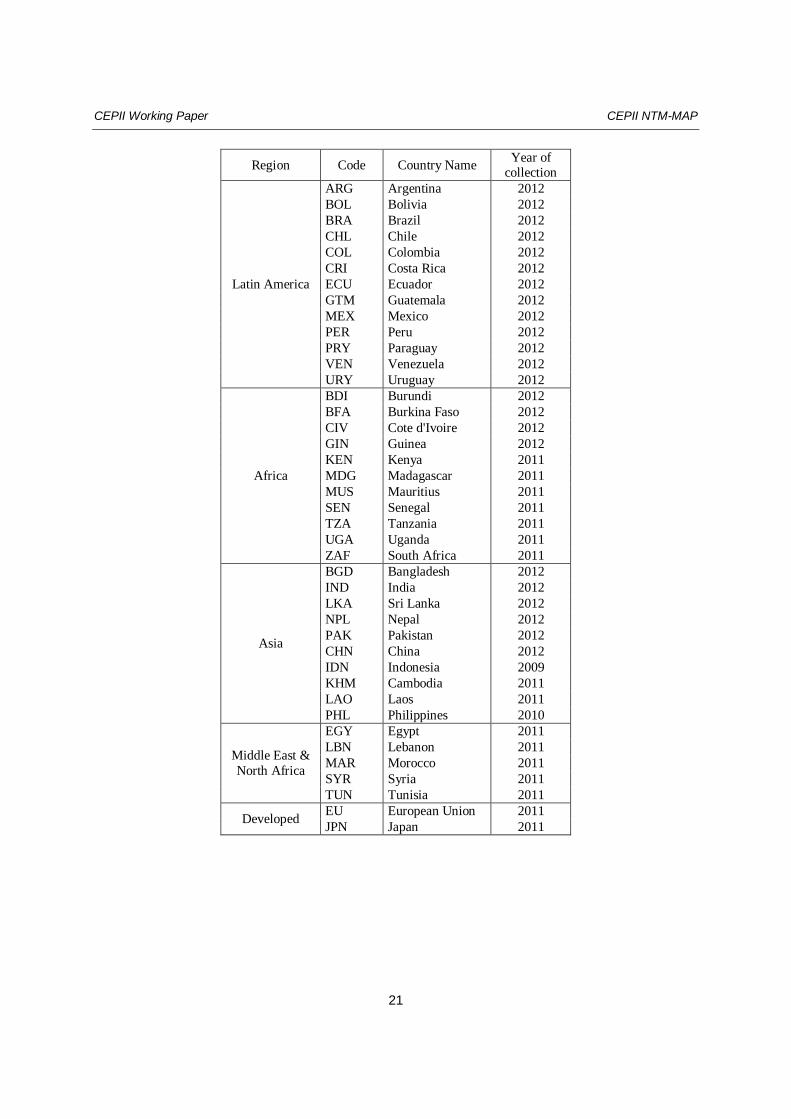
Region Code Country Name Year of collection
Latin America
ARG Argentina 2012 BOL Bolivia 2012 BRA Brazil 2012 CHL Chile 2012 COL Colombia 2012 CRI Costa Rica 2012 ECU Ecuador 2012 GTM Guatemala 2012 MEX Mexico 2012 PER Peru 2012 PRY Paraguay 2012 VEN Venezuela 2012 URY Uruguay 2012
Africa
BDI Burundi 2012 BFA Burkina Faso 2012 CIV Cote d'Ivoire 2012 GIN Guinea 2012 KEN Kenya 2011 MDG Madagascar 2011 MUS Mauritius 2011 SEN Senegal 2011 TZA Tanzania 2011 UGA Uganda 2011 ZAF South Africa 2011
Asia
BGD Bangladesh 2012 IND India 2012 LKA Sri Lanka 2012 NPL Nepal 2012 PAK Pakistan 2012 CHN China 2012 IDN Indonesia 2009 KHM Cambodia 2011 LAO Laos 2011 PHL Philippines 2010
Middle East & North Africa
EGY Egypt 2011 LBN Lebanon 2011 MAR Morocco 2011 SYR Syria 2011 TUN Tunisia 2011
Developed EU European Union 2011 JPN Japan 2011