cfd flare modeling update - · pdf filecfd flare modeling update ... flare design criteria ....
TRANSCRIPT

CFD Flare Modeling Update
SETPMTC Meeting by
Daniel Chen, Helen Lou, Kuyen Li D. F. Smith Chemical Engineering Dept.
Xianchang Li, Mechanical Engineering Dept. Christopher Martin, Chemistry & Biochemistry Dept.
Lamar University, Beaumont, TX
Houston, TX, August 23, 2012

Contents I. Introduction/Needs II. Methodology III. AQRP Project 11-022 IV. SEP Project 2009-009

Reasons for TCEQ to focus on Industrial Flares
– One potential under-reported or non-reported source is the flare operations – Flare emissions: 60% of the HRVOCs (2007 HRVOC special inventory). – Flare emissions depend heavily on destruction & removal efficiency (DRE)
• Recent studies/gas imaging IR camera suggest that flares may not be as efficient as claimed (Environ, 2008;)
• DRE may drop below 98% even when the flare operation is in compliance with 40 CFR § 60.18 (Allen, TCEQ 2010 Flare Study).
• Complex issues such as crosswind, high/low jet velocity, high air/steam assist, vent gas composition, etc.
– Flare emissions also affected by combustion efficiency (CE) or the issue of incomplete combustion products
• Current air emission inventory from flaring is simply a mass throughput with 98% (TCEQ 2000)
– As a result, TCEQ is conducting an evaluation on flare operations that may serve as a basis for a future SIP revision (http://www11.tceq.state.tx.us/oce/eer/index.cfm)
Emissions of HRVOCs (June '09 - May '10)
3.06%2.84%
16.84%
77.25%
0.00E+00
5.00E+04
1.00E+05
1.50E+05
2.00E+05
2.50E+05
3.00E+05
3.50E+05
4.00E+05
Ethylene (gaseous) Propylene (Propene) Butenes, All Isomers 1,3-BUTADIENE
HRVOCs Emissions (lbs)
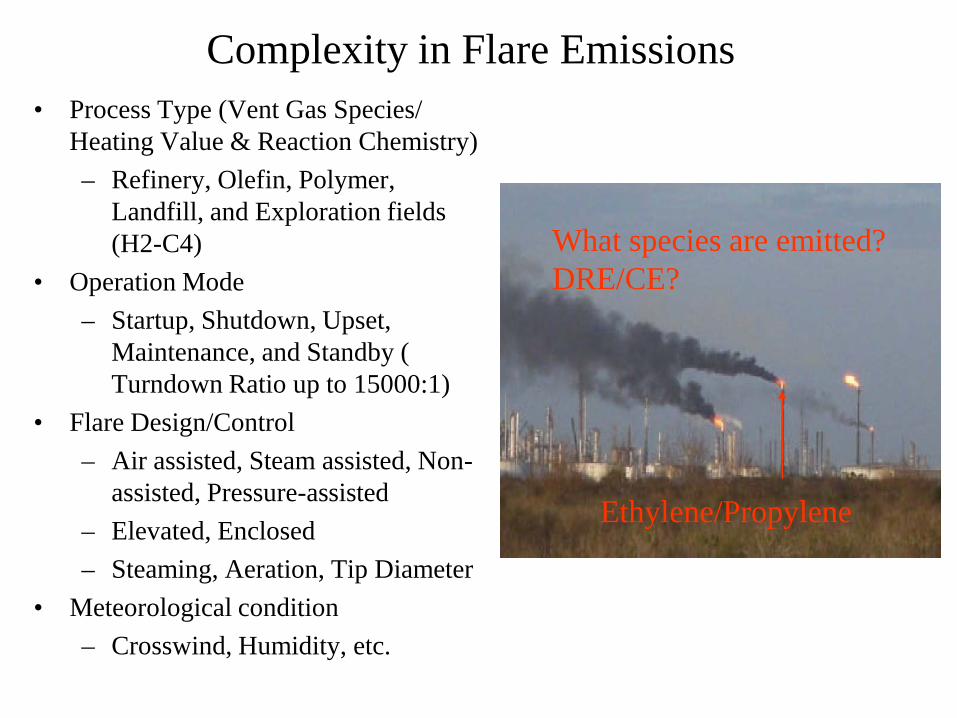
• Process Type (Vent Gas Species/ Heating Value & Reaction Chemistry) – Refinery, Olefin, Polymer,
Landfill, and Exploration fields (H2-C4)
• Operation Mode – Startup, Shutdown, Upset,
Maintenance, and Standby ( Turndown Ratio up to 15000:1)
• Flare Design/Control – Air assisted, Steam assisted, Non-
assisted, Pressure-assisted – Elevated, Enclosed – Steaming, Aeration, Tip Diameter
• Meteorological condition – Crosswind, Humidity, etc.
Complexity in Flare Emissions
What species are emitted? DRE/CE?
Ethylene/Propylene
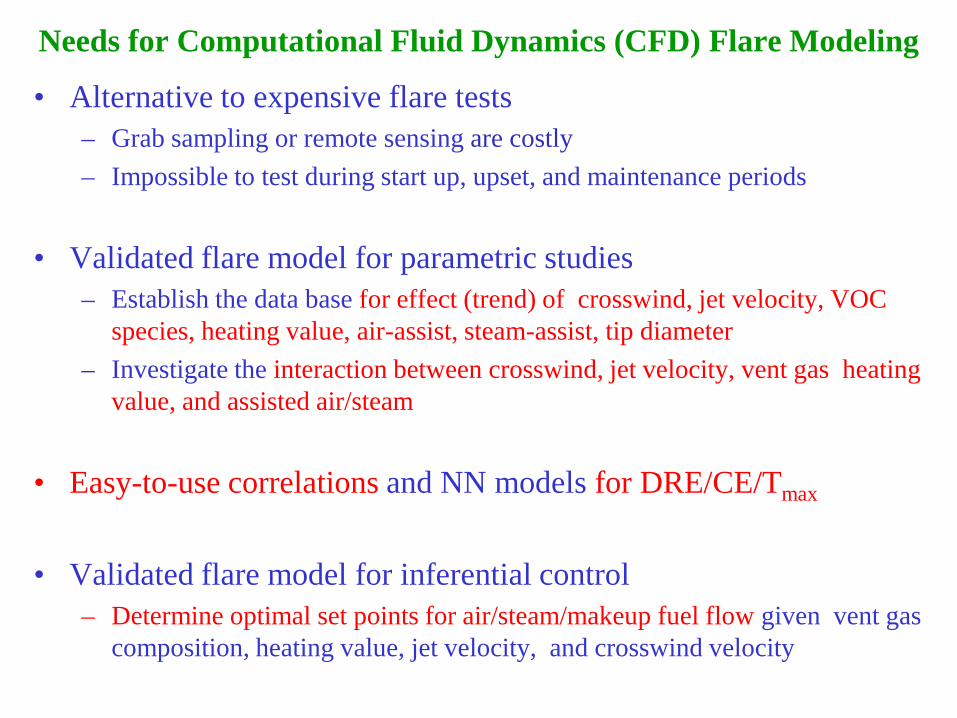
Needs for Computational Fluid Dynamics (CFD) Flare Modeling
• Alternative to expensive flare tests – Grab sampling or remote sensing are costly – Impossible to test during start up, upset, and maintenance periods
• Validated flare model for parametric studies – Establish the data base for effect (trend) of crosswind, jet velocity, VOC
species, heating value, air-assist, steam-assist, tip diameter – Investigate the interaction between crosswind, jet velocity, vent gas heating
value, and assisted air/steam
• Easy-to-use correlations and NN models for DRE/CE/Tmax
• Validated flare model for inferential control
– Determine optimal set points for air/steam/makeup fuel flow given vent gas composition, heating value, jet velocity, and crosswind velocity
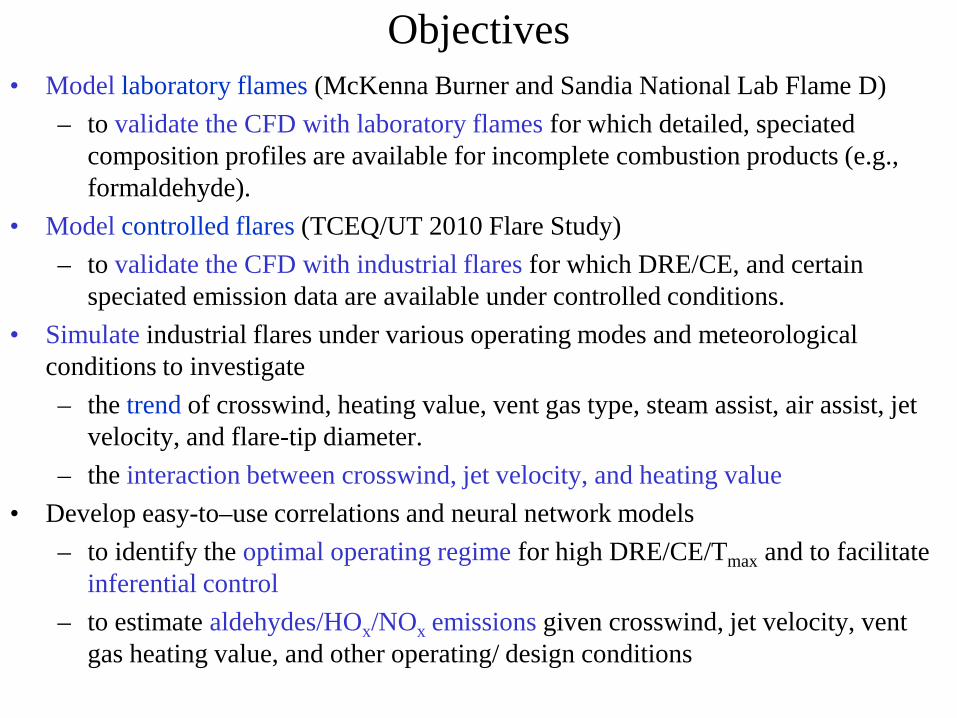
Objectives • Model laboratory flames (McKenna Burner and Sandia National Lab Flame D)
– to validate the CFD with laboratory flames for which detailed, speciated composition profiles are available for incomplete combustion products (e.g., formaldehyde).
• Model controlled flares (TCEQ/UT 2010 Flare Study) – to validate the CFD with industrial flares for which DRE/CE, and certain
speciated emission data are available under controlled conditions. • Simulate industrial flares under various operating modes and meteorological
conditions to investigate – the trend of crosswind, heating value, vent gas type, steam assist, air assist, jet
velocity, and flare-tip diameter. – the interaction between crosswind, jet velocity, and heating value
• Develop easy-to–use correlations and neural network models – to identify the optimal operating regime for high DRE/CE/Tmax and to facilitate
inferential control – to estimate aldehydes/HOx/NOx emissions given crosswind, jet velocity, vent
gas heating value, and other operating/ design conditions

Methodology
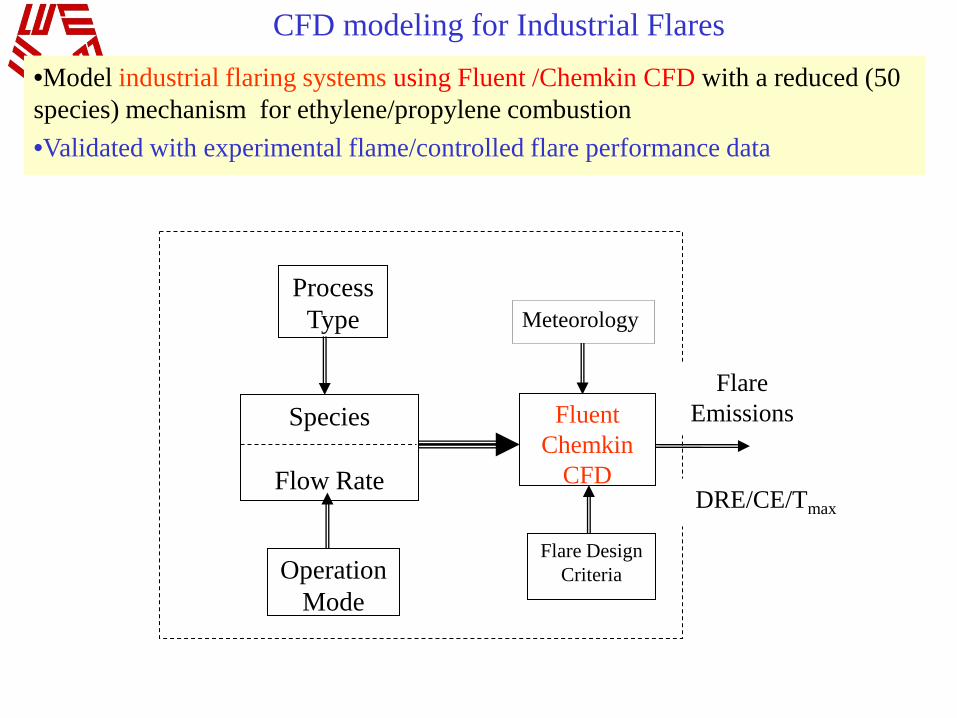
Fluent Chemkin
CFD
Flare Design Criteria
Species
Flow Rate
Process Type
Operation Mode
Flare Emissions
Meteorology
•Model industrial flaring systems using Fluent /Chemkin CFD with a reduced (50 species) mechanism for ethylene/propylene combustion •Validated with experimental flame/controlled flare performance data
DRE/CE/Tmax
CFD modeling for Industrial Flares

C2H4
CH4
CH3
CH2O
CHO
C2H3
C3H4
C3H3
CH3
C2H2 C2H
CH2CO
CO
CH2CO CH2O, CHO
Example: Ethylene Reaction Pathways
CO2
• We have combined the GRI-3.0 mechanism (optimized for methane) and the USC mechanism (optimized for ethylene but without the NOx species) to obtain a mechanism containing 93-species and 600 reactions.
• A series of 50-species reduced mechanisms for the combustion of C1-C3 light hydrocarbons were developed. LU1.0 & 1.1 were reduced based on analysis of rate constant, maximum mass fraction, and number of reactions involved in the reaction pathway. In LU 1.1, NO2 replaces CN. LU 2.0 has been developed based on minimizing the difference between the experimental data and mechanism predictions.
• All mechanisms were validated with experimental results like laminar flame speeds, adiabatic flame temperature, ignition delay, and burner stabilized flame.
CHEMKIN Mechanisms

Validation of LU 1.0 Mechanism
Comparison of the Molar Fraction of Major Species in Burner Stabilized Flame for C2H4/O2/Ar (phi = 1.9), LU 1.0
"A reduced reaction mechanism for the simulation in ethylene flare combustion,“ Clean Technologies and Environmental Policy, June 16, 2011; ,"Validation of a Reduced Combustion Mechanism for Light Hydrocarbons," Clean Technologies and Environmental Policy, “ Clean Technologies and Environmental Policy, 14(1) 1-12, 2012. "Optimal Reduction of the C1-C3 Combustion Mechanism for the Simulation of Flaring, " Industrial & Engineering Chemistry Research, February 13, 2012.
Journal Publications in Mechanism Development
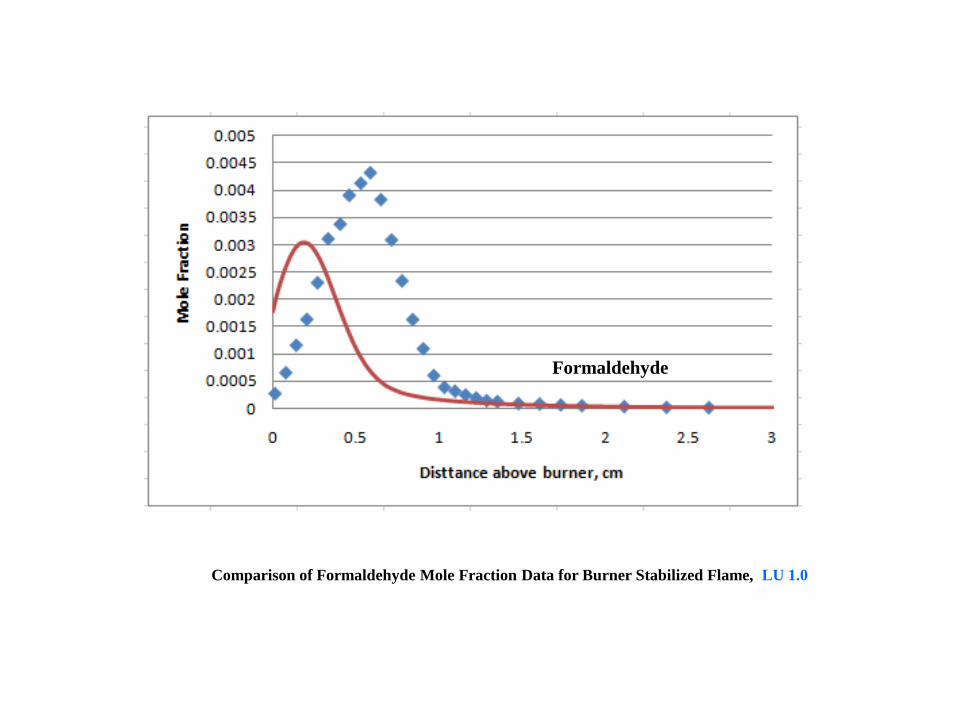
Comparison of Formaldehyde Mole Fraction Data for Burner Stabilized Flame, LU 1.0
Formaldehyde
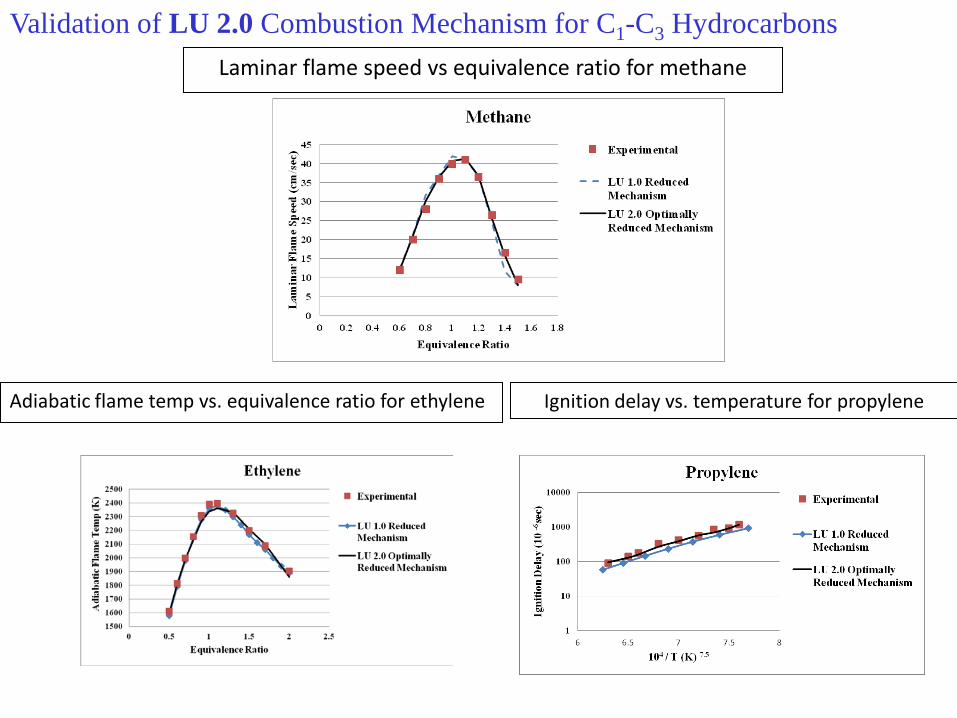
Adiabatic flame temp vs. equivalence ratio for ethylene
Ignition delay vs. temperature for propylene
Laminar flame speed vs equivalence ratio for methane
Validation of LU 2.0 Combustion Mechanism for C1-C3 Hydrocarbons
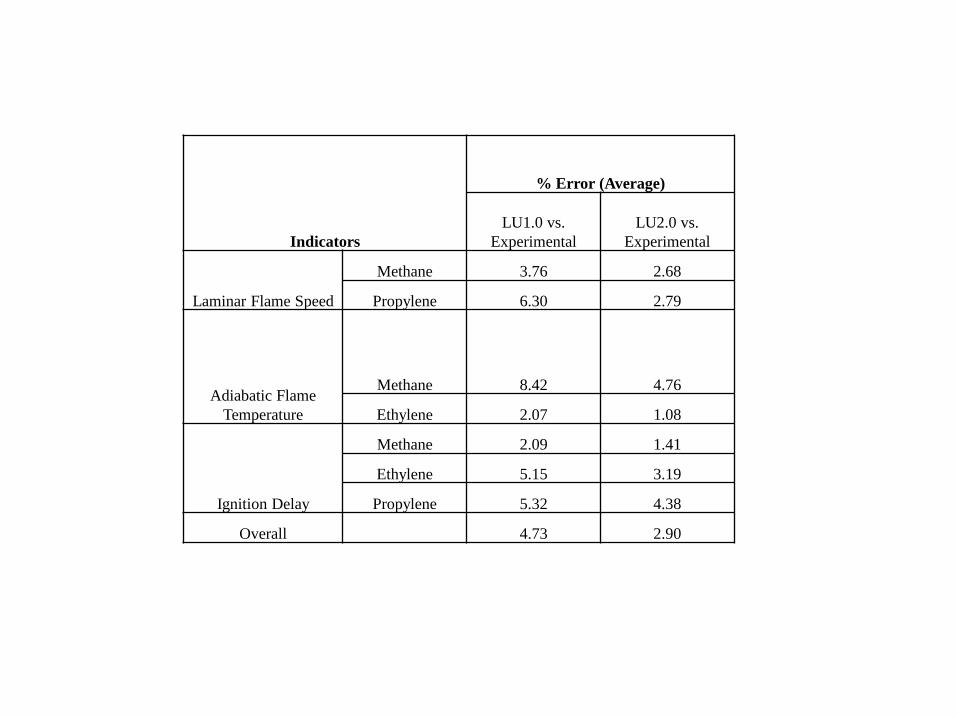
Indicators
% Error (Average)
LU1.0 vs. Experimental
LU2.0 vs. Experimental
Laminar Flame Speed
Methane 3.76 2.68
Propylene 6.30 2.79
Adiabatic Flame Temperature
Methane 8.42 4.76
Ethylene 2.07 1.08
Ignition Delay
Methane 2.09 1.41
Ethylene 5.15 3.19
Propylene 5.32 4.38
Overall 4.73 2.90
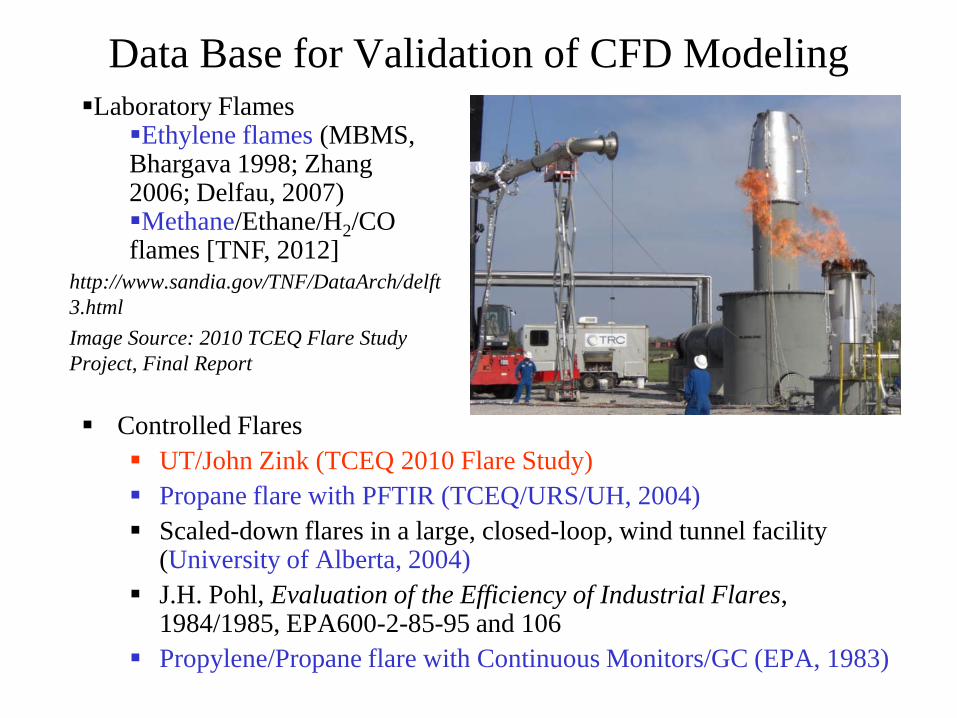
Data Base for Validation of CFD Modeling
Controlled Flares UT/John Zink (TCEQ 2010 Flare Study) Propane flare with PFTIR (TCEQ/URS/UH, 2004) Scaled-down flares in a large, closed-loop, wind tunnel facility
(University of Alberta, 2004) J.H. Pohl, Evaluation of the Efficiency of Industrial Flares,
1984/1985, EPA600-2-85-95 and 106 Propylene/Propane flare with Continuous Monitors/GC (EPA, 1983)
Laboratory Flames Ethylene flames (MBMS, Bhargava 1998; Zhang 2006; Delfau, 2007) Methane/Ethane/H2/CO flames [TNF, 2012]
http://www.sandia.gov/TNF/DataArch/delft3.html Image Source: 2010 TCEQ Flare Study Project, Final Report

Validation of CFD with a CH4 Sandia/ TU Darmstadt Flame Fuel composition: CH4 (25%), Air (75%) by volume. Fuel exit velocity: 49.6 m/s Nozzle diameter: 7.2 mm Pilot composition: CO (0.4%), CO2(11%), H2O(9.4%), O2(5.4%), N2(73.8%) Pilot exit velocity: 11.4m/s Pilot nozzle outer diameter:18.2 mm Mechanism : GRI 3.0 ( reduced to 35 species ) 2-D simulation

Temperature Profile
-0.02
0
0.02
0.04
0.06
0.08
0.1
0.12
0 50 100 150
Mas
s Fra
c C
o2
X/D Ratio
Experimental
simu2
Mass Fraction of CO2
Formaldehyde Plot along Axis (Simulation)
Sandia/TUD Piloted Flame
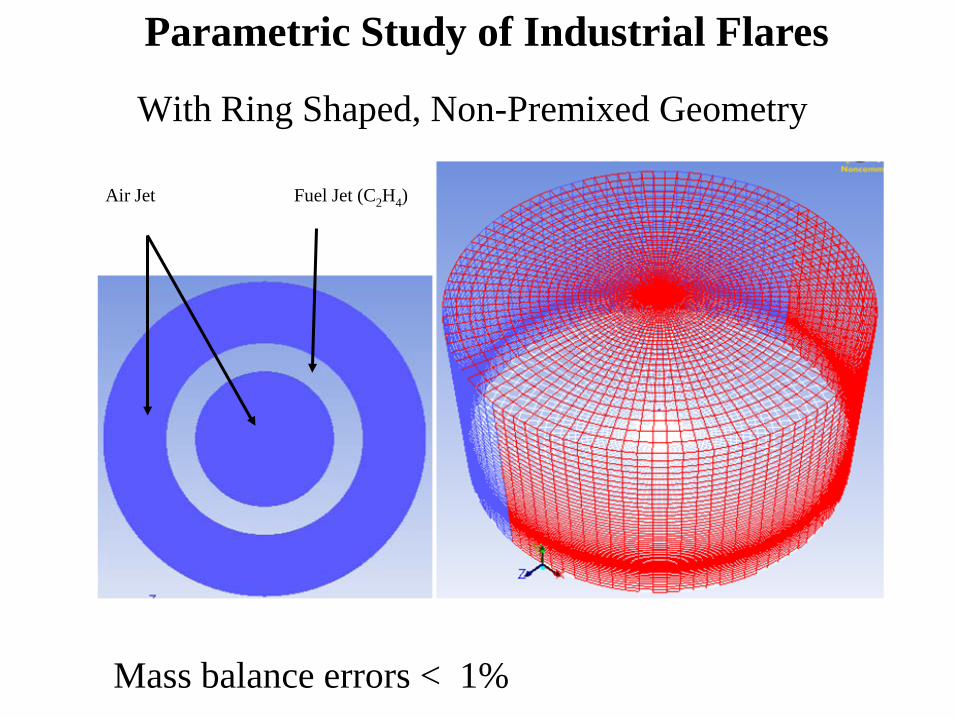
With Ring Shaped, Non-Premixed Geometry
Air Jet Fuel Jet (C2H4)
Mass balance errors < 1%
Parametric Study of Industrial Flares
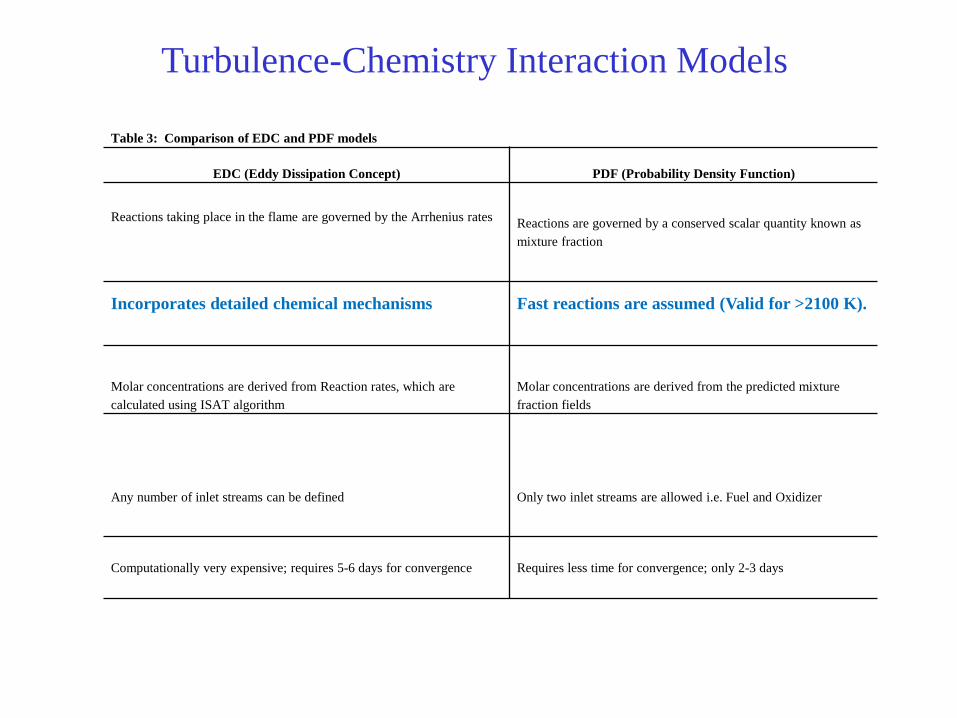
Table 3: Comparison of EDC and PDF models
EDC (Eddy Dissipation Concept) PDF (Probability Density Function)
Reactions taking place in the flame are governed by the Arrhenius rates Reactions are governed by a conserved scalar quantity known as mixture fraction
Incorporates detailed chemical mechanisms Fast reactions are assumed (Valid for >2100 K).
Molar concentrations are derived from Reaction rates, which are calculated using ISAT algorithm
Molar concentrations are derived from the predicted mixture fraction fields
Any number of inlet streams can be defined Only two inlet streams are allowed i.e. Fuel and Oxidizer
Computationally very expensive; requires 5-6 days for convergence Requires less time for convergence; only 2-3 days
Turbulence-Chemistry Interaction Models

Polynomial Equations
Y=a*Ub*Vjc
where Y is DRE or CE, and a, b, & c are constants.
Exponential Equations
Y = a0 + a1*U + a2*Vj + a3*U*Vj + a4*U2 + a5*Vj2
where ai = i th weighting factor; U = crosswind; V = jet velocity
Easy-to-Use Correlations

Biological Neural Systems
Biological vs. Artificial Neural
Networks
net
out ½
Highly Nonlinear Sigmoid (Squashing) function: out = 1/(1+e**(-λnet)) Neural network training to minimize the mean of
square errors
The weights and biases (similar to slope & intercept in a single input case) can be identified with MATLAB Neural Network Toolbox.
Artificial Neural Systems
Cross Wind
Formaldehyde
Jet Speed
Aeration Steaming
DRE/CE
Neural Network Models
AQRP Project 11-022: Modeling John Zink Flare Tests,
September 2010, Tulsa, Oklahoma
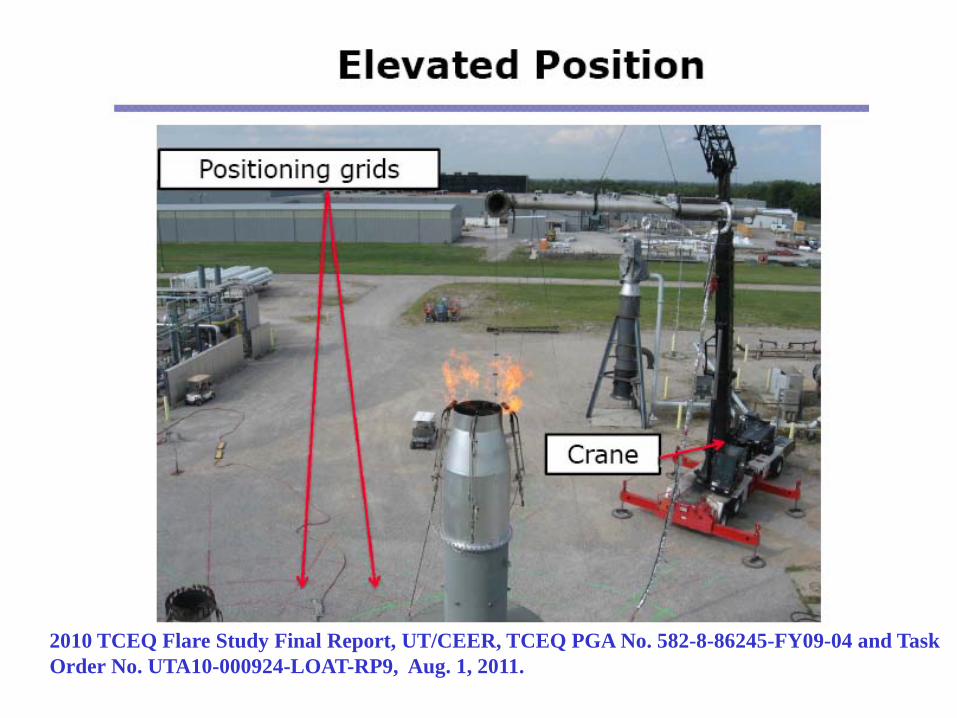
2010 TCEQ Flare Study Final Report, UT/CEER, TCEQ PGA No. 582-8-86245-FY09-04 and Task Order No. UTA10-000924-LOAT-RP9, Aug. 1, 2011.

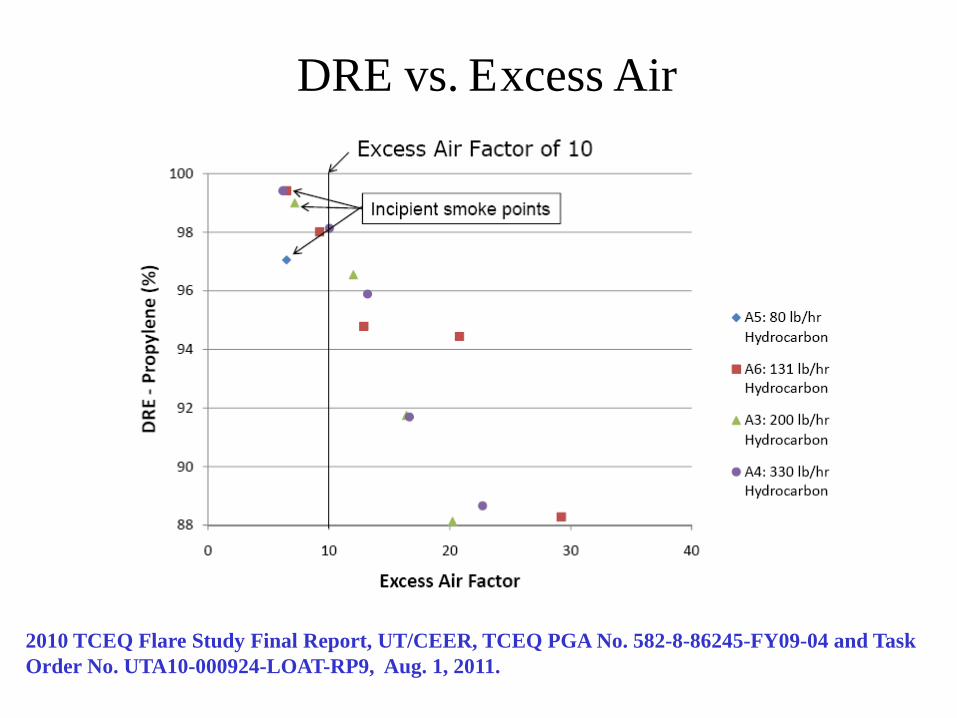
DRE vs. Excess Air
2010 TCEQ Flare Study Final Report, UT/CEER, TCEQ PGA No. 582-8-86245-FY09-04 and Task Order No. UTA10-000924-LOAT-RP9, Aug. 1, 2011.
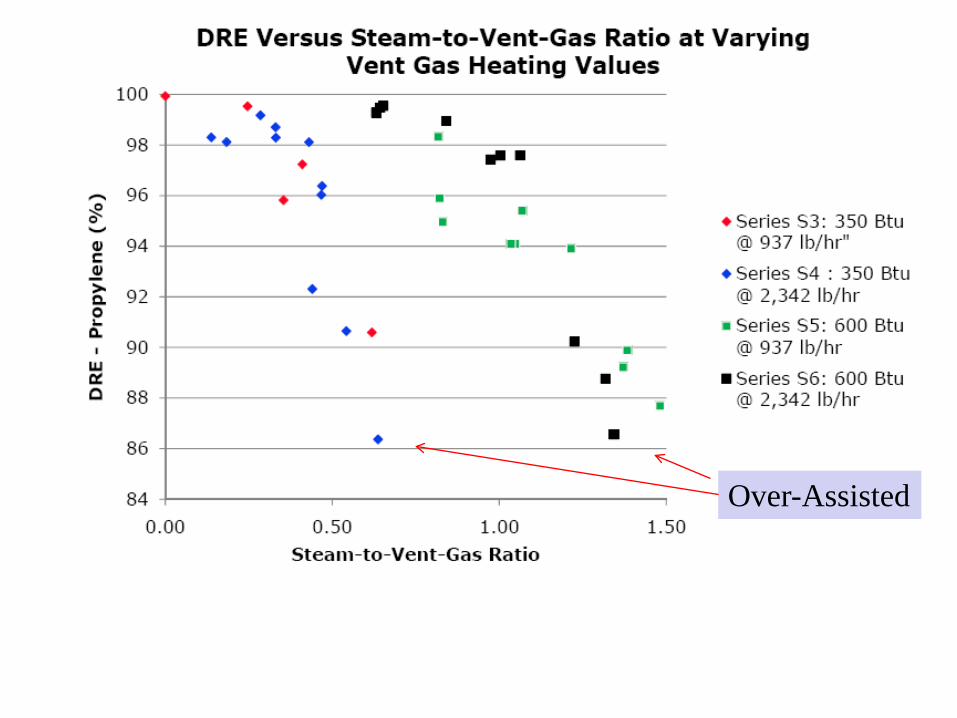
Over-Assisted

Modeling Air-assisted flares (using EDC approach)
26 of 52
Air Assist Fuel
Pilot Gas
Outlet
Stack
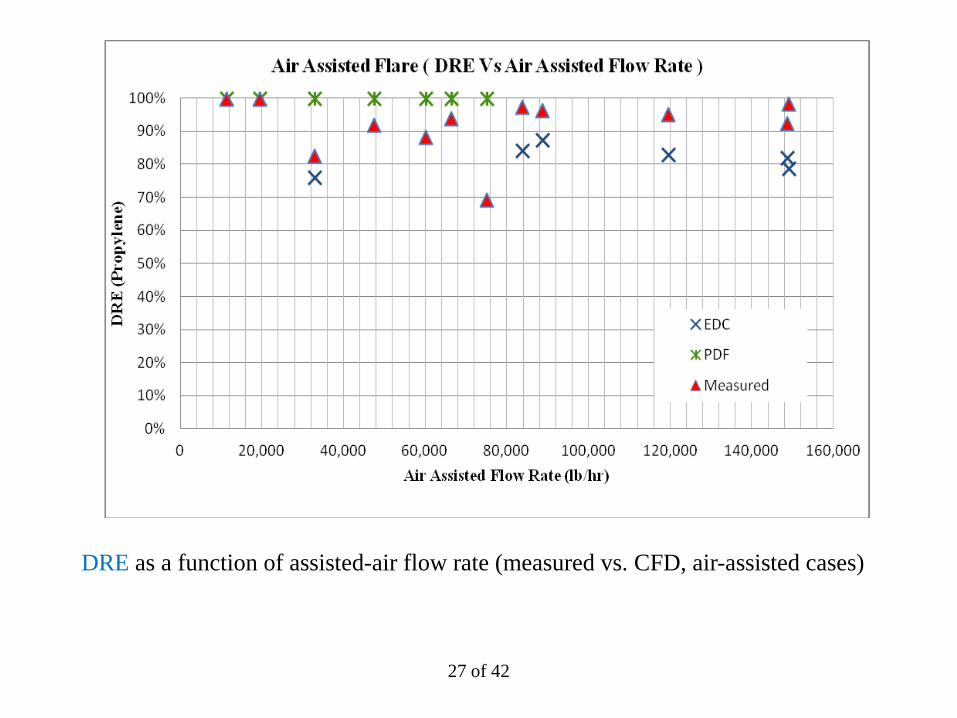
27 of 42
DRE as a function of assisted-air flow rate (measured vs. CFD, air-assisted cases)
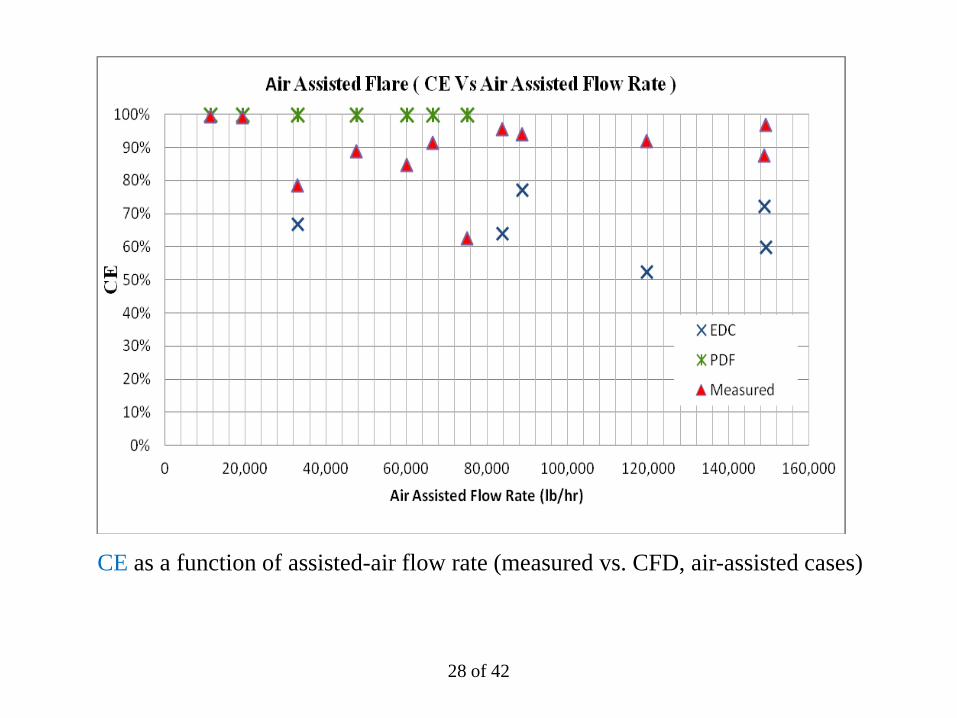
28 of 42
CE as a function of assisted-air flow rate (measured vs. CFD, air-assisted cases)

29 of 52
(Fuel + Steam Inlet) (Fuel + Steam Inlet)
( Not Used)
Steam-based test cases (PDF approach)

DRE as a function of assisted-steam flow rate (measured vs. CFD, steam-assisted cases)
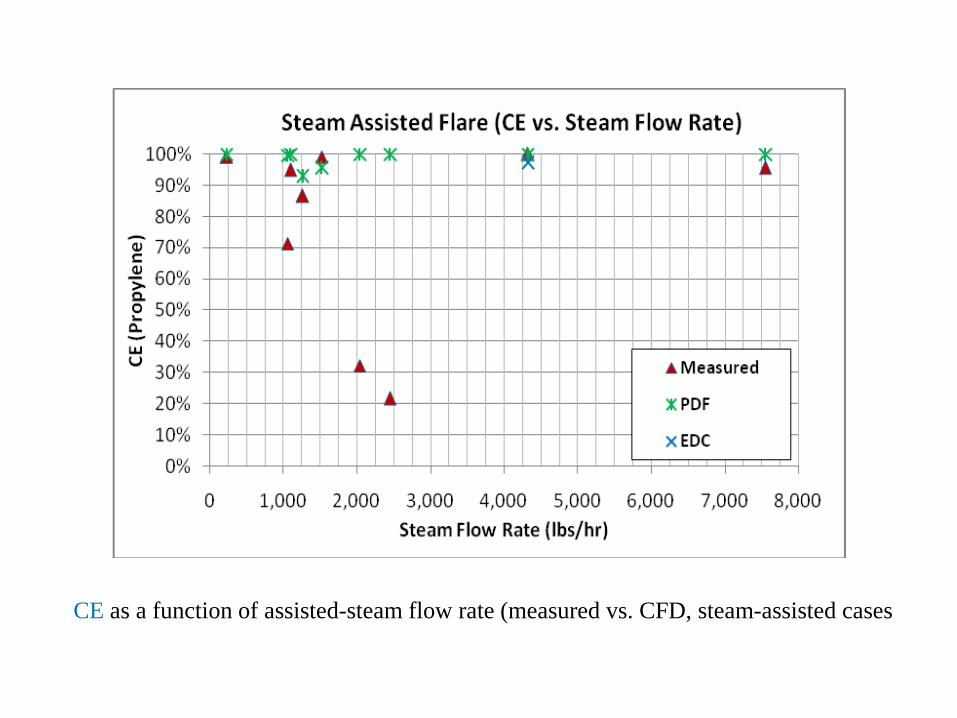
CE as a function of assisted-steam flow rate (measured vs. CFD, steam-assisted cases
Conclusions for AQRP-11-022 (1)
• The EDC model under- predicts DRE of air-assisted cases by 6% to 19% with an average of 12%. It under- predicts CE by 12% to 39% with an average of 25%. The potential causes for the large discrepancies may be – the low flow rates, low heating values, high air/steam assists, – large number of simulation cells coupled with complex
chemistry/transport phenomena – the difference between local sampling and the full surface
integration (CFD post processing). • Even though the more rigorous EDC model under-predicts the
experimental results (in all cases except steam case S 1.5) in low LHV/low jet velocity flares, the same EDC model has been used in numerous times for flare modeling that routinely gives >98% combustion efficiencies for high LHV/high jet velocity flares.

Conclusions for AQRP-11-022 (2) • The Probability Density Function model is not suitable for modeling low flow
rate low heating value flares because the underlying assumption of infinitely fast combustion, while valid for high temperatures (>2100 K), is not appropriate at the modeled temperature range (1600-1950K) – Contrary to the EDC model, the PDF model over- predicts DRE by 0.1%
to 72% with an average of 16%. It over- predicts CE by 0% to 78% with an average of 18%.
• Further studies are warranted – a cylindrical domain with more efficient, structured meshes need to be
explored – the Large Eddy Simulation turbulence model, a transient formulation
method, has the potential to give better results – combining the two models, PDF and EDC for simulating a low jet and low
LHV flare is a viable option. An initial flame developed by the PDF model can be put into more rigorous chemistry-turbulence interaction by using the EDC model.

Fig. 3 Grab sampling described with a CFD simulation domain
The plume measurements were carried out approximately in the center of the flare plume at a distance of two flame lengths downwind from the flare tip and with the inlet face perpendicular to the plume travel, Fig. 3.
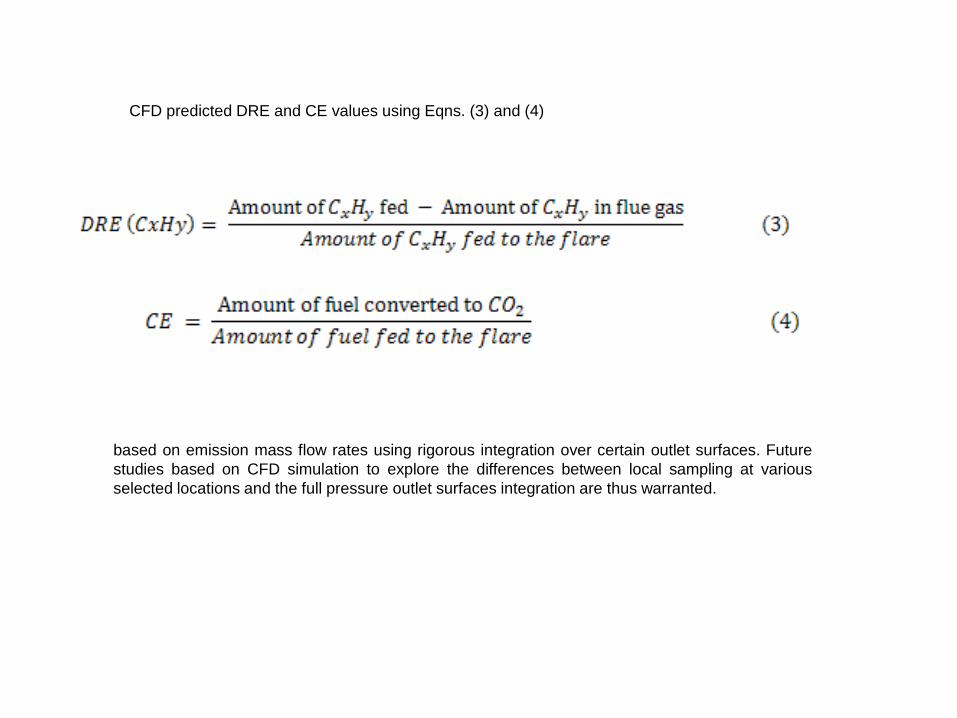
CFD predicted DRE and CE values using Eqns. (3) and (4)
based on emission mass flow rates using rigorous integration over certain outlet surfaces. Future studies based on CFD simulation to explore the differences between local sampling at various selected locations and the full pressure outlet surfaces integration are thus warranted.

TCEQ SEP 2009-009 Project: Task 2-A Flare Speciation Study Using Advanced Computational Methods

CROSSWIND INLET
VENT GAS OUTLET
OUTLET
Rectangular premixed geometry: (a) Geometry showing inlet and outlets, and (b) Flare stack dimensions
CROSSWIND INLET
OUTLET
Air Inlet
Fuel Inlet
Cylindrical ring-shaped geometry: (a) Meshed geometry showing inlet and outlet, (b) Flare stack at the center of the cylinder, and (c) Details of flare tip (ring-shaped geometry)

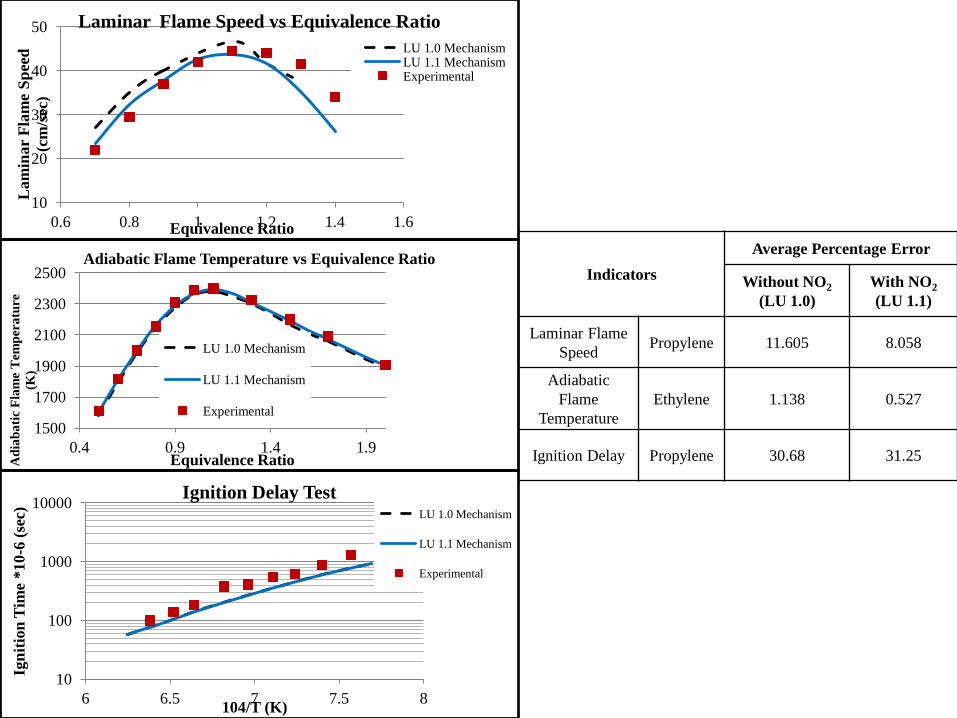
New 50-Species Mechanism with NO2 (LU 1.1)
• In 2010 John Zink flare tests, NO2 is a monitored species.
• The full 93 species mechanism was reduced based on mole fractions, rate constants, & their effect on other major species for use in the EDC model.
• CN was replaced with NO2 in LU 1.1.

10
20
30
40
50
0.6 0.8 1 1.2 1.4 1.6
Lam
inar
Fla
me
Spee
d (c
m/s
ec)
Equivalence Ratio
Laminar Flame Speed vs Equivalence Ratio LU 1.0 Mechanism LU 1.1 Mechanism Experimental
1500
1700
1900
2100
2300
2500
0.4 0.9 1.4 1.9
Adi
abat
ic F
lam
e Te
mpe
ratu
re
(K)
Equivalence Ratio
Adiabatic Flame Temperature vs Equivalence Ratio
LU 1.0 Mechanism
LU 1.1 Mechanism
Experimental
10
100
1000
10000
6 6.5 7 7.5 8
Igni
tion
Tim
e *1
0-6
(sec
)
104/T (K)
Ignition Delay Test LU 1.0 Mechanism
LU 1.1 Mechanism
Experimental
LU 1.1

Parametric Studies
I. Effect of Crosswind II. Effect of Jet velocity III. Effect of Assisted Air
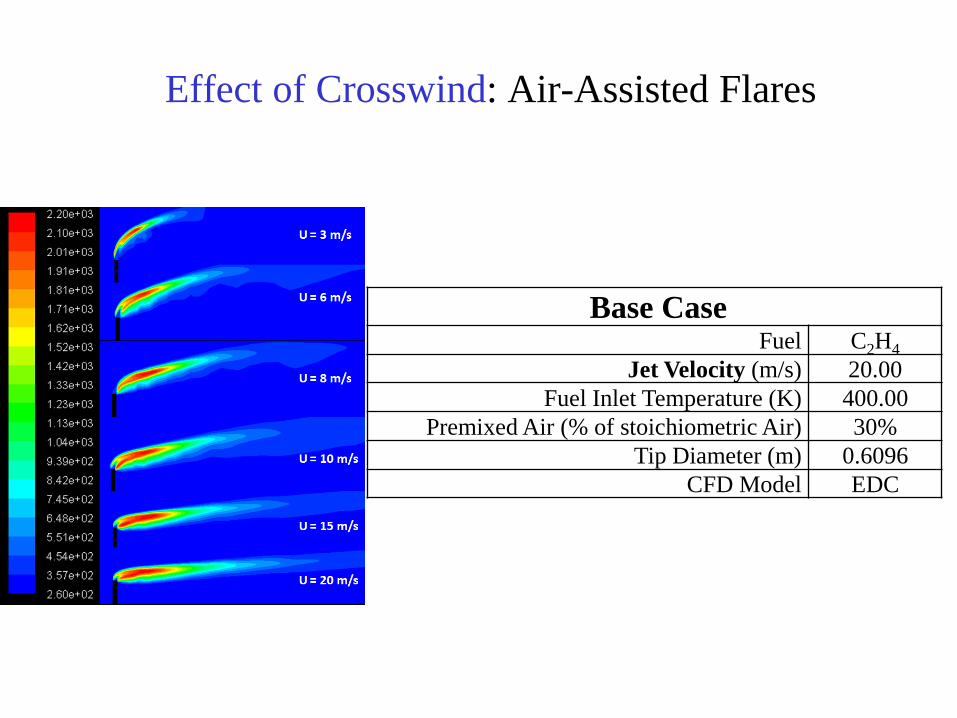
Effect of Crosswind: Air-Assisted Flares
Base Case Fuel C2H4
Jet Velocity (m/s) 20.00 Fuel Inlet Temperature (K) 400.00
Premixed Air (% of stoichiometric Air) 30% Tip Diameter (m) 0.6096
CFD Model EDC

Effect of Crosswind on DRE/CE @various Jet Velocities
0%
20%
40%
60%
80%
100%
0 2 4 6 8 10 12
Eff
icie
ncy
(%)
U (crosswind velocity, m/s)
Flare Efficiency vs. U (m/s); Vj = 2m/s
DRE
CE
0%
20%
40%
60%
80%
100%
0 10 20 30 40 50
Eff
icie
ncy
(%)
U (crosswind velocity, m/s)
Flare Efficiency vs. U (m/s); Vj = 10m/s
DRE
CE
0%
20%
40%
60%
80%
100%
0 5 10 15 20 25 30 35 40 45
Eff
icie
ncy
(%)
U (crosswind velocity, m/s)
Flare Efficiency vs. U (m/s); Vj = 20m/s
DRE
CE

0
10
20
30
40
50
60
70
80
90
100
5 10 15 20 25 30 35
DR
E/C
E (%
)
Crosswind (m/s)
Flare Efficiency vs. U, Vj = 30 m/s
DRE (%) CE (%)
50%
55%
60%
65%
70%
75%
80%
85%
90%
95%
100%
0 5 10 15 20 25 30 35 40 45
Flar
e Eff
icie
ncy
CrossWind Velocity (m/s)
Flare Efficiency vs. U, Vj=40 m/s
DRE
CE
For 10 ≤ Vj ≤ 30 m/s & 5 ≤ U ≤ 20 m/s ⇒DRE>98%
Vj , max =48.80 m/s for ethylene (LHV=1512 BTU/scf), Non-premixed , LU 1.1 mechanism
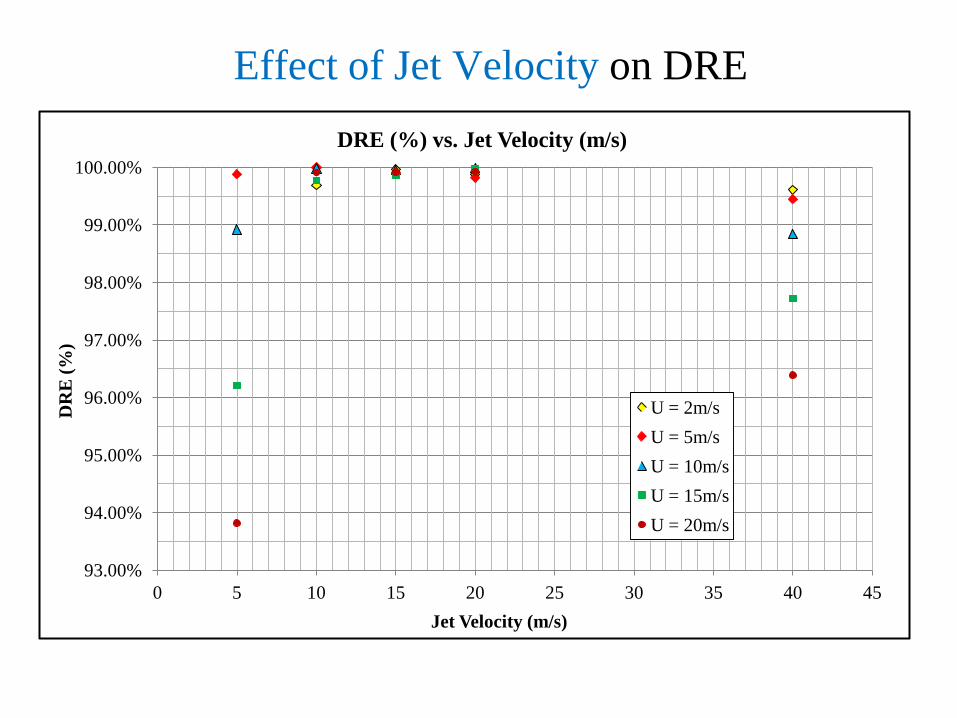
Effect of Jet Velocity on DRE
93.00%
94.00%
95.00%
96.00%
97.00%
98.00%
99.00%
100.00%
0 5 10 15 20 25 30 35 40 45
DR
E (%
)
Jet Velocity (m/s)
DRE (%) vs. Jet Velocity (m/s)
U = 2m/s U = 5m/s U = 10m/s U = 15m/s U = 20m/s

Effect of Crosswind on Emissions @Various Jet Velocities
0.E+00
1.E-01
2.E-01
3.E-01
4.E-01
5.E-01
6.E-01
0 2 4 6 8 10 12
Nor
mal
ized
Em
issi
on R
ates
(kg/
kg C
2H4)
Crosswind Velocity (m/s)
Normalized Emission Rates (kg/kg C2H4) vs. CrossWind (m/s)
NO2
CO
C2H4
0.E+00
1.E-01
2.E-01
3.E-01
4.E-01
5.E-01
6.E-01
0 5 10 15 20 25 30 35 40 45
Nor
mal
ized
Em
issi
on R
ates
(kg/
kg C
2H4)
Crosswind Velocity (m/s)
Normalized Emission Rates (kg/kg C2H4) vs. CrossWind (m/s)
NO2
CO
C2H4
Vj = 20m/s
Vj = 2m/s
0.0E+00
5.0E-04
1.0E-03
1.5E-03
2.0E-03
2.5E-03
0 2 4 6 8 10 12 Nor
mal
ized
Em
issi
on R
ates
(kg/
kgC
2H4)
Crosswind Velocity (m/s)
Normalized Emission Rates (kg/kg C2H4) vs. CrossWind (m/s)
OH
HO2
CH2O
Vj = 2m/s
0.0E+00
5.0E-04
1.0E-03
1.5E-03
2.0E-03
2.5E-03
0 5 10 15 20 25 30 35 40 45 Nor
mal
ized
Em
issi
on R
ates
(kg/
kg C
2H4)
Crosswind Velocity (m/s)
Normalized Emission Rates (kg/kg C2H4) vs. CrossWind (m/s)
OH
HO2
CH2O
Vj = 20m/s

0.0E+00
5.0E-04
1.0E-03
1.5E-03
2.0E-03
2.5E-03
0 5 10 15 20 25 30
kg/k
g C
2H4
Crosswind Velocity (m/s)
Normalized Emission Rates vs. Crosswind Velocity (m/s)
HO2
CH2O
OH
0.E+00
1.E-01
2.E-01
3.E-01
4.E-01
5.E-01
6.E-01
0 5 10 15 20 25 30
kg/k
g C
2H4
Crosswind Velocity (m/s)
Normalized Emission Rates vs. Crosswind Velocity (m/s)
NO2
C2H4
CO
Vj=40 m/s Vj=40 m/s

Effect of Jet Velocity on Emission Rates
0.00E+00
1.00E-04
2.00E-04
3.00E-04
4.00E-04
5.00E-04
6.00E-04
7.00E-04
8.00E-04
9.00E-04
0 5 10 15 20 25 30 35 40 45
CH
2O (k
g/kg
C2H
4)
Jet Velocity (m/s)
CH2O (kg/kg C2H4) vs. Jet Velocity (m/s)
U=5 U=10 U=15 U=20
0.00E+00
5.00E-02
1.00E-01
1.50E-01
2.00E-01
2.50E-01
3.00E-01
0 5 10 15 20 25 30 35 40 45
CO
(kg/
kg C
2H4)
Jet Velocity (m/s)
CO (kg/kg C2H4) vs. Jet Velocity (m/s) U=5 U=10 U=15 U=20

Effect of Jet Velocity on Emission Rates
0.00E+00
2.00E-02
4.00E-02
6.00E-02
8.00E-02
1.00E-01
1.20E-01
0 5 10 15 20 25 30 35 40 45
NO
2 (k
g/kg
C2H
4)
Jet Velocity (m/s)
NO2 (kg/kg C2H4) vs. Jet Velocity (m/s)
U=5 U=10 U=15 U=20
0.00E+00
5.00E-03
1.00E-02
1.50E-02
2.00E-02
2.50E-02
3.00E-02
3.50E-02
0 5 10 15 20 25 30 35 40 45
NO
(kg/
kg C
2H4)
Jet Velocity (m/s)
NO (kg/kg C2H4) vs. Jet Velocity (m/s)
U=5 U=10 U=15 U=20
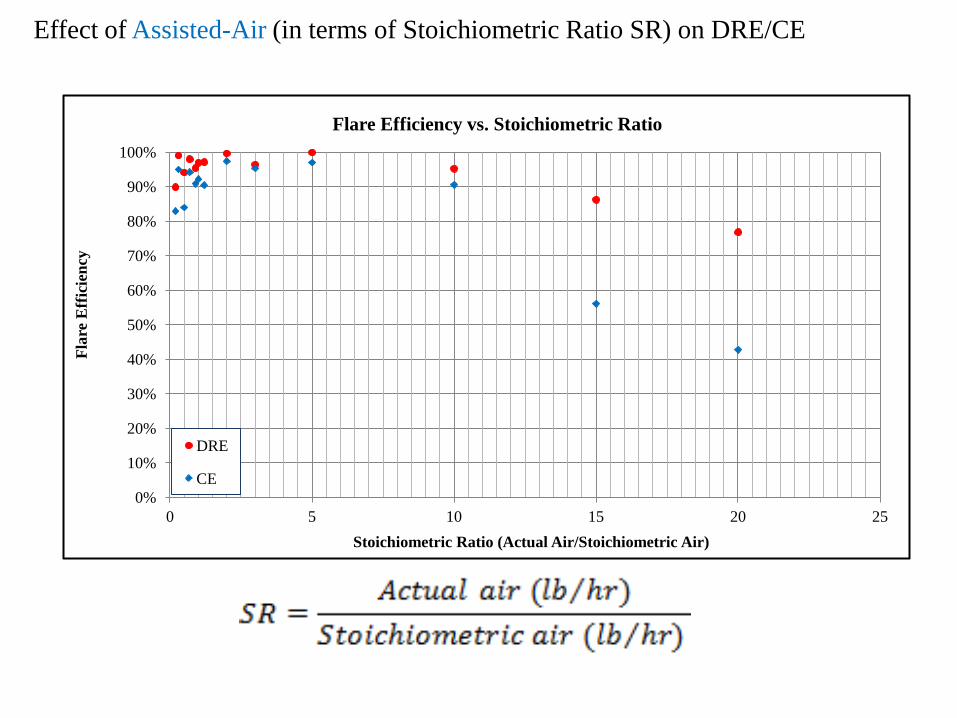
Effect of Assisted-Air (in terms of Stoichiometric Ratio SR) on DRE/CE
0%
10%
20%
30%
40%
50%
60%
70%
80%
90%
100%
0 5 10 15 20 25
Flar
e E
ffic
ienc
y
Stoichiometric Ratio (Actual Air/Stoichiometric Air)
Flare Efficiency vs. Stoichiometric Ratio
DRE
CE
Correlation Development
I. DRE/CE vs. U & V II. Emissions vs. CE

CE vs. Crosswind for all jet velocity cases
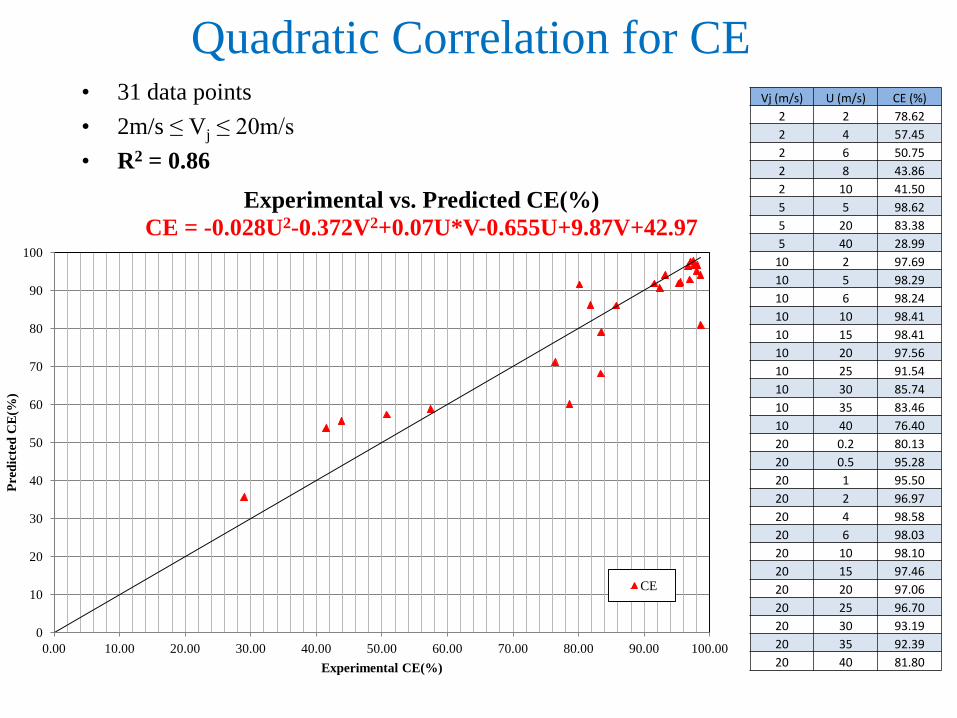
Quadratic Correlation for CE • 31 data points • 2m/s ≤ Vj ≤ 20m/s • R2 = 0.86
Vj (m/s) U (m/s) CE (%) 2 2 78.62 2 4 57.45 2 6 50.75 2 8 43.86 2 10 41.50 5 5 98.62 5 20 83.38 5 40 28.99
10 2 97.69 10 5 98.29 10 6 98.24 10 10 98.41 10 15 98.41 10 20 97.56 10 25 91.54 10 30 85.74 10 35 83.46 10 40 76.40 20 0.2 80.13 20 0.5 95.28 20 1 95.50 20 2 96.97 20 4 98.58 20 6 98.03 20 10 98.10 20 15 97.46 20 20 97.06 20 25 96.70 20 30 93.19 20 35 92.39 20 40 81.80
0
10
20
30
40
50
60
70
80
90
100
0.00 10.00 20.00 30.00 40.00 50.00 60.00 70.00 80.00 90.00 100.00
Pred
icte
d C
E(%
)
Experimental CE(%)
Experimental vs. Predicted CE(%) CE = -0.028U2-0.372V2+0.07U*V-0.655U+9.87V+42.97
CE

Quadratic Correlation for DRE • 36 data points • 10m/s ≤ Vj ≤ 40m/s • R2 = 0.84, RMS Error = 0.0018
V(m/s) U(m/s) DRE % 23.5354 10.1356 0.9969 10.0000 5.0000 1.0000 10.0000 6.0000 1.0000 10.0000 10.0000 0.9998 10.0000 15.0000 0.9977 10.0000 20.0000 0.9991 10.0000 25.0000 0.9687 10.0000 30.0000 0.9317 10.0000 35.0000 0.9242 10.0000 40.0000 0.8915 15.0000 0.2000 0.9997 15.0000 2.0000 0.9997 15.0000 4.0000 0.9999 15.0000 10.0000 0.9995 15.0000 15.0000 0.9986 20.0000 0.2000 0.9997 20.0000 0.5000 0.9998 20.0000 1.0000 0.9999 20.0000 2.0000 0.9988 20.0000 4.0000 1.0000 20.0000 6.0000 0.9994 20.0000 10.0000 0.9999 20.0000 15.0000 0.9998 20.0000 20.0000 0.9992 20.0000 25.0000 0.9982 20.0000 30.0000 0.9863 20.0000 35.0000 0.9864 20.0000 40.0000 0.9119 40.0000 2.0000 0.9961 40.0000 5.0000 0.9945 40.0000 10.0000 0.9884 40.0000 12.5000 0.9847 40.0000 15.0000 0.9772 40.0000 17.5000 0.9886 40.0000 20.0000 0.9639 40.0000 25.0000 0.9790
0%
10%
20%
30%
40%
50%
60%
70%
80%
90%
100%
0% 10% 20% 30% 40% 50% 60% 70% 80% 90% 100%
Expe
rim
enta
l DR
E
Predicted DRE
Experimental vs. Predicted DRE (%) DRE= -8.17E-05V2-9.24E-05U2+2.71E-05VU+3.57E-03V+1.23E-03U+0.95173
DRE

Speciated emission rates vs. combustion efficiency

R2 = 0.9895
Correlations between Emission Rates and Combustion Efficiency
R2 = 0.9461
R2 = 0.9466

Case: Jet = 10 m/s and Crosswind = 10 m/s
PATHLINES COLORED BY TEMPERATURE

Case: Jet = 10 m/s and Crosswind = 10 m/s
PATHLINES COLORED BY MASS FRACTION OF C2H4
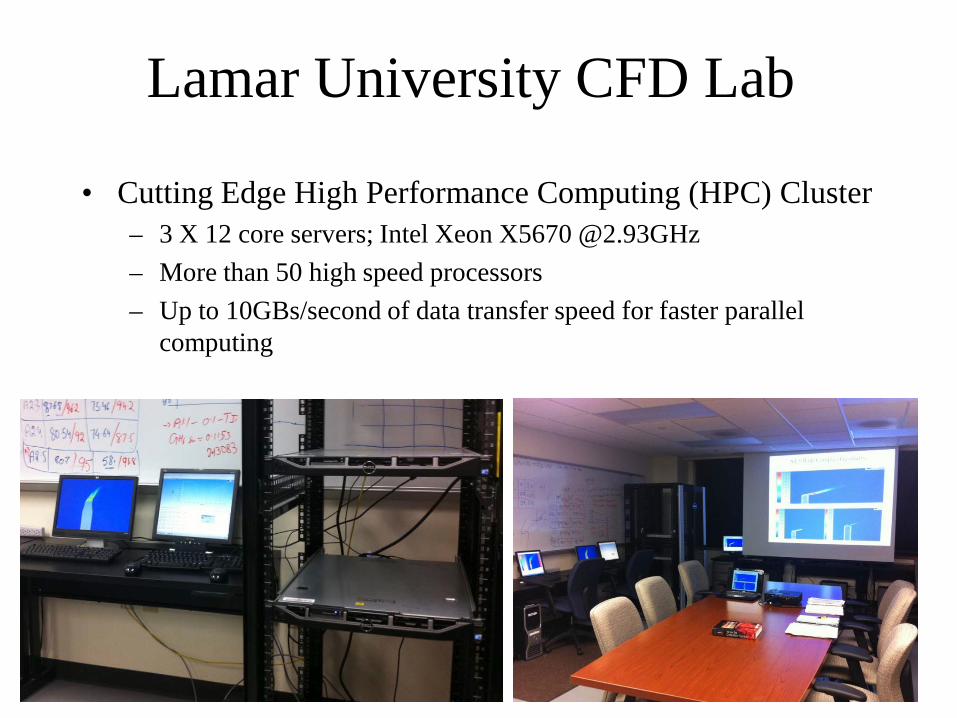
Lamar University CFD Lab
• Cutting Edge High Performance Computing (HPC) Cluster – 3 X 12 core servers; Intel Xeon X5670 @2.93GHz – More than 50 high speed processors – Up to 10GBs/second of data transfer speed for faster parallel
computing

09/18/2008 Chen, Yuan, Lou, Lin, Li 59

Model Selection • Solver - Pressure based solver • Solution Methods: Green-Gauss Cell based • k-ε realizable turbulence model
• Turbulence Intensity = 15% • Turbulence Viscosity Ratio = 10
• Eddy Dissipation Concept Model (turbulence-chemistry interaction).
• Reduced 50-species mechanism derived from a full 93-species GRI 3.0 + USC Mechanism.
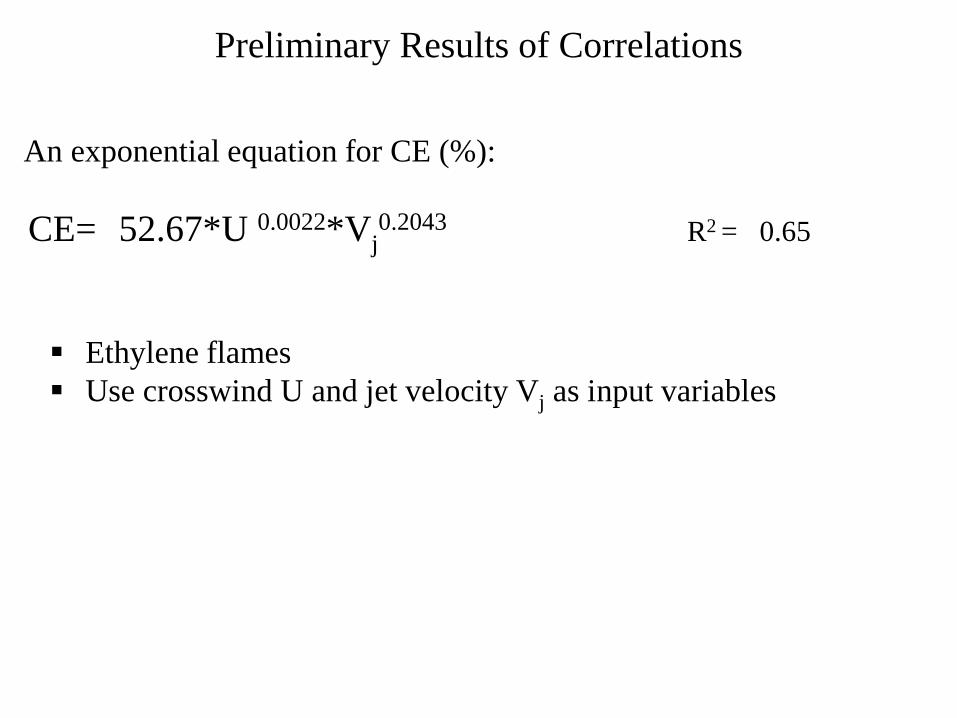
Preliminary Results of Correlations
Ethylene flames Use crosswind U and jet velocity Vj as input variables
An exponential equation for CE (%): CE= 52.67*U 0.0022*Vj
0.2043 R2 = 0.65
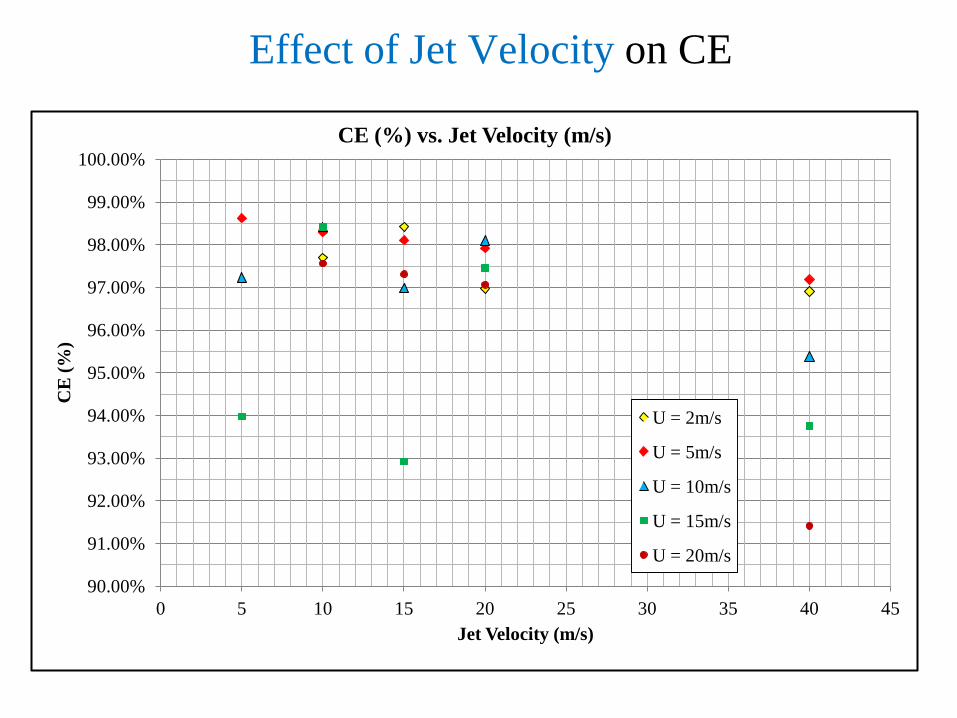
Effect of Jet Velocity on CE
90.00%
91.00%
92.00%
93.00%
94.00%
95.00%
96.00%
97.00%
98.00%
99.00%
100.00%
0 5 10 15 20 25 30 35 40 45
CE
(%)
Jet Velocity (m/s)
CE (%) vs. Jet Velocity (m/s)
U = 2m/s
U = 5m/s
U = 10m/s
U = 15m/s
U = 20m/s
10
20
30
40
50
0.6 0.8 1 1.2 1.4 1.6
Lam
inar
Fla
me
Spee
d (c
m/s
ec)
Equivalence Ratio
Laminar Flame Speed vs Equivalence Ratio LU 1.0 Mechanism LU 1.1 Mechanism Experimental
1500
1700
1900
2100
2300
2500
0.4 0.9 1.4 1.9
Adi
abat
ic F
lam
e Te
mpe
ratu
re
(K)
Equivalence Ratio
Adiabatic Flame Temperature vs Equivalence Ratio
LU 1.0 Mechanism
LU 1.1 Mechanism
Experimental
10
100
1000
10000
6 6.5 7 7.5 8
Igni
tion
Tim
e *1
0-6
(sec
)
104/T (K)
Ignition Delay Test LU 1.0 Mechanism
LU 1.1 Mechanism
Experimental
Indicators Average Percentage Error
Without NO2 (LU 1.0)
With NO2 (LU 1.1)
Laminar Flame Speed Propylene 11.605 8.058
Adiabatic Flame
Temperature Ethylene 1.138 0.527
Ignition Delay Propylene 30.68 31.25

DRE at Different Jet Velocities

Comparison of CE at Different Jet Velocities
75%
80%
85%
90%
95%
100%
400 600 800 1000 1200 1400 1600
Flare
Effic
ienc
y
LHV (BTU/scf)
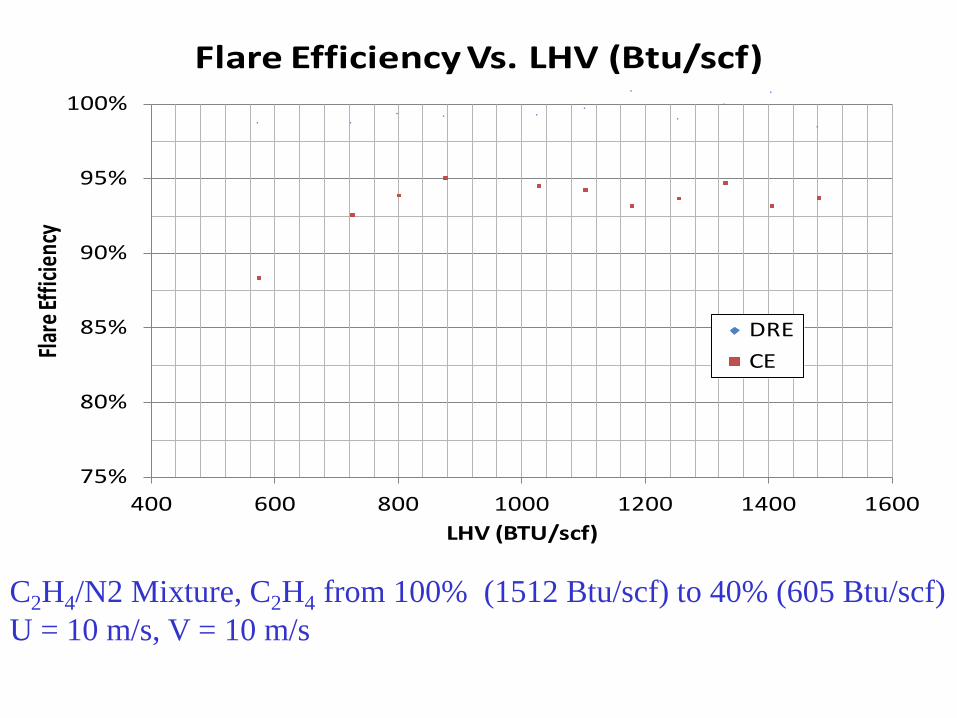
Flare Efficiency Vs. LHV (Btu/scf)
DRE
CE
C2H4/N2 Mixture, C2H4 from 100% (1512 Btu/scf) to 40% (605 Btu/scf) U = 10 m/s, V = 10 m/s

Preliminary Results of Correlations
Ethylene flames Valid for:
– Crosswind (U) : 0.2 m/s to 40 m/s – Jet Velocity (Vj) : 10m/s to 40 m/s
where: a = -2.09E-04 b = -1.19E-04 c = 5.57E-04 d = 4.53E-03 e = 5.49E-03 f = 9.00E-01
R2 = 0.76 RMS=2.63%
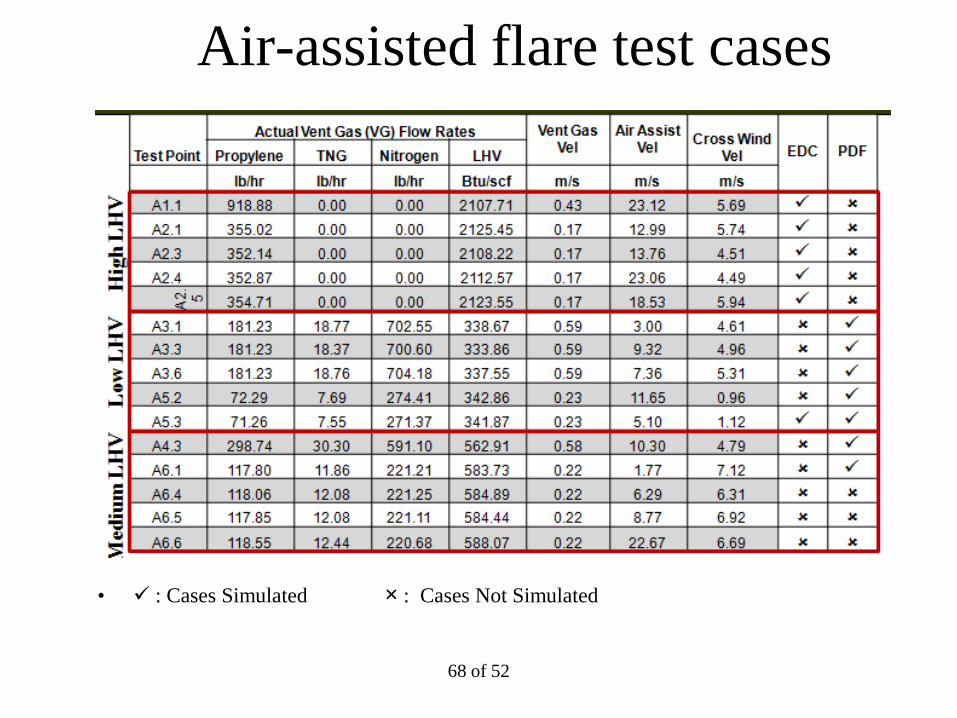
Air-assisted flare test cases
68 of 52
• : Cases Simulated × : Cases Not Simulated
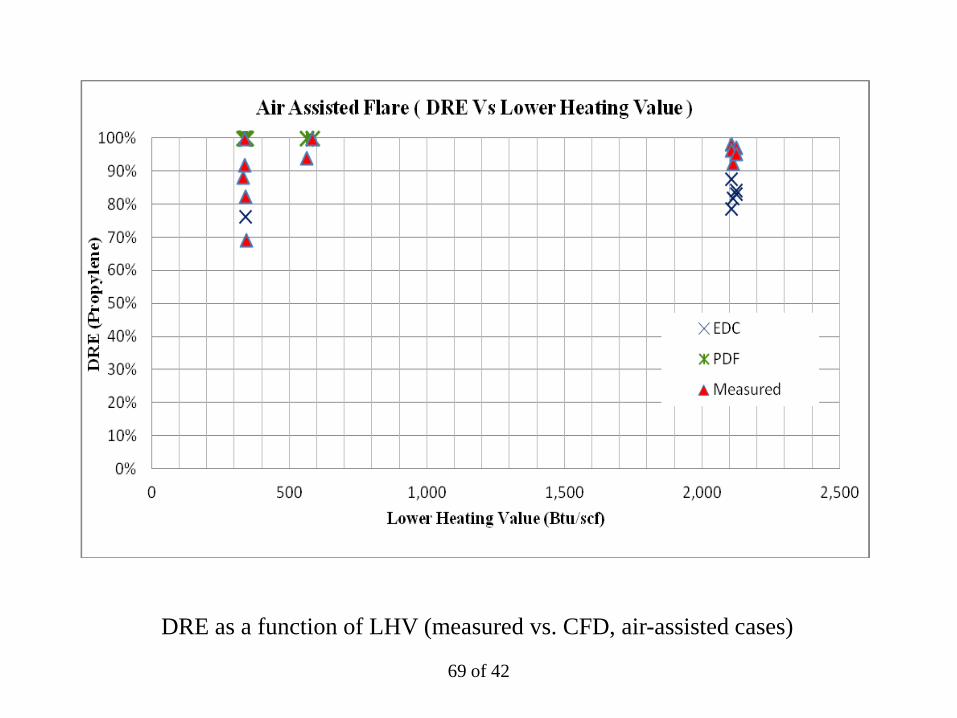
69 of 42
DRE as a function of LHV (measured vs. CFD, air-assisted cases)
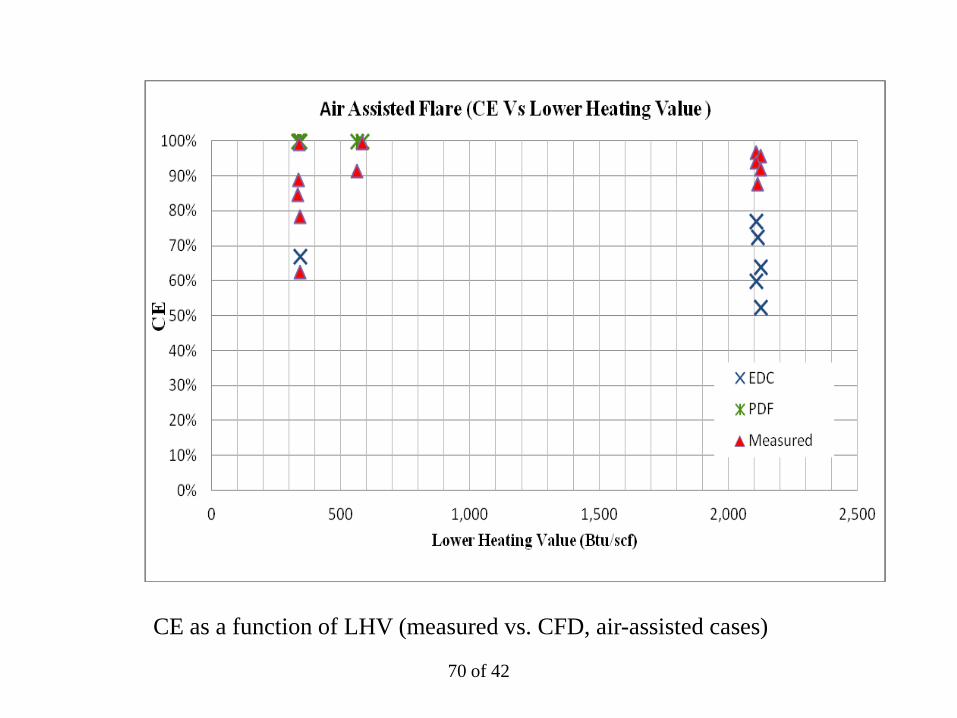
70 of 42
CE as a function of LHV (measured vs. CFD, air-assisted cases)

Steam-assisted flare test cases
71 of 52
• : Cases Simulated × : Cases Not Simulated
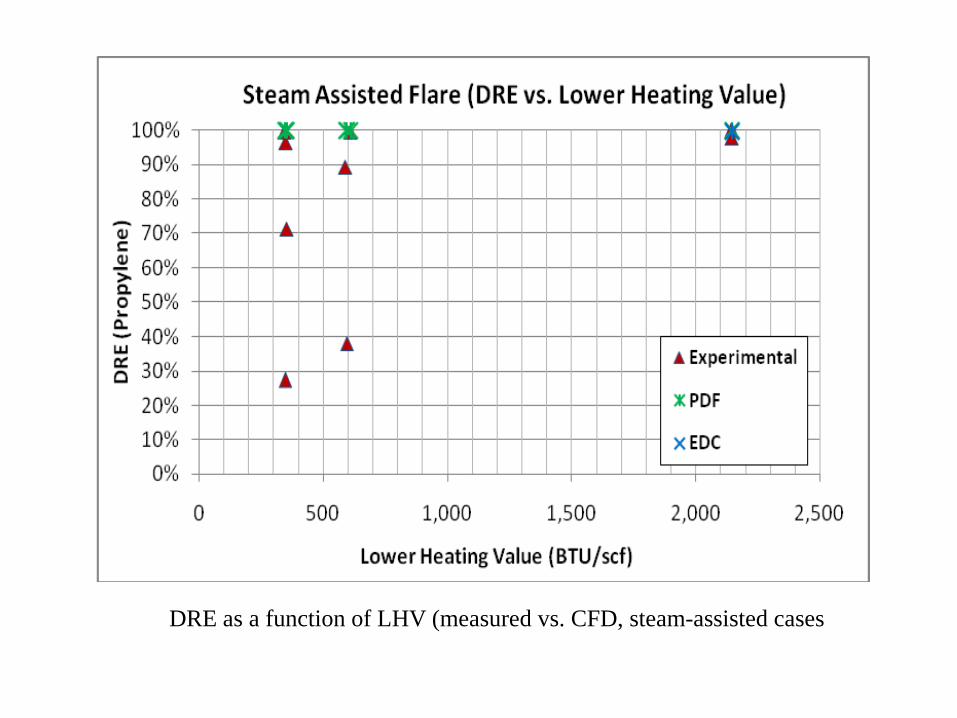
DRE as a function of LHV (measured vs. CFD, steam-assisted cases
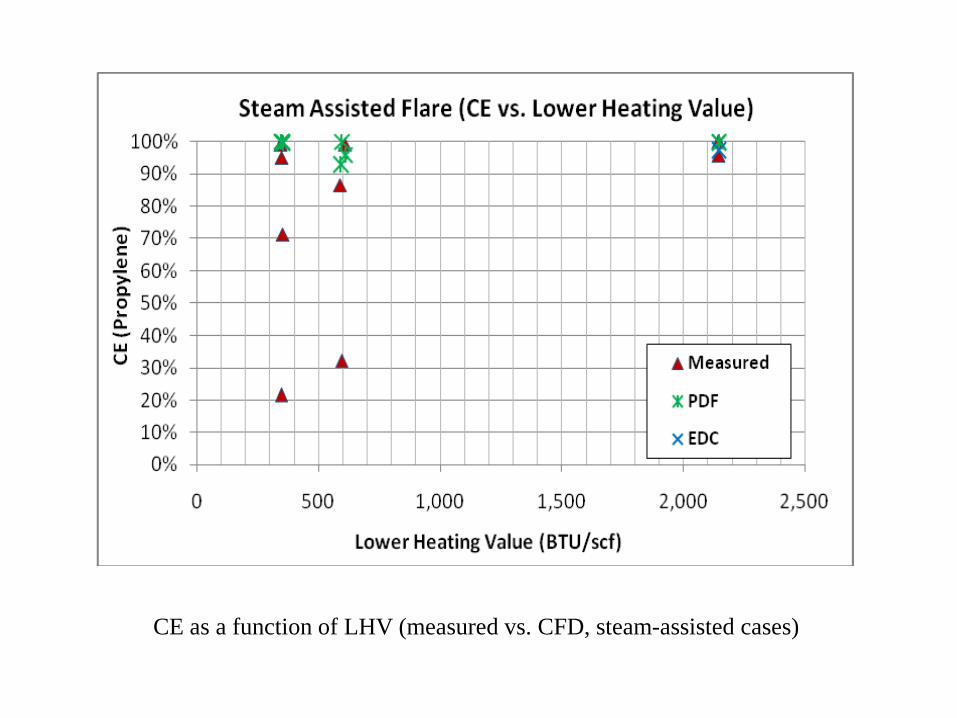
CE as a function of LHV (measured vs. CFD, steam-assisted cases)