cfd flare modeling update - flare modeling update setpmtc meeting by. daniel chen, helen lou, kuyen...
TRANSCRIPT

CFD Flare Modeling Update
SETPMTC Meetingby
Daniel Chen, Helen Lou, Kuyen Li D. F. Smith Chemical Engineering Dept.
Xianchang Li, Mechanical Engineering Dept.Christopher Martin, Chemistry & Biochemistry Dept.
Lamar University, Beaumont, TX
Houston, TX, June 29, 2011
ContentsI. Introduction/NeedsII. MethodologyIII. Prior Work: TCEQ Project
102IV. AQRO Project 22V. SEP Project

Reasons for TCEQ to focus on Industrial Flares
– Flare emissions account for 60% of the HRVOCs based on the 2007 HRVOC special inventory.
– Flare emissions depend heavily on a flare’s destruction & removal efficiency (DRE).• Recent studies/gas imaging IR camera suggest to the agency that flares may not be as
efficient as claimed. (Susan Moore, TCC, 2009)• For propylene and propane tests, there were many conditions that did not achieve a
99% DRE even conducted in compliance with all criteria of 40 CFR § 60.18 (D. Allen, 2011, UT/JZ/TCEQ Comp. Flare Study) .
– Aside from DRE, there is an issue of incomplete combustion species• Current air emission inventory from flaring is simply a mass throughput with 98%
reduction without any consideration of by-products or intermediates formation (TCEQ 2000)
– As a result, TCEQ is conducting an evaluation on flare operations that may serve as a basis for a future SIP revision (http://www11.tceq.state.tx.us/oce/eer/index.cfm)

Complexity in Flare Emissions
•Process Type (Relief gas)
Refinery, Olefin, Polymer, and Exploration fields (H2-C4)
•Operation mode
Startup, Shutdown, Upset, and Normal (Turndown ratio 20:1)
•Flare Design/Control
Steaming, Aeration, etc. Ethylene/Propylene
What species are emitted? What is the combustion efficiency (CE)?
•Meteorological condition
Cross wind, humidity, etc.

How does rigorous flare modeling help SIP?
• Improve Emission Inventories– Since the photochemical models indicated that the ozone formation in HGB is often
radical-limited, the incomplete combustion products from flares may contain unreported radical and radical producing species.
– Further, it is well known that the theoretical maximum amount of ozone that can be produced in the system is [O3] = [CH2O]0 + [NO2] 0, all photochemically important post-flared chemical species (HOx, NO2, CH2O, C2H4O) will be considered in the EIs.
• To evaluate the impact of emission inventories on ozone formation using emission processors (EPS3 or SMOKE) and air quality models (CAMx or CMAQ)
• To organize the knowledge base & to help flare operations– to help industries and TCEQ identify the best practices in flare operations,
especially during start up and upset periods– For example, under a particular set of cross wind and mass flow rate
conditions, what steaming and aeration should be used in an ethylene flare to increase flare efficiency and to reduce flare emissions?

Methodology

Fluent Chemkin
CFD
Flare DesignCriteria
Species
Flow Rate
Process Type
Operation Mode
Air Emissions
Meteorology
•Model industrial flaring systems using Fluent /Chemkin CFD for propylene/ethylene/methane combustion•Mechanisms validated with experimental data (laminar flame speeds, adiabatic flame temperature, and ignition delay) for combustion of light hydrocarbons (C1-C3)
Flare Efficiencies
Rigorous flare CFD simulations
Infer the emission species and combustion efficiencies under various Crosswind/Flow rate/ Heating Value/ Aeration/ Steaming conditions.

C2H4
CH4
CH3
CH2O
CHO
C2H3
C3H4
C3H3
CH3
C2H2 C2H
CH2CO
CO
CH2CO CH2O, CHO
Ethylene Reaction Pathways
CO2
• We have combined the GRI-3.0 mechanism (optimized for methane) and the USC mechanism (optimized for ethylene but without the NOx species) to obtain a mechanism containing 93-species and 600 reactions.
• A 50-species reduced mechanism for the combustion of light hydrocarbons (C1-C3) was developed and validated with experimental results like laminar flame speeds, adiabatic flame temperature, and ignition delay, and burner stabilized flame.
CHEMKIN Mechanisms
Lou, H., Martin, C., Chen, D., Li, K., Li, X., Vaid, H., Vaid, H. Tula, A., Singh, K., “A Reduced Reaction Mechanism for the Simulation in Ethylene Flare Combustion,” Clean Technologies and Environmental Policy, online edition, June 16, 2011.

Prior Work: TCEQ Project-2008-102 (Modeling Ethylene Flares) &
HARC H-83 Project (Flare Speciation)

Contours of static temperature (K)
Peak Temperature= 3000 K
Contours of Mass fraction of CH2O (zoomed in near the jet stream)
Inlet temperature =400 K, Flare diameter = 0.762 m, Jet exit velocity = 2.5 m/s, Premixed Air =30% of stoichiometric air, crosswind velocity =2m/s
Lou, H. H., K. Y. Li, C. Martin, D. Chen, X. Li, H. Vaid, A. Tula, K. D. Singh and D. J. Bean, “A Reduced Reaction Mechanism for the Simulation of Ethylene Flame,” the 2009 AIChE Annual meeting, Nashville, TN.
Results from TCEQ Project-2008-102 Modeling Ethylene Flares

Effect of Cross-Wind on Ethylene Flares
*30% pre-mixed airIncrease in crosswind velocity clearly brings down the combustion efficiency (CE) even though the destruction & removal efficiency (DRE) does not change much.
Normalized emissions rate (kg/ kg of C2H4 feed)
Significant emissions of CH2O, OH, HO2, CO, and C2H2 that increase with cross wind

Mass fraction of Formaldehyde HCHO (U = 2m/s, L; U =20m/s, R)

Adiabatic flame temp vs. equivalence ratio for ethylene Ignition delay vs. temperature for Propene
Laminar flame speed vs equivalence ratio for Methane
Validation of Lamar's Combustion Mechanism for C1-C3 Hydrocarbons

Validation with a CH4 Sandia/ TU Darmstadt Flame
Fuel composition: CH4 (25%), Air (75%) by volume.
Fuel exit velocity: 49.6 m/s
Nozzle diameter: 7.2 mm
Pilot composition: CO (0.4%), CO2(11%), H2O(9.4%), O2(5.4%), N2(73.8%)
Pilot exit velocity: 11.4m/s
Pilot nozzle outer diameter:18.2 mm
Mechanism : Gri3.0 ( reduced to 35 species )

Temperature Profile
0
500
1000
1500
2000
2500
0 20 40 60 80 100 120
Tem
pera
ture
(K)
X/D Ratio
Experimentalexperimental
-0.02
0
0.02
0.04
0.06
0.08
0.1
0.12
0 50 100 150
Mas
s Fra
c C
o2
X/D Ratio
Experimental
simu2
Mass Fraction of O2
0
0.05
0.1
0.15
0.2
0.25
0 50 100 150
Mas
s Fra
c of
O2
X/D
experimental
simu2
Mass Fraction of CO2
Formaldehyde Plot along Axis (Simulation)

AQRP Project 22:Modeling John Zink Flare Tests,
September 2010, Tulsa, Oklahoma

Objectives of the UT/TCEQ/JZ Comprehensive Flare Study
• Assess the impact of high turndown (low flow) rate of vent gas on flare destruction and removal efficiency (DRE) and combustion efficiency (CE)
• Assess the effects of varying assist ratios, and vent gas heat content
• Identify and Quantify Hydrocarbon Emission Plumes Currently being Seen with Infrared (IR) Cameras
2010 TCEQ Flare Study Draft Final Report Summary, The University of Texas at Austin, TCEQ PGA No. 582‐8‐86245‐FY09‐04 & Task Order No. UTA10‐000924‐LOAT‐RP9
Quality Assurance Project Plan, Texas Commission on Environmental Quality Comprehensive flare Study Project, PGA No. 582-8-862-45-FY09-04, Tracking No. 2008-81 UT/TCEQ/John Zink).Texas Commission on Environmental Quality 2010 Flare Study Draft ReportFlare Task Force, Presented by Air Quality Division (AQD),May 18-19, 2011

Flare Tips Design & Operation• Air‐assisted flare (144,000 lbs/hr, 24 inch Diameter, Zink Model LHTS–
24/60 Air Flare Tip)– LHV =350 and 600 Btu/scf– Vent gas flow rates =359 and 937 lbs/hr– Vary air assist from incipient smoke point (ISP) to < snuff
• Steam‐assisted flare (937,000 lbs/hr, 36 inch diameter, Zink Model EEF‐QSC‐36” Steam Flare Tip)– LHV=350 and 600 Btu/scf– Vent gas flow rate = 937 and 2,342 lbs/hr– Vary steam assist from ISP to < snuff
• Vent gas composition: 1:4 natural gas to propylene ratio (volume basis) diluted to desired LHV with nitrogen
2010 TCEQ Flare Study Draft Final Report, The University of Texas at Austin, The Center for Energy and Environmental Resources, May 23, 2011

Flare Operating Conditions (I)
• Tip velocities are similar to those observed during field testing at Marathon facilities.
• Vent gas streams with heat content of 350, 600, and 2,149 (Btu/scf)– 40 CFR §60.18 minimum heating value for an assisted flare is 300
Btu/scf.
• Vent gas streams with low flow rate 0.1% & 0.25% of rated design capacity– Steam-assisted flare = 937 & 2,342 lb/hr– Air-assisted flare = 359 & 937 lb/hr

Flare Operating Conditions (II)
• Assist rates varied between zero assist to over assist near flameout (snuff point).– Measurements were taken at points between the incipient smoke
point and near snuff point.– Four to six points per test series with up to three repetitions per
point– Tip velocity of vent gas, including center steam, was between 0.6
and 2.0 feet per second (fps).


Texas Commission on Environmental Quality 2010 Flare Study Draft ReportFlare Task Force,Presented by Air Quality Division (AQD),May 18-19, 2011

DRE vs. Excess Air
2010 TCEQ Flare Study Draft Final Report, The University of Texas at Austin, The Center for Energy and Environmental Resources, May 23, 2011

2010 TCEQ Flare Study Draft Final Report, The University of Texas at Austin, The Center for Energy and Environmental Resources, May 23, 2011
Over-Assisted

Goals of AQRP Project 22• Validate mechanisms used with laboratory data• Model low-flow rate flares in the open-air
conditions• Predict effects of cross wind, mass flow rate,
Btu, aeration, steaming, etc. for Propylene/Tulsa Natural Gas/N2 flares at the John Zink R&D Facility
• Tune models with available Literature and UT/John Zink data

New 50-Species Mechanism with NO2 Developed
• In 2010 John Zink flare tests, NO2 is a monitored species.
• The full 93 species mechanism was reduced based on mole fractions & their effect on other major species for use in the EDC model.
• Argon (inert gas, small mole fraction) was replaced with NO2 in the existing 50-species mechanism.
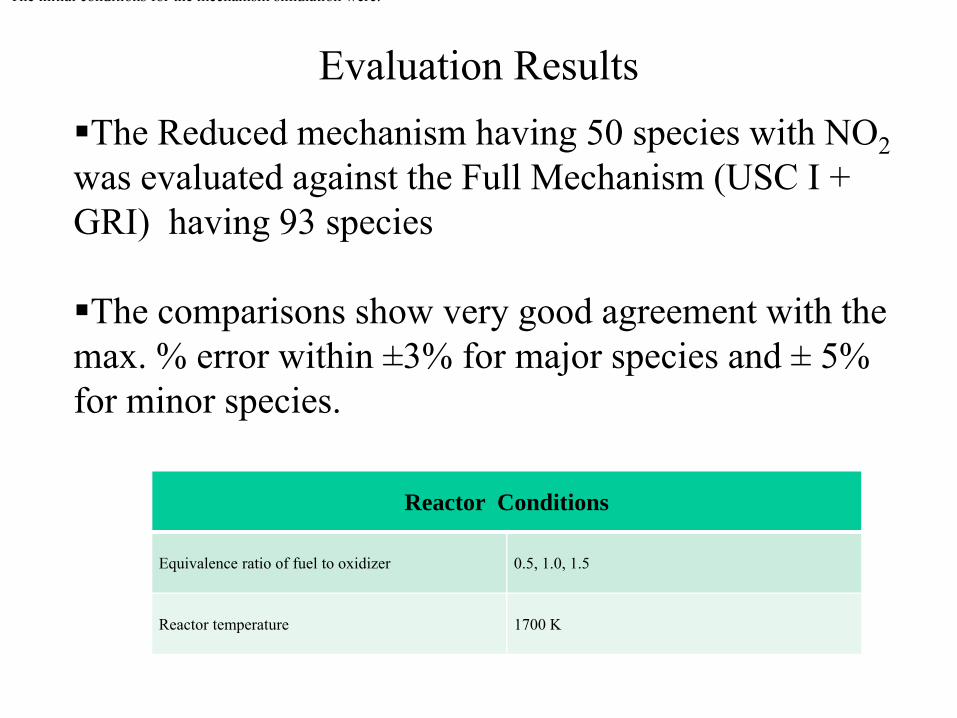
Evaluation Results
The initial conditions for the mechanism simulation were:
Reactor Conditions
Equivalence ratio of fuel to oxidizer 0.5, 1.0, 1.5
Reactor temperature 1700 K
The Reduced mechanism having 50 species with NO2 was evaluated against the Full Mechanism (USC I + GRI) having 93 species
The comparisons show very good agreement with the max. % error within ±3% for major species and ± 5% for minor species.
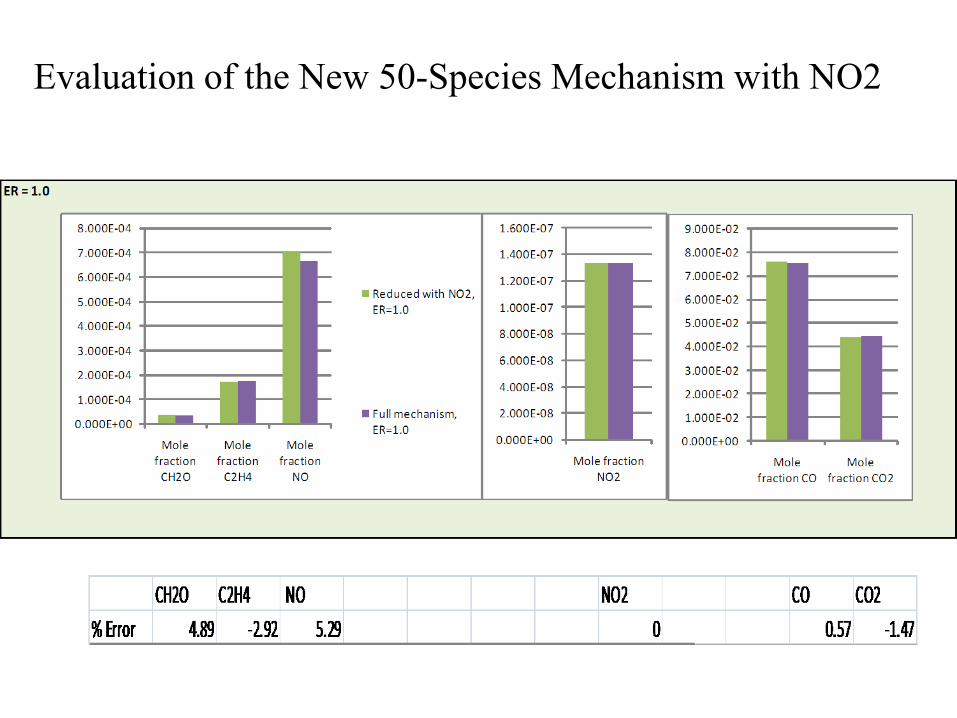
Evaluation of the New 50-Species Mechanism with NO2

• FUEL: Pure Propylene, 0.17 m/s , 355 lb/hr• LHV= 2125 BTU/SCF• Assist Air = 13 m/s, 83,818 lb/hr• Excess Air Factor = 16• Cross wind = 5.7 m/s (12.8 mile/hr)
Air-Assisted Flare: Case A2.1

Model Selection• Solver - Pressure based solver • Solution Methods: Green-Gauss Cell based • k-ε realizable turbulence model
• Turbulence Intensity = 15%• Turbulence Viscosity Ratio = 10
• Eddy Dissipation Concept Model (turbulence-chemistry interaction).
• Reduced 50-species mechanism derived from a full 93-species GRI 3.0 + USC Mechanism.

Emissions
Fuel(C3H6) in 360.17 lb/hr
C3H6 out 3.05 lb/hr
CO2 out 1055.12 lb/hr
C in (as C3H6) 308.72 lb/hr
C out (as CO2) 287.76 lb/hr
CFD Simulations Tests
DRE 99.15% 97.15%
CE 93.21% 95.54%
Case A2.1 Results

Contours of Static Temperature (K)

Contours of Mass fraction of CO2

Mechanism Validation
TCEQ SEP 2009-009 Project: Task 2-AFlare Speciation Study Using Advanced Computational Methods

Lab data used for Validation
Laminar Flame Speed
Burner Stabilized Flame
Adiabatic Flame Temperature
Ignition delay
CFD Simulation of Experimental Flames

Fuel Used: C1-C3
Test Fuels usedLaminar Flame Speed Methane and Propylene
Burner Stabilized Flame Ethylene
Adiabatic Flame Temperature Methane and Ethylene
Ignition delay Methane, Ethylene and Propylene
CFD Simulation of Experimental Flames Methane

Laminar Flame Speed

Adiabatic Flame Temperature

Ignition delay

Burner Stabilized Flame
Figure B.1: Comparison of the Molar Fraction of Major Species in Burner Stabilized Flame for C2H4/O2/Ar (phi = 1.9)

Burner Stabilized Flame
Fig. A.1.2: Comparison of Formaldehyde Mole Fraction Data for Burner Stabilized Flame

CFD Simulation of the Sandia/TUD Pilot Methane Flame
CH4/Air Jet Flame (Sandia/ TU Darmstadt, 2006)Fuel composition: CH4 (25%), Air (75%) by volume.Fuel exit velocity: 49.6 m/s (Re=22400)Nozzle diameter: 7.2 mmPilot composition: CO (0.4%), CO2 (11%), H2O (9.4%), O2 (5.4%), N2 (73.8%) by volume.Pilot exit velocity: 11.4 m/sPilot nozzle outer diameter:18.2 mm

CFD Simulation Results: Sandia/TUD Pilot Methane Flame

Modeling and Simulation of Wind Tunnel Data
TCEQ SEP 2009-009 Project

Schematic of a closed‐loop wind tunnel facility (all dimension in meters)at the University of Alberta.
Kostiuk, L, Johnson, M. and Thomas, G., University of Alberta Flare Research Project Final Report (2004).

Geometry
Grid SizeCells: 636640 Faces: 1929038 Nodes: 655841
Structured Mesh were generated Using Size Functions.

Meshed Geometry

Boundary Conditions
Fuel Mass Fraction
CH4 0.9129
CO2 0.0202
C2H4 0.0035
C2H6 0.0364
N2 0.0271
Jet Cross Wind
Velocity (m/s) 2.011 8.27
Hydraulic Diameter(m) 0.0221 1.94
Turbulence Intensity (%) 15 0.2

Model Selection• Pressure based solver• k-ε realizable turbulence model• Non-premixed (PDF + Mixture Fraction)
combustion model. • GRI 3.0 Mechanism (54 species).

Non-Premixed Model• The mixture fraction concept plays a vital role in Non-
premixed combustion model. • The probability density function can be thought of as the
fraction of time that the fluid spends in the vicinity of the state f.
Where, is the time scale
is the amount of time that f spends in the band.
ANSYS FLUENT 6.3 User’s Guide, Fluent Inc (2006)

Temperature Contours (Enhanced Wall Treatment)
Color image of the natural gas flame in a crosswond (Experimental)

Carbon Flow Rate, Efficiency, and Mass Balance
IN (10-5 Kg/s) Out (10-5 Kg/s)CH4 CO2 C2H4 C2H6 CH4 CO2 CO
48.21 1.067 0.1848 1.922 0.142 128.18 7.95Carbon 36.158 0.291 0.158 1.5376 0.107 34.958 3.407
Total Carbon In (10-5 Kg/s) 38.14Total Carbon Out (10-5 Kg/s) 38.47Combustion Efficiency 91.65%
Mass Balance Error -0.858%
Species Mass Flows (10-5 Kg/s)
Experimental CE ≈ 94%Flare research project, final report, University of Alberta, September 2004

09/18/2008 Chen, Yuan, Lou, Lin, Li
53