chadi-elmocary-cicem2011#24-cicem2011#24 improving...
TRANSCRIPT

T h e R e s e a r c h B u l l e t i n o f J o r d a n A C M , V o l . I I ( I I I ) P a g e | 27
Improving Student’s Performance Using Data Clustering and Neural Networks in Foreign-Language Based Higher Education
Chady El Moucary Notre Dame University Louaize North Lebanon Campus, Barsa
El Koura, Lebanon
+961 3 47 46 46
Marie Khair
Notre Dame University Louaize North Lebanon Campus, Barsa
El Koura, Lebanon
+961 3 300 754
Walid Zakhem
Notre Dame University Louaize
North Lebanon Campus, Barsa
El Koura, Lebanon +961 3 857 150
ABSTRACT
The academic performance of engineering and science students
during their first year at university is a turning point in their
educational path and usually encroaches on their General Point
Average (GPA) in a decisive manner. A case of particular interest
is when students have to learn their courses’ materials in a foreign
language. Indeed, it usually cumulates an additional handicap as
will be shown. In this paper, we present a hybrid procedure based
on Neural Networks (NN) and Data Clustering that enables
academicians to predict students’ GPA according to their foreign
language performance at a first stage, then classify the student in a
well-defined cluster for further advising and follow up by forming
a new system entry. This procedure has mainly a twofold
objective. It allows meticulous advising during registration and
thus, helps maintain high retention rate, acceptable GPA and grant
management. Additionally, it endows instructors an anticipated
estimation of their students’ capabilities during team forming and
in-class participation. The results demonstrated a high level of
accuracy and efficiency in identifying slow, moderate and fast
learners and in endowing advisors as well as instructors an
efficient tool in tackling this specific aspect of the learners’
academic standards and path.
Keywords
Educational Data Mining, Neural Networks, Data Clustering,
Learning using a foreign language, Academic Performance.
1. INTRODUCTION The brisk evolution in technology with the manifestation of
Globalization has led to an increasing demand in the extraction of
patterns from data. The former factor usually does not refer to
technology per say but rather encompasses almost innumerable
areas of study and fields of expertise such as Education, Business,
Science, Medicine, Military, Psychology, to name a few. What
accompanied and also rendered this rapid expansion is the
emergence of what is called Globalization. This term induces the
concept of combination of sociocultural, technological, political
and biological factors, amongst many others. The evolution of
technology and the widespread of Globalization, associated with
the observation that a strong penchant for the use of fast and
ubiquitous sources of communication and information (data) such
as Internet, Twitter, Facebook, 3G- and 4G- mobile phones, etc.,
particularly amid the neoteric generations, encouraged the
exploitation of reliable and more “scientific” modus operandi for
the forecast of a myriad of observable facts such as behavioral
rules, traffic jams, students enrollment in “hot” university majors,
chemical reaction likelihood, future of technology, market
demands, enterprises growth, odds for a new business to achieve a
breakthrough, trustworthiness and accuracy of research findings,
statistics credibility, weather forecast, existence of sophisticated
life in cosmos, the age of the universe and future galaxies, the
chances of winning a war or it taking place, elections, disease
control/antidote based on diagnosis tests, etc.
Although this might sound like a futuristic idea or precept, the
extraction of patterns from data has forever attracted people since
it suggests the ability of forecasting the unknown, the knowledge
of the future or simply the power of coming out with a “corollary”
that firmly, or at least largely (for modesty) pretends the
knowledge of intrinsic features/properties and/or the behavior or
befalling of a phenomenon, artifact, or population in the large
sense of the word. This science is called Data Mining. Forms of
data mining started to appear with the dawn of probability and
statistics [5][10][13][20]. Namely Bayes’ Theorem and
Regression Analysis were a decisive turning point in the
application of data mining.
Bayes’ Theorem consists of a simple mathematical formula
applied in performing conditional probabilities in the sense that it
offers rather a trivial methodology in conducting inductive logic
and/or extracting evidences related to some hypotheses.
Particularly, Bayes relies on the computation of inverse
probabilities, which are easier to establish and seem to be less
subjective. He thereby offered a way to resolve discrepancies
when analyzing outcomes by relating them to subjective disputes
about unconditional probabilities of both hypothesis and data [25].
Legendre in 1805 and Gauss in 1809 were the pioneers of the
earliest forms of regression, which was applied to astronomy.
Ever since, Regression Analysis (RA) continued to attract
researchers for diverse applications especially those requiring
prediction and machine learning [24]. Based on essential
assumptions, RA focuses on the relationship between dependent
and independent variables and provides an agent to infer causes of
modifying one to another. It attempts at describing a correlation
between the different types of variables, particularly estimating
the dependent ones when an explanatory variable is modified.
Experts from Econometrics as well as from Law use extensively
RA since it has been offered as evidence of liability in much
critical litigation such as damages in antitrust court cases [27].
Permission to make digital or hard copies of all or part of this work for
personal or classroom use is granted without fee provided that copies are
not made or distributed for profit or commercial advantage and that
copies bear this notice and the full citation on the first page. To copy
otherwise, or republish, to post on servers or to redistribute to lists,
requires prior specific permission and/or a fee.
Copyright ©2011 IJJ: The Research Bulletin of Jordan ACM - ISWSA;
ISSN: 2078-7952 (print); 2078-7960 (online)
T h e R e s e a r c h B u l l e t i n o f J o r d a n A C M , V o l . I I ( I I I ) P a g e | 28
Literature is rich in examples of techniques for carrying out RA to
serve various and perpetually-expanding types of applications.
Additionally, the tremendous advances in the development of
monstrousparallel processors endowed with incomparable
computational capabilities and speed, the almost-unlimited
storage capacity available nowadays, and the exceptional progress
in the software industry decidedly contributed towards using data
mining in an unprecedented manner to explore new horizons of
what is called Knowledge Discovery in Databases (KDD)
[4][8][26]. This factuality boosted the expansion of data mining
to subtend most of the aspects of life human kind is leading. One
might say that it is becoming the synonym for “intelligence” or
“information” by offering an advantage when speculating the
future. Data mining in this sense offers a prototype or likelihood
for profilers and decision makers. Moreover, the overwhelming
consensus that data mining suggests “real” inference has opened
wide the door for a race towards innovating more rigorous and
powerful technologies for critical applications.
Put differently, data mining is a cutting-edge discipline that aims
at ensuring a high level of data abstraction without any preset
hypothesis yielding deliverables and explicit and non-trivial rules
or patterns that are somehow hidden in a large set of raw data.
The first professional body in the field is the Association for
Computing Machinery’s Special Interest Group on Knowledge
Discovery and Data Mining (SIGKDD) that initiated many
conferences and houses proceedings [8]. In 1999, ACM
established a biannual academic journal entitled “SIGKDD
Explorations”. This area of research has been ever since growing
vastly; it has attracted innumerable amount of societies whether
scientific or not.
One particular area of interest in Data Mining is Education
[1][2][3][6][7][9][14]. Indeed, people working in academia have
started extensively applying DM science and techniques in the
search for a better understanding of the students’ and learners’
issues and behaviors, a more efficient management of their
institutional situations and encounters, and more rigorous or
intelligentanswersto academic questions. There exists a rich body
of literature dealing with the application of DM in this novel
perspective sometimes referred to as EDM or Educational Data
Mining [15][16][17].
The paper is divided into five parts. After the introduction, Data
Mining is briefly introduced and applied in the field of education
and learning process. In section 3, a hybrid technique based on
Neural Networks and Clustering is elaborated and which allows
predicting students’ performance according to their proficiency
level in a foreign language adopted for learning during their
higher-education path. In section 4, analysis of both data and
results is presented and some decisive outcomes are underlined.
Finally, a conclusion and some future perspectives are highlighted
in section 5.
2. DATA MINING TASKS Generally different classes of tasks can be achieved by exercising
DM [18][19][20][21][22]:
a. Prediction: this task aims at forecasting what might happen in
the future by estimating the likelihood of a certain event’s
occurrence.
b. Classification: it is usually exercised to identify group
membership in a population instances. Popular classification
techniques use Neural Networks (NN) and Decision Trees.
c. Clustering: it is applied to position elements of a database into
specific groups according to some attributes. The most
frequently modi operandi are k-means and expectation
maximization.
d. Association: this area of DM aims at analyzing data to identify
consolidated occurrence of events and uses the criteria of
support and confidence. It is known to be applied in customer
behavior and machine learning. A popular procedure used is
the Apriori algorithm.
e. Sequential Analysis: this task targets the occurrence of special
sequence of events where time plays a key role. It leads to the
identification of the events that most likely will lead to later
ones with a specified minimum support or percentage.
When applied in education, DM tasks indubitably offer broad, yet
precise, decision-making tools, observations and predictions such
as, to name a few: learning outcomes and feedback, prediction of
students’ grades and GPA (performance), students who are most
likely to drop or to be suspended, recommendations for students,
high-performance students, weak students, students having similar
behavioral traits and attitudes, detecting undesirable student
behaviors, teaming students, associating appropriate students for
specific tasks and projects, idea of what courses to offer for the
following semester (planning and scheduling courses and
activities), etc. [11][12][23].
In this sense DM is getting widespread in schools and universities
and is getting integrated as a vital part of the management and
academic strategic-planning mechanism.
3. PREDICTING STUDENT’S
PERFORMANCE In this paper we will deal with a particular concern that students
face when pursuing their higher education studies in a foreign
language in Lebanon. Lebanese students encounter a brutal
disruption during their course of studies. While Lebanese schools
adopt in their vast majority the French language as the language
of instruction, thus coming second after the Arabic, most
universities follow the American System of Education and thus,
use English as the exclusive language for learning and
communication purposes. Nonetheless, students do learn English
during their schooling cycle but do not have the opportunity to
apply it whether in science or communication; English is learnt as
a language and thus, technical words, scientific expressions and
structures, and other aspects required for courses’ materials are
not communicated to them prior to university stage.
Consequently, and despite the fact that Lebanese students enjoy
this rich mixture of culture and multilingual trait, they do suffer
when abruptly transferred to studying and communicating in
English throughout their entire higher-education cycle.
To analyze the repercussions of such transition, data were
collected for a set of 200 students who have graduated from the
Faculty of Engineering (FE), namely majoring Electrical
Engineering (EE) and Computer and Communication Engineering
(CCE), and the Faculty of Natural and Applied Sciences (FNAS),
majoring Computer Science, at the North-Lebanon Campus
(NLC) of Notre Dame University Louaize (Lebanon). Students’
records were examined from the aforementioned perspective and
submitted to the hybrid technique that will be presented in the
following section; decisive results were depicted after data mining
has been exercised.
T h e R e s e a r c h B u l l e t i n o f J o r d a n A C M , V o l . I I ( I I I ) P a g e | 29
It is noteworthy to mention that the curricula of both FE and
FNAS do incorporate two English courses usually taken during
the first two years:
• ENL 213 Sophomore English Rhetoric: this course aims at
developing the use of logic and reasoning in argumentation.
• ENL 230 English in the Workplace: it provides students with
the practical technical skills required for professional
communication.
Nonetheless, these courses seem to be insufficient when students
are French-educated and thus, the transition between the two
education systems remains flagrant as it will be subsequently
shown.
The study that has been carried out aimed at identifying the
different types of learners according to their proficiency level in
the two aforementioned English courses at a first stage, then
attempted correlating them to their general performance once
graduated, i.e. after they have completed 150 credits and 100
credits of core-requirement and major-requirement courses for the
FE and FNAS students, respectively.
More precisely, the objective of the study was to first apply
Neural Networks models to predict the students’ GPA based on
their performance in the English courses, and then at a second
stage, use clustering techniques to designate a group to where they
would belong. The ultimate objective of the clustering stage is to
allow advisors and instructors achieve a significantly better
outcome when planning students’ courses selection including the
course load advisable for the student and following them during
in-class activities of all aspects, particularly when teaming
students for project assignments. Additionally, the results
undoubtedly offered faculty members a clear perspective of who
they are dealing with when it comes to diverse academic advices,
particularly, dropping courses, choosing a more suitable sequence
of courses in order to enable the student sustain an acceptable
overall GPA, notably during the first year, etc.
In other words, the NN models associated with the clustering
technique engendered a powerful tool that decidedly helps
advisors plan the academic path of newly enrolled student
especially after they have completed the English courses and
before tackling their major courses thus, preventing them from
being wide of the mark when they hit their junior and senior
levels.
3.1 Preprocessing the Data After having collected the records and determined the attributes of
choice, we eliminated the outrange data in the sense students who
either failed the English courses or had near 4.0 overall core and
major combined GPA were discarded. The reason is that we
attempted studying students with regular performance as the
inclusion of such data would significantly alter the centroid of the
clusters, thus misleading the interpretation by yielding irrelevant
indications.
As of this stage, data is ready to be fed to a hybrid technique that
consists of applying Neural Networks followed by a clustering
algorithm which will allow deriving interesting and decisive
interpretation and use of the results.
3.2 Neural Networks Neural Networks is a group of interconnected neurons that uses
computational or mathematical models and which processes
information. NN are usually adaptive systems which allow
changing their structure based on external or internal information
flowing through the network. They are endowed with an inner
ability of learning from data as well as generalization capabilities;
they are of a nonparametric nature. It is a widespread discipline
that is finding applications in diverse fields of studies and for
different purposes such as prediction algorithms, sequence
recognition, and data processing in its general gist [28][29].
The Neural Networks that was used in the research is a platform
based on Palisade, one of the world’s leading Risk and Decision
Analysis Software and Solutions. Since its foundation in 1984 as
Software Developer, Palisade Corporation produces support tools
for professionals in many lines of work and which encompass
various branches of Data Analysis by delivering ultimately
accurate solutions for Risk and Decision problems. Palisade well-
known @RISK and DecisionTools are used by over 93% of
Fortune100 companies and many of the Fortune500 companies
such as Shell Oil, LOGION, Procter & Gamble, Cummings Inc.,
ExxonMobil, Chase Manhattan, Merck, and by prominent
economic and financial consultants as well.
Palisade software brings together seven powerful analytical
programs that work together in Excel in the form of add-ins
behaving exactly as native Excel functions. This remarkable
integration brings about a highly versatile and user-friendly tool;
calculations are fully performed within Excel, supported by
Palisade sampling and statistics. Furthermore, Palisade does not
rewrite Excel in an external calculator for ultimately higher speed.
One of the seven programs is NeuralTools and which was adopted
for our research purposes [31].
NeuralTools combines a powerful data manager along with state-
of-the art neural networks algorithms. It allows “learning”
patterns in a set of known data, and uses those patterns to make
predictions from new, incomplete data. NeuralTools also
automatically live-updates predictions when input data changes,
saving time and enabling more robust analyses. Data and
variables are in Excel spreadsheets and thus, one can utilize Excel
formulas for calculations, sorting and pivot tables. Additionally,
reports and charts from analyses use all of Excel’s built-in
formatting capabilities.
The problems that NeuralTools can perform can be divided into
two broad groups. Classification problems in which we are trying
to determine categories in which unknown item falls such as the
ability of the students to smoothly follow core and major
requirements courses and thus predict slow, moderate and fast
learners in the context of our research. Also numeric problems
can be tackled such as predicting a specific numeric outcome; the
core and major courses combined GPA (performance) of new
students can be accurately computed based on their performance
in the foreign-language course at early stages of study [32].
T h e R e s e a r c h B u l l e t i n o f J o r
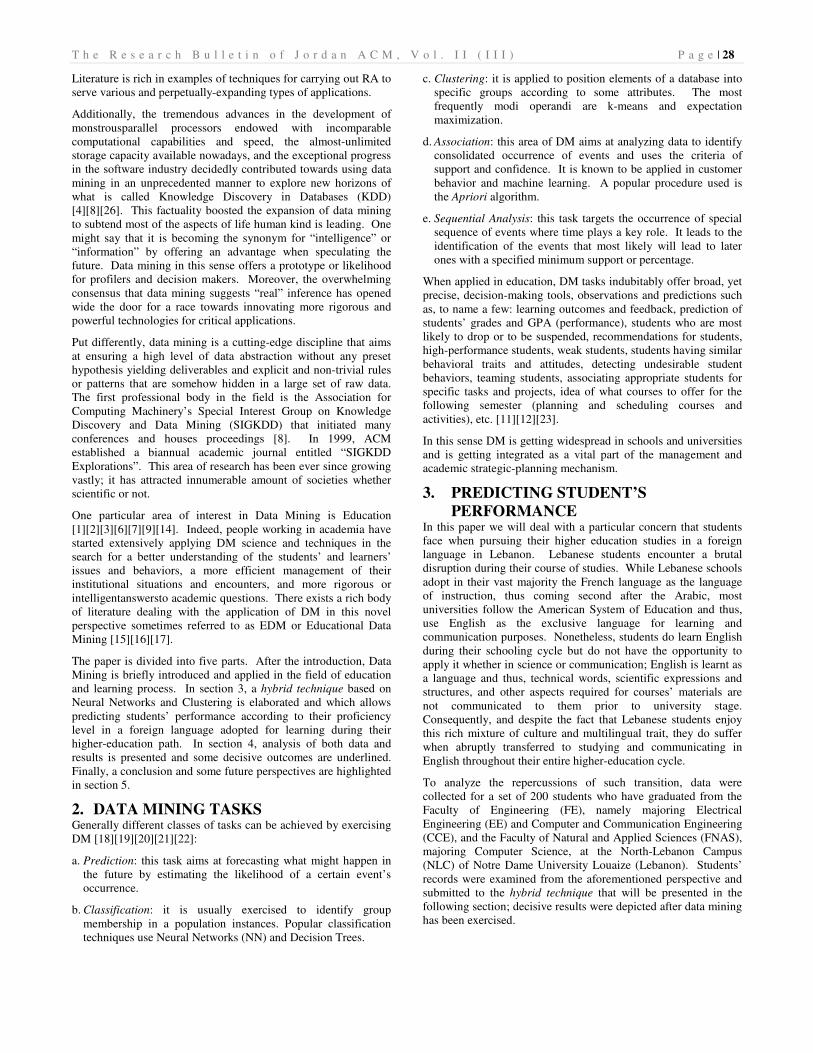
Figure 1 - NeuralTools (Palisade)
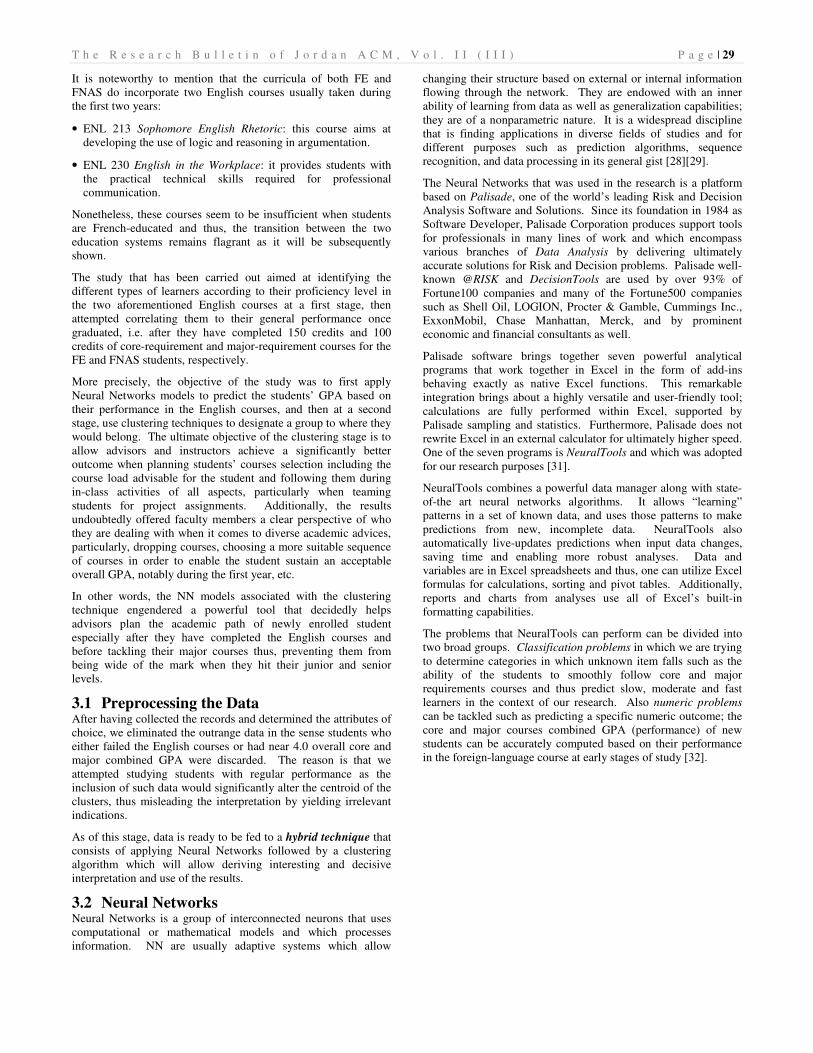
Figure 2 - NeuralTools Testing Summary
Figure 1 shows a snapshot of the trained data, the tested data, as
well as the residual/error between the predicted and the actual
data. Figure 2 shows the NeuralTools testing summary of the
analyzed data.
In order to efficiently use NeuralTools, Neural Networks are
developed and used in the following steps:
• Data preparation: data are defined in data sets. A Data Set
Manager is used to set up data sets so they can be used at any
time with the Neural Networks algorithm.
• Training and Testing: Neural Networks are generated from the
data set with known output values and dependent variables.
subset of the data set is used for training and which is not
usually a part of the training data set. However, the more data
used the better precision of the output. Larger data sets
penalize the computational time but pays off with a higher
training accuracy and faster convergence to a good weighting
outcome. For a moderately sized data set, typically 80 percent
of the data are randomly selected for training and 20 percent are
selected for testing. Furthermore, for small data sets, typically
all the data are used for training and testing [28].
• Prediction: after training and testing, the Neural Networks is
now ready to be used for predicting purposes. Unknown output
values are computed for new case data. In order to have the
T h e R e s e a r c h B u l l e t i n o f J o r d a n A C M , V o l . I I ( I I I )
NeuralTools (Palisade)
Testing Summary
Figure 1 shows a snapshot of the trained data, the tested data, as
between the predicted and the actual
data. Figure 2 shows the NeuralTools testing summary of the
In order to efficiently use NeuralTools, Neural Networks are
data sets. A Data Set
Manager is used to set up data sets so they can be used at any
Neural Networks are generated from the
data set with known output values and dependent variables. A
of the data set is used for training and which is not
t. However, the more data
the better precision of the output. Larger data sets
penalize the computational time but pays off with a higher
and faster convergence to a good weighting
outcome. For a moderately sized data set, typically 80 percent
of the data are randomly selected for training and 20 percent are
selected for testing. Furthermore, for small data sets, typically
used for training and testing [28].
: after training and testing, the Neural Networks is
now ready to be used for predicting purposes. Unknown output
values are computed for new case data. In order to have the
“best” Neural Networks and produc
iterative training and testing can be performed.
We started with a raw data of 200 students and cleaned them up
down to 73 records. The selected attributes were the
grades/performance in the ENL-213 course and those of ENL
course. Each grade was equally divided into four categories
ranging from 0 to 4. Consequently, the system consisted of a total
eight inputs and one output. The output designates the core and
major courses combined GPA.
As previously mentioned, all records in the data set were used for
training and testing since the data set is small [28].
trained using the entirety of the records body and was also tested
on the same records. Table 1 shows the structure of the system
containing the preprocessed data before application and training
of the NN. It also exhibits the predicted output
relative error and its percentage value. T
has been displayed in the 4th column. At a second stage,
records were tested separately and a calculation for error was
generated and shown in the last two column
the results demonstrated that the bad prediction of 30% tolerance
and above was about 8.22% of the total amount of records.
Second, the RMS (root mean square) Error was only 0.48 while
the mean absolute error was 0.3807 for the four
resulting in a 9.5% maximum error. These results were delivered
by NeuralTools and verified by Excel Data
in.
P a g e | 30
“best” Neural Networks and produce intelligent predictions,
iterative training and testing can be performed.
We started with a raw data of 200 students and cleaned them up
The selected attributes were the
213 course and those of ENL-230
course. Each grade was equally divided into four categories
Consequently, the system consisted of a total
output designates the core and
As previously mentioned, all records in the data set were used for
training and testing since the data set is small [28]. The NN was
trained using the entirety of the records body and was also tested
on the same records. Table 1 shows the structure of the system
containing the preprocessed data before application and training
of the NN. It also exhibits the predicted output as well as the
relative error and its percentage value. Theoutput for each record
column. At a second stage, the same
records were tested separately and a calculation for error was
generated and shown in the last two columns. At a first glance,
the results demonstrated that the bad prediction of 30% tolerance
and above was about 8.22% of the total amount of records.
Second, the RMS (root mean square) Error was only 0.48 while
the mean absolute error was 0.3807 for the four categories
These results were delivered
by NeuralTools and verified by Excel Data-Analysis built-in add-
T h e R e s e a r c h B u l l e t i n o f J o r d a n A C M , V o l . I I ( I I I ) P a g e | 31
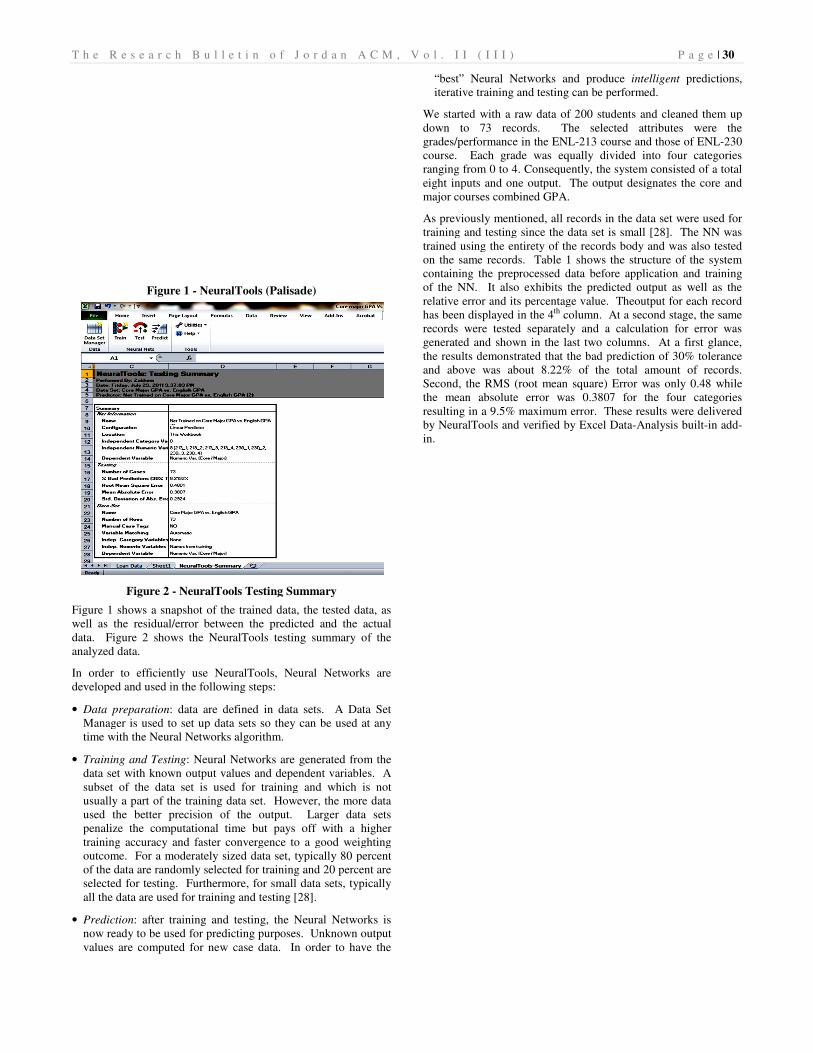
Table 1 - Preprocessed Data: Actual, Predicted and Error of
the Output
As previously mentioned, our study involves students who have
graduated from two faculties (FE and FNAS); those who studied
engineering have graduated from a five-year Bachelor of
Engineering program and not with a BS degree, in contrast with
those who graduated from the FNAS. The main objective of the
study is to have a retrospect of the path of the students thus,
engendering a predictive approach for newly enrolled ones and
this for different tracks or programs, each requiring a different
number of years of study.
It should be noted that during data preparation, outrange records
were eliminated and we ended up with 73 records. Nonetheless,
students with high GPA in one of the two English courses were
deliberately retained in order to show the real capabilities of the
study from a predictive viewpoint and have a more truthful
outcome. Indeed, results came as expected in the sense that high
error rate for some records were present. This fosters and
confirms the realistic attribute of the study for the data set was
relatively small. When examining in details the records shown in
Table 1, we can state the following observations:
Table 2 - Students Performance in English Courses
Table 2 shows that the majority of the students examined had a
regular performance in their foreign language whilst
approximately 20% were more proficient.
Moreover, the predicted GPA for most of the students who had a
high performance in the English courses (GPA comprised
between 3.0 and 4.0) was 3.33, as shown in Table 1. Again, this
result is affected by the fact that the data set was small and
comprised only 73 students.
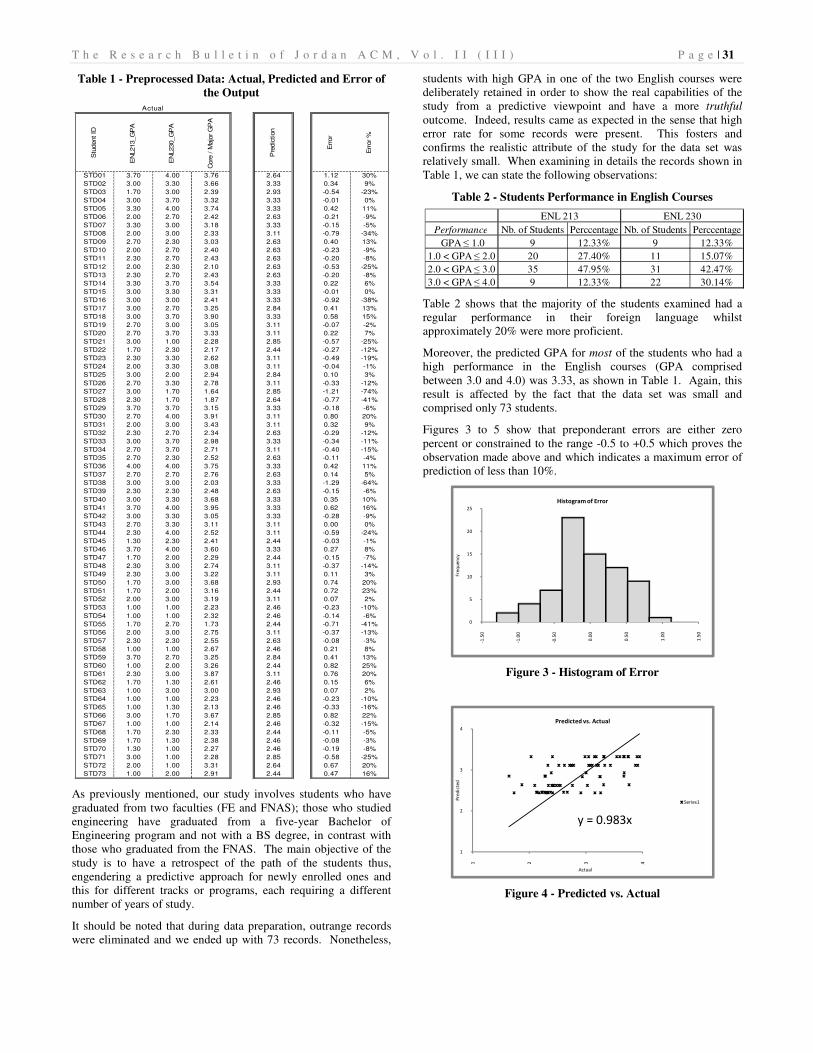
Figures 3 to 5 show that preponderant errors are either zero
percent or constrained to the range -0.5 to +0.5 which proves the
observation made above and which indicates a maximum error of
prediction of less than 10%.
Figure 3 - Histogram of Error
Figure 4 - Predicted vs. Actual
Stu
dent ID
EN
L213_G
PA
EN
L230_G
PA
Core
/ M
ajo
r G
PA
Pre
dic
tion
Error
Err
or
%
STD01 3.70 4.00 3.76 2.64 1.12 30%
STD02 3.00 3.30 3.66 3.33 0.34 9%
STD03 1.70 3.00 2.39 2.93 -0.54 -23%
STD04 3.00 3.70 3.32 3.33 -0.01 0%
STD05 3.30 4.00 3.74 3.33 0.42 11%
STD06 2.00 2.70 2.42 2.63 -0.21 -9%
STD07 3.30 3.00 3.18 3.33 -0.15 -5%
STD08 2.00 3.00 2.33 3.11 -0.79 -34%
STD09 2.70 2.30 3.03 2.63 0.40 13%
STD10 2.00 2.70 2.40 2.63 -0.23 -9%
STD11 2.30 2.70 2.43 2.63 -0.20 -8%
STD12 2.00 2.30 2.10 2.63 -0.53 -25%
STD13 2.30 2.70 2.43 2.63 -0.20 -8%
STD14 3.30 3.70 3.54 3.33 0.22 6%
STD15 3.00 3.30 3.31 3.33 -0.01 0%
STD16 3.00 3.00 2.41 3.33 -0.92 -38%
STD17 3.00 2.70 3.25 2.84 0.41 13%
STD18 3.00 3.70 3.90 3.33 0.58 15%
STD19 2.70 3.00 3.05 3.11 -0.07 -2%
STD20 2.70 3.70 3.33 3.11 0.22 7%
STD21 3.00 1.00 2.28 2.85 -0.57 -25%
STD22 1.70 2.30 2.17 2.44 -0.27 -12%
STD23 2.30 3.30 2.62 3.11 -0.49 -19%
STD24 2.00 3.30 3.08 3.11 -0.04 -1%
STD25 3.00 2.00 2.94 2.84 0.10 3%
STD26 2.70 3.30 2.78 3.11 -0.33 -12%
STD27 3.00 1.70 1.64 2.85 -1.21 -74%
STD28 2.30 1.70 1.87 2.64 -0.77 -41%
STD29 3.70 3.70 3.15 3.33 -0.18 -6%
STD30 2.70 4.00 3.91 3.11 0.80 20%
STD31 2.00 3.00 3.43 3.11 0.32 9%
STD32 2.30 2.70 2.34 2.63 -0.29 -12%
STD33 3.00 3.70 2.98 3.33 -0.34 -11%
STD34 2.70 3.70 2.71 3.11 -0.40 -15%
STD35 2.70 2.30 2.52 2.63 -0.11 -4%
STD36 4.00 4.00 3.75 3.33 0.42 11%
STD37 2.70 2.70 2.76 2.63 0.14 5%
STD38 3.00 3.00 2.03 3.33 -1.29 -64%
STD39 2.30 2.30 2.48 2.63 -0.15 -6%
STD40 3.00 3.30 3.68 3.33 0.35 10%
STD41 3.70 4.00 3.95 3.33 0.62 16%
STD42 3.00 3.30 3.05 3.33 -0.28 -9%
STD43 2.70 3.30 3.11 3.11 0.00 0%
STD44 2.30 4.00 2.52 3.11 -0.59 -24%
STD45 1.30 2.30 2.41 2.44 -0.03 -1%
STD46 3.70 4.00 3.60 3.33 0.27 8%
STD47 1.70 2.00 2.29 2.44 -0.15 -7%
STD48 2.30 3.00 2.74 3.11 -0.37 -14%
STD49 2.30 3.00 3.22 3.11 0.11 3%
STD50 1.70 3.00 3.68 2.93 0.74 20%
STD51 1.70 2.00 3.16 2.44 0.72 23%
STD52 2.00 3.00 3.19 3.11 0.07 2%
STD53 1.00 1.00 2.23 2.46 -0.23 -10%
STD54 1.00 1.00 2.32 2.46 -0.14 -6%
STD55 1.70 2.70 1.73 2.44 -0.71 -41%
STD56 2.00 3.00 2.75 3.11 -0.37 -13%
STD57 2.30 2.30 2.55 2.63 -0.08 -3%
STD58 1.00 1.00 2.67 2.46 0.21 8%
STD59 3.70 2.70 3.25 2.84 0.41 13%
STD60 1.00 2.00 3.26 2.44 0.82 25%
STD61 2.30 3.00 3.87 3.11 0.76 20%
STD62 1.70 1.30 2.61 2.46 0.15 6%
STD63 1.00 3.00 3.00 2.93 0.07 2%
STD64 1.00 1.00 2.23 2.46 -0.23 -10%
STD65 1.00 1.30 2.13 2.46 -0.33 -16%
STD66 3.00 1.70 3.67 2.85 0.82 22%
STD67 1.00 1.00 2.14 2.46 -0.32 -15%
STD68 1.70 2.30 2.33 2.44 -0.11 -5%
STD69 1.70 1.30 2.38 2.46 -0.08 -3%
STD70 1.30 1.00 2.27 2.46 -0.19 -8%
STD71 3.00 1.00 2.28 2.85 -0.58 -25%
STD72 2.00 1.00 3.31 2.64 0.67 20%
STD73 1.00 2.00 2.91 2.44 0.47 16%
Actual
Performance Nb. of Students Perccentage Nb. of Students Perccentage
GPA ≤ 1.0 9 12.33% 9 12.33%
1.0 < GPA ≤ 2.0 20 27.40% 11 15.07%
2.0 < GPA ≤ 3.0 35 47.95% 31 42.47%
3.0 < GPA ≤ 4.0 9 12.33% 22 30.14%
ENL 213 ENL 230
0
5
10
15
20
25
-1.5
0
-1.0
0
-0.5
0
0.0
0
0.5
0
1.0
0
1.5
0
Fre
qu
en
cy
Histogram of Error
y = 0.983x
1
2
3
4
1 2 3 4
Pre
dic
ted
Actual
Predicted vs. Actual
Series1

T h e R e s e a r c h B u l l e t i n o f J o r d a n A C M , V o l . I I ( I I I ) P a g e | 32
Figure 5 - Error vs. Predicted
It is interesting to note that Figure 4 obviously shows that data fits
on a trend line which shows that the predicted values are almost
0.98 or 98.36% of the actual values. This is clearly a satisfying
result that allows us depend on the interpretation to come.
3.3 Data Clustering As mentioned before, Clustering is applied to position elements of
a database into specific groups according to some attributes. In
order to exercise clustering, we referred to one of the most
frequently used algorithm that is the K-Means.
This algorithm uses partitioning of n objects into k sets (clusters)
in such a way that interrelations amongst objects of a given cluster
are maximizedwhile intra-relations, i.e. amongst objects
belonging to different clusters are minimized [30].
The same set of records shown in Table 1 were used with the
difference that grades were applied without preprocessing in the
sense that grades were kept as a decimal number ranging from 0.0
to 4.0. These grades correspond as for the GPA to all letter grades
from F to A+, and thus they demonstrate the students’
performance in a particular course.
Figures6and 7 below show the results of applying the K-Means
algorithm to generate two and three clusters, respectively.
Figure 6 - Two-Cluster Approach
Figure 7– Three-Cluster Approach
Nonetheless, the study has envisaged two, three and four clusters.
The three-cluster approach clearly identifies that students with
high GPA in English courses, are most likely to obtain a high
GPA for the core and major courses pursued in their specialty in
the corresponding FE and FNAS; and vice versa. It should be
also noted that the three-cluster approach allows drawing a clear
line of separation amongst three different categories that could be
referred to as slow, moderate and fast learners.
4. RESULTS’ ANALYSIS AND
INTERPRETATION After applying the aforementioned hybrid algorithm, we can state
the following observations and derive the conclusions below:
• Students who succeeded in mastering their foreign language
(English in our case) were able to achieve a higher GPA when
pursuing their core and major courses for either specialty. This
result has been predicted during the NN algorithm application
stage and confirmed by the achievement of a very low error.
This statement also applies for students who found difficulties
in carrying out satisfactory performance in the English courses.
• The clear-cut three-cluster approach allows advisors better plan
the student’s course load and course choice in an attempt to
improve the student’s performance. This clustering also offers
instructors a good anticipation of the student’s capabilities
during team forming and in-class participation and active
learning.
• The hybrid algorithm will be adopted for the newly enrolled
students in the sense that special attention will be given for
those who get accepted with remedial English courses and/or
exhibit mediocre performance in the ENL 213 and ENL 230
courses.
• These results allow the advisors recommend to students to seek
help through the on-campus English/writing center and/or seek
help during office hours or enroll in extra-curricular activities
that would enhance their English understanding/writing skills.
• A byproduct of this result is to help the administration preview
and more relevant and efficient course offerings as well as
sustaining grants, funds and good academic reputation.
5. CONCLUSION In this paper, we applied a novel hybrid technique based on
Neural Networks and K-Means Clustering dedicated to students
pursuing their higher education path while adopting a foreign
language of instruction and communication. This case is
particularly true in many countries, namely Lebanon.
-1.5
-1
-0.5
0
0.5
1
1.5
0
0.5 1
1.5 2
2.5 3
3.5
Err
or
Predicted
Error vs. Predicted
1.50
2.00
2.50
3.00
3.50
4.00
0.75 1.25 1.75 2.25 2.75 3.25 3.75
Co
re a
nd
Ma
jor
Co
mb
ine
d G
PA
Averaged Grades of ENL 213 and ENL 230
Cluster1
Cluster2
1.50
2.00
2.50
3.00
3.50
4.00
0.75 1.25 1.75 2.25 2.75 3.25 3.75
Co
re a
nd
Ma
jor
Co
mb
ine
d G
PA
Averaged Grades of ENL 213 and ENL 230
Cluster1
Cluster2
Cluster3

T h e R e s e a r c h B u l l e t i n o f J o r d a n A C M , V o l . I I ( I I I ) P a g e | 33
A data set of 200 graduate students was collected amid the
Faculty of Engineering and the Faculty of Natural and Applied
Sciences. NN enabled predicting the student’s performance and
thus fitting him/her in a specific cluster obtained after applying
the K-Means algorithm.
This clustering would serve as a powerful tool by allowing
advisors and instructors identifies his/her capabilities and predict
performance since the early stages of their study.
Finally, a more comprehensive study is being prepared and which
will include more than one thousand records. This will be the
subject of an upcoming research that will attempt broadening the
spectrum of this paper’s objectives by studying different attributes
and targeting new learning-related and performances and goals.
6. REFERENCES [1] Delavari N, BeikzadehM. R, Shirazi M. R. A. (2004). A
New Model for Using Data Mining in Higher Educational
System. Proceedings of 5th International Conference on
Information Technology based Higher Education and
Training: ITEHT ’04, Istanbul, Turkey
[2] Delavari, N., Beikzadeh, M.R. and Amnuaisuk, S. K. (2005).
Application of Enhanced Analysis Model for Data Mining
Processes in Higher Educational System.Proceedings of
ITHET 6th Annual International Conference, Juan Dolio,
Dominican Republic.
[3] DelmaterR., and Handcock M. (2001). Data Mining
Explained: A Manager’s Guide to Customer- Centric
Business Intelligence.Digital Press, Boston.
[4] Frawley, W., Piatetsky-Shapiro, G., and Matheus, C. (1992).
Knowledge Discovery in Databases: An Overview.AI
Magazine.Fall 1992, pp. 213-228.
[5] Han, J. and Kamber M. (2006). Data Mining Concepts and
Techniques. Morgan Kaufmann, pp.4-27.
[6] Luan, J. (2001). Data Mining Applications in Higher
Education.A chapter in the upcoming New Directions for
Institutional Research,1st Ed.Josse-Bass, San Francisco.
[7] Luan, J. (2002). Data Mining and Its Applications in Higher
Education in A. Serban and J. Luan (eds.) Knowledge
Management: Building a Competitive Advantage for Higher
Education. New Directions for Institutional Research. No.
113. San Francisco, CA: Jossey Bass.
[8] Ma, Y., Liu, B., Wong, C. K., Yu, P. S., Lee, S. M. (2000).
Targeting the right students using data mining.Proceedings
of the sixth ACM SIGKDD international conference on
Knowledge discovery and data mining. Boston, pp 457-464.
[9] Ranjan, J. (2008). Impact of Information Technology in
Academia.International Journal of Education Management.
Vol. 22, Issue 5, pp 442-455.
[10] Rubenking, N. (2001). Hidden Messages. PC Magazine,
May 22, 2001. Retrieved 25 October 2008
from:http://www.pcmag.com/article2/0,2817,8637,00.asp.
[11] Sargenti, P., Lightfoot, W. and Kehal, M. (2006). Diffusion
of Knowledge in and through Higher Education
Organizations. Issues in Information Systems, Vol 3, No. 2,
pp 3-8.
[12] Shyamala K. and Rajagopalan S. P. (2006). Data Mining
Model for a better Higher Educational System. Information
Technology Journal. Vol. 5, No. 3, pp 560-564.
[13] Talavera, L. and Gaudioso, E. (2004). Mining Student Data
to Characterize Similar Behavior Groups In Unstructured
Collaboration Spaces. Presented at Workshop on Artificial
Intelligence in Computer Supported Collaborative Learning
at European Conference on Artificial
Intelligence.Valencia,Spain,pp 17-23.
[14] Waiyamai K. (2003). Improving Quality of Graduate
Students by Data Mining. Dept. of Computer Engineering,
Faculty of Engineering, Kasetsart University, Bangkok,
Thailand.
[15] R. Baker, K. Yacef (2010). The State of Educational Data
Mining in 2009: A Review and Future Visions. Journal of
Educational Data Mining.Volume 1, Issue 11: 3– 17.
[16] C. Romero, S. Ventura. Educational Data Mining: A Review
of the State-of-the-Art. IEEE Transaction on Systems, Man,
and Cybernetics, Part C: Applications and Reviews. 40(6),
601-618, 2010.
[17] R. Agrawal, A. Arning, T. Bollinger, M. Mehta, J. Shafer, R.
Srikant. The Quest Data Mining System.Proc. of the 2nd Int'l
Conference on Knowledge Discovery in Databases and Data
Mining. Portland, Oregon, August, 1996.
[18] Eui-Hong (Sam) Han, AnuragSrivastava and Vipin Kumar.
Parallel Formulations of Inductive Classification Learning
Algorithm (1996).
[19] Agrawal, R. Srikant. Fast Algorithms for Mining
Association Rules. Proc. of the 20th Int'l Conference on
Very Large Databases. Santiago, Chile, Sept. 1994.
[20] J. Han, J. Chiang, S. Chee, J. Chen, Q. Chen, S. Cheng, W.
Gong, M. Kamber, K. Koperski, G. Liu, Y. Lu, N.
Stefanovic, L. Winstone, B. Xia, O. R. Zaiane, S. Zhang, H.
Zhu, DBMiner. A System for Data Mining in Relational
Databases and Data Warehouses. Proc. CASCON'97:
Meeting of Minds. Toronto, Canada, November 1997.
[21] Cheung, J. Han, V. T. Ng, A. W. Fu and Y. Fu. A Fast
Distributed Algorithm for Mining Association Rules. Proc.
of 1996 Int'l Conf. on Parallel and Distributed Information
Systems (PDIS'96). Miami Beach, Florida, USA, Dec. 1996.
[22] R. Agrawal, R. Srikant.Mining Sequential Patterns.Proc. of
the Int'l Conference on Data Engineering (ICDE). Taipei,
Taiwan, March 1995.
[23] R. Srikant, R. Agrawal. Mining Sequential Patterns:
Generalizations and Performance Improvements.Proc. of the
Fifth Int'l Conference on Extending Database Technology
(EDBT). Avignon, France, March 1996.
[24] Ron Kohavi, Dan Sommerfield, James Dougherty.Data
Mining using MLC++: A Machine Learning Library in
C++.Tools with AI, 1996.
[25] Bayes, Thomas, and Price, Richard (1763). An Essay
towards solving a Problem in the Doctrine of Chance. By the
late Rev. Mr. Bayes, communicated by Mr. Price, in a letter
to John Canton, M. A. and F. R. S.". Philosophical
Transactions of the Royal Society of London53 (0): 370–418.
doi:10.1098/rstl.1763.0053.
http://www.stat.ucla.edu/history/essay.pdf.
[26] Usama Fayyad, Gregory Piatetsky-Shapiro, and Padhraic
Smyth. From Data Mining to Knowledge Discovery in
Databases. American Association for Artificial Intelligence.
Fall 1996, p 37-54; 0738-4602-1996.
[27] Alan O. Sykes. An Introduction to Regression Analysis.
www.law.uchicago.edu/files/files/20.Sykes_.Regression.pdf
[28] Efraim Turban, Ramesh Sharda, DursunDelen, and David
King. Business Intelligence, Chapter 6. Prentice Hall, 2011.
ISBN: 9780136100669.

T h e R e s e a r c h B u l l e t i n o f J o r d a n A C M , V o l . I I ( I I I ) P a g e | 34
[29] Xianjun Ni (2008). Research of Data Mining Based on
Neural Networks. World Academy of Science, Engineering
and Technology. p. 381-384.
[30] Jiawei Han and MichelineKamber (2006). Data Mining,
Concepts and Techniques. Elsevier, 2nd Edition. ISBN: 978-
1558609013.
[31] www.palisade.com/neuraltools
[32] http://www.palisade.com/downloads/manuals/EN/NeuralToo
ls5_EN.pdf