change in stance tvsl in equity july 27, 2015 tough...
TRANSCRIPT

Ambit Capital and / or its affiliates do and seek to do business including investment banking with companies covered in its research reports. As a result, investors should be aware that Ambit Capital may have a conflict of interest that could affect the objectivity of this report. Investors should not consider this report as the only factor in making their investment decision.
Key financials - standalone
Year to March ( mn) FY13 FY14 FY15 FY16E FY17E
Operating Income 71,693 79,619 100,888 115,682 135,527
EBITDA 4,090 4,781 6,489 8,246 11,278
EBITDA margin 5.7% 6.0% 6.4% 7.1% 8.3%
Adjusted EPS (`) 4.35 5.08 8.4 10.6 15.6
Debt:Equity (x) 0.5 0.3 0.6 0.3 0.0
RoE (%) 17% 18% 26% 28% 33%
P/E 58.1 49.8 30.1 23.8 16.2
Source: Company, Ambit Capital research
Tough road to ‘Victor’y
We build in a market share loss of 70bps (vs nil earlier) for TVS Motor (TVSM) over FY16/17 due to rising competition in scooters (Hero’s upcoming launches in Sep-15 and Honda’s large expansion of 1.2mn units). Several competitive products, Honda’s strong focus executive bike segment and little room for differentiation lead to a modest volume estimate (15k/month for 2HFY16 and 18k/month for FY17) for the upcoming Victor (already delayed). These, together with subdued industry demand and weak margin in 1QFY16 result in a 20%/15% downgrade to our FY16/FY17 EPS estimate and a 17% cut in the TP to `240 (14.5x FY17E EPS, 3% discount to peers). We downgrade to SELL.
Competitive position: WEAK Changes to this position: POSITIVE Rising competition to impact TVSM’s scooter market share The second-largest player, Hero MotoCorp, is focusing heavily on scooters, and channel partners are suggesting impressive product launches; the leader, Honda, is adding a large scooter capacity by 4QFY16 (1.2mn units vs FY15 industry sales of 4.5mn units). Alongside, there is a lack of visibility in TVSM’s scooter launches (no new launch since Scooty Zest in August 2014); thus, we expect TVSM to lose market share in domestic scooters: 33bps in FY16 (14.9%) and 37bps in FY17 (14.5%) vs a gain of 251bps in FY15. Victor – Huge opportunity size remains illusive The executive bike segment (60-65% of domestic motorcycles) offers huge potential but many competitive products leave little scope for differentiation (price/features). TVS not only lacks a product but has had unimpressive launches and has been planning to launch Victor since the last 1.5-2 years (no adequate clarity around delay). Our dealer checks did not indicate any overwhelming customer enthusiasm surrounding Victor. Consequently, we factor in only modest volumes for Victor. Sharp earnings cuts due to weak industry demand and 1QFY16 margin Weak industry demand and scooter market share downgrade make us cut TVSM’s total FY16/FY17volumes by 2%/3%. Similarly, weak margin in 1QFY16 (6.2% vs our estimate of 7.1%; down 36bps QoQ) despite higher volumes and soft commodity prices leads us to sharply downgrade EBITDA margin: FY16 by 110bps to 7.1% and FY17 by 94bps to 8.3%. We cut TVSM’s FY16/FY17 standalone net earnings estimate by 20%/15%. Revised SOTP of `240/share, implying 3% discount (14.5x) to peers We reduce our SOTP valuation to `240 (vs `290). We value the standalone business at `228 (down 19%), implying 14.5x FY17 net earnings, a marginal discount to average multiples of Hero and Bajaj (TVSM’s higher net earnings growth over FY15-17 was offset by its lower RoIC) but at a 10% premium to TVSM’s historical average (due to improving business prospects). Key risks: Strong response to TVS Victor and bikes from BMW tie-up (which can provide large export revenues and market share in domestic premium motorcycles)
CHANGE IN STANCE TVSL IN EQUITY July 27, 2015
TVS Motor CompanySELL
Auto & Auto ancillaries
Recommendation Mcap (bn): `120/US$1.9 3M ADV (mn): `486/US$7.6 CMP: `253 TP (12 mths): `240 Downside (%): 5
Flags Accounting: AMBER Predictability: AMBER Earnings Momentum: AMBER
Catalysts
Market share loss in scooters (33bps in FY16) due to Hero’s new launches
Victor clocking in modest volumes (15k units/month in 2HFY16)
Performance
Source: Bloomberg, Ambit Capital research
90 110 130 150 170 190 210 230
Jul-
14
Aug
-14
Sep-
14O
ct-1
4N
ov-1
4D
ec-1
4
Jan-
15Fe
b-1
5M
ar-1
5A
pr-1
5M
ay-1
5Ju
n-15
Sensex TVS
Analyst Details
Ashvin Shetty, CFA
+91 22 3043 3285
Ritu Modi
+91 22 3043 3292 [email protected]
TVS Motor Company
27 July 2015 Ambit Capital Pvt. Ltd. Page 2
TVS to lose market share in scooters Hero’s growing focus in the scooter space can impact TVSM
Since Hero has not launched any scooter since the introduction of Maestro in 2012, Hero MotoCorp is gearing up for the launch of two new scooters. These scooters are likely to be launched just before the start of the festival season (most likely in September 2015). Out of these, one scooter would be a 110cc full metal body scooter named Duet to compete against the mainstream scooters—Honda’s Activa and TVSM’s Jupiter. The second would be a 125cc scooter named Maestro Edge. Our channel checks with Hero MotoCorp’s dealers indicate a positive feedback on these two models. Dealers indicate that Duet will fill a key product gap – a metal body unisex scooter. Maestro Edge, on the other hand, offers significant improvement over the existing Maestro model in terms of styling and power (125cc vs 110cc). Our discussions with industry sources also suggest a greater focus of Hero’s management on the scooters space. We believe this focus is driven by: (i) rapidly rising share of scooters in the Indian 2W space (from 16% in FY10 to 28% in FY15) where Hero has relatively lower market share (16.7% in FY15); and (ii) increasing market share in scooters can also help offset potential market share loss in domestic motorcycle (where Hero has a dominating market share – 52.9% in FY15).
Noted that TVSM’s market share gains in domestic scooters in FY14 and FY15 had come at the expense of Hero MotoCorp (HMSI’s Activa has only grown from strength to strength over the years). As a result, we believe Hero MotoCorp’s sprucing up of its scooter portfolio can now adversely impact TVSM’s market share.
HMSI’s significant capacity expansion in scooters is worrying
Honda Motorcycles and Scooters India (HMSI) is setting up a new scooter plant in Gujarat with a capacity of 1.2mn units p.a. (HMSI’s existing capacity in India for scooters and motorcycles put together is around 4.6 mn units p.a.). This plant is likely to be operational by 4QFY16. This is a ‘scooter-only’ plant but we believe the net additions to HMSI’s overall scooter capacity may be lower than 1.2mn, as some scooter production from Honda’s other plants would likely be consolidated at this new plant. Honda is keen to protect and grow its dominance in the Indian scooter market. We believe this significant capacity expansion would be a precursor to Honda’s aggressive launches in the scooter segment.
Lack of visibility on TVSM’s new scooter launches
There is no visibility on any new scooter launch from TVSM except for some upgrades (bigger disc brakes, new colours) to Jupiter likely in August 2015. Note that new launches such as Jupiter and Scooty Zest have been instrumental in TVSM clawing back the market share in domestic scooters over FY14 and FY15.
Threat from Bajaj re-entering the scooters space
In 2009, Bajaj Auto exited the scooters market to focus on the domestic motorcycle segment. Since then, despite strong volume growth in the domestic scooter industry, Bajaj has stayed away from the segment. Whilst there is a lot of speculation in the press about Bajaj getting ready to make a re-entry in the segment1, the management has vehemently denied such a move in the near to medium term. If Bajaj were to re-enter the scooter space, it could pose a risk to the market share of incumbents like TVSM.
We now build in a market share loss of 70bps over FY16/FY17
Given the above-mentioned factors, we now expect a market share loss for TVSM in domestic scooters over FY16 and FY17. We expect TVSM to lose market share of 33bps in FY16 to 14.9% and a further 37bps to 14.5% for FY17. This is against our earlier expectation of TVSM maintaining its market share in scooters.
1http://blog.gaadikey.com/bajajs-iconic-chetak-scooter-set-for-re-entry-in-a-modern-gearless-avatar/
Hero’s two new scooter launches in September 2015 – Duet (110cc) and Maestro Edge (125cc) to impact TVSM’s market share
Hero MotoCorp dealers indicate positive feedback on these two models; dealers indicate that Duet will fill a key product gap – a metal body unisex scooter
We expect TVSM’s domestic scooter market share to decline from15.2% in FY15 to 14.9% in FY16 and further to 14.5% in FY17

TVS Motor Company
27 July 2015 Ambit Capital Pvt. Ltd. Page 3
Victor – Huge opportunity but little room for error Opportunity size huge for TVSM’s Victor…
TVSM currently has a negligible presence in the crucial executive bike segment which accounts for nearly 60-65% of the total domestic motorcycle market. TVSM’s earlier launches in this segment viz. Flame, Jive and Phoenix have failed to make a mark. TVSM is slated to re-launch its old brand Victor in this segment in September 2015. Victor will be critical for TVSM to gain a foothold in the executive motorcycle segment
Exhibit 1: Executive segment represents the biggest share of motorcycles
FY11 FY12 FY13 FY14 FY15
Segment Size (mn units) 5.8 6.5 6.5 6.8 6.6
% share of overall market 64.3% 64.7% 64.5% 65.1% 61.8%
Hero MotoCorp 66.7% 68.7% 62.6% 61.0% 66.4%
Bajaj Auto 21.3% 20.1% 20.2% 14.5% 8.3%
HMSI 9.2% 9.3% 14.6% 19.7% 22.3%
TVS 1.1% 0.2% 0.7% 1.3% 0.6%
Others 1.7% 1.6% 1.9% 3.5% 2.3%
Source: SIAM, Company, Ambit Capital research
…but we refrain from building in high numbers for Victor
Victor was the first product developed by TVSM independently from its erstwhile JV partner, Suzuki. The product was launched in August 2001 and proved to be a great initial success, clocking in close to 40,000 units per month in a much smaller motorcycle market back then. However, the product could not sustain its initial success, losing volumes over the years before being discontinued few years ago. Victor commands a good brand name in the marketplace (given sizeable population of Victor motorcycles). However, we expect Victor’s success to be limited due to following factors: a) Crowded segment leaves little room for differentiation
The executive motorcycle segment is heavily crowded, leaving little room for product and pricing differentiation. Hence, it would be imperative for Victor to offer significant differentiation on features/technical aspects or value for money to the customers to prove a game-changer in this segment. This leaves little room for error for Victor.
Exhibit 2: Executive segment is heavily crowded
Sr No Model (company) name Engine (cc) Price ( ) Segment share
Overall domestic MC share
1 Splendor (Hero) 100cc 49,600 38% 24%
2 Passion (Hero) 100 cc 51,200 20% 13%
3 CB Shine (HMSI) 125 cc 55,559 12% 8%
4 Dream Yuga (HMSI) 110 cc 50,989 9% 6%
5 Glamour (Hero) 125 cc 55,925 8% 5%
6 Discover 100M (Bajaj) 100 cc 50,000 5% 3%
7 Super Splendor (Hero) 125 cc 53,600 2% 1%
8 Discover 150S (Bajaj) 150 cc 54,521 1.9% 1%
9 Discover 125M (Bajaj) 125 cc 52,000 1.7% 1%
Source: Company, Ambit Capital research Note: Prices for drum brake alloy wheel models (ex-showroom Delhi)
b) Honda’s focus on executive segment presents additional headwind The executive segment remains the key focus area of HMSI to gain leadership in the motorcycle and the overall Indian 2W market. Consequently, much of HMSI’s product launches and marketing campaigns over the last 2-3 years have been focused around the executive segment in India. Besides HMSI, other MNC players like Suzuki and Yamaha are also focusing heavily on this segment.
The executive bike segment offers huge potential in terms of size but at the same time little scope for differentiation in terms of pricing/features; this leaves little room for Victor to be a game-changer in the segment

TVS Motor Company
27 July 2015 Ambit Capital Pvt. Ltd. Page 4
Exhibit 3: HMSI's focus on executive segment - headwind for Victor's success
FY12 FY13 FY14 FY15 FY16
New launches - Dream Yuga Dream Neo CD 110 Livo
Market share * 9.3% 14.6% 19.7% 22.3% Source: SIAM, Company, Ambit Capital research. Note: * Executive segment
We expect Victor to witness only ‘limited’ success
With the playing field having changed significantly as compared to when Victor was launched in 2001 with significantly larger number of players and much larger number of products, we limit our new Victor sales estimates to average 15k per month units for 2HFY16 and 18k units per month for FY17. These numbers represent only about 2-3% market share for Victor in the executive segment.

TVS Motor Company
27 July 2015 Ambit Capital Pvt. Ltd. Page 5
1QFY16 results – Significantly below expectations 1QFY16 results overview: TVSM’s 1QFY16 results were significantly below our expectations mainly on EBITDA margin. Revenues (including other operating income) grew 14% YoY and were in line with our expectations. Material costs as a percentage of sales declined 70bps YoY but were 61bps higher than our estimates. This led to gross profit and gross margin coming in 2% and 61bps lower than our expectations respectively. The gross margin underperformance coupled with higher-than-expected ‘employee costs’ (by 44bps as a percentage of sales) resulted in EBITDA margin and EBITDA falling short by 84bps and 11% respectively as compared to our estimates. Whilst interest expense came in higher than our expectation, the tax rates came in lower than our expectation (23.5% vs our estimate of 25.0%), resulting in a 13% divergence at the PAT level. Exhibit 4: TVS Motor Company’s 1QFY16 results snapshot
Standalone ( mn) 1QFY16A 1QFY16E Divergence 1QFY15A YoY 4QFY15A QoQ
Net sales 25,907 25,590 1% 22,632 14% 24,089 8%
Other operating income 305 480 -36% 422 -28% 480 -36%
Income from operations 26,212 26,070 1% 23,054 14% 24,569 7%
Cost of goods sold 18,879 18,619 1% 16,767 13% 17,632 7%
As % of sales 72.0% 71.4% 61bps 72.7% (70)bps 71.8% 26bps
Gross profit 7,333 7,451 -2% 6,287 17% 6,937 6%
Gross margin (%) 28.0% 28.6% (61)bps 27.3% 70bps 28.2% (26)bps
Employee expenses 1,558 1,434 9% 1,402 11% 1,358 15%
As % of sales 5.9% 5.5% 44bps 6.1% (14)bps 5.5% 41bps
Other expenses 4,139 4,171 -1% 3,574 16% 3,957 5%
As % of sales 15.8% 16.0% (21)bps 15.5% 29bps 16.1% (32)bps
EBITDA 1,637 1,846 -11% 1,312 25% 1,622 1%
EBITDA margin 6.2% 7.1% (84)bps 5.7% 56bps 6.6% (36)bps
Depreciation/amortisation 422 450 -6% 336 26% 461 -8%
EBIT 1,215 1,396 -13% 976 25% 1,162 5%
EBIT margin 4.6% 5.4% (72)bps 4.2% 40bps 4.7% (9)bps
Other income 96 80 20% 89 8% 92 4%
Interest 130 96 35% 60 119% 127 2%
PBT 1,181 1,380 -14% 1,005 17% 1,127 5%
Tax expenses 278 345 -19% 282 -1% 101 174%
Effective tax rate 23.5% 25.0% (147)bps 28.0% (451)bps 9.0% 1,453bps
Adjusted PAT 903 1,035 -13% 723 25% 1,025 -12%
Source: Company, Ambit Capital research.
Exhibit 5: TVS Motor Company - per vehicle matrix (`)
1QFY16A 1QFY16E Divergence 1QFY15A YoY 4QFY15A QoQ
Vehicles sold 638,115 638,115 0% 603,153 6% 604,285 6%
Net realisation per vehicle 40,600 40,103 1% 37,523 8% 39,864 2%
Raw material costs 29,586 29,178 1% 27,799 6% 29,178 1%
Employee expenses 2,441 2,247 9% 2,324 5% 2,247 9%
Other expenses 6,486 6,537 -1% 5,925 9% 6,547 -1%
EBITDA 2,565 2,893 -11% 2,174 18% 2,685 -4%
Source: Company, Ambit Capital research

TVS Motor Company
27 July 2015 Ambit Capital Pvt. Ltd. Page 6
Weak industry demand and 1QFY16 lead to further volume/margin downgrades Recent industry trends are weaker than our estimate…
Demand for domestic 2W remains subdued, with the domestic motorcycle industry’s volumes declining by 2% YoY in 1QFY16. Scooters continue to grow at a faster pace than motorcycles albeit scooters are also witnessing a moderation in growth (YoY growth of 7.3% for 1QFY16 vs 18.2% seen in 4QFY15). Demand remains challenging particularly in rural areas driven by weak crop prices and moderation in wage growth. Recovery in demand is likely only from 3QFY16, depending upon a normal monsoon scenario playing out.
…leading us to downgrade industry/TVSM’s domestic 2W volumes
We cut down our FY16 domestic motorcycle industry volume growth from 8% earlier to 5% now. For FY17, we maintain our YoY growth of around 10%. In absolute terms, we cut our domestic motorcycle industry volume estimate by 2% for FY16 (to 11.3 mn units) and 3% for FY17 (to 12.5 mn units).
In line with the recent trends, we also moderate our FY16 domestic scooter industry volume growth estimate to 12.5% now from 20% earlier whilst maintaining 18% YoY growth for FY17. In absolute terms, we cut our domestic scooter industry volume estimate by 7% for FY16 (to 5.1 mn units) and 8% for FY17 (to 6.0 mn units).
We downgrade TVSM’s overall domestic 2W volumes by 3% in FY16 and 4% in FY17 due to industry volume downgrade (motorcycles and scooters as discussed above) and market share downgrade in domestic scooters.
Exhibit 6: TVS’s domestic volume downgrade led by industry volume and market share (scooter) downgrades
New Old Change
FY15 FY16E FY17E FY15 FY16E FY17E FY15 FY16E FY17E
Domestic motorcycles Star City 215,778 227,128 211,229 YoY growth 5% -7% Victor - 90,000 216,000 YoY growth NM 140% Premium motorcycles (ex-BMW) 201,591 257,805 297,441 YoY growth 28% 15% Others 250,255 197,622 179,229 YoY growth -21% -9% TVS domestic MC 667,624 772,555 903,899 666,872 776,258 932,378 0% 0% -3%
YoY growth 17% 16% 17% 17% 16% 20% Domestic MC industry 10,743,549 11,333,370 12,466,707 10,727,721 11,585,939 12,860,392 0% -2% -3%
YoY growth 3% 5% 10% 2% 8% 11% TVS market share 6.2% 6.8% 7.3% 6.2% 6.8% 7.3% - - -
Domestic scooters Jupiter 375,099 457,056 528,574 YoY growth 22% 16% Others 309,470 295,970 337,406 YoY growth -4% 14% TVS domestic scooters 684,569 753,026 865,980 685,847 813,537 963,227 0% -7% -10%
YoY growth 50% 10% 15% 50% 19% 18% Domestic scooter industry 4,505,529 5,067,351 5,979,474 4,519,648 5,423,578 6,508,293 0% -7% -8%
YoY growth 25% 12.5% 18.0% 25% 20% 20% TVS market share 15.2% 14.9% 14.5% 15.2% 15.2% 15.1% 2bps (31)bps (62)bps
TVS domestic 2W volumes 2,107,696 2,318,859 2,618,686 2,107,696 2,382,520 2,727,968 0% -3% -4%
YoY growth 20% 10% 13% 20% 13% 14% Source: Ambit Capital research
Domestic 2W industry demand remains subdued, leading us to cut our FY16/FY17 domestic motorcycle and scooter industry volume estimates

TVS Motor Company
27 July 2015 Ambit Capital Pvt. Ltd. Page 7
We moderate our margin estimates to factor in a weak 1QFY16 performance
TVSM’s 1QFY16 margin at 6.2% was significantly below our expectations of 7.1%. The margin was impacted mainly by the higher-than-expected raw material costs (61bps as % of revenues) and employee costs (44bps). Given the much weaker-than-expected margin in 1QFY16 and downgrades to volume/revenue estimates, we cut our FY16 EBITDA margin estimate by 110bps to 7.1% and FY17 by 94bps to 8.3%. Our absolute EBITDA is downgraded by 15% for FY16 and by 12% for FY17.
Exhibit 7: We downgrade our FY16 and FY17 margin estimates sharply
` mn New Old Change
FY16E FY17E FY16E FY17E FY16E FY17E
Revenues 115,682 135,527 118,178 138,044 -2% -2%
EBITDA 8,246 11,278 9,728 12,782 -15% -12%
EBITDA margin 7.1% 8.3% 8.2% 9.3% (110)bps (94)bps
Source: Ambit Capital research.
We continue to expect an improvement in TVSM’s EBITDA margin in FY16/FY17 albeit at a much slower pace than earlier expected. The belief of margin improvement is mainly driven by operating leverage from higher volumes and rising share of more profitable products such as Victor. We expect EBITDA margin to improve by 70bps YoY in FY16 and a further 119 bps in FY17 (see the exhibit below).
Exhibit 8: Operating leverage and better product mix to drive margin improvement but lower than earlier estimates
mn FY14 FY15 FY16E FY17E Remarks
Revenues 79,619 100,888 115,682 135,527
YoY growth 11% 27% 15% 17%
Raw material costs 56,728 72,971 83,291 97,037 Marginal improvement in FY16 on account of favourable impact of Excise duty hike at duty-free Haridwar plant. FY17 benefit from higher mix of more profitable products such as Victor.
YoY growth 9% 29% 14% 17%
as % of sales 71.3% 72.3% 72.0% 71.6%
Employee expenses 4,761 5,854 6,557 7,475
Marginal operating leverage benefits build in FY16/FY17 YoY growth 17% 23% 12% 14%
as % of sales 6.0% 5.8% 5.7% 5.5%
Power & fuel 798 913 1,057 1,215
YoY growth -12% 14% 16% 15%
as % of sales 1.0% 0.9% 0.9% 0.9%
Advertising/marketing + others 5,381 5,614 6,175 6,793 Significant operating leverage benefits in FY15. To continue in FY16 and FY17. YoY growth 17% 4% 10% 10%
as % of sales 6.8% 5.6% 5.3% 5.0%
Packing & freight charges 3,040 4,109 4,712 5,520
YoY growth 28% 35% 15% 17%
as % of sales 3.8% 4.1% 4.1% 4.1%
Other operating expenses 4,129 4,938 5,644 6,208
Marginal operating leverage benefits build in FY16/FY17 YoY growth 13% 20% 12% 10%
as % of sales 5.2% 4.9% 4.7% 4.4%
EBITDA 4,781 6,489 8,246 11,278
YoY growth 17% 36% 27% 37%
EBITDA margin 6.0% 6.4% 7.1% 8.3%
Source: Ambit Capital research.
Despite strong volume/revenue growth, TVSM’s margin has consistently disappointed in the recent quarters, leading us to drastically cut our FY16/FY17 EBITDA margin estimates

TVS Motor Company
27 July 2015 Ambit Capital Pvt. Ltd. Page 8
Key assumptions and estimates Exhibit 9: Key assumptions and estimates FY14 FY15 FY16E FY17E Remarks
Motorcycles (domestic) volume growth 3% 17% 16% 17%
We are factoring in industry volumes to deliver 8% CAGR over FY15-17E. We expect TVSM to increase its market share (by 104bps) over FY15-17E on the back of the new launches such as Victor.
Motorcycles (exports) volume growth 16% 33% 20% 20% We expect strong momentum in export volumes to continue and record 20% CAGR over FY15-17E.
Scooters (domestic + exports) volume growth
8% 49% 10% 15% We expect volume growth for scooter industry to be better than motorcycles. We expect TVSM to lose about 70bps market share over FY16 and FY17.
Mopeds (domestic + exports) volume growth
-8% 5% 6% 7% We expect a modest volume growth of 6% CAGR in mopeds over FY15-17E.
3Ws (dom. + exports) volume growth 64% 34% 16% 16% We expect 3W export growth to remain healthy though moderate on a rising base.
Revenues (` mn) 79,619 100,888 115,682 135,527 We expect revenue growth of 16% for FY15-17E on the back of strong volume growth (13% CAGR over FY15-17E) across categories. YoY growth 11% 27% 15% 17%
EBITDA (` mn) 4,781 6,489 8,246 11,278 We expect improvement in margin on the back of rising volumes and improving product mix. We expect 32% CAGR in absolute EBITDA over FY15-17E.
EBITDA margin 6.0% 6.4% 7.1% 8.3%
EBITDA YoY growth 17% 36% 27% 37%
Adjusted PAT (` mn) 2,411 3,997 5,050 7,399 We expect interest costs to moderate going forward on the back of reduction in debt levels. As a result, the net earnings growth is likely to be higher than the EBITDA growth. We expect net earnings CAGR of 36% over FY15-17E.
Adjusted PAT margin 3.0% 4.0% 4.4% 5.5%
Adjusted EPS (`) 5.1 8.4 10.6 15.6
Adjusted EPS YoY growth 17% 66% 26% 47%
Work cap days (ex-cash) - closing (4) 12 1 1 We expect moderation in working capital in FY16 and FY17 (vs FY15). Work cap days (ex-cash) - average (2) 4 6 1
CFO (post-tax) ( mn) 5,238 848 9,553 8,751 Rising profitability and stable working capital to result in CFO bouncing back strongly in FY16E and FY17E.
Capex (net of sales proceeds) (` mn) 2,580 4,052 3,470 2,033 Capex estimate in line with the management guidance. Inv. in Indonesia and other entities (Gross, before sale of invts) (` mn)
1,370 1,249 1,500 - We expect fund infusion of `1,000mn into TVS Motor Services and `500mn into TVS Indonesia in FY16. No funds infusion thereafter.
FCF (` mn) (ex-sale of investments) 1,288 (4,453) 4,582 6,718 FCF to bounce back strongly from FY16E on the back of increase in CFO outpacing the growth in capex.
Net debt/(cash) ( mn) 4,450 9,651 5,517 111 We expect net debt levels to come down in FY16E and FY17E on the back of positive FCF generation.
Source: Company, Ambit Capital research
Exhibit 10: Change in estimates (` mn)
Standalone New estimates Old estimates Change (%, bps) Remarks
FY16E FY17E FY16E FY17E FY16E FY17E Domestic 2Ws (‘000s) 2,319 2,619 2,383 2,728 -3% -4%
Downgrades to overall volumes across vehicle categories on the back of downgrades to industry volumes (motorcycles and scooters) and market share downgrade in domestic scooters for TVSM.
YoY growth 10% 13% 13% 14% (302)bps (157)bps
Export 2Ws (‘000s) 394 473 391 469 1% 1%
YoY growth 21% 20% 20% 20% 97bps (1)bps 3Ws (‘000s) (domestic + exports) 126 146 126 146 0% 0%
YoY growth 16% 16% 17% 16% (15)bps (15)bps
Total volumes (‘000s) 2,839 3,238 2,900 3,344 -2% -3%
YoY growth 12% 14% 14% 15% (239)bps (127)bps
Revenues (` mn) 115,682 135,527 118,178 138,044 -2% -2% Volume downgrades drive downgrades to revenues.
EBITDA (` mn) 8,246 11,278 9,728 12,782 -15% -12% Changes to margin estimate on the back of downgrades to revenue estimates and much weaker than expected margin in 1QFY16. EBITDA margin 7.1% 8.3% 8.2% 9.3% (110)bps (94)bps
PBT ( mn) 6,733 9,865 8,380 11,554 -20% -15% Downgrades to net earnings on the back of downgrades to EBITDA. PAT (` mn) 5,050 7,399 6,285 8,665 -20% -15%
EPS (`) 10.6 15.6 13.2 18.2 -20% -15%
Source: Ambit Capital research

TVS Motor Company
27 July 2015 Ambit Capital Pvt. Ltd. Page 9
Valuation leaves little on the table – Downgrade to SELL As discussed in the earlier section, we cut our FY16/FY17 net earnings estimates by 20%/15%. This coupled with the downgrade to our long-term margin assumption drives a 19% downgrade to the valuation of the standalone business to `228/share. The valuation implied by our fair valuation is 14.5x FY17E net earnings, which is at a marginal discount (3%) to the historical average commanded by Bajaj Auto and Hero MotoCorp but higher than TVSM’s own historical average. Whilst we expect TVSM’s net earnings growth to be higher than its peers, its RoIC is significantly lower than its peers. As a result, we assign a marginal discount to TVSM’s multiple vs peers despite its higher earnings growth prospects. On the other hand, the premium to TVSM’s own historical average is on account of significant improvement in RoIC vs the earlier years. Our July 2016 SOTP-based target price is revised downwards by 17% to `240/share, implying 5% downside to the current market price. We downgrade our stance on the stock to SELL.
Standalone business downgraded by 19% to `228/TVSM share
We downgrade TVSM’s FY16E and FY17E standalone net earnings by 20% and 15% respectively.
Using a WACC of 15% and terminal growth of 5%, our revised DCF-based valuation for the standalone business (July 2016) is `228/share, 19% lower than the last published valuation (which was `280/share). This revised valuation implies 14.5x FY17E EPS, a premium of 5% to TVSM’s last three-year average but in line with multiple implied by our earlier valuation estimate. Furthermore, our implied multiple for TVSM is at a marginal discount with the multiple we use for Hero MotoCorp and Bajaj Auto.
Whilst we expect TVSM’s net earnings growth (36% CAGR over FY15-17) to be ahead of its peers, Hero MotoCorp (16%) and Bajaj Auto (15%), its RoIC is significantly lower vs peers (FY17 RoIC at 44%% vs average of ~80% for Bajaj Auto and Hero MotoCorp). The reason for TVSM’s lower RoIC vs peers is primarily its lower margin. As a result, we assign a marginal discount to TVSM’s multiples vs peers despite its higher earnings growth prospects.
Exhibit 11: TVSM’s CFO (pre-tax) to EBITDA is likely to be in line with the peers…
Source: Company, Ambit Capital research
Exhibit 12: …however, its RoIC is likely to be lower than peers (Bajaj and Hero) due to lower EBITDA margin
Source: Company, Ambit Capital research
20%
40%
60%
80%
100%
120%
140%
FY12 FY13 FY14 FY15 FY16E FY17E
Bajaj & Hero average TVSM
0%
50%
100%
150%
200%
250%
FY12 FY13 FY14 FY15 FY16E FY17E
Bajaj & Hero average TVSM

TVS Motor Company
27 July 2015 Ambit Capital Pvt. Ltd. Page 10
The downgrade to the standalone business’ valuation by 19% or `52/share is driven by:
(i) Downgrade to the net earnings (FY17 EBITDA and net earnings revised downwards by 12% and 15% respectively);
(ii) `3/share or 1% downgrade arising from our factoring of an equity infusion of `1bn into TVS Motor Services (vs ` NIL earlier) and `500mn into TVS Indonesia (vs. ` NIL earlier) in FY16.
(iii) Downgrade to long-term EBITDA margin assumption by 80bps.
We expect TVSM to post higher than industry growth in FY16 to FY18, as it fills in key product gaps in its portfolio. However, we expect TVSM’s volume growth to align with the industry growth rates from FY19 (CAGR of 9% over FY19-26). We factor in EBITDA margin of 9.0% over the long term for TVSM (higher than the current margin levels as TVSM’s product portfolio improves and volumes stabilises at higher than current levels).
Due to lack of details and pending development of even the first product, we are not factoring in any impact of TVSM’s tie-up with BMW Motorrad in either our earnings estimates or our fair valuation of the stock.
Exhibit 13: FCF profile (standalone)
Source: Ambit Capital research
Exhibit 14: FCF assumptions (standalone) – mn
PV of FCF for forecasting period (FY17- FY26) 57,028
Terminal value 57,407
Enterprise value 114,436
Less: net debt/ (cash) at 31 March 2016 5,517
Implied equity value 108,919
Fully diluted equity shares (mn nos) 475.1
Implied equity value ( /share) 228
Source: Ambit Capital research
TVS Motor Services (`11/TVSM share vs `9 earlier) and Sundaram Auto Components (`1/TVSM share)
Given that TVS Motor Services is a profitable entity, we assign a valuation of 1.0x end-FY16 book value to the equity investment made by TVSM in TVS Motor Services, which amounts to `11/TVSM share. TVSM has infused `1 bn in TVS Motor Services in FY15. We expect further fund infusion of `1 bn in FY16 which would result in cumulative investment of `5.46 bn as at FY16-end. We do not expect any further infusion into TVS Motor Services thereafter.
We also assign `1/TVSM share for TVSM’s investment in Sundaram Auto Components Limited based on 1xFY16-end P/B.
Investments into Indonesia and other entities (NIL/TVSM share)
TVSM has made investments of `5.4bn (equity + preference) into the Indonesia business and other entities (excluding TVS Motor Services) as at end-FY15 (after impairment provision of `1.25 bn). We expect a further infusion of `500mn in FY16 and no further equity infusion thereafter (cumulative investment of `5.49 bn as at FY16-end before impairment provision). Given that Indonesia and other entities continue to make losses, we are not assigning any value to the investments made by (and to be made by) TVSM into these entities. At 1.0x P/B, these investments would have accounted for `12/TVSM share as at end-FY16, which is not considered in our valuation estimate for TVSM.
0%
5%
10%
15%
20%
25%
30%
35%
4,000
4,500
5,000
5,500
6,000
6,500
7,000
FY16
E
FY17
E
FY18
E
FY19
E
FY20
E
FY21
E
FY22
E
FY23
E
FY24
E
FY25
E
FY26
E
PVFF (LHS) (Rs mn) WACC (RHS) RoE

TVS Motor Company
27 July 2015 Ambit Capital Pvt. Ltd. Page 11
Exhibit 15: Key investments by TVSM from the standalone entity
Particulars ( mn) Latest equity stake held by TVSM
FY14 FY15 FY16E FY17E
Indonesian 2W venture (TVS Motor Co. (Europe) B.V. + TVS Motor (Singapore) Pte. Ltd. + PT. TVS Motor Co. Indonesia) 100.0%
5,240 5,490 5,990 5,990
Less: Impairment provision (1,247) (1,247) (1,247) (1,247)
Net Book value 3,993 4,242 4,742 4,742
Energy ventures
TVS Energy Ltd. 4.5% 33 33 33 33
Housing ventures
TVS Housing Ltd. 100.0% 1 1 1 1
Emerald Haven Realty Ltd. 48.8% 400 400 400 400
Net Book value 401 401 401 401
Auto component ventures
Sundaram Auto Comp. Ltd. 100.0% 609 609 609 609
Engine technology
Pinnacle Engines Inc., USA 117 117 117 117
Net Book value 5,152 5,401 5,901 5,901
Net Book value Per TVSM share 11 11 12 12
As % of standalone networth 36% 33% 29% 23%
Source: Company, Ambit Capital research
Overall, we arrive at a one-year forward (July 2016) sum-of-the-parts (SOTP) based valuation of `240/share, which implies 5% downside from the current levels and 17% lower than our last published target price. We change our stance to SELL.
Exhibit 16: SOTP valuation for TVSM (`240/share vs 290 earlier)
Segment Methodology Implied multiple (x) Value ( /TVSM share)
New Old Change
Core business FCF 14.5x FY17 EPS 228 280 -19% Investments in TVS Motor Services and Sundaram Auto Components
P/B 1.0x FY16-end P/B 12 10 22%
Total ( ) 240 290 -17%
Source: Company, Ambit Capital research Consolidated financials impacted by weak performance at TVS Indonesia
TVSM’s consolidated financials have been negatively impacted by the continuing weak performance of the Indonesian subsidiary. Whilst the bottom-line performance of the Indonesian subsidiary improved in FY15, it remained weak, posting a net loss of `975mn. The weak performance at this subsidiary has been offset by the improving performance of the standalone business. Consolidated RoICs improved to 19% in FY15 (vs 11% in FY14) but were still much lower than the 28% RoIC generated by the standalone business.
Consolidated RoICs have been impacted by weak performance at TVS Indonesia
Source: Company, Ambit Capital research
0%
10%
20%
30%
FY11 FY12 FY13 FY14 FY15
ConsolidatedStandalone

TVS Motor Company
27 July 2015 Ambit Capital Pvt. Ltd. Page 12
Relative valuation – TVSM trading in line with peers
On comparative valuation, TVSM (standalone) is trading at 16.2x FY17E net earnings which is line with the multiples commanded by the peers (average of 16.3x for Bajaj and Hero). Whilst we expect TVSM’s net earnings growth (36% CAGR over FY15-17) to be ahead of its peers, Hero MotoCorp (16%) and Bajaj Auto (15%), its RoIC is significantly lower vs peers (FY17 RoIC at 44%% vs average of ~80% for Bajaj Auto and Hero MotoCorp). As a result, we believe TVSM should trade at a marginal discount to the peers. On EV/EBITDA multiple, TVSM (standalone) currently trades in line with peers at 11.5x FY17 EBITDA as compared to the average of 11.4x for Bajaj and Hero.
Exhibit 17: Relative valuation
Mcap EV/EBITDA (x) P/E (x) CAGR (FY14-17E) Price perf (%) RoE
US$ mn FY15 FY16E FY17E FY15 FY16E FY17E Sales EBITDA EPS 3m 1 yr FY15 FY16E
FY17E
India
TVS (standalone)** 1,866 19.9 15.7 11.5 29.9 23.7 16.2 16 32 36 8 76 26 28 33
TVS (consolidated)* 1,866 21.6 15.4 11.3 36.4 25.2 18.9 18 39 39 8 76 26 30 31
Bajaj Auto 11,281 15.9 13.6 11.8 25.7 19.6 16.8 15 16 24 25 19 28 31 31
Hero MotoCorp 8,542 14.8 12.9 11.0 22.9 18.3 15.7 11 16 21 16 6 39 41 40
Average (ex-TVS) 15.3 13.2 11.4 24.3 18.9 16.3
Global
Honda 57,050 9.7 7.8 7.0 13.8 11.4 10.0 6 18 18 (10) 9 8 9 9
Harley 11,970 10.9 11.2 10.5 14.7 14.3 12.5 (4) 2 8 0 (11) 29 31 35
Suzuki 18,867 6.3 5.4 4.9 24.1 19.5 17.0 6 13 19 7 24 7 8 9
Yamaha 7,596 10.3 7.5 6.7 13.7 10.8 9.6 7 24 19 (6) 51 16 17 17
Average 9.3 8.0 7.3 16.6 14.0 12.3
Source: Bloomberg, Ambit Capital research. Note: * indicates consensus estimates; ** indicates Ambit estimates
Cross-cycle valuation – Deserves premium to historical average but current multiples appear stretched
On a cross-cycle EV/EBITDA multiple comparison, TVSM (standalone) is trading at a significant premium to its three-year as well as five-year average EV/EBITDA multiples. Similarly, on a cross-cycle P/E comparison, TVSM (standalone) is trading at a premium of 46% to the three-year and five-year average.
We believe TVSM deserves to trade at a much higher multiple than the historical average P/E multiples due to improved business prospects as compared to the earlier years. All the above factors are likely to result in a nearly 1,700bps improvement in RoIC in FY16/FY17 (average 39%) as compared to the FY11-13 average (22%).
However, our the P/E multiple implied by our fair valuation for the standalone business is 14.5x FY17E EPS, which is higher than the company’s historical averages but which is around 37% lower compared to the current multiple of the stock.
Exhibit 18: Cross-cycle P/E
Source: Bloomberg, Ambit Capital research. Note: P/E bands arrived at using Bloomberg consensus estimates for respective periods
Exhibit 19: Cross-cycle EV/EBITDA
Source: Bloomberg, Ambit Capital research. Note: EV/EBITDA bands arrived at using Bloomberg consensus estimates for respective periods
4 6 8
10 12 14 16 18 20 22 24 26 28 30
Jul-
12
Oct
-12
Jan-
13
Apr
-13
Jul-
13
Oct
-13
Jan-
14
Apr
-14
Jul-
14
Oct
-14
Jan-
15
Apr
-15
Jul-
15
TVS 1-yr fwd P/E Avg P/E
2.0 4.0 6.0 8.0
10.0 12.0 14.0 16.0 18.0
Jul-
12
Oct
-12
Jan-
13
Apr
-13
Jul-
13
Oct
-13
Jan-
14
Apr
-14
Jul-
14
Oct
-14
Jan-
15
Apr
-15
Jul-
15
TVS 1-yr fwd EV/EBITDA Avg EV/EBITDA

TVS Motor Company
27 July 2015 Ambit Capital Pvt. Ltd. Page 13
BMW tie-up benefits: Key risk to our estimates We do not build in any numbers from BMW tie-up
In April 2013, TVSM and BMW Motorrad, the motorcycle division of BMW, signed a long-term cooperation agreement to jointly develop and produce a new series of motorcycles that will cater to the <500cc motorcycle segment, globally. We believe the tie-up presents the following longer-term opportunities for TVSM: Opportunity to develop credible products in the premium motorcycles space: Our discussions with industry sources indicate that: (a) BMW is the driving force behind the technology and product development, whilst TVSM would contribute the manufacturing capabilities for the joint venture; (b) TVS and BMW would have its own vehicle derivatives to be sold through their own distribution channel in India and global markets; TVSM’s derivate would most likely be priced cheaper than BMW; and (c) the first product would be launched by early-CY16.
Currently, the premium motorcycle market in India which starts from 150cc and above is a 1.7 mn units per annum market where TVSM’s market share is low at 8%.
The product development learning from the BMW tie-up can significantly help TVSM develop credible products in the premium motorcycle markets. Together with the volumes, the margin in the 150cc and above motorcycle segment will undoubtedly be higher than that of the lower cc bikes, which can help TVSM’s overall margins.
Potential export revenues for TVSM: BMW Motorrad sold around 123,495 units of >650cc bikes in CY14 and generated revenues of Euro1.7bn (average realisation of Euro13,595/bike or `1.0mn/bike at the current exchange rate). The <500cc bikes can potentially be as large a volume contributor for BMW Motorrad as its current range of >650cc bikes after the company develops a range of products in the <500cc category. Given that all the <500cc motorcycles would be manufactured by TVSM in its plant, there exists a significant long-term export (subcontracting) revenue potential for TVSM.
We have not currently factored in any impact of the tie-up with BMW in our earnings estimates (neither the increase in the market share in the premium motorcycle space nor the export subcontracting revenues from BMW) due to lack of adequate details and pending development of even the first joint product. We believe this tie-up would help TVSM significantly in the premium bike segment and also be a source of potential export revenues.
Stronger-than-expected response to Victor
As discussed earlier, the opportunity size for Victor is huge (the size of the motorcycle segment that it will cater to). However, we believe the margin for error for Victor is very less in the space due to the large number of players, motorcycle models, scope for technical/price differentiation. As a result, we are building in 15k units/per month for 2HFY16 and 18k units/month for FY17 which implies a market share of just about 2-3% in the executive motorcycle segment. A much stronger-than-expected response to Victor can present significant risks to our revenues/earnings/valuation estimates and our stance on the stock.

TVS Motor Company
27 July 2015 Ambit Capital Pvt. Ltd. Page 14
Key catalysts Scooters’ market share to be impacted from Hero’s new launches
We are concerned of Hero’s rising focus in the domestic scooters space. As discussed earlier, Hero is slated to launch two new scooters around September 2015 – a 110cc model called Duet and a 125cc model called Maestro Edge. We expect these competitive launches to impact TVSM’s market share in domestic scooters. We estimate TVSM to lose around 33bps YoY market share in FY16 and a further 37bps market share in FY17 largely to Hero. Furthermore, with Honda adding a large scooter capacity coming by 4QFY16 (1.2 mn units vs FY15 industry sales of 4.5 mn units), we see little threat to Honda’s scooter market share.
Victor witnessing only limited success
Victor will be critical for TVSM to gain a foothold in the executive motorcycle segment. Executive bike segment offers huge potential in terms of size but at the same time little scope for differentiation in terms of pricing/features. This leaves little room for Victor to be a game-changer in the segment. When Victor was initially launched as 110cc in 2001, it was a success, clocking close to 40k units per month. However, the model was not able to sustain its initial success due to product issues, failure of the 125cc model and lack of management efforts to persist with the product. As a result, we factor in only 15k units/month of Victor sales for 2HFY16 and 18k units/month for FY17 which implies a market share of only 2-3% in the executive bike segment.
Exhibit 20: Explanation for our forensic accounting scores on the cover page
Segment Score Comments
Accounting AMBER TVS Motor’s accounting score is in line with the sector average accounting score.
Predictability AMBER Given that automobile companies publish their volume numbers on a monthly basis, generally no significant positive/negative surprises are seen in revenues. However, the margins tend to be less predictable and are generally the source for actual results coming in above/below consensus expectations.
Earnings momentum AMBER Bloomberg shows marginal downgrades to consensus numbers in recent weeks.
Source: Ambit Capital research

TVS Motor Company
27 July 2015 Ambit Capital Pvt. Ltd. Page 15
Appendix – FY15 Annual report analysis FY15 cash conversion impacted by an increase in working capital
Standalone
TVS Motors’ (TVSM’s) cash conversion deteriorated in FY15 with CFO before tax at 37% of EBITDA as against 136% in FY14. This decline was mainly on account of significant YoY increase in working capital. Average working capital days (excluding loans/advances to related parties, cash/current investments, current maturities of borrowings and non-operating provisions such as dividend/dividend tax) increased from negative 2 days as at end-FY14 to positive 4 days as at end-FY15 i.e. an increase of 6 days. As a result, there was a net working capital outflow of `3.85bn in FY15 as against an inflow of `1.61bn in FY14.
Exhibit 21: Cashflow conversion suffered in FY15 due to higher working capital ` mn FY11 FY12 FY13 FY14 FY15
CFO (pre-tax) before working capital 3,826 4,483 4,213 4,859 6,106
Working capital (increase)/ decrease (674) 626 643 1,613 (3,851)
CFO (pre-tax) 3,152 5,109 4,864 6,513 2,255
EBITDA 3,921 4,694 4,090 4,781 6,079
CFO before tax and WC changes as % of EBITDA 98% 96% 103% 102% 100%
CFO before tax post WC changes as % of EBITDA
80% 109% 119% 136% 37%
Source: Company, Ambit Capital research
The end-FY15 working capital saw an increase across most items: (i) Inventory grew by `2.7bn; (ii) Trade receivables increased by `1.7bn; and (iii) loans and advances jumped by `3.1bn. The increases in these line items were offset to some extent by increase in current liabilities of `3.1bn.
A further analysis of the above individual line items indicates that:
(a) Out of the `2.7bn increase in inventory, `1.6bn or 60% of the increase is contributed by an increase in the stock of raw materials, components and work-in-process. Finished goods inventory grew modestly by `761mn mainly on account of increase in scooter inventory of `695 mn.
(b) `3.1bn increase in loans & advances has been driven mainly by increase in VAT receivable (`0.8bn) and excise balances (`1.7 bn). The increase in excise balances is on account of under-utilisation of excise duty paid on inputs towards excise duty payable on the finished goods. This was because for a large part of the year, the excise duty on finished goods was at 8.0% (before surcharge and cess) whereas that on inputs continued to be higher rate of 12% (before surcharge and cess). This resulted in accumulation of excise duty paid on inputs.
Exhibit 22: Inventory and loans and advances saw significant YoY increase
` mn Average days
FY13 FY14 FY15 FY13 FY14 FY15
Inventory 5,097 5,482 8,197 28 24 25
Debtors 3,169 3,341 5,039 14 15 15
Loans & advances 3,253 4,757 7,813 15 18 23
Current liabilities 10,767 13,760 16,869 51 56 55
Provision (ex-Dividend) 739 799 832 4 4 3
Working capital 11 (979) 3,347 2 (2) 4
Source: Company, Ambit Capital research

TVS Motor Company
27 July 2015 Ambit Capital Pvt. Ltd. Page 16
Consolidated
Cash conversion and working capital performance at the consolidated level largely mirrored the trends at the standalone level. CFO before tax as a percentage of EBITDA averaged 40% in FY15 as against 123% in FY14. Average working capital days saw an increase of 6 days YoY and led to a cash outflow of `3.5bn in FY15 (as compared to inflow of `1.4bn in FY14). The reasons for the increase in the working capital at the consolidated level are similar to that at the standalone level.
Exhibit 23: Cashflow conversion impacted by the increase in working capital
` mn FY11 FY12 FY13 FY14 FY15
CFO (pre-tax) before working capital 3,396 4,273 5,423 4,612 5,915
Working capital (increase)/ decrease 90 1,334 (272) 1,388 (3,493)
CFO (pre-tax) 3,485 5,566 5,151 6,000 2,421
EBITDA 3,571 4,591 4,383 4,870 6,029
CFO before tax and WC changes as % of EBITDA 95% 93% 124% 95% 98%
CFO before tax post WC changes as % of EBITDA 98% 121% 118% 123% 40%
Source: Company, Ambit Capital research
Exhibit 24: Working capital impacted by rising inventory and loans and advances
` mn Average days
FY13 FY14 FY15 FY13 FY14 FY15
Inventory 6,358 6,661 10,172 32 28 30
Debtors 3,187 3,529 4,148 14 15 14
Loans & advances 3,600 5,036 8,241 16 19 23
Current liabilities 12,054 14,749 18,036 57 58 58
Provision (ex-Dividend) 1,205 1,348 1,618 6 6 5
Working capital (113) (871) 2,907 (1) (2) 4
Source: Company, Ambit Capital research

TVS Motor Company
27 July 2015 Ambit Capital Pvt. Ltd. Page 17
Capex in FY15 driven by capacity additions
Standalone
At the standalone level, the company incurred a capex of `4.1bn in FY15 (as per the fixed assets schedule). The capex spend for FY15 is higher as compared to the `2.6bn spent in FY14. Major additions in FY15 under fixed assets were to Plant and machinery ( 2.3bn), Buildings (`0.6bn) and Freehold land (`0.4bn). The capex appears to be mostly spent towards an increase in capacities (the installed capacity of the company for 2Ws increased from 2.8mn units p.a. as at end-FY14 to 3.2mn units p.a. as at end-FY15 and that for 3Ws rose from 100k units p.a. as at end-FY14 to 120k units p.a. as at end-FY15. The company has not given separate disclosures regarding the capex incurred on the BMW tie-up.
Exhibit 25: Capex in FY15 driven by capacity additions
` mn FY12 FY13 FY14 FY15
Gross block – opening 19,723 21,545 22,479 24,723
Additions to gross block (a) 2,076 1,245 2,485 3,669
Deletions to gross block 254 310 241 174
Closing gross block 21,545 22,479 24,723 28,218
Increase/(decrease) in CWiP (b) (49) (164) 120 413
Total additions (a+b) 2,027 1,081 2,605 4,082
Source: Company, Ambit Capital research
The average gross block turnover improved from 3.4x in FY14 to 3.8x in FY15 on the back of strong growth in revenues. However, TVSM’s gross block turnover is still lower as compared to that of peers such as Bajaj Auto (average FY15 gross block turnover of 5.3x). The key reason for TVSM’s lower gross block turnover is mainly low capacity utilisation (sales of 2.5mn units in FY15 as against year-end capacity of 3.3mn units). Also, part of the capex has been incurred towards the BMW tie-up, for which no corresponding revenues have been generated, and this could have also negatively affected the gross block turnover for TVSM.
Exhibit 26: Gross block turnover
(x) FY12 FY13 FY14 FY15
TVSM 3.5 3.3 3.4 3.8
Bajaj Auto 5.8 5.6 5.2 5.3
Hero MotoCorp 7.4 6.5 6.4 NA
Source: Company, Ambit Capital research
Consolidated
At the consolidated level, TVSM made additions of `4.2bn in FY15 (vs `2.8bn in FY15) mainly driven by the capex spend in the standalone entity, as explained above. There was deletion of around `0.9bn from the gross block mainly emanating from the sale of land in the Indonesian subsidiary.
Exhibit 27: Consolidated capex largely mirrored standalone capex in FY15
` mn FY12 FY13 FY14 FY15
Gross block – opening 24,449 27,581 30,321 29,952
Additions to gross block 3,388 3,610 4,285 3,873
Deletions to gross block 256 869 4,654 924
Closing gross block 27,581 30,321 29,952 32,902
CWiP 1,857 362 547 1,094
Increase/(decrease) in CWiP 1,281 (1,496) 121 447
Total additions 4,670 2,114 4,406 4,320
Source: Company, Ambit Capital research

TVS Motor Company
27 July 2015 Ambit Capital Pvt. Ltd. Page 18
FY15 investments – mainly into TVS Motor Services Major investments by TVSM in FY15 from the standalone entity are: (i) `249mn as equity investment in its Indonesian subsidiary, namely, PT. TVS Motor Company Indonesia (TVS Indonesia); and (ii) `1bn as preference share investment in the financing company, TVS Motor Services Limited.
Indonesian subsidiary
During FY15, there was a change in the holding structure of PT TVS Motor Company Indonesia (TVS Indonesia). Earlier, TVSM held 100% stake in this subsidiary indirectly through its 100% owned subsidiaries, TVS Motor Company (Europe) B.V. and TVS Motor (Singapore) Pte Limited. TVSM used to directly hold only preference shares in TVS Indonesia. During FY15, preference shares held by TVSM in TVS Indonesia were converted into equity shares. As a result, now TVS directly owns 37.05%% stake in TVS Indonesia, whereas TVS Motor Company (Europe) B.V. and TVS Motor (Singapore) Pte Limited own 24.75% and 38.2%, respectively. The earlier and new holding structures are shown in the below exhibit. The reason for this change in structure is not clear or explained in the annual report.
Exhibit 28: Earlier holding structure
Source: Company, Ambit Capital research
Exhibit 29: New holding structure
Source: Company, Ambit Capital research
The bottom-line performance of the Indonesian subsidiary improved but remained weak in FY15. Whilst revenues increased by 21% YoY, EBITDA improved marginally from a loss of US$9mn in FY14 to a loss of US$8mn in FY15. Using average currency exchange rates for FY14 and FY15, absolute EBITDA loss improved marginally to `500mn in FY15 vs `540mn in FY14. At the net earnings level, there was help from the profit on sale of land of `583mn. Adjusted for this one-time gain, net loss for FY15 stood at `975mn vs loss of `1,399 mn in FY14. Whilst domestic sales volume of TVS Indonesia remained weak (flat YoY), the export volumes increased by 40%. The company continued its focus on exports and shipped more than 16,000 units (out of total 23,300 units) to ASEAN, the Middle East and African countries.
Exhibit 30: Performance of the Indonesian subsidiary
` mn unless specified FY09 FY10 FY11 FY12 FY13 FY14 FY15
Revenues 510 683 854 1,074 999 965 1,167
EBITDA (736) (771) (584) (494) (387) (540) (500)
EBITDA margin -144.3% -112.9% -68.4% -46.0% -38.7% -56.0% -42.9%
Adjusted PAT (813) (1,146) (809) (1,083) (1,140) (1,399) (975)
Net debt 2,260 2,034 1,974 2,138 1,632 NA NA
Networth 855 554 448 29 145 1,153 562
Investments by TVSM * 1,993 2,928 3,524 4,742 4,742 5,240 5,490
Inv. as % of standalone networth 25% 34% 35% 41% 39% 37% 33%
Source: Company, Ambit Capital research Note: * Investments are before impairment provision of Rs1,247mn taken in TVSM’s investments in European holding subsidiary
TVSM invested close to `249mn in Indonesian subsidiary during the year taking its total cumulative investment as at end-FY15 to `5,490mn or 33% of the standalone networth. This investment in FY15 is lower as compared to the `498mn infused in FY14.

TVS Motor Company
27 July 2015 Ambit Capital Pvt. Ltd. Page 19
Exhibit 31: TVSM’s investments into TVS Indonesia
( mn) FY12 FY13 FY14 FY15
Increase in TVS Indonesia capital 869 - 978 249
Funds infused by TVSM directly + indirectly 869 - 498 249
Funds infused by TVS Singapore through debt - - 479 -
Cumulative direct investments by TVSM 4,742 4,742 5,240 5,490
Source: Company, Ambit Capital research
TVS Motor Services
TVSM owns a 19% equity stake in TVS Motor Services. TVS Motor Services is engaged in the business of financing TVSM’s 2Ws (currently financing 25,000 vehicles). A small portion of the business also finances used cars and tractors. TVS Motor Services operates through its subsidiary, TVS Credit Services. As at end-FY14, TVS Credit Services is held 92.14% by TVS Motor Services, 4.63% by HDFC Ltd and 3.24% by PHI Research Pvt Ltd. TVS Credit Services is a profitable entity and generated a PAT of `171mn in FY14 (FY15 financials not yet available). TVSM infused `1,000mn into TVS Motor Services in FY15 (compared to `750mn in FY14). The total loan book size of TVS Motor Services as at end-FY15 was at `27bn.
Exhibit 32: TVSM’s investment in TVS Motor Services ` mn FY12 FY13 FY14 FY15
Investments made during the year 696 250 750 1,000
Cumulative investments 2,460 2,710 3,460 4,460
Source: Company, Ambit Capital research

TVS Motor Company
27 July 2015 Ambit Capital Pvt. Ltd. Page 20
FY15 FCF impacted by lower CFO and higher capex
Standalone
Free cash flow (FCF) in FY15 was impacted by the decline in operating cash flow (due to deterioration in working capital explained earlier) and increase in capex spend during the year. At the standalone level, recurring FCF (post investments but before any non-core assets/investment sales) turned negative `4.6bn during FY15 as compared to positive `1.3 bn in FY14. Negative FCF also necessitated a rise in borrowings of `5.2 bn in FY15. Consequently, the net debt-equity ratio rose from 0.31x as at end-FY14 to 0.59x as at end-FY15.
Consolidated
At the consolidated level, recurring FCF was negative `4.4bn in FY15 as against positive `1.0bn in FY14. Net debt increased by `4.6bn to `10.9bn as at end-FY15. Net debt:equity increased from 0.54x to 0.82x YoY.
Exhibit 33: FCF impacted by lower CFO and higher capex resulting in additional borrowings
` mn unless specified Standalone Consolidated
FY12 FY13 FY14 FY15 FY12 FY13 FY14 FY15
CFO post tax 4,409 4,329 5,238 848 4,827 4,637 4,703 828
Capex 2,027 1,081 2,605 4,082 4,671 1,624 2,844 4,204
Acquistions/investments 2,815 256 1,370 1,336 1,096 250 867 1,077
Recurring FCF (433) 2,992 1,263 (4,570) (940) 2,763 992 (4,453)
Sale of assets 259 85 25 30 261 537 107 771
Sale of investments - - - 152 - - - 152 FCF post non-core asset/investment sales (175) 3,077 1,288 (4,388) (679) 3,300 1,099 (3,530)
Net debt 8,117 6,170 4,450 9,651 11,669 9,885 6,292 10,913
Net worth 11,693 12,247 14,153 16,454 7,253 8,983 11,608 13,246
Net debt-equity (x) 0.69 0.50 0.31 0.59 1.61 1.10 0.54 0.82
Source: Company, Ambit Capital research

TVS Motor Company
27 July 2015 Ambit Capital Pvt. Ltd. Page 21
Other key points Common-size statement
Standalone – Operating leverage plays out; gross margin shrinks
After adjusting for the following one-offs: (i) `130mn insurance claim towards the fire accident received in FY15 and included in other operating revenues; and (ii) write off of technical fees receivable of `540mn included in other miscellaneous expenses: the company posted an EBITDA of `6.49bn in FY15. EBITDA margin stood at 6.4% for FY15 as against 6.0% for FY14.
A common-size analysis of the income statement (after adjusting for the one-offs mentioned above) indicates that:
Raw material costs as a percentage of sales increased from 71.3% of sales in FY14 to 72.3% in FY15, an increase of about 108bps. Packing and freight charges increased by 25bps YoY.
Advertising and marketing expenses declined from 6.8% in FY14 to 5.6% in FY15, a decline of nearly 120bps. Employee expenses declined by 18bps YoY and other expenses declined by 29bps YoY.
Exhibit 34: Operating leverage benefits (advertising spends) negated by higher RM costs
as % of sales change (bps)
FY11 FY12 FY13 FY14 FY15 FY14-15 FY11-15
Revenues ( mn) 62,880 71,262 71,693 79,619 100,888 Raw material costs 73.4% 73.8% 72.5% 71.3% 72.3% 108 (105)
Employee expenses 5.2% 5.2% 5.7% 6.0% 5.8% (18) 61
Power & fuel 1.1% 1.3% 1.3% 1.0% 0.9% (10) (18)
Advertising/marketing 5.8% 4.9% 6.4% 6.8% 5.6% (119) (28)
Packing & freight 3.1% 3.3% 3.3% 3.8% 4.1% 25 97
R&D expenses 1.2% 1.3% 1.4% 1.4% 1.4% (0) 18
Others 3.9% 3.7% 3.7% 3.8% 3.5% (29) (45)
EBITDA margin 6.2% 6.6% 5.7% 6.0% 6.4% 43 20
Source: Company, Ambit Capital research
Related party transactions
No significant change was seen in related party transactions, as shown in the exhibit below. The related party transactions at the consolidated level mainly consist of purchases of aluminium pressure die-castings from the holding company, Sundaram Clayton Limited. However, total purchases from the related parties are not significant (5.3% of total purchases) and have remained more or less constant in FY15 (at 3.9% vs 3.3% of sales in FY14).
Exhibit 35: No significant change in related party transactions (consolidated)
` mn FY11 FY12 FY13 FY14 FY15
Purchase of goods Ultimate holding company (T V Sundram Iyengar & Sons Limited) 3 4 4 5 4
Holding company (Sundaram-Clayton Limited) 1,493 1,642 1,746 2,163 3,130 Fellow subsidiaries (Lucas -TVS Ltd, Lucas Indian Service Ltd, Sundaram Industries Ltd and TVS Electronics Ltd) 270 340 389 447 746
Enterprise over which key management personnel and his relatives have significant influence (Harita-NTI Ltd) 22 22 7 6 7
Purchases from related parties 1,788 2,008 2,145 2,620 3,887
Total purchases of TVSM consolidated 47,478 54,025 53,476 59,032 73,106
Related party purchases as % of total purchases 3.8% 3.7% 4.0% 4.4% 5.3%
Source: Company, Ambit Capital research
TVS Motor Company
27 July 2015 Ambit Capital Pvt. Ltd. Page 22
R&D spends – No significant change
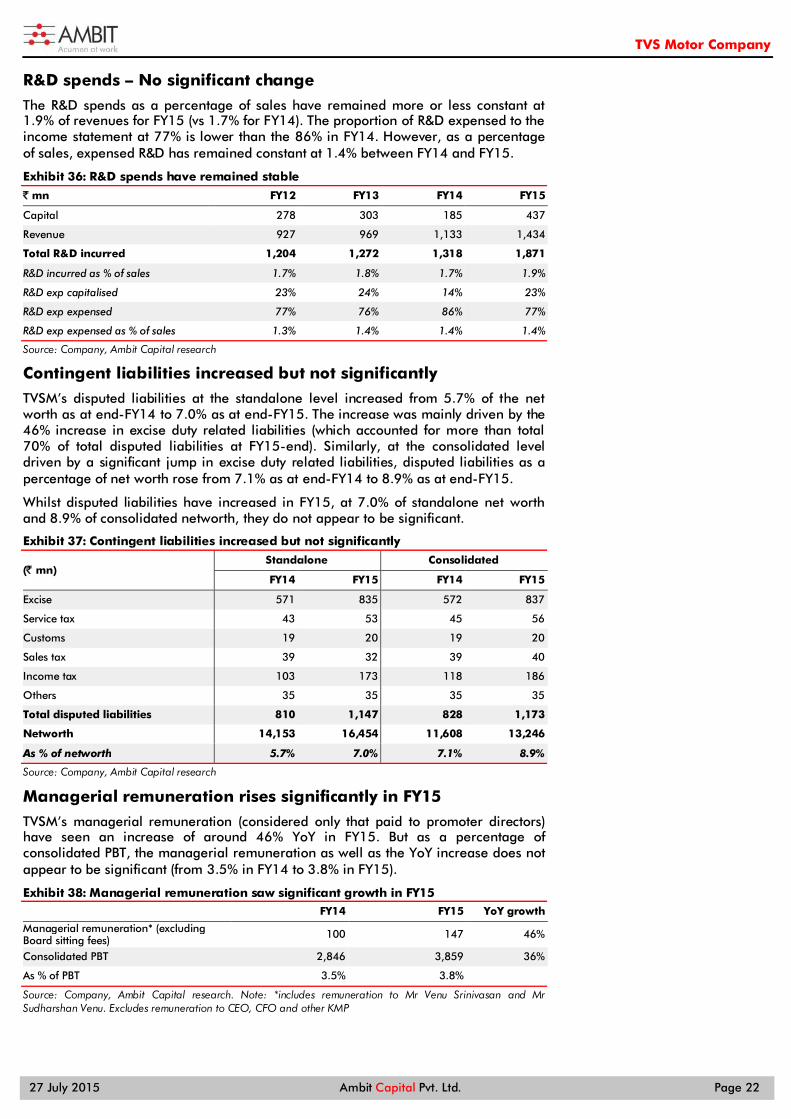
The R&D spends as a percentage of sales have remained more or less constant at 1.9% of revenues for FY15 (vs 1.7% for FY14). The proportion of R&D expensed to the income statement at 77% is lower than the 86% in FY14. However, as a percentage of sales, expensed R&D has remained constant at 1.4% between FY14 and FY15.
Exhibit 36: R&D spends have remained stable
` mn FY12 FY13 FY14 FY15
Capital 278 303 185 437
Revenue 927 969 1,133 1,434
Total R&D incurred 1,204 1,272 1,318 1,871
R&D incurred as % of sales 1.7% 1.8% 1.7% 1.9%
R&D exp capitalised 23% 24% 14% 23%
R&D exp expensed 77% 76% 86% 77%
R&D exp expensed as % of sales 1.3% 1.4% 1.4% 1.4%
Source: Company, Ambit Capital research
Contingent liabilities increased but not significantly
TVSM’s disputed liabilities at the standalone level increased from 5.7% of the net worth as at end-FY14 to 7.0% as at end-FY15. The increase was mainly driven by the 46% increase in excise duty related liabilities (which accounted for more than total 70% of total disputed liabilities at FY15-end). Similarly, at the consolidated level driven by a significant jump in excise duty related liabilities, disputed liabilities as a percentage of net worth rose from 7.1% as at end-FY14 to 8.9% as at end-FY15.
Whilst disputed liabilities have increased in FY15, at 7.0% of standalone net worth and 8.9% of consolidated networth, they do not appear to be significant.
Exhibit 37: Contingent liabilities increased but not significantly
( mn) Standalone Consolidated
FY14 FY15 FY14 FY15
Excise 571 835 572 837
Service tax 43 53 45 56
Customs 19 20 19 20
Sales tax 39 32 39 40
Income tax 103 173 118 186
Others 35 35 35 35
Total disputed liabilities 810 1,147 828 1,173
Networth 14,153 16,454 11,608 13,246
As % of networth 5.7% 7.0% 7.1% 8.9%
Source: Company, Ambit Capital research
Managerial remuneration rises significantly in FY15
TVSM’s managerial remuneration (considered only that paid to promoter directors) have seen an increase of around 46% YoY in FY15. But as a percentage of consolidated PBT, the managerial remuneration as well as the YoY increase does not appear to be significant (from 3.5% in FY14 to 3.8% in FY15).
Exhibit 38: Managerial remuneration saw significant growth in FY15
FY14 FY15 YoY growth
Managerial remuneration* (excluding Board sitting fees) 100 147 46%
Consolidated PBT 2,846 3,859 36%
As % of PBT 3.5% 3.8% Source: Company, Ambit Capital research. Note: *includes remuneration to Mr Venu Srinivasan and Mr Sudharshan Venu. Excludes remuneration to CEO, CFO and other KMP

TVS Motor Company
27 July 2015 Ambit Capital Pvt. Ltd. Page 23
Balance sheet (standalone)
Year to March ( mn) FY13 FY14 FY15 FY16E FY17E
Shareholders' equity 475 475 475 475 475
Reserves and surpluses 11,772 13,678 15,979 19,331 24,467
Total net worth 12,247 14,153 16,454 19,806 24,942
Debt 6,345 5,276 9,705 5,190 3,838
Deferred tax liability 931 1,247 1,528 1,528 1,528
Total liabilities 19,523 20,676 27,686 26,523 30,307
Gross block 22,500 24,723 28,218 31,688 33,721
Net block 10,135 11,257 13,296 15,119 15,353
CWIP 458 544 999 999 999
Investments (non-current) 8,668 8,959 10,125 11,552 11,552
Cash & cash equivalents 175 826 54 (327) 3,727
Debtors 3,169 3,341 5,039 5,777 6,769
Inventory 5,097 5,482 8,197 7,964 9,331
Loans & advances 3,656 5,238 8,334 7,434 8,619
Total current assets 12,095 14,886 21,623 20,848 28,445
Current liabilities 10,767 13,760 16,869 19,342 22,660
Provisions 1,066 1,211 1,488 2,651 3,381
Total current liabilities 11,833 14,971 18,356 21,994 26,041
Net current assets 262 (85) 3,267 (1,145) 2,404
Total assets 19,523 20,676 27,686 26,523 30,307
Source: Company, Ambit Capital research
Income statement (standalone)
Year to March ( mn) FY13 FY14 FY15 FY16E FY17E
Revenues 71,693 79,619 100,888 115,682 135,527
% growth 1% 11% 27% 15% 17%
Operating expenditure 67,602 74,838 94,399 107,436 124,248
EBITDA 4,090 4,781 6,489 8,246 11,278
% growth -13% 17% 36% 27% 37%
Depreciation 1,304 1,317 1,533 1,647 1,799
EBIT 2,786 3,465 4,956 6,599 9,479
Interest expenditure 480 254 274 241 45
Non-operating income 238 302 326 375 431
Adjusted PBT 2,544 3,513 5,008 6,733 9,865
Tax 476 1,101 1,010 1,683 2,466
Adjusted PAT 2,069 2,411 3,997 5,050 7,399
Source: Company, Ambit Capital research

TVS Motor Company
27 July 2015 Ambit Capital Pvt. Ltd. Page 24
Cash flow statement (standalone)
Year to March ( mn) FY13 FY14 FY15 FY16E FY17E
Net profit before tax 1,628 3,485 4,562 6,733 9,865
Depreciation 1,304 1,317 1,533 1,647 1,799
Others 1,281 58 11 (134) (386)
Tax (535) (1,275) (1,407) (1,683) (2,466)
(Incr)/decr in net working capital 643 1,613 (3,851) 2,990 (61)
Cash flow from operations 4,321 5,197 848 9,553 8,751
Capex (net) (995) (2,580) (4,052) (3,470) (2,033)
(Incr)/decr in investments (295) (276) (1,163) (1,427) -
Others 217 257 302 375 431
Cash flow from investments (1,073) (2,598) (4,913) (4,523) (1,602)
Net borrowings (128) (886) 766 (4,515) (1,352)
Interest paid (530) (230) (285) (241) (45)
Dividend paid (715) (690) (831) (656) (1,697)
Cash flow from financing (1,373) (1,806) (350) (5,411) (3,095)
Net change in cash 1,874 793 (4,415) (381) 4,054
Free cash flow 3,077 1,288 (4,453) 4,582 6,718
Source: Company, Ambit Capital research
Ratio analysis (standalone)
Year to March (%) FY13 FY14 FY15 FY16E FY17E
EBITDA margin (%) 5.7% 6.0% 6.4% 7.1% 8.3%
EBIT margin (%) 3.9% 4.4% 4.9% 5.7% 7.0%
Net prof. margin (%) 2.9% 3.0% 4.0% 4.4% 5.5%
Dividend payout ratio (%) 28% 28% 23% 28% 26%
Net debt: equity (x) 0.5 0.3 0.6 0.3 0.0
Average Working capital days (x) 1.7 (2.2) 4.3 5.8 1.0
Gross block turnover (x) 3.3 3.4 3.8 3.9 4.1
RoCE post tax 25% 32% 35% 39% 57%
RoIC (%) 21% 22% 28% 29% 43%
RoE (%) 17% 18% 26% 28% 33%
Source: Company, Ambit Capital research
Valuation parameters (standalone)
Year to March FY13 FY14 FY15 FY16E FY17E
Diluted EPS (`) 4.35 5.08 8.41 10.6 15.6
Book value per share (`) 25.8 29.8 34.6 41.7 52.5
Dividend per share (`) 1.20 1.40 1.90 3.00 4.00
P/E (x) 57.8 49.6 29.9 23.7 16.2
P/BV (x) 9.8 8.4 7.3 6.0 4.8
EV/EBITDA (x) 30.3 25.9 19.1 15.0 11.0
EV/EBIT (x) 44.5 35.8 25.0 18.8 13.1
Source: Company, Ambit Capital research
TVS Motor Company
27 July 2015 Ambit Capital Pvt. Ltd. Page 25
Institutional Equities Team Saurabh Mukherjea, CFA CEO, Institutional Equities (022) 30433174 [email protected]
Research
Analysts Industry Sectors Desk-Phone E-mail
Nitin Bhasin - Head of Research E&C / Infra / Cement / Industrials (022) 30433241 [email protected]
Aadesh Mehta, CFA Banking / Financial Services (022) 30433239 [email protected]
Abhishek Ranganathan, CFA Midcaps (022) 30433085 [email protected]
Achint Bhagat, CFA Cement / Infrastructure (022) 30433178 [email protected]
Aditya Bagul Consumer (022) 30433264 [email protected]
Aditya Khemka Healthcare (022) 30433272 [email protected]
Ashvin Shetty, CFA Automobile (022) 30433285 [email protected]
Bhargav Buddhadev Power Utilities / Capital Goods (022) 30433252 [email protected]
Deepesh Agarwal Power Utilities / Capital Goods (022) 30433275 [email protected] Gaurav Mehta, CFA Strategy / Derivatives Research (022) 30433255 [email protected]
Karan Khanna Strategy (022) 30433251 [email protected]
Pankaj Agarwal, CFA Banking / Financial Services (022) 30433206 [email protected]
Paresh Dave, CFA Healthcare (022) 30433212 [email protected]
Parita Ashar, CFA Metals & Mining / Oil & Gas (022) 30433223 [email protected]
Prashant Mittal, CFA Derivatives (022) 30433218 [email protected]
Rakshit Ranjan, CFA Consumer / Retail (022) 30433201 [email protected]
Ravi Singh Banking / Financial Services (022) 30433181 [email protected]
Ritesh Gupta, CFA Midcaps – Chemical / Retail (022) 30433242 [email protected]
Ritesh Vaidya, CFA Consumer (022) 30433246 [email protected] Ritika Mankar Mukherjee, CFA Economy / Strategy (022) 30433175 [email protected]
Ritu Modi Automobile (022) 30433292 [email protected]
Sagar Rastogi Technology (022) 30433291 [email protected]
Sumit Shekhar Economy / Strategy (022) 30433229 [email protected]
Utsav Mehta, CFA Technology (022) 30433209 [email protected]
Vaibhav Saboo E&C / Infra / Cement / Industrials (022) 30433261 [email protected]
Sales
Name Regions Desk-Phone E-mail
Sarojini Ramachandran - Head of Sales UK +44 (0) 20 7614 8374 [email protected]
Dharmen Shah India / Asia (022) 30433289 [email protected]
Dipti Mehta India / USA (022) 30433053 [email protected]
Hitakshi Mehra India (022) 30433204 [email protected]
Krishnan V India / Asia (022) 30433295 [email protected]
Nityam Shah, CFA USA / Europe (022) 30433259 [email protected]
Parees Purohit, CFA UK / USA (022) 30433169 [email protected]
Praveena Pattabiraman India / Asia (022) 30433268 [email protected]
Shaleen Silori India (022) 30433256 [email protected]
Singapore
Pramod Gubbi, CFA – Director Singapore +65 8606 6476 [email protected]
Shashank Abhisheik Singapore +65 6536 1935 [email protected]
USA / Canada
Ravilochan Pola - CEO Americas +1(646) 361 3107 [email protected]
Production
Sajid Merchant Production (022) 30433247 [email protected]
Sharoz G Hussain Production (022) 30433183 [email protected]
Joel Pereira Editor (022) 30433284 [email protected]
Nikhil Pillai Database (022) 30433265 [email protected]
E&C = Engineering & Construction

TVS Motor Company
27 July 2015 Ambit Capital Pvt. Ltd. Page 26
TVS Motors (TVSL IN, SELL)
Source: Bloomberg, Ambit Capital research
050
100150200250300350
Jul-
12
Sep-
12
Nov
-12
Jan-
13
Mar
-13
May
-13
Jul-
13
Sep-
13
Nov
-13
Jan-
14
Mar
-14
May
-14
Jul-
14
Sep-
14
Nov
-14
Jan-
15
Mar
-15
May
-15
TVS MOTOR CO LTD

TVS Motor Company
27 July 2015 Ambit Capital Pvt. Ltd. Page 27
Explanation of Investment Rating
Investment Rating Expected return (over 12-month)
BUY >10%
SELL <10%
NO STANCE We have forward looking estimates for the stock but we refrain from assigning valuation and recommendation
UNDER REVIEW We will revisit our recommendation, valuation and estimates on the stock following recent events
NOT RATED We do not have any forward looking estimates, valuation or recommendation for the stock
Disclaimer This report or any portion hereof may not be reprinted, sold or redistributed without the written consent of Ambit Capital. AMBIT Capital Research is disseminated and available primarily electronically, and, in some cases, in printed form.
Additional information on recommended securities is available on request.
Disclaimer
1. AMBIT Capital Private Limited (“AMBIT Capital”) and its affiliates are a full service, integrated investment banking, investment advisory and brokerage group. AMBIT Capital is a Stock Broker, Portfolio Manager and Depository Participant registered with Securities and Exchange Board of India Limited (SEBI) and is regulated by SEBI
2. AMBIT Capital makes best endeavours to ensure that the research analyst(s) use current, reliable, comprehensive information and obtain such information from sources which the analyst(s) believes to be reliable. However, such information has not been independently verified by AMBIT Capital and/or the analyst(s) and no representation or warranty, express or implied, is made as to the accuracy or completeness of any information obtained from third parties. The information, opinions, views expressed in this Research Report are those of the research analyst as at the date of this Research Report which are subject to change and do not represent to be an authority on the subject. AMBIT Capital may or may not subscribe to any and/ or all the views expressed herein.
3. This Research Report should be read and relied upon at the sole discretion and risk of the recipient. If you are dissatisfied with the contents of this complimentary Research Report or with the terms of this Disclaimer, your sole and exclusive remedy is to stop using this Research Report and AMBIT Capital or its affiliates shall not be responsible and/ or liable for any direct/consequential loss howsoever directly or indirectly, from any use of this Research Report.
4. If this Research Report is received by any client of AMBIT Capital or its affiliate, the relationship of AMBIT Capital/its affiliate with such client will continue to be governed by the terms and conditions in place between AMBIT Capital/ such affiliate and the client.
5. This Research Report is issued for information only and the 'Buy', 'Sell', or ‘Other Recommendation’ made in this Research Report such should not be construed as an investment advice to any recipient to acquire, subscribe, purchase, sell, dispose of, retain any securities and should not be intended or treated as a substitute for necessary review or validation or any professional advice. Recipients should consider this Research Report as only a single factor in making any investment decisions. This Research Report is not an offer to sell or the solicitation of an offer to purchase or subscribe for any investment or as an official endorsement of any investment.
6. This Research Report is being supplied to you solely for your information and may not be reproduced, redistributed or passed on, directly or indirectly, to any other person or published, copied in whole or in part, for any purpose. Neither this Research Report nor any copy of it may be taken or transmitted or distributed, directly or indirectly within India or into any other country including United States (to US Persons), Canada or Japan or to any resident thereof. The distribution of this Research Report in other jurisdictions may be strictly restricted and/ or prohibited by law or contract, and persons into whose possession this Research Report comes should inform themselves about such restriction and/ or prohibition, and observe any such restrictions and/ or prohibition.
7. Ambit Capital Private Limited is registered as a Research Entity under the SEBI (Research Analysts) Regulations, 2014. Conflict of Interests
8. In the normal course of AMBIT Capital’s business circumstances may arise that could result in the interests of AMBIT Capital conflicting with the interests of clients or one client’s interests conflicting with the interest of another client. AMBIT Capital makes best efforts to ensure that conflicts are identified and managed and that clients’ interests are protected. AMBIT Capital has policies and procedures in place to control the flow and use of non-public, price sensitive information and employees’ personal account trading. Where appropriate and reasonably achievable, AMBIT Capital segregates the activities of staff working in areas where conflicts of interest may arise. However, clients/potential clients of AMBIT Capital should be aware of these possible conflicts of interests and should make informed decisions in relation to AMBIT Capital’s services.
9. AMBIT Capital and/or its affiliates may from time to time have or solicit investment banking, investment advisory and other business relationships with companies covered in this Research Report and may receive compensation for the same.
Additional Disclaimer for U.S. Persons
10. The research report is solely a product of AMBIT Capital 11. AMBIT Capital is the employer of the research analyst(s) who has prepared the research report 12. Any subsequent transactions in securities discussed in the research reports should be effected through Enclave Capital LLC. (“Enclave”). 13. Enclave does not accept or receive any compensation of any kind for the dissemination of the AMBIT Capital research reports. 14. The research analyst(s) preparing the email / Research Report/ attachment is resident outside the United States and is/are not associated persons of any U.S. regulated broker-dealer and that
therefore the analyst(s) is/are not subject to supervision by a U.S. broker-dealer, and is/are not required to satisfy the regulatory licensing requirements of FINRA or required to otherwise comply with U.S. rules or regulations regarding, among other things, communications with a subject company, public appearances and trading securities held by a research analyst account.
15. This report is prepared, approved, published and distributed by the Ambit Capital located outside of the United States (a non-US Group Company”). This report is distributed in the U.S.by Enclave Capital LLC, a U.S. registered broker dealer, on behalf of Ambit Capital only to major U.S. institutional investors (as defined in Rule 15a-6 under the U.S. Securities Exchange Act of 1934 (the “Exchange Act”)) pursuant to the exemption in Rule 15a-6 and any transaction effected by a U.S. customer in the securities described in this report must be effected through Enclave Capital LLC (19 West 44th Street, suite 1700, New York, NY 10036).
16. As of the publication of this report Enclave Capital LLC, does not make a market in the subject securities. 17. This document does not constitute an offer of, or an invitation by or on behalf of Ambit Capital or its affiliates or any other company to any person, to buy or sell any security. The information
contained herein has been obtained from published information and other sources, which Ambit Capital or its Affiliates consider to be reliable. None of Ambit Capital accepts any liability or responsibility whatsoever for the accuracy or completeness of any such information. All estimates, expressions of opinion and other subjective judgments contained herein are made as of the date of this document. Emerging securities markets may be subject to risks significantly higher than more established markets. In particular, the political and economic environment, company practices and market prices and volumes may be subject to significant variations. The ability to assess such risks may also be limited due to significantly lower information quantity and quality. By accepting this document, you agree to be bound by all the foregoing provisions.
Additional Disclaimer for Canadian Persons
18. AMBIT Capital is not registered in the Province of Ontario and /or Province of Québec to trade in securities and/or to provide advice with respect to securities. 19. AMBIT Capital's head office or principal place of business is located in India. 20. All or substantially all of AMBIT Capital's assets may be situated outside of Canada. 21. It may be difficult for enforcing legal rights against AMBIT Capital because of the above. 22. Name and address of AMBIT Capital's agent for service of process in the Province of Ontario is: Torys LLP, 79 Wellington St. W., 30th Floor, Box 270, TD South Tower, Toronto, Ontario M5K 1N2
Canada. 23. Name and address of AMBIT Capital's agent for service of process in the Province of Montréal is Torys Law Firm LLP, 1 Place Ville Marie, Suite 1919 Montréal, Québec H3B 2C3 Canada. Disclosure 24. Ambit and/or its associates have financial interest in TVS Motor and Hero MotoCorp. Analyst Certification Each of the analysts identified in this report certifies, with respect to the companies or securities that the individual analyses, that (1) the views expressed in this report reflect his or her personal views about all of the subject companies and securities and (2) no part of his or her compensation was, is or will be directly or indirectly dependent on the specific recommendations or views expressed in this report. © Copyright 2015 AMBIT Capital Private Limited. All rights reserved.
Ambit Capital Pvt. Ltd. Ambit House, 3rd Floor. 449, Senapati Bapat Marg, Lower Parel, Mumbai 400 013, India. Phone: +91-22-3043 3000 | Fax: +91-22-3043 3100 CIN: U74140MH1997PTC107598 www.ambitcapital.com