chapter 3 discrete random variables and probability...
TRANSCRIPT
Chapter 3Discrete Random Variables and Probability Distributions
Part 4: Special Discrete Random Variable Distributions
Sections 3.7 & 3.8 Geometric, Negative Binomial, Hypergeometric
NOTE: The discrete Poisson distribution (Section 3.9) will be onmidterm exam 2, not midterm exam 1.
1 / 26
Special Discrete Random Variable Distributions
The following special discrete random variable distributions will be onMidterm Exam 1:
Discrete Uniform
Binomial
Geometric
Negative Binomial
Hypergeometric
The only other special discrete random variable we cover, the Poisson, willbe part of Midterm Exam 2, not Midterm Exam 1.
2 / 26
Geometric Distribution
Consider a sequence of independent Bernoulli trials with a successdenoted by S and failure denoted by F with
P (S) = p and P (F ) = 1− p.
Let X = the number of trials until (and including) the first success.
Then, X follows a Geometric Distribution.
The only parameter needed is the probability of a success p.
NOTATION:If X follows a geometric distribution with parameter p (for probabilityof success), we can write
X ∼ Geo(p) for X = 1, 2, 3, . . .
3 / 26
Geometric Distribution
Example (Geometric random variable)
Let X be a geometric random variable with p = 0.25. What is theprobability that X = 4 (i.e. that the first success occurs on the 4th trial)?
ANS: For X to be equal to 4, we must have had 3 failures, and then asuccess.
P (X = 4) =
Definition (Geometric Distribution)
In a series of Bernoulli trials (independent trials with constant probability pof success), let the random variable X denote the number of trials untilthe first success. Then, X is a geometric random variable with parameterp such that 0 < p < 1 and the probability mass function of X is
f(x) = (1− p)x−1p for x = 1, 2, 3, . . .
4 / 26
Geometric Distribution
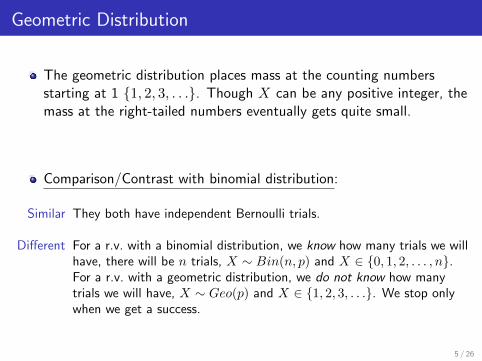
The geometric distribution places mass at the counting numbersstarting at 1 {1, 2, 3, . . .}. Though X can be any positive integer, themass at the right-tailed numbers eventually gets quite small.
Comparison/Contrast with binomial distribution:
Similar They both have independent Bernoulli trials.
Different For a r.v. with a binomial distribution, we know how many trials we willhave, there will be n trials, X ∼ Bin(n, p) and X ∈ {0, 1, 2, . . . , n}.For a r.v. with a geometric distribution, we do not know how manytrials we will have, X ∼ Geo(p) and X ∈ {1, 2, 3, . . .}. We stop onlywhen we get a success.
5 / 26
Geometric Distribution
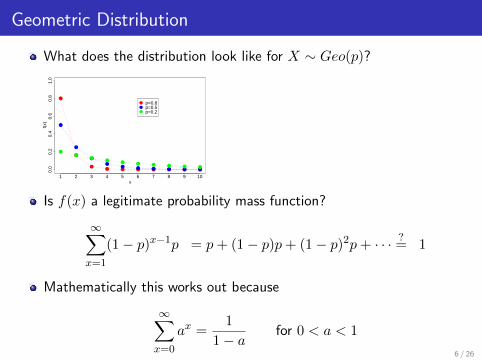
What does the distribution look like for X ∼ Geo(p)?
x
f(x)
1 2 3 4 5 6 7 8 9 10
0.0
0.2
0.4
0.6
0.8
1.0
●
●
●● ● ● ● ● ● ●
●
●
●
●● ● ● ● ● ●
●●
●●
● ● ● ● ● ●
●
●
●
p=0.8p=0.5p=0.2
Is f(x) a legitimate probability mass function?
∞∑x=1
(1− p)x−1p = p+ (1− p)p+ (1− p)2p+ · · · ?= 1
Mathematically this works out because
∞∑x=0
ax =1
1− afor 0 < a < 1
6 / 26
Geometric Distribution
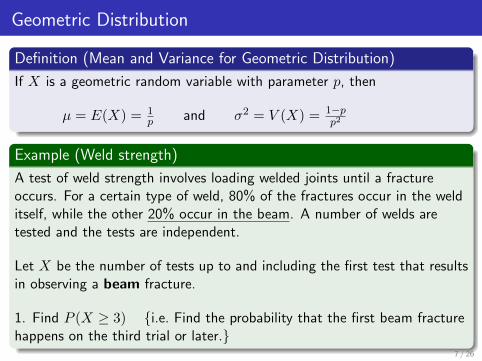
Definition (Mean and Variance for Geometric Distribution)
If X is a geometric random variable with parameter p, then
µ = E(X) = 1p and σ2 = V (X) = 1−p
p2
Example (Weld strength)
A test of weld strength involves loading welded joints until a fractureoccurs. For a certain type of weld, 80% of the fractures occur in the welditself, while the other 20% occur in the beam. A number of welds aretested and the tests are independent.
Let X be the number of tests up to and including the first test that resultsin observing a beam fracture.
1. Find P (X ≥ 3) {i.e. Find the probability that the first beam fracturehappens on the third trial or later.}
7 / 26
Geometric Distribution
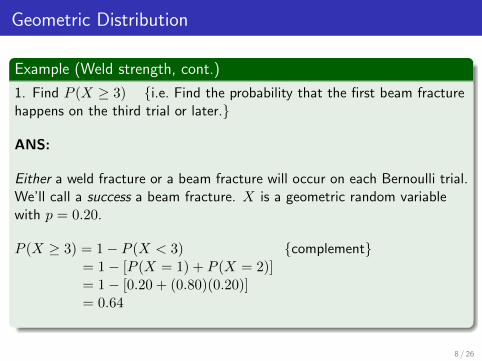
Example (Weld strength, cont.)
1. Find P (X ≥ 3) {i.e. Find the probability that the first beam fracturehappens on the third trial or later.}
ANS:
Either a weld fracture or a beam fracture will occur on each Bernoulli trial.We’ll call a success a beam fracture. X is a geometric random variablewith p = 0.20.
P (X ≥ 3) = 1− P (X < 3) {complement}= 1− [P (X = 1) + P (X = 2)]= 1− [0.20 + (0.80)(0.20)]= 0.64
8 / 26
Geometric Distribution
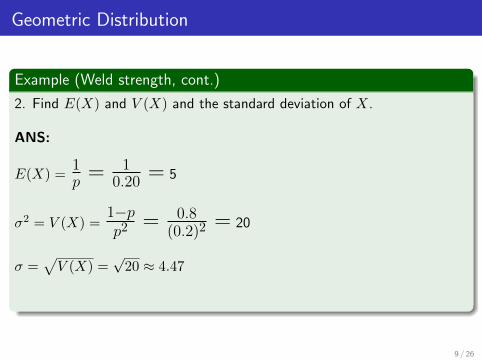
Example (Weld strength, cont.)
2. Find E(X) and V (X) and the standard deviation of X.
ANS:
E(X) =1p =
10.20 = 5
σ2 = V (X) =1−pp2
= 0.8(0.2)2
= 20
σ =√V (X) =
√20 ≈ 4.47
9 / 26
Negative Binomial Distribution
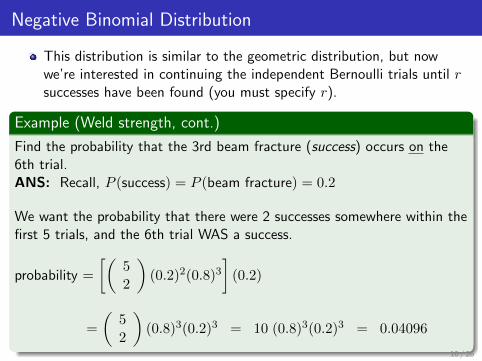
This distribution is similar to the geometric distribution, but nowwe’re interested in continuing the independent Bernoulli trials until rsuccesses have been found (you must specify r).
Example (Weld strength, cont.)
Find the probability that the 3rd beam fracture (success) occurs on the6th trial.ANS: Recall, P (success) = P (beam fracture) = 0.2
We want the probability that there were 2 successes somewhere within thefirst 5 trials, and the 6th trial WAS a success.
probability =
[(52
)(0.2)2(0.8)3
](0.2)
=
(52
)(0.8)3(0.2)3 = 10 (0.8)3(0.2)3 = 0.04096
10 / 26
Negative Binomial Distribution
Definition (Negative Binomial Distribution)
In a series of Bernoulli trials (independent trials with constant probability pof success), let the random variable X denote the number of trials until rsuccesses occur. Then, X is a negative binomial random variable withparameters 0 < p < 1 and r = 1, 2, 3, . . . and the probability mass functionof X is
f(x) =
(x− 1r − 1
)(1− p)x−rpr
for x = r, r + 1, r + 2, . . .
Note that at least r trials are needed to get r successes.
NOTE: the geometric distribution is a special case of the negativebinomial distribution such that r = 1.
11 / 26
Negative Binomial Distribution
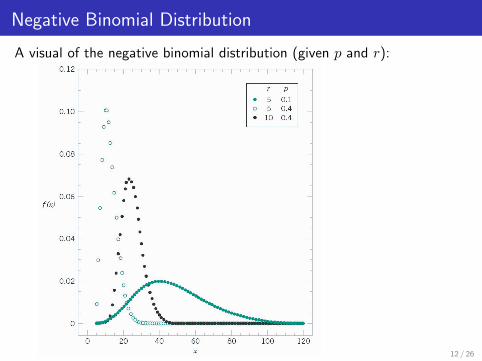
A visual of the negative binomial distribution (given p and r):
12 / 26
Negative Binomial Distribution
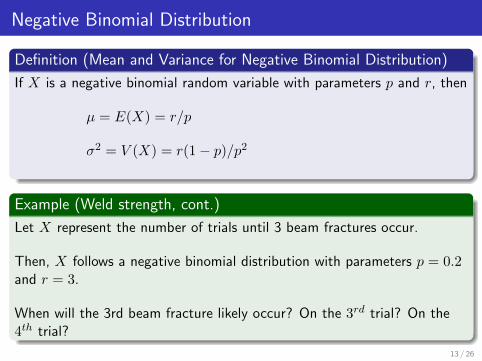
Definition (Mean and Variance for Negative Binomial Distribution)
If X is a negative binomial random variable with parameters p and r, then
µ = E(X) = r/p
σ2 = V (X) = r(1− p)/p2
Example (Weld strength, cont.)
Let X represent the number of trials until 3 beam fractures occur.
Then, X follows a negative binomial distribution with parameters p = 0.2and r = 3.
When will the 3rd beam fracture likely occur? On the 3rd trial? On the4th trial?
13 / 26
Negative Binomial Distribution
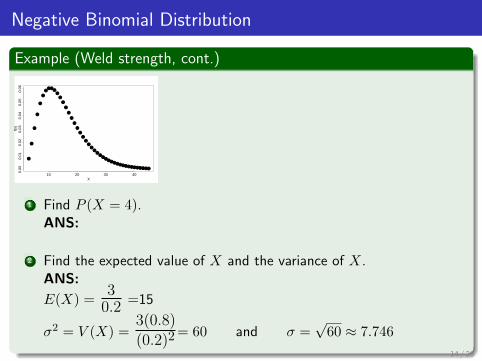
Example (Weld strength, cont.)
●
●
●
●
●
●
●●●
●●
●
●
●
●
●
●
●
●●
●●
●●
●●
●●●●●●●●●●●●●●●●●
10 20 30 40
0.00
0.01
0.02
0.03
0.04
0.05
0.06
X
f(x)
1 Find P (X = 4).ANS:
2 Find the expected value of X and the variance of X.ANS:
E(X) =30.2 =15
σ2 = V (X) =3(0.8)(0.2)2
= 60 and σ =√60 ≈ 7.746
14 / 26
Negative Binomial Distribution
Example (Participants in study)
A pediatrician wishes to recruit 5 couples, each of whom is expecting theirfirst child, to participate in a new natural childbirth regimen.Let p = P (a randomly selected couple agrees to participate).
If p = 0.15, what is the probability that 15 couples must be asked before 5are found who agree to participate? That is, with S = agrees toparticipate, what is the probability that 10 F s occur before the fifth S?
ANS:Let X represent the trial on which the 5th success occurs.
X is a negative binomial r.v. with r = 5 and p = 0.15.
P (X = 15) = f(15) =
(144
)(.85)10.155 = 0.0150
15 / 26
Hypergeometric Distribution
The hypergeometric distribution has many applicationsin finite population sampling.
Drawing from a relatively small population without replacement.
When removing one object from the population of interest affects thenext probability (this is in contrast to sequential trials for thebinomial which had independent draws, where the probability of asuccess remained constant at p).
When sequential draws are not independent, the probability dependson what occurred in earlier draws.
16 / 26
Hypergeometric Distribution
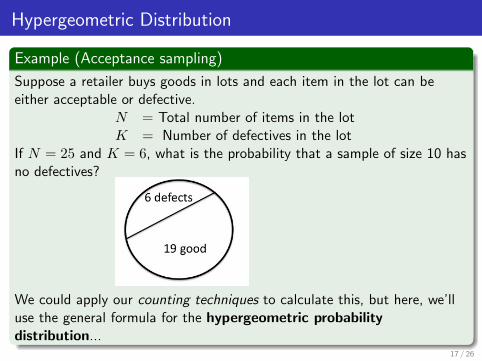
Example (Acceptance sampling)
Suppose a retailer buys goods in lots and each item in the lot can beeither acceptable or defective.
N = Total number of items in the lotK = Number of defectives in the lot
If N = 25 and K = 6, what is the probability that a sample of size 10 hasno defectives?
We could apply our counting techniques to calculate this, but here, we’lluse the general formula for the hypergeometric probabilitydistribution...
17 / 26
Hypergeometric Distribution
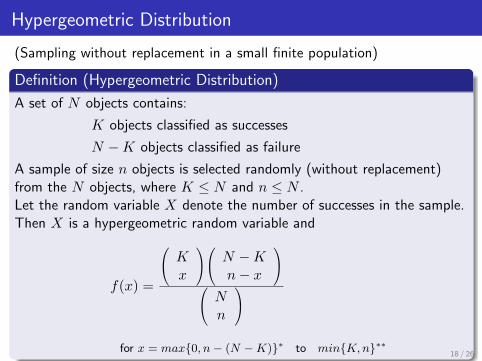
(Sampling without replacement in a small finite population)
Definition (Hypergeometric Distribution)
A set of N objects contains:
K objects classified as successes
N −K objects classified as failure
A sample of size n objects is selected randomly (without replacement)from the N objects, where K ≤ N and n ≤ N .Let the random variable X denote the number of successes in the sample.Then X is a hypergeometric random variable and
f(x) =
Kx
N −Kn− x
Nn
for x = max{0, n− (N −K)}∗ to min{K,n}∗∗
18 / 26
Hypergeometric Distribution
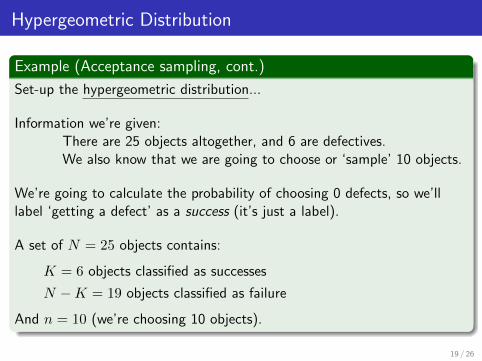
Example (Acceptance sampling, cont.)
Set-up the hypergeometric distribution...
Information we’re given:There are 25 objects altogether, and 6 are defectives.We also know that we are going to choose or ‘sample’ 10 objects.
We’re going to calculate the probability of choosing 0 defects, so we’lllabel ‘getting a defect’ as a success (it’s just a label).
A set of N = 25 objects contains:
K = 6 objects classified as successes
N −K = 19 objects classified as failure
And n = 10 (we’re choosing 10 objects).
19 / 26
Hypergeometric Distribution
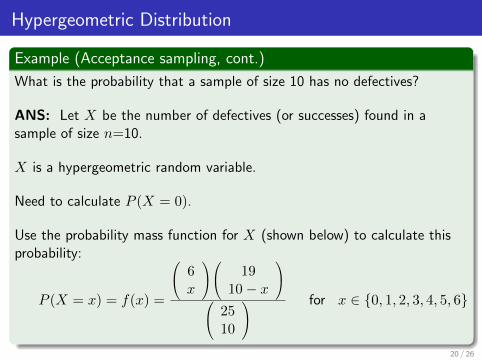
Example (Acceptance sampling, cont.)
What is the probability that a sample of size 10 has no defectives?
ANS: Let X be the number of defectives (or successes) found in asample of size n=10.
X is a hypergeometric random variable.
Need to calculate P (X = 0).
Use the probability mass function for X (shown below) to calculate thisprobability:
P (X = x) = f(x) =
6x
1910− x
25
10
for x ∈ {0, 1, 2, 3, 4, 5, 6}
20 / 26
Hypergeometric Distribution
Example (Acceptance sampling, cont.)
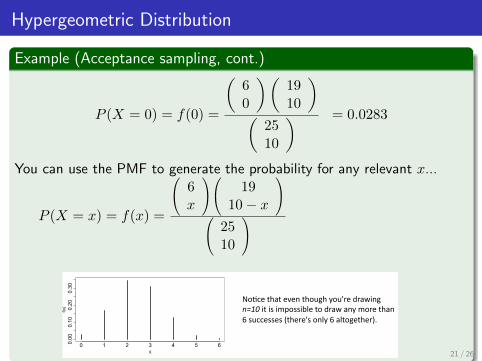
P (X = 0) = f(0) =
(60
)(1910
)(
2510
) = 0.0283
You can use the PMF to generate the probability for any relevant x...
P (X = x) = f(x) =
6x
1910− x
25
10
0 1 2 3 4 5 60.00
0.10
0.20
0.30
X
f(x)
No#cethateventhoughyou'redrawingn=10itisimpossibletodrawanymorethan6successes(there'sonly6altogether).
21 / 26
Hypergeometric Distribution
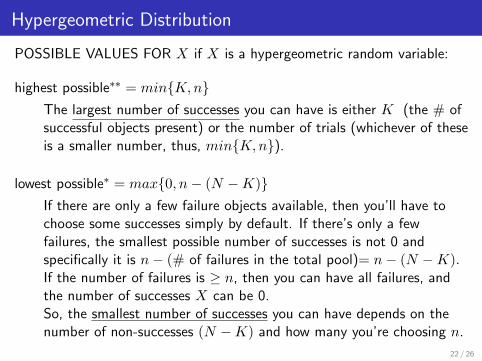
POSSIBLE VALUES FOR X if X is a hypergeometric random variable:
highest possible∗∗ = min{K,n}The largest number of successes you can have is either K (the # ofsuccessful objects present) or the number of trials (whichever of theseis a smaller number, thus, min{K,n}).
lowest possible∗ = max{0, n− (N −K)}If there are only a few failure objects available, then you’ll have tochoose some successes simply by default. If there’s only a fewfailures, the smallest possible number of successes is not 0 andspecifically it is n− (# of failures in the total pool)= n− (N −K).If the number of failures is ≥ n, then you can have all failures, andthe number of successes X can be 0.So, the smallest number of successes you can have depends on thenumber of non-successes (N −K) and how many you’re choosing n.
22 / 26
Hypergeometric Distribution
Example (Acceptance sampling, cont.)
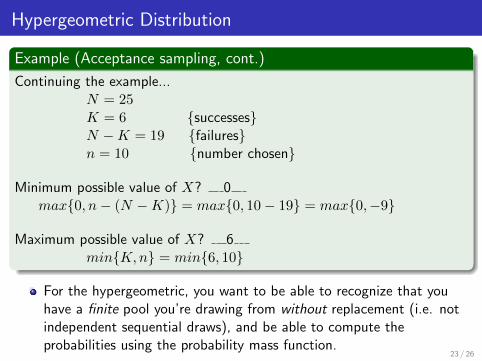
Continuing the example...N = 25K = 6 {successes}N −K = 19 {failures}n = 10 {number chosen}
Minimum possible value of X? 0max{0, n− (N −K)} = max{0, 10− 19} = max{0,−9}
Maximum possible value of X? 6min{K,n} = min{6, 10}
For the hypergeometric, you want to be able to recognize that youhave a finite pool you’re drawing from without replacement (i.e. notindependent sequential draws), and be able to compute theprobabilities using the probability mass function.
23 / 26
Hypergeometric Distribution
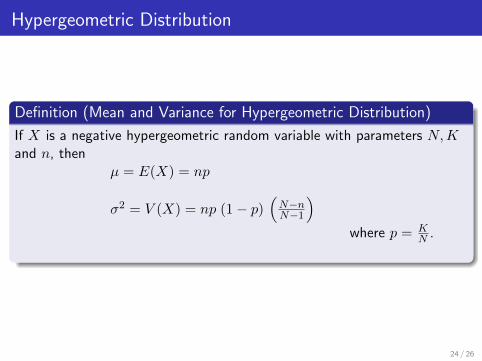
Definition (Mean and Variance for Hypergeometric Distribution)
If X is a negative hypergeometric random variable with parameters N,Kand n, then
µ = E(X) = np
σ2 = V (X) = np (1− p)(N−nN−1
)where p = K
N .
24 / 26
Hypergeometric Distribution
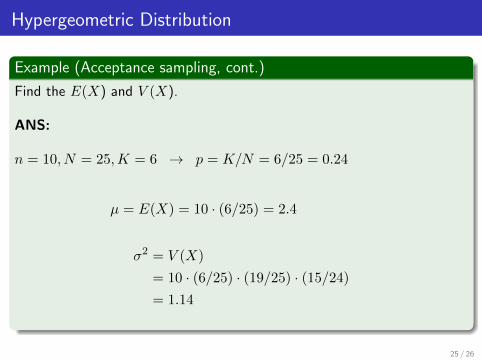
Example (Acceptance sampling, cont.)
Find the E(X) and V (X).
ANS:
n = 10, N = 25,K = 6 → p = K/N = 6/25 = 0.24
µ = E(X) = 10 · (6/25) = 2.4
σ2 = V (X)
= 10 · (6/25) · (19/25) · (15/24)= 1.14
25 / 26
Poisson Distribution
Section 3.9 Poisson Distribution
This discrete distribution will not be on Midterm Exam 1, but it will be onMidterm Exam 2 instead.
26 / 26