chapter 3 technolog - princeton
TRANSCRIPT

Chapter 3
Technology and WasteReduction Decisions

PageIntroduction. . . . . . . . . . . . . . . . . . . . . . . . . . . . . . . . . . . . . . . . . . . . . . . . . . . . . . . 77The Spectrum ofApproaches . . . . . . . . . . . . . . . . . . . . . . . . . . . . . . . . . . . . . . . . 78
Five Broad Approaches to Waste Reduction . . . . . . . . . . . . . . . . . . . . . . . . . . 78Selection and Implementation ofWaste Reduction Approaches . . . . . . . . . 83The Investment-Uncertainty Barrier . . . . . . . . . . . . . . . . . . . . . . . . . . . . . . . . . 84
Ilhstrations ofWaste Reduction . . . . . . . . . . . . . . . . . . . . . . . . . . . . . . . . . . . . . . 85A Growing Literature . . . . . . . . . . . . . . . . . . . . . . . . . . . . . . . . . . . . . . . . . . . . . 85Generic Waste Reduction Opportunities . . . . . . . . . . . . . . . . . . . . . . . . . . . . . 87The Limits of Examples . . . . . . . . . . . . . . . . . . . . . . . . . . . . . . . . . . . . . . . . . . . 91
Industry Decisionmaking About Waste Reduction. . . . . . . . . . . . . . . . . . . . . . . g2Conducting aWaste Reduction Audit . . . . . . . . . . . . . . . . . . . . . . . . . . . . . . . 92Constraints and Incentives Affecting Waste Reduction Decisions . . . . . . . . 94
H o w M u c h W a s t e R e d u c t i o n I m p o s s i b l e . . . . . . . . . . . . . . . . . . . . . . . . . . . . . . . 1 0 3W h y P e o p l e A s k T h i s Q u e s t i o n . . , . . . . . . . . . . . . . . . . . . . . . , . . . . . . . . . . . . 1 0 3Why Forecasts are Uncertain.. . . . . . . . . . . . . . . . . . . . . . . . . . . . . . . . ......103Limited Expertise Problem . . . . . . . . . . . . . . . . . . . . . . . . . . . . . . . . . . . . . . . . .104Facility Siting Bias.. . . . . . . . . . . . . . . . . . . . . . . . . . . . . . . . . . . . ...........104Diffusion of and Access to Waste Reduction Technology . . . . . . ...,.....104Compet i t ion l ? rom Waste Management Al ternat ives . . . . . . . . . . . . . . . . , . . 105Review occurrent Forecasts . . . . . . . . . . . . . . . . . . . . . . . . . . . . . . . . . . . ....106
Conclusions . . . . . . . . . . . . . . . . . . . . . .,, .,.....0 . . . . . . . . . . . . . . . . . . . . ...109
Tables
Table No. Page3-1.3-2.3-3.
3-4.
Box3-A,
3-B.
3-C.
3-D.
3-E,
3-F.
1
Waste Reduction Case Studies . . . . . . . . . . . . . . . . . . . . . . . . . . . . . . . . . . . . 86Some Commercial Sources of Solvent Recovery Equipment. . . . . . . . . . . 88Potential for Waste Reduction Opportunities AcrossDifferent Industry Types. ....,.... . . . . . . . . . . . . . . . . . . . . . . . . . . . . . . . 95Sta te In format ion Re la ted to Waste Reduct ion . . . . . . . . . . . . . . . . . . . . . . 107
Boxes
Vo. PageWaste Reduction by In-Process Recycling: Countercurrent Rinsingand Recycling of Caustic Soda From Thread Mercerization . . . . . . . . . . 79Waste Reduction Through Process Technology and EquipmentChanges: Plastic Media Paint Stripping . . . . . . . . . . . . . . . . . . . . . . . . . . . 80Waste Reduction Through Changes in Plant Operations:More Efficient Materials Handling . . . . . . . . . . . . . . . . . . . . . . . . . . . . . . . 81Waste Reduction Through Changes in Process Inputs: Substitution ofWater-Based Inks for Organic Solvent*Based Inks imprinting.. . . . . . . . 82Why Companies Fear Adverse Affection Product Quality ResultingFrom Waste Reduction. . . . . . . . . . . . . . . . . . . . . . . . . . . . . . . . . . . . . . . . . . 83Possibilities for Reduction of Hazardous Waste From Manufacture ofAcrylonitrile . . . . . . . . . . .......+. . . . . . . . . . . . . . . . . . . . . . . . . . . . . . . . . 90

Chapter 3
Technology and Waste Reduction Decisions
INTRODUCTION
The goals of this chapter are to discuss fac-tors affecting the use of technology for wastereduction and to examine the scope, diversity,and applicability of waste reduction practices.
No attempt is made to give a comprehensivedescription of proven or potentially effectivewaste reduction methods for different indus-tries, processes, or wastes. Not only are theremany thousands of industrial processes andwastes, but there are also important plant-specific constraints of both a technical and eco-nomic nature to waste reduction. Examples ofsuccessful waste reduction methods, are in-structive, but technologies that are effective inone case may not be applicable for reductionof other hazardous wastes.
It is important to see waste reduction as partof the broader picture of industrial product andprocess improvement, modernization, innova-tion, and expansion, not simply as a means toenvironmental protection. Waste reduction ismore accurately thought of as being related to,dependent on, and a contributing cause of allthose steps that a ~ompany takes to remain com-petitive and profitable. It is just as sensible toask whether, and to what degree a company re-duces hazardous waste as it is to ask how muchR&D, energy conservation, or productivity im-provement the company carries out, what itsaccomplishments have been, and how these fac-tors affect competitiveness and profitability.
The phrase waste reduction technology in it-self can be misleading; the phrase deals morewith a goal of technology than with its techni-cal content. Some actions taken toward this goalmay be related solely to waste reduction, butmost will be intimately related to productiontechnologies, activities, or materials which havesome capability for reducing waste without thatbeing their primary function—that of makinga profitable product that satisfies customer re-quirements. Waste reduction methods, there-
fore, encompass a vast array of techniques andactions that are useful and beneficial in waysthat frequently go beyond waste reduction.Waste reduction can be thought of as a criterionto assess almost any industrial production tech-nology rather than as a unique technology, amachine, or even a field of expertise.
Two major implications arise from this con-clusion. First, the selection of waste reductiontechnology requires a great deal of knowledgeabout the specific waste generating situation.This expertise has little to do with pollution con-trol technology but everything to do with pro-duction processes, plant operations, and endproducts. The worker on the plant floor, themanager of the plant, the design engineer, thelaboratory researcher, the purchasing agent,and everybody else who has a hand in produc-tion can see or explore opportunities to reducewaste—if they have been made aware of theneed to do so. Waste reduction techniques runthe spectrum from simple changes in day-to-day operations to wholesale redesign of proc-ess technology or end product. Therefore, eventhough waste reduction is generally seen solelyas an environmental protection activity, it isnot. Waste reduction serves environmental pro-tection goals, but it is fundamentally an im-provement in production with beneficial effectsthat may be widespread.
People outside of industry who are interestedin waste reduction and have experience in theenvironmental area may take a narrow viewof waste reduction; frequently they neither havefamiliarity with front-end industrial productiontechnologies and techniques, nor with their lim-itations and opportunities. Conversely, produc-tion people may not have paid much attentionto the environmental developments that havemotivated the call for waste reduction. There-fore, making waste reduction a goal, motivatingand rewarding behavior that reduces waste, and
77

78 ● Serious Reduction of Hazardous Waste
setting up an organizational structure that en-courages thorough examination of waste reduc-tion opportunities are just as important as se-lecting or designing waste reduction hardware.
Second, whenever something is done for thepurpose of waste reduction, there are likely tobe other consequences; these maybe just as sig-nificant, if not more so, than waste reductionitself. For example, worker productivity mayincrease as a result of one waste reduction ac-tion; product quality might decrease as a re-sult of another action, For each plant, there arecosts, benefits, and site-specific constraints towaste reduction which cannot be completelypredicted from experiences at other plants. Thefeasibility of waste reduction is embedded inthe entire production system in which it musttake place.
What all this means is that waste reductionactivities are very open-ended and very diffi-cult to describe or assess comprehensively. Afurther implication is that certain activities (dis-
cussed in detail elsewhere) often related to tech-nology use and assessment are not easily under-taken for waste reduction. These include: 1)forecasting, even approximately, how muchwaste reduction is technically feasible for theNation, industries, or a specific operation; andZ) suggesting how the government might re-quire companies to achieve a given level ofwaste reduction,
On the other hand, when the production con-text and purpose of waste reduction are under-stood, it becomes clear that there are numer-ous opportunities to reduce waste. How muchwaste reduction is achievable depends both onhow much attention is given to it and on theamount of waste reduction technology that ex-ists. Human factors, organizational structureof companies and government policies all havecritical roles in waste reduction decisions. Suc-cess in reducing waste begins with human per-ceptions of need and requires an examinationof a myriad of opportunities.
THE SPECTRUM OF APPROACHES
Five Broad Approaches to Waste Reduction
Developing a scheme to group the technicalapproachs to waste reduction is important be-cause the range is so great, There are severalways to do this. OTA has chosen a scheme thatemphasizes opportunities and approaches forwaste reduction rather than types of industriesor wastes, Five broad approaches that are appli-cable to almost all industrial operations havebeen used,’ The following list gives these ap-proaches in order of decreasing importance tothe respondents to OTA’S industry survey (seeapp. A).
Approach 1: In-Process Recycling
Potential wastes, or their components, canbe returned for reuse within existing operations
‘For example, the five approaches can be applied to farmingand mining. Pesticide runoff can be reduced by using a biologi-cal rather than a chemical method of pest control. Changing min-ing operations can prevent leachate from polluting nearby sur-face water.
(see box 3-A). This approach is more applica-ble to liquid waste streams than to solids,sludges, or gases. Recycling as a means of wastereduction is an integral part of the productionprocess.’ For example, at a Du Pent plant mak-ing Freon, hydrochloric acid waste was elimi-nated by installing a $16 million conversion unitto change anhydrous hydrogen chloride intochlorine, which is recycled back into the proc-ess, and hydrogen, which is used as a fuel inthe plants Carrier Air Conditioning Co. collects
—.—— _.——ZThis should not be interpreted too narrowly. In some cases,
such as a plant that produces a chemical, recycling a waste orits component is physically a part of the operation; that is, pipescan move waste from one end of the plant to a point near thefront end in a closed-loop system. However, in other cases suchas paint stripping or vehicle maintenance, recycling of a sol-vent or motor oil may take place within the same building, ata separate recycling unit, with the recycled material moved peri-odically for use elsewhere within the building, just as a purchasednew raw material would be.
sThe examples cited in this chapter come from a number ofrecent reports, conference proceedings, and books referencedelsewhere in this report.

Ch, 3—Technology and Waste Reduction Decisions ● 7 9—
Box 3-A.—Waste Reduction by In-ProcessRecycling: Countercurrent Rinsing and
Recycling of Caustic Soda FromThread Mercerization
In the late 1970s, a French textile companyfound that it could reduce the amount of caus-tic soda discharged in wastewater by alteringits rinsing process following mercerization topermit recycling of the soda. (In mercerization,thread is immersed in a caustic soda bath con-taining a wetting agent.) The company’s origi-nal technology followed mercerization by rins-ing the thread in three water baths that weredischarged after use. The waste reducing tech-nology replaces these baths with a stream ofrunning water, Soda gradually concentratesin the rinse water until it is efficient and cost-effective to employ an evaporator that will ele-vate the soda concentration sufficiently to al-low the soda to be recycled back into the mer-cerizing process, along with the wetting agentit contains.
The new technology reduces both the vol-ume and the amount of hazardous waste gen-erated, per unit product. In the old method,360 kilograms (kg) of soda in 80 cubic meters(m3) of wastewater were created as waste foreach ton of thread mercerized. With the newtechnique, only 100 kg of soda in 13 m3 ofwater are generated. The new process requiredinvestments of 1,430,000 French francs, 330,000francs more than the old process, but ischeaper to operate: 1,320 francshon of threadmercerized using the new process versus 2,OOOfrancs/ton using the old process. The wastereducing process requires less energy (15.7gigajoules (GJ)/ton of thread vs. 19.5 GJ/ton un-der the old method) and less raw materials(only 170 kg of pure soda and 3.5 kg of wet-ting agent are required per ton of thread asopposed to 43o kg soda and 8.5 kg wettingagent required for the old process.) It also re-quires fewer man-hours to operate.SOURCE: United Nations, Economic Commission for Europe,
Compendium on Low- and Non-Waste Technology(Geneva, Switzerland: 1981), monograph #26.
a 1](1 rec}rc les the overspray i n its painting ope r-a t ions. Diversified Printing Corp. and Donnel-Ic} Printing Co, recover and use 86 and 87 per-(:ent respccti~’cl~’ of the organic sol~~ents in inks,
Major limitations to in-process recyclinginclude:
●
●
●
●
●
possible significant differences betweenrecycled and virgin materials and the in-ability to use waste that maybe chemicallydifferent than the raw materials,highly fluctuating market prices for virginraw materials,the greater applicability to continuous vs.batch processes,amounts that are too small to justify invest-ment for new equipment, andthe need in some cases to perform costlysteps to separate components before someof the waste can be recycled.
Although in many cases in-process recyclingdoes not require substantial testing and devel-opment or capital investment, in other casesit does. This waste reduction option is mostclosely related to pollution control, which inpart explains its wide use (see below).
Approach 2: Process Technology and Equipment
Significant changes in the basic technologyand equipment of production, including mod-ernization, modification, or better control ofprocess equipment may result in reduction ofwaste (see box 3-B). Such reduction may alsocome about through major changes in technol-ogy (e. g., adopting a different way of makinga commodity chemical or refining a metal-bear-ing ore may reduce a company’s waste). Forexample, 3M replaced a chemical process toclean flexible metal electronic circuits with astrictly mechanical process. Professor Ray-mond young of the university of Wisconsin(Madison) has invented a new pulp-makingprocess that does not use sulfites and has nosources of air or water pollution; it is in thepilot-testing stage, Lancy International de-signed a new process for Elkhart Products Inc.to remove oxide and passivate (render the sur-faces chemically inactive) pipe fittings by usingnonhazardous solutions instead of a cyanidedip and a chromic acid dip, Amoco ChemicalsCorp. modified a manufacturing process andreduced its ignitable and oily wastes by 60 to70 percent.
80 . serious Reduction of /-/~ardo”s waste
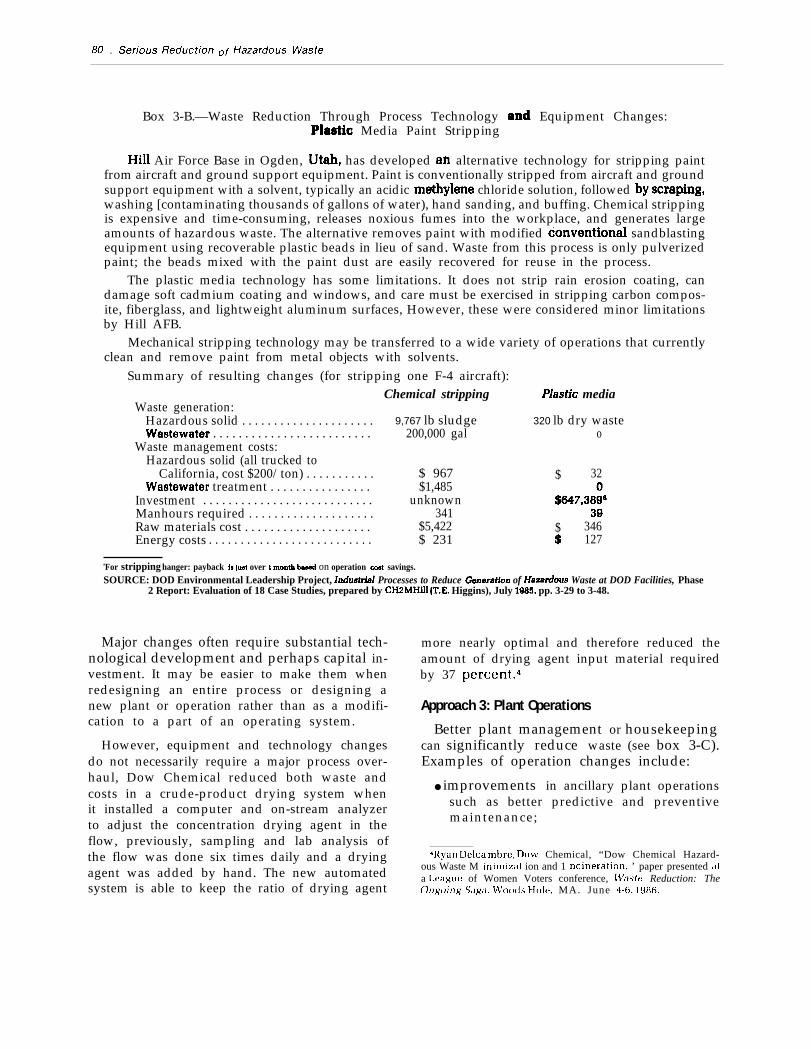
Box 3-B.—Waste Reduction Through Process Technology and Equipment Changes:Piastic Media Paint Stripping
Hill Air Force Base in Ogden, Utah, has developed an alternative technology for stripping paintfrom aircraft and ground support equipment. Paint is conventionally stripped from aircraft and groundsupport equipment with a solvent, typically an acidic methylene chloride solution, followed by scraping,washing [contaminating thousands of gallons of water), hand sanding, and buffing. Chemical strippingis expensive and time-consuming, releases noxious fumes into the workplace, and generates largeamounts of hazardous waste. The alternative removes paint with modified conventiomd sandblastingequipment using recoverable plastic beads in lieu of sand. Waste from this process is only pulverizedpaint; the beads mixed with the paint dust are easily recovered for reuse in the process.
The plastic media technology has some limitations. It does not strip rain erosion coating, candamage soft cadmium coating and windows, and care must be exercised in stripping carbon compos-ite, fiberglass, and lightweight aluminum surfaces, However, these were considered minor limitationsby Hill AFB.
Mechanical stripping technology may be transferred to a wide variety of operations that currentlyclean and remove paint from metal objects with solvents.
Summary of resulting changes (for stripping one F-4 aircraft):Chemical stripping Plastic media
Waste generation:Hazardous solid . . . . . . . . . . . . . . . . . . . . . 9,767 lb sludge 320 lb dry wasteWastewater . . . . . . . . . . . . . . . . . . . . . . . . . 200,000 gal o
Waste management costs:Hazardous solid (all trucked to
California, cost $200/ton) . . . . . . . . . . . $ 967 $ 32Wastewater treatment . . . . . . . . . . . . . . . . $1,485
Investment . . . . . . . . . . . . . . . . . . . . . . . . . . . unknown $647,38~aManhours required . . . . . . . . . . . . . . . . . . . . 341 39Raw materials cost . . . . . . . . . . . . . . . . . . . . $5,422 $ 346Energy costs . . . . . . . . . . . . . . . . . . . . . . . . . . $ 231 $ 127
aFor stripping hanger: payback ia joat over 1 month baaarl on operation cod savings.
SOURCE: DOD Environmental Leadership Project, Induatrhd Processes to Reduce Canersfion of Haaardous Waste at DOD Facilities, Phase2 Report: Evaluation of 18 Case Studies, prepared by CH2MHill (T.E. Higgins), July 198!% pp. 3-29 to 3-48.
Major changes often require substantial tech-nological development and perhaps capital in-vestment. It may be easier to make them whenredesigning an entire process or designing anew plant or operation rather than as a modifi-cation to a part of an operating system.
However, equipment and technology changesdo not necessarily require a major process over-haul, Dow Chemical reduced both waste andcosts in a crude-product drying system whenit installed a computer and on-stream analyzerto adjust the concentration drying agent in theflow, previously, sampling and lab analysis ofthe flow was done six times daily and a dryingagent was added by hand. The new automatedsystem is able to keep the ratio of drying agent
more nearly optimal and therefore reduced theamount of drying agent input material requiredby 37 percent.q
Approach 3: Plant Operations
Better plant management or housekeepingcan significantly reduce waste (see box 3-C).Examples of operation changes include:
● improvements in ancillary plant operationssuch as better predictive and preventivemaintenance;
4Ryan L)elca mbre, [low’ Chemical, “Dow Chemical Hazard-ous Waste M inimizat ion and 1 ncineration, ’ paper presented ata League of Women Voters conference, Lt’aste Reduction: TheOnguing Sfiga, INoods Hol[?, MA. June 4-6, 1986.
Ch. 3— Technology and Waste Reduction Decisions ● 81
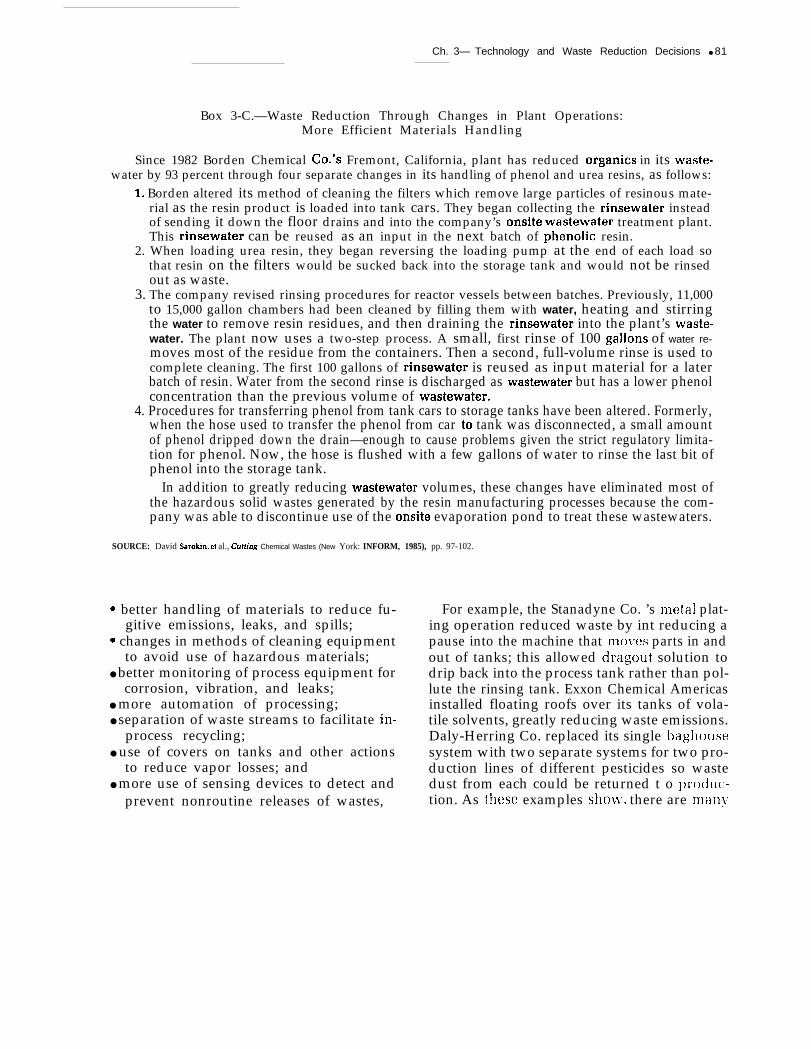
Box 3-C.—Waste Reduction Through Changes in Plant Operations:More Efficient Materials Handling
Since 1982 Borden Chemical Co.’s Fremont, California, plant has reduced organics in its waste-water by 93 percent through four separate changes in its handling of phenol and urea resins, as follows:
1. Borden altered its method of cleaning the filters which remove large particles of resinous mate-rial as the resin product is loaded into tank cars. They began collecting the rinsewater insteadof sending it down the floor drains and into the company’s onsite wastewater treatment plant.This rinsewater can be reused as an input in the next batch of phenolic resin.
2. When loading urea resin, they began reversing the loading pump at the end of each load sothat resin on the filters would be sucked back into the storage tank and would not be rinsedout as waste.
3. The company revised rinsing procedures for reactor vessels between batches. Previously, 11,000to 15,000 gallon chambers had been cleaned by filling them with water, heating and stirringthe water to remove resin residues, and then draining the rinsewater into the plant’s waste-water. The plant now uses a two-step process. A small, first rinse of 100 gallons of water re-moves most of the residue from the containers. Then a second, full-volume rinse is used tocomplete cleaning. The first 100 gallons of rinsewater is reused as input material for a laterbatch of resin. Water from the second rinse is discharged as wastewater but has a lower phenolconcentration than the previous volume of wastewater.
4. Procedures for transferring phenol from tank cars to storage tanks have been altered. Formerly,when the hose used to transfer the phenol from car to tank was disconnected, a small amountof phenol dripped down the drain—enough to cause problems given the strict regulatory limita-tion for phenol. Now, the hose is flushed with a few gallons of water to rinse the last bit ofphenol into the storage tank.
In addition to greatly reducing wastewater volumes, these changes have eliminated most ofthe hazardous solid wastes generated by the resin manufacturing processes because the com-pany was able to discontinue use of the onsite evaporation pond to treat these wastewaters.
SOURCE: David Sarokin, et al., Cutting Chemical Wastes (New York: INFORM, 1985), pp. 97-102.
Q better handling of materials to reduce fu-gitive emissions, leaks, and spills;
c changes in methods of cleaning equipmentto avoid use of hazardous materials;
● better monitoring of process equipment forcorrosion, vibration, and leaks;
● more automation of processing;● separation of waste streams to facilitate in-
process recycling;● use of covers on tanks and other actions
to reduce vapor losses; and● more use of sensing devices to detect and
prevent nonroutine releases of wastes,
For example, the Stanadyne Co. ’s metal plat-ing operation reduced waste by int reducing apause into the machine that mo~~es parts in andout of tanks; this allowed dragout solution todrip back into the process tank rather than pol-lute the rinsing tank. Exxon Chemical Americasinstalled floating roofs over its tanks of vola-tile solvents, greatly reducing waste emissions.Daly-Herring Co. replaced its single baghousesystem with two separate systems for two pro-duction lines of different pesticides so wastedust from each could be returned t o I)ro(iu(:-tion. As these examples sho~i’, there are man}

82 ● Serious Reduction of Hazardous Waste
simple, low-tech opportunities to reduce wasteby examining plant operations. Often only partsof waste streams are reduced, but implemen-tation is typically quick and inexpensive. Moti-vated workers are the key to finding and ex-ploiting these opportunities.
Approach 4: Process Inputs
Changes in raw materials, either to differentmaterials (e. g., water instead of organic sol-vents) or materials with different specifications(e.g., lower levels of contaminants) may reducewaste. For example, Scovill, Inc., replaced thesolvent 1-1-1 trichloroethane with a water solu-ble cleaner for decreasing applications. RikerLaboratories replaced organic solvents used toprepare coated medicine tablets with a water-based solvent and also used different sprayequipment. Pilot studies have also shown thatprocess input changes may be used to reducewastes in mining. Nontoxic reagents have beensubstituted for cyanide compounds in the proc-essing of copper ores; similarly, alkalinity ofprocessing reagents can be maintained by usingreagents less toxic than ammonia, for exam-ple lime.5
Frequently, changing raw materials is asso-ciated with making changes in process tech-nology and equipment or in the compositionof the end product. In box 3-D is an exampleof changing printing inks. Cleo Wrap, a rela-tively large company, made a major commit-ment over several years, developing a familyof new inks and changing printing equipmentto accept the new inks. Smaller companies maybe dependent on their vendors for changes inraw materials, and vendors may not be able tomake changes for waste reduction purposes un-less large waste generators help them developthese new products. When the waste genera-tors are their own raw materials suppliers,changes are much easier.
5( 1,s, E nk, i ro II ment~ I Prot cction Agenc}., Report to L’on,gres.s:11’astes from the .Extractiun and Ben.eficiation of .Lfetallic Ores,Phosphate Rock, Asbestos, O\wrhurden from [ ~ranium Afining,and Oil S’hale, EPA/530-StV-85-033 (Wash i ngt on, D(1: Of’ f’i(’e ofSolid Waste, I)cc. 31, 1985], p. 3-5.
Box 3-D.—Waste Reduction ThroughChanges in Process Inputs: Substitution ofWater-Based Inks for Organic Solvent-Based
Inks in Printing
In 1986 Cleo Wrap, the world’s largest pro-ducer of Christmas gift wrapping paper, com-pleted its conversion from organic solvent-based inks to water-based printing inks in allits operations. Organic solvent-based inks re-quired organic solvents for cleaning presses;water-based cleaning solutions and soap willnow do the job. Because Cleo Wrap is so largeand manufactures such a variety of color de-signs, ink changes and press cleanups are fre-quent and the amount of organic solvent be-ing used was substantial. In 1984, the last yearof the 6-year phase-in of the water-based inks,Cleo Wrap was reporting 133,555 kilogramsof ignitable hazardous waste. Annual hazard-ous waste disposal costs were $35,000. CleoWrap now plans to seek status as a small quan-tity generator.
This substitution has had several benefits.It has made it possible for Cleo Wrap to re-move all eight of their underground storagetanks, to eliminate all above ground solventstorage, to reduce or eliminate fire hazards,to seek lower fire insurance premiums, to elim-inate their ignitable hazardous waste holdingarea, and to eliminate their hazardous wastedisposal costs.
This raw materials substitution requiredsome equipment changes and retraining ofemployees to work with the water-based tech-nology because printing sequencing and dry-ing techniques are very different. The changealso required Cleo Wrap to persuade their inksuppliers to develop a fill range of water-basedink colors that did not exist when the companyundertook the change in 1978.
SOURCE: Award presented at Governor’s Conference on Pollu-tion Prevention Pays, Nashville, TN, Mar. 4-6, 1986.
Approach 5: End Products
Changes in the design, composition, or speci-fications of end products that allow fundamen-tal changes in the manufacturing process or inthe use of raw materials can directly lead towaste reduction. For example, 3M reformulateda product to use a nonhazardous organic ma-
Ch, 3— Technology and Waste Reduction Dec/sions ● 8 3
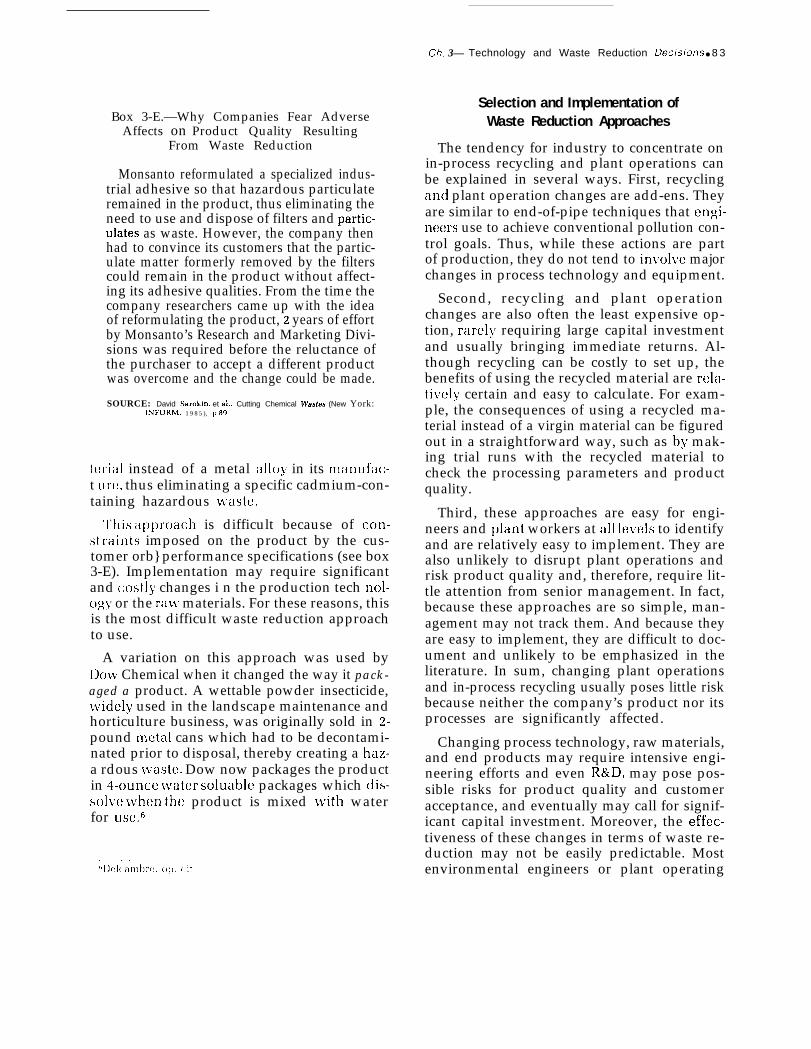
Box 3-E.—Why Companies Fear AdverseAffects on Product Quality Resulting
From Waste Reduction
Monsanto reformulated a specialized indus-trial adhesive so that hazardous particulateremained in the product, thus eliminating theneed to use and dispose of filters and partic-ulate as waste. However, the company thenhad to convince its customers that the partic-ulate matter formerly removed by the filterscould remain in the product without affect-ing its adhesive qualities. From the time thecompany researchers came up with the ideaof reformulating the product, z years of effortby Monsanto’s Research and Marketing Divi-sions was required before the reluctance ofthe purchaser to accept a different productwas overcome and the change could be made.
SOURCE: David Sarokln. et al., Cutting Chemical Wastes (New York:I.NFORM, 1985), p 89
terial instead of a metal allo~’ in its manufac-t ure, thus eliminating a specific cadmium-con-taining hazardous waste.
‘1’his ap]]roach is difficult because of con-st raints imposed on the product by the cus-tomer orb} performance specifications (see box3-E). Implementation may require significantand costl}’ changes i n the production tech nol-og~ or the ra~~r materials. For these reasons, thisis the most difficult waste reduction approachto use.
A variation on this approach was used byL)oI\r Chemical when it changed the way it pack-aged a product. A wettable powder insecticide,~~~idel~’ used in the landscape maintenance andhorticulture business, was originally sold in 2-pound metal cans which had to be decontami-nated prior to disposal, thereby creating a haz-a rdous t~’aste. Dow now packages the productin q-ounce \\’ater soluable packages which dis-solt~e i~’hen the product is mixed ~~~ith waterfor use.6
Selection and Implementation ofWaste Reduction Approaches
The tendency for industry to concentrate onin-process recycling and plant operations canbe explained in several ways. First, recyclingand plant operation changes are add-ens. Theyare similar to end-of-pipe techniques that engin-eers use to achieve conventional pollution con-trol goals. Thus, while these actions are partof production, they do not tend to involl’e majorchanges in process technology and equipment.
Second, recycling and plant operationchanges are also often the least expensive op-tion, rarely requiring large capital investmentand usually bringing immediate returns. Al-though recycling can be costly to set up, thebenefits of using the recycled material are rela-ti~ely certain and easy to calculate. For exam-ple, the consequences of using a recycled ma-terial instead of a virgin material can be figuredout in a straightforward way, such as b~~ mak-ing trial runs with the recycled material tocheck the processing parameters and productquality.
Third, these approaches are easy for engi-neers and plant workers at all levels to identifyand are relatively easy to implement. They arealso unlikely to disrupt plant operations andrisk product quality and, therefore, require lit-tle attention from senior management. In fact,because these approaches are so simple, man-agement may not track them. And because theyare easy to implement, they are difficult to doc-ument and unlikely to be emphasized in theliterature. In sum, changing plant operationsand in-process recycling usually poses little riskbecause neither the company’s product nor itsprocesses are significantly affected.
Changing process technology, raw materials,and end products may require intensive engi-neering efforts and even R&D, may pose pos-sible risks for product quality and customeracceptance, and eventually may call for signif-icant capital investment. Moreover, the effec-tiveness of these changes in terms of waste re-duction may not be easily predictable. Mostenvironmental engineers or plant operating

84 ● Serious Reduction of Hazardous Waste
engineers have neither the training and exper-tise nor the authority to implement such ac-tions. Nor are these opportunities apparent toplant workers. To implement these kinds ofchanges, engineers and scientists who havebeen concerned solely with industrial processesand technology or with product developmentand design have to be given new responsibili-ties and have to be educated and motivated toimplement change for—but not restricted to—waste reduction. Company management has tobecome involved, either directing the attentionof such people to waste reduction, making ita major criterion for success of company R&Defforts, or getting outside technical assistanceto implement waste reducing changes. Olderplants and mature industries are especiallylikely to have significant problems and face highcosts for waste reduction actions of this kindthat involve significant changes in technology,major equipment, and raw materials.
Why, then, are process technology and equip-ment changes ranked second, both by indus-tries in the OTA survey and in the literature?In spite of the difficulties and risks, waste re-ducing process and equipment changes aresound economic investments for many com-panies and can improve both their efficiencyand profitability. Both the OTA survey and theliterature sampled extend across a broad cross-section of industry, representing many indus-try types, not just the mature industries whichcan find process changes difficult. The popular-ity of process changes indicates strongly thatserious, front-end waste reduction is possiblein a wide variety of industries.
The Investment-Uncertainty Barrier
The fact that waste reducing process andequipment changes are frequently sound eco-nomic investments is indicated by the resultsof OTA’S industry survey and by economic datain the literature, OTA asked respondents in 99companies to rank nine types of obstacles towaste reduction as to whether they were “usu-ally, “ “occasionally,” or “rarely” a problem intheir operation (see app. A). Capital costs wereranked as only an “occasional” obstacle. Wastereduction investment documented in the liter-
ature (see discussion later in this chapter) oftenprovides economic data on costs and savings,which are virtually always very favorable andillustrate a wide variety of ways in which wastereduction measures can provide high return onrelatively small amounts of capital. While suchopportunities may not be available to all com-panies at all times, it is clear that a large amountof waste reduction is possible and has been un-dertaken by companies without large amountsof capital and with high returns on investment.
This is true now, when most companies arein the early stages of waste reduction. How-ever, as interest in or pressure for waste reduc-tion increases, a firm will exhaust the obvious,simple, cheap, and quickly implemented waysof achieving this goal. The amounts of capitalwhich must be invested to achieve further wastereduction may increase. At the same time, cer-tainty about the return on those investments islikely to decrease. Additional waste reductionefforts will increasingly require changing thefundamentals of processes and product designin new and untried ways. These more complexmeasures are dependent on intimate knowledgeof specific, often unique, details of the plant’stechnology, operations, and products. Compa-nies therefore cannot rely on outside informa-tion and the experience of others but must takethe risks of experimentation and implementa-tion themselves.
For most generators, a combination of greaterresource requirements and greater uncertaintyabout payoff become barriers to further wastereduction at some point. However, determiningwhen this point has been reached may be a mat-ter of perception and opinion. When someonesays his company “can’t do any more wastereduction,” he maybe thinking of waste man-agement approaches, or he may mean the com-pany has exhausted the obvious, simple, andcheap techniques to reduce waste. To go fur-ther would require more time and money, andwillingness to invest despite uncertainty aboutthe waste reduction outcome. Moreover, somefirms have trouble not only in implementingbasic production technology advances but evenin finding information about technical ap-proaches. In such cases, lack of attention to
waste reduction may be a symptom of a largerproblem,
Older, troubled manufacturing industries, inparticular, may encounter the investment-uncertainty barrier early on. For many smallercompanies with few technical resources andwith difficulties in raising capital, this barriermay be virtually insuperable. To overcome theinvestment-uncertainty barrier and pursuewhat might be the most effective means of wastereduction, industry may need strong motiva-tion, either from within (e. g., greater tangiblemanagement support) or from outside (e. g.,direct government assistance).
As will be discussed later, it is extremely dif-ficult to estimate waste even approximately re-duction potential. Hence, whether a plant-spe-c ific barrier can be reasonably overcome orwhether some true upper limit to waste reduc-tion has been reached—based on explorationof all approaches—is very difficult to resolve.It is difficult for the company’s managementand even more difficult for someone on the out-side, On the other hand, the evolution of mostproduct ion operations based on such objectivesas modernization, innovation, and new prod-uct development will provide a number ofadded opportunities for waste reduction. But,
Ch. 3—Technology and Waste Reduction Decisions ● 8 5
as stated earlier, such opportunities are fewer,in mature industries.
In some sense, the evolution from simple andcheap to complex and costly means to achievewaste reduction may be happening in the Na-tion as a whole. This is a speculative statementbecause not every industrial plant is startingwaste reduction at the same time or proceed-ing at the same pace. However, because wehave had a voluntary approach to waste reduc-tion, industrial efforts probably have concen-trated on the easiest approaches to waste re-duction, although some firms have progressedfurther. Many firms may not have had enoughtime yet to implement fully even the easiestforms of waste reduction, much less to consideror examine more costly approaches. Govern-ment policies and programs have not yet paidmuch attention to waste reduction, informa-tion and technology transfer are in early stages,and many industries are still just beginning toundertake waste reduction as an end in itself.Nor has waste reduction become a major issuefor the public. This state of affairs underlinesan important fact: waste reduction’s subor-dinate position to pollution control and to themore traditional imperatives of the productionsystem has resulted in suboptimal levels ofwaste reduction.
ILLUSTRATIONS OF WASTE REDUCTION
A Growing Literature
Waste reduction is discussed in a rapidly ex-panding literature from the United States andseveral European nations. Most publicationspresent case study examples of successful wastereduction to illustrate its feasibility. The liter-ature does make a case for waste reduction—both for its desirability and for its feasibility–but it is probably not very useful to other com-panies in their waste reduction efforts nor isit of much help to those outside of industry inassessing the transferability and limitations ofthe techniques discussed.
tail to give a thorough understanding of whyand how waste reduc~ion was carried o-ut. Oftenit is not clear what waste has been reduced,how much it was reduced, by what method itwas reduced, or what the costs and benefitswere. Second, the number of cases reported inthe literature is limited; the same examples ap-pear over and over again. Third, comparisonsbetween examples from one published sourceand another are difficult to make because thereare no generally accepted definitions of wastesor reduction. Many examples deal with non-hazardous wastes, particularly in Europeandocuments; in other cases only a RCRA defini-
There are several reasons for the lack of use- tion of hazardous waste is used; ignoring wastesfulness. First, few accounts go into enough de- in air and water. Similarly, waste reduction

86 ● Serjous Reduction of Hazardous Waste
Table 3-1 .—Waste Reduction Case Studies
Waste reduction methods
In-process Plant Process technology Process End Waste managementSources recycling operations and equipment inputs products methods Totals
a . . . . . . . . . . 19 16 11 5 0 22 74b . . . . . . . . . . 36 0 24 7 0 15 82c . . . . . . . . . . 36 0 17 2 0 10 65d . . . . . . . . . . 10 4 6 2 0 4 26e . . . . . . . . . . 6 10 18 2 2 1 39f . . . . . . . . . . 3 0 20 1 1 3 28
Totals. . . . . . 110 30 96 19 3 56 314
SOURCES Office of Technology Assessment, compiled from:a D Huisingh, et al., Proven Profit from Pollution Prevent/on (Washington, DC The Institute for Local Self-Reliance, 1985);b. Compendium on Low and Non-waste Technologies (Geneva, Switzerland: United Nations Economic Commission for Europe, 1981-84), four volumes,c. M. Overcash, Techniques for /rrdustria/ Pollution Prevention (Chelsea, Ml’ Lewis Publishers, Inc , 1988). Originally assembled and developed as /-es Tectr-
rriques Propres clans /’/ndustde Francaise (Parts’ The Ministre Du L’Environnement, 1982);d. Department of Defense, Environmental Leadership Project, Industrial Processes to Reduce Generation of f+a?ardous Waste at DOD Facilities, Phase 2
Report: Evaluation of 18 Case Studies, prepared by CH2MHill (T E. Higgins), July 1985,e. D Sarokin, et al., Cutting Cfremica/ Wastes (New York: INFORM, 1985), andf Federal Minister for Research and Technology (DFVLR), Environrnerrta/ Protect/on Technologies (Cologne, West Germany DFVLR, December 1984). (Note
that this last volume documents ongoing research rather than industrial application of technologies.)
definitions often include what is actually wastemanagement. Examples of waste reduction inthe literature may also include simple volumereduction (e. g., dewatering of a sludge) with noreduction of hazardous content,
In order to gain some insight into the litera-ture, OTA analyzed six references which of-fered the most detailed and useful accounts ofhazardous waste reduction. Table 3-1 shows thedistribution of case studies in these six docu-ments across the five different waste reductionapproaches available to industry, Table 1-2 inchapter 1 shows the distribution of these samecases across Standard Industrial Category(SIC).7 Of the 314 examples included in the sixsources which dealt with a broad category ofhazardous waste,a 110 of them described in-process recycling measures, 96 describe proc-ess and equipment changes, 30 describe oper-ations changes and 19 describe input substitu-tions. Only 3 of the 314 cases were end-productreformulations, which is consistent with the un-
The distribution of cases across SICS illustrates the wide rangeof industries that have become involved in waste reduction. How-ever, the distribution should not be taken as any conclusive dem-onstration of waste reduction activity or lack thereof in any par-ticular industry. Three of the the six compendia focus on onlya few or even just one (1 NFORM) SIC category and thereforemake no attempt to be representative.
%50me examples in the literature deal with waste heat and withnonhazardous wastes, for example from food processing. Thesewere not included in OTA’S tally.
popularity of this approach among industriessurveyed by OTA.g
The distribution of approaches in the litera-ture is similar to the ranking of approaches bycompanies surveyed by OTA. In-process recy-cling and technology lequipment changes areby far the most common method of reducingwastes, followed by plant operations or house-keeping changes. Input substitutions are rare;end-product reformulations are by far the leastcommon method of reducing waste. As dis-cussed above, the recycling and operationschanges have an add-on character which makesthem relatively easy to implement with littlerisk, Process and equipment changes are usu-ally more difficult and risky to implement, butthe potential payoff for such changes in termsof increased efficiency and reduced costs canbe very large, The frequency with which suchchanges are documented in the literature indi-cates that major front-end waste reduction ac-tions are both possible and profitable for a verywide range of industries,
gIt is worth noting that even these three are not particularlygood examples of waste reduction by end product reformula-tion. The two INFORM examples both involve eliminating filtra-tion of a hazardous particulate from an adhesive so that it ispassed on in the product—a change of questionable overall envi-ronmental benefit. The other example in the German compen-dium—an investigation into possible substitution of aluminumfor cadmium in electroplating—is a piece of R&D done in a univer-sity research institute, not an example of successful waste re-duction in industry.

Ch. 3—Technology and Waste Reduction Decisions ● 8 7
Generic Waste Reduction Opportunities
Another way to illustrate waste reduction op-portunities is by examining those that apply tocommon hazardous wastes or industrial oper-ations. While it is correct that there are impor-tant site-specific constraints to waste reduction,many successful practices, which generallyhave paid for themselves within a period ofmonth’s to a few years, can be adopted by abroad range of companies and industries, Dis-cussions of several of these practices follow,
Replacement of Organic Solvents
There are a number of successful examplesof companies that have cut their costs andhazardous waste problems by changing frommaterials that contain large amounts of organicsolvent,lo such as inks, to ones based with water.There are also a number of examples of switchesfrom pure organic solvents to water-basedcleaning agents. This approach competes inpopularity with in-process recycling of organicsolvents, which is also widely applicable andon the rise, but the substitution approach is abetter example of waste reduction.
Material substitution can eliminate, not justreduce, a particular waste stream and can alsoeliminate other problems, such as contamina-tion from leaking underground storage tanksand worker exposure to the original solvent.However, problems with product quality mayresult; for example, a great deal of develop-ment was necessary before water-based paintsachieved levels of color quality and durabilitysimilar to the solvent-based paints they re-placed, By now there has been a record of somany successes in this type of substitution thata broad shift on the part of suppliers from or-ganic solvents to water-based products for in-dustry is likely, although organic solvents willcontinue to be considered essential or prefer-able in certain applications. This shift will espe-cially benefit smaller firms that can buy the newproducts and cut their waste generation, Thereappear to be many waste reduction opportuni-
lo~rxarli(; sol~[;nts in(;lu(if; methan{)l, hexanc, toluf:ne, meth\l-enc chloride, Freons, xylenc, chloroform, isopropanol, acetoni-tri]c, tri(:hloro(;ttl~l(;n[;,” and rnan~ other cr)mp[)IIn(l\,
ties here, although in some industrial processesdevelopment work will be necessary, includ-ing major or minor changes in plant equipment.
Organic solvents can also be replaced by ma-terials other than water to reduce waste. Forexample, Merck, Sharp & Dohme has been suc-cessful in replacing some organic solvents withinexpensive inorganic acids and bases in phar-maceuticals manufacture. They report that thesubstitute process has eliminated 300,000 gal-lons of methanol and 300,000 gallons of hex-ane a year in the manufacture of one product.This and other manufacturing changes reducedthe company’s generation of chemical wastesby 5(J percent over 4 years. Recycling of 2.6 mil-lion pounds a year of methylene chloride meanta per pound savings of 24 cents for raw mate-rial costs and 35 cents for incineration.
In-Process Solvent Recovery
Solvent recovery falls within the definitionof waste reduction in this report as long as therecovery equipment is used in conjunction withprocess equipment or within the waste gener-ating activity area. In-process solvent recoveryis widely used as an alternative to replacementof organic solvents to reduce waste generation.It is attractive because, like end-of-pipe pollu-tion control measures, it requires little changein existing processes. The widespread commer-cial availability of solvent recovery equipmentis another attractive feature. Availability ofequipment suitable for very small operations,particularly batch operations, may make in-process recovery of solvents financially prefer-able to raw materials substitution for suchfirms, but for most companies the relative eco-nomic advantages of in-process recovery areless clear.
Commercially available solvent recoveryequipment for in-plant use is summarized intable 3-2. The functioning of each of thesepieces of equipment is based on one or moreof the following methods:
c Carbon adsorption of solvent, subsequentremoval of the solvent by steam, and sepa-ration of the solvent for reuse in the oper-ation. This process works best with sol-
62-636 () - 86 - 4 : 01, 3

88 ● Serious Reduction of Hazardous Waste
Table 3-2.—Some Commercial Sources ofSolvent Recovery Equipmenta
Carbon adsorption:AMCEC Corp. (Oak Brook, /L): Custom designed and pack-
aged systems. A new process reduces resorption streamrequirements from the conventional 3 or 4 lb steam/lb ofsolvent to 2 lb steam/lb of solvent recovered, or less.
Dedert Corp. (0/ympia Fie/ds, /L): Equipment and systemsfeature new technology to reduce energy consumption toless than 1 lb of steam/lb of solvent recovered for large-scale operations. Investment recovered quickly, often inless than 24 months.
Hoyt Manufacturing Corp. (Westport, MA): Can recover 85 to95 percent of solvent with payback in less than 1 year.
Met-Pro Corp. (Systems Division, Harleysville, PA): Eithergranular or fiber carbon used.
Ray So/v, /nc. (Piscataway, NJ): Regeneration of carbonachieved by purging the adsorber with an inert gas in newsystem. This can reduce cost by 50 percent and energy re-quirements by 35 percent over conventional systems.Steam resorption system offers recovery efficiencies of99 percent.
Vara /nternationa/, /nc, (1/ero Beac/?, ~L.): Uses pelletized car-bon bed and automatically controlled systems.
Distiiiation/condensation:Edwards Engineering Corp. (Pompton Plains, NJ): System
based on direct condensation by refrigeration. Vapors arepassed over cold condensing surfaces where solventvapors condense and are collected as a liquid and returnedto product storage.
Finish Engineering Co. (Erie, PA): Feat ures one button oper-ation and no operator requirement.
Hoyt Manufacturing Corp. (Westport, MA): Distillation sys-tem recovery efficiency of 98 percent; completely auto-matic, continuous process.
Recyc/ene Products, Inc. (South San Francisco, CA): Smallvolume (5 gal) distillation recovery system available.
Distillation/condensation (continued):Pope Scientific, Inc. (Menomonee, VW): Uses a vacuum dis-
tillation process. Capacity of up to 200 gal/day.Sauk Va//ey Equipment Co. (Rock Fa//s, /L): Can distill 15
gal/shift at a cost of 4 to 10 cents/gal.Progressive Recovery, Inc. (Co/urnbia, /L): Distills all common
solvents up to a boiling point of 5000 F with vacuum assistat a cost of 5 to 8 cents/gal.
pbr /ndustries (West Baby/on, NY): Two portable batch sizes(5 and 14 gal) recycle 90 percent of solvent (acceptable feedincludes paint thinners, aromatic hydrocarbons, chlorinatedsolvents) automatically in a few hours. No pressure valve;costs less than 5 cents/gal. Special additive allows sludgereclamation and production of low-cost rubberized under-coating or gravel guard.
Scrubbers, other methods, or operating principle not known:Cai/cote (f3erea, OH): Scrubber uses a proprietary high boil-
ing point organic liquid that is regenerated and recycled.Stripper column has a fractionation section and a con-denser. Process is continuous.
Tri-mer Corp. (Owosso, M/): A wet scrubber system for vari-ous types of industrial sources which can be combined withother devices, such as a distillatiordconden sation device,for solvent recovery.
Detrex Chemica/ /ndustries (South fie/d, M/): Modular approachwhich can be used with most chlorinated and fluorinatedsolvents. Many systems have paybacks of less than 1 year.
Venus Products, /nc. (Kent, WA): Systems can recover95 per-cent of solvent and up to 4 barrels per sh ift with automaticbarrel filling.
Union Carbide (Danbuty, CT): Recovery efficiencies of up 99percent in large systems which can pay for themselves inabout 2 years.
aThi~ table is for illustrative ~urpo~e~, The appearance of a technol~gy in this table should not be construed as a recommendation or endorsement by O T A
SOURCE: Off Ice of Technology Assessment, based on Information supplled by companies and P.M Cheremisinoff, Pollutlon EnglrJeering, June 1986, pp. 26-33
●
vents that are immiscible with water andwhen only a single solvent is being recov-ered. Since the carbon must be regener-ated, two or more units are required to keepthe operation continuous. There can beproblems and costs associated with hydro-chloric acid formation from chlorinatedsolvents, carbon bed plugging by particu-late, and buildup of certain volatile or-ganics on the carbon,Distillation and condensation are used toseparate and recover the solvent from otherliquids. Removal efficiency can be veryhigh with this process. It can be used forsolvent mixtures as well as single solventstreams.
Dissolving the solvent in another material(i.e., scrubbing) can be used. The solventmust then be recovered from the resultingsolution, for example through distillationand condensation. Efficiency of removalis often not high with this method.
Mechanical Instead of Liquid Processes
Whenever liquids are used to transfer or re-move material, it maybe possible to accomplishthe job by a mechanical means. For example,metal beads can replace a caustic solution toremove dirt or oxide on metal parts. Some typesof plating can be done mechanically rather thanwith traditional electroplating methods. Paint

Ch. 3—Technology and Waste Reduction Decisions ● 8 9
can be removed by bombardment with plasticor metal beads rather than by using solvents.Nonmechanical sources of energy can also re-place liquid chemicals; for example, the AirForce has developed a high-intensity flashinglight to strip paint from aircraft wings.
Preventing Vapor Losses
Often it is possible to prevent hazardous airemissions by the simplest of techniques whilerealizing large cost savings on raw materials.Since there are often no government regula-tions on control of toxic fugitive emissions,often little thought has been given to the sub-ject, although it is easy to design equipment thatwill do the job. For example, Exxon ChemicalAmericas reduced emissions by 85 percent ormore with floating roofs on open tanks of vola-tile materials, Other techniques include: install-ing condensers in or near operations to turnvapors into liquids, which are easily reused; in-creasing the height of vapor degreaser tanksto increase the distance between the vapor andthe top of the tank; and using automatic tankcovers that close between each decreasing oper-ation. Another approach is to convert frombatch to continuous process. For example,Monsanto changed polystyrene productionsome years ago from batch reactors to a closed-system continuous process. As a result, airemissions dropped from 5 percent of total pro-duction to less than 0.02 percent.
Reducing the Use of Process Water
Remarkably large volumes of hazardous aque-ous waste result from the widespread use ofwater to transfer heat and materials, particu-larly in the cleaning of equipment in batchprocesses. For the most part, these wastes areextremely dilute solutions with very low con-centrations of hazardous substances—so lowthat it is not practical to remove and reuse them.Either the aqueous waste is managed as a RCRAwaste or it is put through a water treatmentplant that typically either creates sludge for landdisposal or releases hazardous air emissions.Historically, water has been so cheap and thecosts of managing dilute aqueous wastes have
been so low that it is has been used with littlethought of the hazardous waste consequences.There are probably almost countless opportu-nities to cut down on waste created by the con-tamination of process water, but there are alsoobstacles. See box 3-F for an illustration of boththe possibilities for and the limitations on re-duction of wastewaters created in the manu-facture of acrylonitrile.
When water is used strictly for the removalof heat, then heat pump or refrigeration sys-tems based on circulation of coolants in aclosed-loop can be used instead. The problemwith using cooling water is that chemical agentsare added to minimize bacterial growth andslime buildup on cooling coils; such agents may,for example, contain chromium, which even-tually renders the water hazardous.
In many industrial operations water is usedas a solvent, but organic solvents can be somuch more potent that reductions in water useof two or three orders of magnitude maybe pos-sible. The higher initial cost can be more thanoffset if the organic solvents are cleaned andrecycled, Recycling can also facilitate removaland possible reuse of the dissolved materials.As the cost of managing hazardous wastewa-ter increases, the use of organic solvents mightincrease.
Another major industrial use of water is asa medium for precipitation. The result is waste-water that may contain I to 15 percent dissolvedhazardous inorganic salt. Precipitation forproduct recovery might be replaced by separa-tion techniques such as membrane technology,
Large quantities of water are used for clean-ing, and a good example of reduction is toreplace high-volume streams of water for clean-ing tanks, equipment, and products with sys-tems that use much smaller amounts cyclically.Other approaches include pressurized water ordrip tanks to collect chemicals rather than awater tank; counterflowing multiple rinse tanks;and squeegees to remove residues. Smallerpipes or flow restrictors will inhibit workersfrom wasting water. Yet another approach isto schedule batch processing to maximize back-
90 ● Serious Reduction of Hazardous Waste— . —
likm 3-F.-Possibilities for Reduction of Hazardous Water From Manufacture of Acrykmitrile
In 1985 acrylonitriie ranked 38th in the list of the top 50 chemicals made in the United States,ranked 2oth out of the 26 organics on the 1ist, and had the highest growth rate of the organics from1975 to 1985 with an annual average rate of 6.8 percent. Production in 1985 was 2.35 billion pounds(1.1 million metric tons).1 For each metric ton of acrylonitrile product manufactured, 2.3 metric tonsof process water and 400 metric tons of cooling water are used.z
Procam Water.-Water is used primarily as a quench neutralizer to cool the reactor effluent andneutralize any unreacted ammonia. Sulfuric acid is added to process water, and the acid solutionis added directly to the quench neutralizer tower to effect very rapid cooling. Effluent from the quenchtower is aqueous waste, essentially an ammonium sulfate solution. Based on the production rate ofacrylonitrile, an estimated 2.5 million metric tons of process wastewater is generated annually. Thisis roughly 1 percent of the national hazardous waste stream. The disposal cost of the wastewateris estimated at $3o to $60 per metric ton of product based on using deepwell injection for waste dis-posal; the product cost is estimated at $560 per metric ton.
Possibilities for Waste Reduction.-A process technology change is difficult because the processwater serves two purposes: it cools the reactor effluent and serves as the medium for neutralizingthe excess ammonia. Indirect cooling via a heat exchanger would probably not be rapid enough toreplace the direct qpench, and use of a heat exchanger surface might lead to the formation of tarsor other undesirable side reactions. Moreover, indirect cooling would not accomplish neutralizationof the excess ammonia. To change the acrylonitrile manufacturing process to eliminate or reduceprocess wastewater would constitute a major change. A large research effort might be required witha pilot and demonstration project and might take 5 to 10 years at considerable cost. Since the costof the process wastewater is only 5 to 10 percent of the total production costs, such an effort is notattractive. If wastewater management costs were significantly higher, say twice or three times asmuch ($60 to $180 per ton of product), perhaps because of shifting from injection wells to treatment,then the effort might be justified.
Cooling Water.– For every gallon of cooling tower water circulated, a small fraction called blow-down is discarded to remove the buildup of slime and solids which accumulate during recirculation.This blowdown contains toxic chemicals used as bactericide and fungicides and is a hazardous waste.A typical blowdown ratio is about 0.5 percent of the circulation rate. For each 400 metric tons ofcooling water used per ton of product, z metric tons of blowdown wastewater is generated. Thus,about 2.2 miilion metric tons of this wastewater is generated annually. Disposal cost of the wastewa-ter ranges from about $26 to about $52 per metric ton of product, or 5 to 10 percent of product cost.
Possibilities for Waste Reduction.—Here the water serves only one function, cooling. An alternativecould be the use of a heat pump cycle to reject heat to the environment from a closed-loop coolantrefrigeration system. After the coolant was used to cool the process, it would be compressed to ahigher temperature and pressure and then passed through a radiator that would reject the heat tothe environment. The operating costs for cooling would be from $17 to $60 per metric ton of product.aThe costs for managing the traditional coooling wastewater, if injection well costs are from $0.05to $0.10 per galion, are $26 to $52 per hour per ton of product. (This cost could increase if a wastemanagement shift occurred from deepwell injection to waste treatment.) There is a clear potentialfor saving perhaps $2o per ton of product if closed-loop, efficient refrigeration were used insteadof conventional watercooling. For a 100,000 ton per year plant this means a saving of about $2 millionannually. Assuming that the capital costs of the refrigeration system might be at most about 10 per-cent of the original capital costs of the pIant, $5o million, then payback would occur in a few years.
IChemicel & Engineering News, Apr. 21, 1$S6.+lydrocarbon Processing, May 1977, p. 171, Data based on Montedison-UOP process, which differs from the more widely used SOHIO
process primarily because of a different catalyst. However, similar water use and wastewater generation can be assumed for both.~The operating costs can be estimated making the following assumptions: 1) cooling water temperature rise of 12° F, Z) coefficient of perform-
ance ranges from 2 to 7, and 3) energy costs are $c).04 per kilowatt-hour.
—-—— ——
to-back production of’ products, thereby mini-mizing washdowns.
In many of these approaches a smaller vol-ume of water with more highly concentratedcontaminants is generated. This water some-times can be directly recycled into productionsystems or can be economically treated to re-cover valuable components, such as metals andoils, for recycling back into the process, Forexample, Borden Chemical Co, stopped fillingreactor vessels with water to clean them andinstead used 5 percent of the previous volumefor the initial rinse, allowing a concentratedsolution of phenol resins to be recycled backinto production.
There is an array of technologies under de-velopment to separate and remove valuable sub-stances from wastewater. These include: mem-brane technologies such as electrodialysis,reverse osmosis, ultrafiltration, liquid mem-branes; adsorption technologies that use a va-riety of materials such as activated carbon; andbubble and foam separation. One or more ofthese techniques might be applicable to a par-ticular waste stream.
Another important aspect of recovering con-taminants is that many of these technologiesallow the use of closed-loop systems in whichprocess water is recycled rather than beingpassed through the system a single time. Insome locations, such approaches are attractivesimply because they drastically cut water con-sumption. Moreover, this approach can elimi-nate the generation of large amounts of sludgein water treatment plants.
Many different types of industries, not merelythe chemical industry, could explore opportu-nities to reduce wastewater volumes. For ex-ample, a recent development concerns spentmetalworking fluids. After 4 years of labora-tory research and field trials, Eaton Corp. in-stalled a patented system in a number of loca-tions to totally recycle its metalworking fluidsin-plant. All this spent metalworking fluid,which contains 95 percent water, is reused andit is claimed that the system can be used any-where, regardless of operating conditions, Pre-sumably the system will be marketed to othercompanies.
Ch. 3—Techno/ogy and Waste Reduction Decisions—
The Limits of Examples
● 9 1
Hundreds of case studies and examples ofwaste reduction in the United States and abroaddocument the technical feasibility and eco-nomic benefits of a variety of approaches ina wide span of industries. Yet it is difficult toknow whether individual examples and casestudies represent the rule or the exceptions incurrent industrial practice. It is a situation inwhich those who have achieved success are en-couraged to speak of it publicly, while thosethat have not remain silent.
In many of these published examples no dataor very limited data are given on the total wastecontext in which one or more specific wasteswere reduced, and if any data are given for ac-tual waste reduction they are hardly ever givenin terms of production output or environmentalrisk reduction. It is not always clear whethersome of the waste is not simply being trans-ferred from one environmental medium toanother or whether a new hazardous waste isbeing generated in place of the old one,
An unfortunate limitation of waste reductionexamples is that the generic opportunities areoften not recognized. A reader notes the par-ticular industry being discussed and if it is nothis industry, he needs imagination to see thatthe waste reduction method might still be appli-cable. If the examples were redrafted to putthem into functional or general terms it mightbe easier to transfer waste reduction measuresacross industries.
Most importantly, the literature contains nextto nothing about failed waste reduction efforts,nor does it provide detail on how problems weresolved in cases that were ultimately success-ful, Moreover, human and organizational fac-tors that went into a waste reduction decisionare rarely discussed, even though these can beas instructive as technical and economic infor-mation. Rarely is there attention paid to whichinternal or external factors, such as corporatepolicy or government regulations, had a majorrole in the success of the effort.
Overall, the waste reduction literature andconversations with people in industry point totwo conclusions: first, that waste reduction is

Q . serious Reduction o f H~ardous Waste
widespread, diverse, substantial, and economi- waste reduction becomes a major industrialcally justified; and second, that more can be goal and a criterion of industrial efficiency indone. Traditionally, waste reduction has been its own right, opportunities not previously con-considered only as a consequence or byproduct sidered viable will be acted on and new oppor-of work to improve yields and efficiency. As tunities for waste reduction will be identified.was the case with energy conservation, once
INDUSTRY DECISIONMAKING ABOUT WASTE REDUCTION
There is no standard method by which com- Such a comprehensive examination of oper-panies make decisions about waste reduction. ations requires a broad scope of expertise, prob-For the most part, waste reduction has been ably beyond that of any one person in a com-carried out on an ad hoc basis. A troublesome pany, Review of all processes and operationsor costly waste is identified and specific action for all five types of waste reduction opportuni-is undertaken to reduce or eliminate its gener- ties requires familiarity, not only with environ-ation. Wastes are often reduced by process im- mental requirements and waste managementprovements in which waste reduction is only a activities, but also with process engineering,minor consideration. However, as waste reduc- operations, and product design. A waste reduc-tion begins to appear and rise on the agendas tion audit is best carried out by a group of peo-of CEOS as an issue in its own right, system- ple, each one with expertise in a different oneatic audits are beginning to be developed to of these areas; an environmental engineer aloneguide comprehensive waste reduction. cannot do it.
Conducting a Waste Reduction AuditInvolving people from different parts of the
company in the waste reduction audit has the
Waste reduction audits are distinct from envi- added advantage of increasing consciousnessronmental audits. Environmental audits are of the need for waste reduction. It can stimu-
late employees to think about methods of re-compliance audits—they are internal reviewsducing waste and help shift thinking away fromof a company’s operations aimed at meeting
environmental requirements such as RCRA and the pollution control focus.lzthe Clean Water and Clean Air Acts.11 Wastereduction audits are systematic, periodic inter-nal reviews of a company’s processes and oper-ations designed to identify and provide infor-mation about opportunities to reduce wastes.They provide a useful tool for companies un-dertaking systematic, comprehensive waste re-duction.
The comprehensiveness of waste reductionaudits and the types of actions that will emergefrom them also depend heavily on the wayterms are defined, Depending on how wastereduction is defined, the audit may or may notreview waste in all environmental media, fo-cus on reduction of waste generation at thesource, and measure reduction on a productoutput basis.ls
l:F~r more information on environmental auditing see, U.S.Congress, General Accounting Office, HAZARDOUS VVASTE:Federal Civil Agencies Slow to Comply with Regulatory Require-ments (Gaithersburg, MD: May 1986), pp. 51-59. Also, U.S. Envi-ronmental Protection Agency, “Environmental Auditing PolicyStatement, ” 50 Federal Register, Nov. 8, 1985; K. Geiser, “Criti-cal Elements of a Waste Reduction Plan, ” paper presented atGovernment Institutes Conference on Hazardous and Solid WasteMinimization, May 8-9, 1986, esp. p. IV-10; and M.A. Smith, AHandbook of En~’ironmental Auditing Practices and Perspec-ti~es in JVorth Carolina (Chapel Hill, NC: Institute for En\’iron-mental Studies, 1985).
.IzSee D. H Uisingh, et al., Proven Profits from po)]ution pre-
vention (Washington, DC: The Institute for Local Self-Reliance,]uly 1985), p. 15. A hierarchy for pollution prevention strategiesis also presented here which places waste audits at the top.
IsVery often, waste reduction audits are based on the EPA termwaste minimization which gives equal status to reduction andrecycling and so will identify such actions as equally valid op-tions, regardless of which poses a greater environmental risk.Often, too, waste reduction audits concentrate on RCRA wastesor wastes destined for land disposal and review other emissionsonly incidentally, These two problems are exemplified by the
(continued on next page)

Because waste reduction audits are new, theytake a variety of names and forms. Among com-panies that have started auditing, each tailorsits review to its own peculiar needs, Consult-ing firms that have begun marketing waste re-duction auditing each packages its procedurea little bit differently.la However, OTA was ableto identify a series of basic analytic steps in mostsystematic audits. The order of the steps mayvary and two or more may be combined, buteach of these points must be considered in anycomprehensive and systematic waste reductionanalysis,
Step 1: Identification of Hazardous Substancesof Concern in Wastes or Emissions
This analysis may be done at radically differ-ent levels of detail.
Level I:—Companies may make only a verygross analysis of the contents of their wastes.This occurs commonly in some small busi-nesses which may not have the people, money,or knowledge to conduct detailed analyses andcollect detailed data. In practice, this stage ofreview may be no more than the realization thata company is wasting a great deal of a chemi-cal. The focus in such cases is on quantitiesof particular wastes.
Level 11:—Companies may systematically con-duct chemical analyses of all their wastes overa given time (especially important in batch proc-esses where wastes vary) to get more precisedata about both chemical composition andamounts of waste. The difficulty here lies inidentifying and measuring all wastes, includ-ing all fugitive emissions, leaks, and spills.
Level Ill:—Companies can do mass balances onhazardous substances, By subtracting the amount
(i ontlnufd from pret ious page)
t~a~te reduction audit procedure found in C.H. Fromm and M .S.(Llllahan, “Waste Reduction Audit Procedure-A hlethodologjf [Jr Identification, Asswisment an(l Screening of t~aste hlinimi -zat ion options’” paper presented at a Hazarrfo~ls hlatcrials Con-tro) R(?sear(.h Institute c:onff?rf?n(, e, Atlanta, (;A. hlar. ~-[>, 1 $)8(; ,]
14S(~f:, for exam pl~~, K. II. I’olaseh, Chas. ‘I’, \la in, 1 n(,,, “(JoIl-
(Iu(,t I ng a \\’a stc \l i n I m izat if)r) A u(f it. /l[lZiiI’(l[)llS t~Il<l ,Soli{lL1’i],st(j ,!linimiz{]fifjn (l\r;ish ington, 1)(;: (1(1~[’rnn]cnt I nstitutes,
Inc.,, Nlay 1986), Also, N1, R, ()~er[.ash, ‘1’cc:hni(l[lf!~ ti)r III[iU\-/ri:il })C)/lIItJC)rI })re~’f~ntif)n [( :}lP1 \f:a . Nll: [.emis l)uhll~ht~rs, III( ,,
1986), p. 15.
Ch. 3—Technology and Waste Reduction Decisions ● 9 3
of a hazardous substance going out in the prod-uct from the amount purchased as raw mate-rial (and taking into account reaction processesand products), a company should be able to cal-culate how much of the substance is generatedas waste. However, accounting for all of thewaste streams, emissions, leaks, and spills inthe operations usually requires a great deal oftime and many resources, and such proceduresare generally considered only when an actionis required on a particular substance of con-cern. Even for a small manufacturing opera-tion, compiling and updating mass balance in-formation on even one hazardous substance inthe plant can be a big job. Moreover, no infor-mation specific to a process may be obtainedfrom a mass balance done on a plant basis,Chapter 4 discusses in more detail practicaldifficulties with conducting mass balance cal-culations of sufficient sensitivity to be usefulfor waste reduction,
Step 2: Identification of the Source(s) ofthe Hazardous Substance(s) of Concern
Identifying the process source of the wastefor a specific product is essential. Withoutknowing which processes are generating whichwastes a company cannot know what actionsare required to reduce those wastes. Uncover-ing this information may take time and re-sources and may be made more difficult byaccounting methods a company uses. If wastemanagement costs, for example, are routinelycharged to some general environmental oper-ation, then the connection between waste andproduction process and product may not beapparent.
Step 3: Setting Priorities forWaste Reduction Actions
Companies must decide which types of wasteto target for reduction and at which points inwhich processes, In practice, this may be anindependent, external decision directed for ex-
ample, by government regulations, rather thana free choice. In the absence of external deter-minants, recognition that a waste is environ-mentally hazardous may also play an impor-tant role in waste reduction decisions. To assist

94 ● Serious Reduction of Hazardous Waste
proper economic evaluation of the costs ofwaste generation and management and the sav-ings from waste reduction, waste generationshould be measured on a production output ba-sis. Not putting costs and savings on a productbasis could lead to poor business decisions, Forexample, what appears to be a relatively smallwaste management cost for a waste may beotherwise when assessed in relation to a smallprofit margin for a product and vice-versa.
Step 4: Analysis and Selection of Technically andEconomically Feasible Waste Reduction Techniques
After a waste is targeted for reduction, theproblem of choosing one or more feasible wastereduction techniques remains, Different tech-niques will offer different levels of effective-ness at a different cost and at differing levelsof risk, If there is no pressing reason to reduceone waste rather than another, companies maydecide to take action first on the wastes thatare the easiest and least costly to reduce andpostpone the more difficult waste reductionproblems for later, A great deal depends on theinformation base obtained, the technical re-sources, and the economic circumstances ofthe particular firm.
Step 5: Economic Comparison of Waste ReductionAlternatives to Waste Management Options
Once attractive waste reduction alternativeshave been identified, they still must be provenpreferable to pollution control. In most com-panies, waste management is the known, safeoption that provides a clear result for an invest-ment and creates minimal disruption and riskto production operations. For most firms, wastereduction is a newer approach that has the po-tential for widespread effects including inter-ference in process operations and possible al-terations of product quality. Waste reductionmay, therefore, be perceived as economicallyrisky by industry decisionmakers,
Step 6: Evaluation of the Progress and Successof Waste Reduction Measures
This step is critical to the disposition of thecompany to take further action to reduce waste.
Companies must document both the benefits andcosts of waste reduction, if they are to make in-formed decisions about whether to take furtherwaste reduction measures, Obtaining data regu-larly on waste generation on a production outputbasis is the best way to evaluate the technical andeconomic success or failure of waste reduction,
Constraints and Incentives AffectingWaste Reduction Decisions
Proven technologies and the opportunities in-dustries have for waste reduction do not them-selves guarantee these technologies will beused. Factors that affect the ability and will-ingness of companies to implement waste re-duction measures include:
1. the nature of the company’s industrialprocesses,
2. the size and structure of the company,3
4
56
technology and information available tothe company,attitudes and opinions that affect companyoperations,the economics of waste reduction, andgovernment regulations.
Whether these factors serve as constraints orincentives for waste reduction will vary evenamong different plants within the same company.
Because the Federal Government’s currentwaste minimization program is voluntary (seech. 5), the degree to which these factors moti-vate or deter industry from waste reduction hasdetermined the amount of waste reduction ac-complished to date, Understanding these con-straints and incentives is therefore essential forformulating Federal policy. They will affect reg-ulatory options, for example, because the eco-nomics of waste reduction in different indus-tries may influence the decisions governmentmakes about mandating levels of waste reduc-tion, However, these elements of industrialdecisionmaking are particularly important inassessing nonregulatory Federal policy options.Nonregulatory programs rely on persuasionrather than on coercion to influence decisions.
The following analysis attempts to shed lighton: 1) the relative importance of these factors

in different situations, 2) the relationship amongthese factors, and 3) opportunities that may ex-ist for government to manipulate these incen-tives and constraints to influence industrial de-cisions about hazardous waste reduction. Theanalysis must be prefaced with two points aboutindustry decisionmaking.
First, decisionmaking procedures in indus-try vary greatly; generalizations of the type pre-sented here will inevitably invite exceptions.This discussion deals with only a few of themost important and influential elements in in-dustry decisions. A wide variety of other con-siderations may also shape the decisions in aparticular company.
Second, change represents risk. If businessis going smoothly, the inclination is not to makechanges unless there is some clear reason todo so. However, if an industry is in trouble,there may also be resistance to innovation. Re-sources are likely to be concentrated on theobvious threats to survival rather than on mak-ing changes for waste reduction, Thus, in gen-eral, the burden is on the proponents of waste
Ch. 3—Technology and Waste Reduction Decisions ● 95
reduction to justify change. If the case forwaste reduction is not made clear to the indus-trial decisionmaker, waste reduction will nothappen.
Nature of Industrial Process
The most important factor in the ability ofany company to reduce its generation of haz-ardous waste is the character of its industrialprocesses, These determine the waste reduc-tion opportunities that will be appropriate andapplicable (see table 3-3). There are more op-portunities for waste reduction in some indus-tries and some processes than in others. Sev-eral features of industrial processes can beidentified which affect the probability thatwaste reduction opportunities will be available.
First, the frequency with which operationsandlor processes must be redesigned for rou-tine business reasons is important. For exam-ple, some manufacturers of consumer productsare under pressure to put out new product de-signs frequently. Most product changes requiresome type of operations change; frequent prod-
Table 3=3.—Potential for Waste Reduction Opportunities Across Different Industry Types
Company/industrial Operations In-process Process Input End DrOd UCtcharacteristicMature process technology,
high volume product
Example industries changes Recycling changes substitution changesRubber + +PetroleumCommodity chemicalsPaper productsLumber
Very stringent productspecifications or highproduct quality demands forhigh cost/high profitproducts
Frequently changing, high-tech products for industrialuse
Job shop processing of manydifferent industrial products
Changing productiontechnology for commoditygoods
Large-scale manufacture ofconsumer goods
PharmaceuticalsWeaponsRoboticsSpecialty chemicals
+ .
Electronic components + + +Medical equipment
ElectroplatingPrinting } + + +
FoundriesMachine shops } + + —
Steel making + + +Nonferrous metalsText iles
—
+
+
+
— —
Automobiles + + + + +AppliancesConsumer electronicsPaints
SOURCE Off Ice of Technology Assessment, 1986

~ . Serjous Reductjon of /-/~ardous Waste
uct reformulation makes a company consciousof its daily operations and of opportunities toreduce waste without endangering the newproduct design.
However, the relationship between productreformulation and process change (which tendsto be harder to implement than operationschanges) is more complex. Product reformula-tions may not require process changes. For ex-ample, changing the circuit design for a newmodel of a company’s personal computer doesnot change the requirements for plating andetching, which produce most of the industry’swaste. On the other hand, some product changesdo involve a different process, such as thosethat require completely different materials, Amanufacturer of home appliances, for example,may take advantage of the introduction of a newmodel of blender to switch from chromium plat-ing on the machine casing to a nickel platingor to a plastic unit. Some of these alterationsmay eliminate one hazardous waste, but pro-duce a new one.
It is even possible that product redesign mayforce changes that create more waste or morehazardous waste than previously. The semicon-ductor industry is starting to use gallium ar-senide (GaAs) semiconductors in some appli-cations. GaAs semiconductors are faster anduse less power than their silicon-based coun-terparts. The manufacturing processes are sim-ilar to those for silicon products, but the intro-duction of arsenic, a known human carcino-gen, increases the hazard of the wastes and in-creases the hazards in the workplace.15
Despite opportunities offered for waste re-duction, it is unrealistic to expect businessesto redesign products or processes except underpressure from the marketplace or when im-pelled to do so in order to comply with govern-ment regulations. Redesign of a product or aprocess is expensive and risky, When the mar-ket for a product expands, requiring additionalplant facilities, process change may becomemore feasible. For example, this has happened
~ssusan Sherry, et a]., High Tech and Toxics.. A Guide for Lo-cal Communities (Washington, DC: Conference on State and Lo-cal Alternative Policies, October 1985), pp. 109-112.
at times in the specialty chemicals industrywhere some firms have set up new productionlines for chemicals in high demand.
In some mature industries such as petroleumrefining and commodity chemicals, wherethere is little call for product or process change,opportunities for waste reduction may be lim-ited. In other mature industries, intense com-petition from overseas has stimulated the useof new but proven processes that permit themanufacturer to make a better quality and lessexpensive product. The textile and steel indus-tries are cases in point. However, even in ma-ture industries with little potential for processand product change, opportunities for opera-tional changes and in-process recycling mayexist and may offer broad benefits beyond wastereduction. They may not, however, be pursuedbecause of limited resources and other press-ing needs that have higher priority.
Another industry characteristic affectingwaste reduction opportunities has to do withthe product quality. Cases in which the mar-ket demands very high quality, as in pharma-ceuticals, may provide fewer opportunities forinput substitution or in-process recycling, Oper-ations in these plants may also produce largequantities of substandard product waste be-cause of the quality demands on the product.High-quality products generally carry both highcosts and profits, making such industries lesssensitive to waste management costs andreducing economic incentives for waste re-duction.
It may also be difficult to find less-hazardousor nonhazardous raw materials for the manu-facture of some high-performance machinery.Water-based paints are now being used in manyapplications since they eliminate the need forsolvents which then become hazardous wastes.While these paints may be perfectly adequatefor many household appliances, they may notbe adequate for the stresses placed on high-performance machinery, such as jet aircraft.
Product quality is by no means a considera-tion only for specialized industries (see box 3-E).One major automobile manufacturer recentlyconsidered installing a huge countercurrent

rinsing operation in a new plant to save waterand cut down on aqueous wastes from paint-ing, Prior to painting, auto bodies are dippedin successive baths which clean the metal ofdirt and oil, apply a zinc phosphate coating toincrease paint adhesion, and apply a chromiumanti-corrosion coating, Between baths the carbody is rinsed with a water spray. This is usualpractice in both this auto firm and among itscompetitors. When designing a new plant inan area of scarce water, it was proposed to con-serve water with a counterflowing rinse. Theidea was rejected in part because the companywas unwilling to risk problems such as paintpeeling and nonadhesion which might occurif the new rinsing procedures were less thor-ough than previous procedures. The companydecided that even if the procedure promisedto perform as well as the old method after ashakedown period they were unwilling to riskany interval of even slightly lower product qual-ity. They feared jeopardizing their standing ina market where foreign competition has madequality a major issue. This example is also anillustration of the problem of making changesin a production line that must perform with-out interruptions.
Another aspect of product quality which mayinfluence the ability of companies to modifyprocesses is the degree to which manufactur-ing processes are dictated by product specifica-tions. The Department of Defense (DOD) oftenspecifies manufacturing processes in its con-tracts as a means of maintaining quality in itshigh-performance equipment. These specifica-tions are usually based on design work doneby the DOD contractor and on extensive fieldtesting of products. Opportunities exist at thedesign stage for the manufacturer to incor-porate less waste-intensive features into theprocess, However, the procedure for modify-ing DOD specifications is so slow that even ifa contractor discovers less waste-intensivemethods of manufacturing products of equalquality, he almost certainly will not be able toimplement them within the time of his contract.Hindrances to the use of new waste reductiontechniques also arise from the fact that manytypes of DOD equipment stay in production for20 years or more.
Ch. 3—Techno/ogy and Waste Reduction Decisions ● 9 7
Rigid DOD specifications also raise the ques-tion of what level of quality is really necessary.For example, DOD requires cadmium platingon many of its aircraft parts since it is less sub-ject to corrosion than the more common nickelplating. However, cadmium is a particularlyhazardous material and from an environmentalperspective it would be beneficial to substitutenickel or some other material wherever possi-ble. A review of required performance levelsat the front end of the product-design processmight eliminate the need for some of this cad-mium. A review of all DOD specifications mighteliminate the need for other hazardous ma-terials.
DOD has recognized the barriers its speci-fications place on waste reduction efforts andis currently reviewing this problem as part ofits waste minimization efforts (see ch. 5).
Similarly, the Food and Drug Administrationplaces product formulation and process re-quirements on pharmaceuticals manufacturing.Government regulators are slow to grant per-mission for process modifications or input sub-stitutions in this area.
Size of Firm/Corporate Structure
The size of a company and the way it is struc-tured strongly influence the way it makes alldecisions, including those about waste reduc-tion, Small businesses tend to have fewer peo-ple involved in decisions about waste, and thosepeople are more likely to be familiar with theprocesses and wastes in question. In an elec-troplating shop employing 60 people, for ex-ample, a plant manager and company presidentor owner are likely to make all the decisionsabout wastes themselves and to implementchange without extensive memo writing, in-struction manuals, or clearance from superiors.
In large businesses, on the other hand, peo-ple intimately familiar with the processes areoften far removed from those with the powerto make decisions about plant operations andprocess change, Communication between groupsin large corporations can be an important bar-rier to implementation of waste reduction meas-ures. Decisions and plans made at the corporate

98 ● serious Reduction o f Hazardous Waste
level to reduce waste may not be well commu-nicated or well implemented at the plant level,particularly if these plans have been formulatedwith little coordination at the plant level.Another problem in large companies is thatenvironmental engineers are most often as-signed to the end of the process where theymanage the wastes that are produced, and itis usually they who are given responsibility forwaste reduction despite the fact that they havelittle contact with the design engineers and re-searchers who lay out the process at the frontend. Similarly, plant process and operationspeople may have only limited contact with thoseresponsible for major process and productchanges.
The number of people involved in decision-making differs from one company to another.Small firms are likely to make informal deci-sions, relying on their own professional judg-ment and experience since they are unlikelyto have the resources to undertake extensivequantitative assessments of alternatives. Inlarge corporations decisions are made or ap-proved by many people of diverse knowledgeand background who are often only peripher-ally familiar with the technology involved. Theneed to convince nontechnical managers thatwaste reduction measures are desirable and canbe financially justified requires quantifiable(i.e., economic) analysis. Large businesses aretherefore likely to make waste reduction or anyother environmental decisions slowly, to con-duct assessments of waste reduction options,and to formulate plans, programs, and goalsbefore implementing them, There are no datato prove that either of these decisionmakingstyles is intrinsically more or less favorable towaste reduction,
Among larger companies structure also af-fects how decisions are made. Some compa-nies are very decentralized, Each plant man-ager can make major process and operationsdecisions without corporate approval, In othercompanies, corporate headquarters governmany aspects of the day-to-day running of in-dividual plants. Again, neither of these situa-tions is necessarily more or less favorable to
waste reduction, but the diversity does meanthat different companies may be constrainedin different ways. A decentralized companymay have a strong corporate policy commit-ment to waste reduction, but if plant managersfeel there are insufficient incentives, reductionis unlikely to occur or will be implemented onlyslowly. Similarly, if a plant manager in a cen-tralized company is more interested in reduc-tion measures than are corporate managers andperhaps other plant managers, reduction meas-ures are unlikely to occur.
Technology and Information Available
Industry type and company size affect to whatextent new technology and information will beavailable to a company. In some industries agreat deal more information about waste reduc-tion techniques and technologies has been de-veloped than in others. Company size, and tosome extent industry/process type as well, af-fect whether a company can develop informa-tion and technology in-house when it is notavailable elsewhere. As mentioned earlier, sig-nificant change in company operations forwaste reduction is risky. Firms, therefore, lookfor techniques and technologies that have beensuccessfully demonstrated and used elsewhere,unless the alteration under consideration caneasily be tested or implemented. There are moreproven measures for some types of processesthan for others. A small but growing numberof vendors and consultants offer equipment andservices for waste reduction, Increasingly,sellers of waste reduction services are or werewaste generators who have successfully devel-oped procedures in-house and are profitablyselling their expertise and equipment to others.
Development and marketing of transferabletechnology is likely to occur among small firmswhich run generic operations and which areregionally based and therefore not in directcompetition. For example, printing firms andelectroplating job shops that do not competebut serve discrete local communities are indus-tries likely to market waste reduction tech-niques. Proprietary concerns frequently inhibitthis kind of technology transfer, particularly

Ch. 3—Techno/ogy and Waste Reduction Decisions s 99
when firms compete directly for the same cus-tomers. This is often the case in industrieswhere there are only a few large producers andmarkets are national. Commodity chemicals,for example, has always been a very competi-tive industry. However, larger producers arelikely to have their own R&D facilities to de-velop technologies in-house (see discussionbelow),
The dissemination of waste reduction tech-nologies and techniques is more complex thantransferring established pollution control tech-nologies to comply with the Clean Water orClean Air Act. End-of-pipe control usually re-quires a fairly limited set of solutions, often in-volving installation of an off-the-shelf piece ofequipment. Waste reduction, on the other hand,may involve a diverse set of techniques appliedat the front end to processes or equipment orwithin operations. A relatively small numberof reduction techniques are generic enough tobe transferred with simple off-the-shelf equip-ment or standard prescriptions. When avail-able, this equipment may only have the capa-bility of reducing a limited number of wastesat a plant and these may not be the wastes thatoccur in the highest volume or are the most haz-ardous.
There is, however, a large body of literatureabout waste reduction in a wide variety of in-dustrial processes, but technical assistancewithin a plant maybe necessary for implemen-tation. Only the least complex reduction ideas(e.g., housekeeping changes) are likely to bedirectly transferable to other plants, However,most of the process change literature is inade-quately detailed and very few industrial oper-ations are so generic as to allow direct imple-mentation of waste reduction measures frompublished materials without significant in-house research and experimentation. However,the sharing of information remains important,and just hearing about another firm’s success-ful action at a conference or through a publica-tion may be helpful.
Most waste reduction measures documentedby OTA have been the result of some in-houseresearch and development, tailoring techniquesto the needs of a particular operation. However,
only large firms are likely to have the moneyand, more importantly, the technical people toembark on large R&D programs to solve theirwaste reduction challenges. Smaller firms mayhave limited R&D facilities, particularly in indus-tries such as specialty chemicals where someamount of R&D goes on as part of business.
One common obstacle to waste reduction inmany smaller companies is that they purchasemuch of their technology and raw materialsfrom larger companies. Small printing compa-nies cannot begin using water-based inks untila major supplier brings them out on the mar-ket, Manufacturers of machinery are dependenton their suppliers to develop a quality lead-free paint before they can eliminate their leadwastes,
Small firms trying to avoid or reduce hazard-ous waste generation need information aboutthe chemical contents of raw materials fromsuppliers. Instead of listing the chemicals inthe raw materials, labels may simply state that:“contents are proprietary. ” Unless they knowwhat is going into their processes, users can-not screen inputs for unnecessary hazardousconstituents that may later appear in theirwastes (or products). For example, a small firmmaking caulking compounds and sealants thatdoes not generate hazardous waste ordered araw material from a supplier. The firm speci-fied that it did not want the material if it con-tained formaldehyde because formaldehydewould render the firm’s waste hazardous, Whenthe material arrived the label contained noinformation about constituents, but testingproved that the material did, indeed, containformaldehyde. Another firm might not have hadthe resources or the foresight to test.
The labeling problem has been somewhatalleviated by the institution of OSHA workerright-to-know measures which require that allvendors supply buyers with Materials SafetyData Sheets (MSDS) detailing all hazardous con-stituents, OTA has heard some complaintsabout lack of specificity on some MSDS, butthis requirement now gives buyers information(or allows them to demand information) vitalfor waste reduction and waste management aswell as for worker safety.

100 ● Serious Reduction of Hazardous Waste
Attitudes and Opinions Affecting the Company
Although there is no way to predict attitudesof top-level decisionmakers in a company, itis unquestionable that personalities and per-sonal attitudes do have an important effect onimplementation of waste reduction, This is par-ticularly true in small companies where a com-pany president or manager maybe personallyinterested in hazardous waste problems and be-come a leader in the field. Even among largecorporations, it is clear that some companiesare more or less well disposed toward expend-ing resources on environmental protection orwaste reduction, viewing these goals as essen-tial to the health of the company. A few com-panies, notably 3M, have gone so far as to artic-ulate and publicly support pollution preventionas an alternative to pollution control and in sodoing have created a positive attitude through-out the company toward waste reduction.
Lack of awareness about and commitment towaste reduction may influence actions involv-ing waste at all levels of company operations.Environmental engineers can be blinkered bytheir experience with waste management. Envi-ronmental protection has been equated withpollution control for so long that many envi-ronmental engineers may not think of wastereduction as a serious near-term, economicallybeneficial option for solving waste problems.Even if environmental staffs are interested inwaste reduction, they frequently are devotingall their time and resources to keeping the com-pany in compliance with pollution control reg-ulations.
Worker training is essential to educate peo-ple who operate processes about practiceswhich create less waste, These may includesimple things such as not leaving faucets run-ning and avoiding spillage. Some larger com-panies have already put together videotapesaimed at educating all levels of people in thecompany about the importance of reducingwaste.
Opinion outside the company may also in-fluence waste decisions made within the com-pany. Public opinion is important at a locallevel–in the siting of plants dealing with haz-
ardous materials—and at the national level, aspublic fear about hazardous wastes increasespressures for better waste management andwaste reduction. People in industry often feelthat these fears are overstated or unjustified andmay feel frustrated in their attempts to ally pub-lic fears about hazardous materials. The infor-mation the public receives about industrial haz-ardous waste is usually focused on accidentsand Superfund sites and is overwhelmingly neg-ative, Positive information about advances inwaste management or waste reduction rarelymake front page news. In addition, many of thehorror stories about hazardous wastes, particu-larly at Superfund sites, came about becauseof waste handling practices of the 1950s, notthe 1980s. Thus, despite their desire to calmpublic fears, industry decisionmakers often feelthat they have little to gain by compiling andpresenting information about successful wastereduction and management programs for thepublic. On the other hand, some companieshave used waste reduction as an opportunityto portray a more positive image of their com-pany for the public, and more may do so. Fi-nally, some firms are committed to the sitingof new hazardous waste management facilitiesand waste reduction may be perceived as athreat to siting; much depends on the extentto which waste reduction is perceived as a near-er long-term opportunity.
Economics of Waste Reduction
Economics is the driving force for most busi-ness decisions, and waste reduction decisionsare no exception. Assessment of financial costsand benefits can act as either an incentive foror a constraint on waste reduction dependingon a company’s or a plant’s circumstances. Ifan operation’s waste management costs arehigh and it finds that it can institute significantwaste reduction measures with relatively lowcosts, thereby saving on waste management ex-penditures, the company will be inclined to re-duce waste, If, on the other hand, waste man-agement costs are low relative to total costs orif costs (e. g., cleanup liabilities) are not imme-diately born by that operation, a company maydecide not to disrupt or put at risk its processes,

operations, and products with waste reduction,even if some relatively easy, low-cost reductionmeasures are available. The outside analyst gen-erally does not attempt to estimate the economicconsequences of such disruptions and risks andfor this reason the costs of waste reduction maybe perceived in a more positive light than iswarranted.
According to the respondents to OTA’S indus-try survey, the rising costs of waste managementand associated liabilities for waste disposal arethe primary considerations of companies thatplan to implement waste reduction. These con-siderations are more critical to industries inwhich waste management costs are a high pro-portion of operating costs or of profits, Exam-ples include electroplating, steelmaking andcommodity chemicals, and companies thathave already experienced substantial penaltiesfor past waste management practices. Indus-tries in which management costs area low per-centage of operating costs are less likely to besensitive to high waste management costs. Evenfor generators whose current costs are notlarge, the threat of future liabilities may raisethe specter of enormous long-term costs ofwaste management. But these liabilities are usu-ally speculative and may be discounted in termsof present dollar value or maybe given less im-portance because management believes thatchanges in government policy may reducethem.lo
On a more day-to-day level, the accountingprocedures companies use for waste manage-ment costs affect the ways in which waste re-duction decisions are made. Particularly im-portant is the degree to which companies assignwaste management costs (including liabilitycosts) to the processes or plants which producethe waste. If a company has an onsite wastetreatment plant with its own budget and allprocesses within the plant send their wastethere and are not accountable for that manage-
l~one example ~ f a change in go~’ernment [)01 icj which ma~rreduce liability is E PA’s current reexamination oft he defin it ionof hazardous waste u rider RC RA. Some generators may believethat their wastes will not be hazardous under th(? new definitionand ma} therefore not be willing to in~rest much effort in reduc-ing the i r ~eneration.
Ch. 3—Technology and Waste Reduction Decisions ● 101
ment cost, process engineers and supervisorshave little incentive to examine their operationsfor waste reduction opportunities. If, on theother hand, companies trace waste back to theprocesses generating it and incorporate wastemanagement costs into the process manager’sbudget, the people who are intimately familiarwith the process have an incentive to searchfor ways to reduce the amount of waste gener-ated. Thus, to the extent that total waste man-agement costs are strictly accounted for as pro-duction costs, they will act as incentives forinvesting in waste reduction.
Accounting procedures may also influencethe probability that waste reduction measureswill compete successfully for limited companyfunds. The way in which return on investmentis calculated and the extent to which and theway in which waste management costs are in-corporated into investment calculations will in-fluence the amount of capital investment and,therefore, the kinds of waste reduction meas-ures a company is likely to take.
This competition occurs on two levels. First,environmental programs, in general, and wastereduction programs, in particular, must com-pete with all other potential uses of an opera-tion’s limited capital funds. If a firm is facedwith choosing between investing in a new prod-uct line, purchasing less labor-intensive equip-ment for its current processes, or making proc-ess alterations which will reduce waste, a firmmay calculate that it will get a better return oninvestment from one of the first two optionsthan from the waste reduction option,
Further, most operations have a single bud-get for environmental programs and this in-cludes waste reduction. In such operationswaste reduction must compete with waste man-agement and compliance programs for fundsand attention. Waste management options areoften difficult to compete with when reasonsfor implementing them are painfully clear, asin a firm that is being threatened with citationsfor noncompliance with pollution control reg-ulations. In addition, waste management pre-sents a clearer, surer investment option in theeyes of most generators who see off-the-shelf

102 ● Serious Reduction of Hazardous Waste
pollution control equipment and operationschanges as proven. Waste reduction options areusually newer, methods may be unproven, andthe results unpredictable,
The uncertainty about the costs of implement-ing waste reduction measures is critical to deci-sionmakers who want reliable figures on wastemanagement savings, labor, capital and oper-ating costs, as well as on the costs or savingsin raw materials resulting from the waste re-duction measure, However, changes at the frontend of an operation tend to have ripple effectsthroughout, and quantifying all of these effectsand their costs or savings can be extremely dif-ficult. Isolating waste reduction may result insmaller benefits, while seeing it as part of abroader innovation or change in productionmay increase its costs, Clearly, there are waysto make waste reduction appear more or lessattractive economically. Since, as noted above,decisionmakers in business tend to avoid un-necessary risk, the difficulty in coming up withfirm figures on waste reduction investmentshandicaps them in competing for limited com-pany dollars.
Government Regulations
Despite widespread noncompliance and com-plaints about ineffectiveness, environmentalregulations significantly influence the waysbusinesses make decisions about waste. Theseregulations may be of two types; they maydirectly require that business take action or theymay affect the environment in which busi-nesses make decisions. Probably the most in-fluential government measures to date havebeen of the latter variety, such as the joint andseveral liability for Superfund sites and theenactment of land disposal bans in the 1984RCRA Amendments. Both of these measureshit directly at the financial calculations whichdetermine waste-related decisions.
Industry responses to government require-ments for environmental action vary with thesize and structure of the company as well aswith more intangible factors like plant manage-ment and corporate attitudes. Small companiesare less likely to have the resources and per-
sonnel to keep up with all of the details of gov-ernment regulation and may simply throw uptheir hands and hope that their small size willmake them unlikely targets for enforcement,Large corporations that may have other reasonsfor believing that enforcement may not occurstill usually have environmental compliancestaffs assigned to keep track of regulations, Thejob of these environmental engineers, however,is environmental compliance and pollution con-trol, rather than environmental protection orpollution prevention in the larger sense. Thisdistinction bears directly on the ways in whichlarge companies currently make decisionsabout waste reduction, Environmental engi-neers in large companies sometimes say thatthey have trouble getting support from man-agement for environmental actions which arenot required by regulations, such as audits totrace waste to processes,
Current environmental regulations may havehandicapped waste reduction in several ways,First, the existing elaborate framework of pol-lution control laws has become the center ofthe environmental protection arena. Controllaws are both established and—in theory, if notalways in practice—enforceable, The wasteminimization program set up in the 1984 RCRAAmendments is both new and voluntary. It ishardly surprising that companies concentratetheir efforts on avoiding penalties and install-ing proven and accepted methods of environ-mental protection rather than investing re-sources in voluntary programs they know littleabout.
Second, the current waste minimization pro-gram under the 1984 RCRA Amendments is notdesigned to give companies strong incentivesto promote waste reduction. As discussed else-where, the language of the national policystatement in the amendments makes clear theprimacy of waste reduction but subsequent sec-tions of the statute give equal attention to goodwaste management. In the regulations promul-gated under the amendments, the concept ofwaste reduction as defined in this study andin the national policy statement has all but dis-appeared, Under the regulations, waste mini-mization appears to mean any measure that

Ch. 3—Technology and Waste Reduction Decisions “ 103
avoids landfilling hazardous materials. People to the attention of corporate decisionmakersin industry are, not surprisingly, reacting to the in an unprecedented way. The amendmentsregulations rather than the policy statement and have also provided environmental engineershave adopted this latter interpretation of waste with a justification for implementing waste re-minirnization as the basis for their efforts. duction measures or, at least, collecting waste
The extent to which this program will promptreduction information. On the other hand, itis clear that these voluntary efforts under RCRA
extensive action in large corporations is not yet will focus on minimization of RCRA wastes;clear, Preliminary signs suggest that the amend- they are unlikely to aim at multimedia wastements are affecting corporate thinking—thatthey are bringing waste minimization and bet-
reduction. How significant or far-reachingthese voluntary actions will be is unclear and
ter waste management, if not waste reduction,lT is Iikelv to remain so since, as discussed else-———— where “in this report, no meaningful data are1 Tsee ~hs, 1 a n~ ~ for d i s(: uss ions of the differences between
being collected on current waste reductionwaste m i n i m izat ion and waste reduction and whv thet’ are im-portant to OTA’s stud} efforts.
HOW MUCH WASTE REDUCTION IS POSSIBLE?
Why People Ask This Question
In view of the very large number of targetsfor waste reduction, the many ways to achieveit, and the lack of data, it is impossible to fore-cast future levels of waste reduction even ap-proximately. Nevertheless, from a public pol-icy perspective it would be useful to get a handleon the upper technical bound for waste reduc-tion. No matter how much waste reduction mayalready have been accomplished, unless thepotential amount is known, there is always un-certainty and even suspicion about the signifi-cance of the effort. That is, the degree of un-realized waste reduction potential is seen asthe definition of the problem; the higher thepotential, the stronger the case for doing some-thing (e. g., government setting new policy orindustry spending more money). Although thismight make some sense on environmentalgrounds, effective waste treatment is also anoption and it may not always make sense to re-duce wastes at a specific site. A point ofdiminishing returns is possible for waste re-duction.
For example, when the polymer polyethyl-ene was first manufactured in the early 1940sthe amount of waste was 80 to 90 percent ofthe original raw materials. The waste is nowless than 5 percent. But this does not necessarily
say anything about how much of the currentwaste might be reduced nor whether its chem-ical nature, amount generated, and the way itis managed or released at specific sites resultsin environmental risks that might be reducedor avoided, Further waste reduction may ormay not make environmental or economicsense, but that cannot be known unless the pos-sibility of waste reduction is seriously ex-amined.
Even
Why Forecasts Are Uncertain
if general economic factors are ex-cluded, estimates for technically and economi-cally feasible amounts of waste avoidance andreduction in the future are uncertain because:
There are too many industrial processesand wastes—certainly tens of thousands—to examine each in detail.laWaste generation and reduction are plant-and process-specific, but the limited wastegeneration data available are aggregatedover many processes and usually over adiversity of plants and companies.It is not known how much waste in all (notjust RCRA waste) was and is now being
laChemical Waste Management, Inc., has identified nearl}’100,000 different wastes in its waste management business.

704 ● Serious Reduction of Hazardous Waste
●
●
●
●
generated; therefore, reduction cannot bedocumented.There is no base year for all data.It is difficult to predict what changes inproduction technology and products willoccur over a broad range of industry forreasons unrelated to waste, and such changescan substantially change the nature orquantity of waste, or both.Considerable amounts of wastes (particu-larly as regulated under the Clean Waterand Clean Air Acts) are legally sanctionedand continued implementation of environ-mental programs will create more waste(e.g., pretreatment standards under theClean Water Act increase the generationof solid, hazardous wastes).Many regulatory, enforcement, and judi-cial actions that affect the economic feasi-bility of and perceived need for waste re-duction may occur.
Limited Expertise Problem
There is always an important systematic er-ror in any estimate of future waste reduction.Considering the range of technical approaches,the best any analyst will be able to do is to makeestimates for the techniques that are easiest touse, such as in-process recycling. Much moredifficulty will be encountered in estimatingwaste reduction for the other approaches. Noperson or group, either outside or inside a com-pany, is likely to have detailed informationabout enough industrial technologies and proc-esses to be able to estimate the results of all ormost of the changes that may, to varying de-grees, reduce waste. Consequently, estimates,even by those in industry responding to a sur-vey or those studying the technical literatureand making professional judgments, are likelyto be on the low side and to vary greatly. Inmost estimates there is little information aboutthe approaches to waste reduction that wereconsidered and how they were applied to in-dustry sectors or waste streams.lg
IBA good example of this problem is the information in U.S.Congress, Congressional Budget Office, Hazardous VVaste Man-agement: Recent Changes and Policy Alternatives (Washington,DC: U.S. Government Printing Office, May 1985). Information
Facility Siting Bias
Some States have made estimates of futurewaste reduction, often in association with at-tempts to site waste management facilities,Such estimates are made in the context of thecurrent system; that is, a predominantly volun-tary approach to waste reduction which is notbeing implemented as if it had primacy overpollution control, In the context of siting, littleattention has been given to the potential impor-tance of waste reduction in: 1) reducing the needfor more sites, and Z) assuring the public thateverything has been done to reduce the num-ber of sites that will be needed. State agenciessponsoring these estimates often have a biastoward siting waste management facilities,Moreover, the forecasts are based on surveysof generators who send large amounts of wasteoffsite, Therefore, they are likely to err on thelow side; that is, to underestimate the amountby which waste reduction may reduce the needfor waste management facilities. Also, wastegenerators naturally want to keep waste man-agement costs low, which can be accomplishedin part by ensuring enough offsite capacity,
Diffusion of and Access toWaste Reduction Technology
Waste reduction in the future will be affectedby the extent to which information and prod-ucts are diffused throughout industry and areavailable to companies. For the most part, thecountry is in the early stages of transferringwaste reduction technology. Indications of thisprocess are:
Companies that have been successful atwaste reduction are making their knowl-edge and expertise available to other divi-sions and are sometimes profitably sellingthe technology to other companies.State programs generally focus on effortsat transferring information and providing
—given on changes in waste generation due to waste reductionis misleading because limited information prevented the full rangeof techniques from being considered, although this was not very
clearly stated. Tbus, the total waste reduction amounts reportedare systematically low.

—
—
●
●
●
●
technical assistance, particularly to smallercompanies.There are increasing numbers of confer-ences, workshops, awards presentations,publications, and courses helping to spreadinformation.More information is becoming availablefrom other nations where there sometimesis a longer history of interest in low-wasteor pollution-free technologies.Some companies in the waste managementindustry are beginning to develop commer-cial ways of developing, applying, andtransferring waste reduction technology.Financing is becoming available for wastereduction activities, although financing islikely to remain a problem for many firms.
Under current Federal and State programsthere will not be a very comprehensive or effi-cient transfer of technology and informationin the near future, Because waste reductiontechnology is evolving from simpler to morecomplex and process-specific techniques, it willbecome more difficult to transfer. In-processrecycling and plant operations add-on tech-niques, currently emphasized, are the easiestto transfer across companies and industries.One other type of waste reduction is also read-ily transferable; that is, the substitution of cer-tain raw materials to common manufacturingoperations. An example previously mentionedis the replacement of solvent-based inks withwater-based ones; some printing plants haveessentially eliminated their generation of spentsolvents in this manner. Companies that man-ufacture products used by other companies asraw materials will increasingly commercializenew products with waste reduction advantagesfor sale to U.S. industry and in foreign markets.
Competition From WasteManagement Alternatives
The degree to which waste technologies areimplemented in the future will depend stronglyon alternative waste management methods.Different approaches to waste reduction will,to some extent, compete with each other, andthe competition between waste reduction and
Ch. 3—Techno/ogy and Waste Reduction Decisions ● 105
the more traditional waste management ap-proach will persist. Current corporate effortsto market more effective waste managementtechnologies and pollution control techniquesand to site new waste management facilitiesare not necessarily consistent with fosteringwaste reduction at the source. Indeed, in the1984 RCRA Amendments there is some con-flict between the goal of waste minimizationand that of waste reduction.
Waste minimization is generally taken tomean reducing the amount of waste that is landdisposed (see ch. 5). Lack of data and impre-cise forecasts contribute to the attitude thatenvironmental protection means only betterwaste management. Although it is better to treatwastes to render them permanently harmlessthan to use any form of land disposal, it is stillbetter to avoid or reduce the generation of haz-ardous waste, if it is technically and economi-cally feasible. Any waste management activ-ity will pose some environmental risks andrequire regulation. There is no fundamental rea-son to believe that waste management, whichinvolves repeated spending, is always or evenusually more economical than waste reduction,although it may be in some circumstances. Itis because waste management has been inex-pensive that there often has seemed to be littlepoint in cutting costs by not generating wastesto begin with. For some time to come, wastereduction, particularly by more costly methods,will face competition from waste treatment anddisposal technologies. (Most available data re-veal no sign yet of a major decrease in the useof land disposal, ) This may change, however,because of the closure of onsite waste manage-ment facilities which have not been able to com-ply with new RCRA requirements which havenot been able to comply with new RCRA re-quirements, increased production levels, anduncertainties about how some of the 1984amendments to RCRA—notably the land dis-posal bans—will be implemented.
Waste management will remain a viable alter-native for the foreseeable future. Both govern-ment and industry will make many decisionsaffecting the competition between waste reduc-

106 ● Serious Reduction of Hazardous Waste
tion and waste management, and these arenearly impossible to forecast.
Review of Current Forecasts
Table 3-4 summarizes information and com-ments about several State efforts to obtain in-formation on waste generation and reduction,The following observations can be made aboutthe
●
●
●
●
●
State information:
Except for a downturn in 1982 to 1983,probably due to the economy, aggregatedState data now show a trend toward anincrease in hazardous waste generationbecause of economic growth and otherfactors,States are preoccupied with the issue ofsiting hazardous waste management facil-ities for wastes shipped offsite.Analyses of waste reduction are usuallydone for offsite wastes. These are onlyabout 10 percent of the Nation’s total gen-eration; they may, however, represent high-hazard wastes.Although it is difficult to compare Statestudies, estimates of waste reduction forseveral States using similar methods varysignificantly (Missouri, 4 percent; New Jer-sey, 7 percent; New York, 16 percent; Penn-sylvania, 23 to 27 percent; Minnesota, 47percent) 0
20
No attention has been given to non-RCRAwastes.Estimates for increases in hazardous wastegeneration due to increased water pollu-tion control are relatively low but are onlyfor wastes shipped offsite. They may bemisleading because most pretreatment willbe done onsite by large waste generators.No data are given for pastor future plant-specific waste reduction.
In a Congressional Budget Office (CBO) studythe data given indicate a total of 18 percentRCRA hazardous waste reduction nationwide
Zoone possible explanation of this rather large range of esti-mates is that the types of industries vary greatly among theseStates, but other factors may also be important, such as varyingdefinitions and varying perceptions by survey respondents ofwhat is possible and what is likely in the near term.
over the period 1983-90. However, most of this—12 percent—is accounted for by volume re-duction by dewatering, a practice OTA consid-ers not environmentally significant. The re-mainder is accounted for by material recovery,but much of this is probably offsite and notwithin OTA’S definition for in-process recy-cling. The CBO study did not consider the fullrange of techniques because of a lack of infor-mation. This is an understandable limitationcommon to most analyses, but it is not alwaysmade clear. Thus, the total waste reductionamounts reported are systematically low withregard to the reduction of waste at the source. zl
A survey of companies for the Tennessee Val-ley Authority in 1984 found that by the year2000 total RCRA waste reduction could be 11percent for wastes which could be incineratedand 33 percent for wastes normally depositedin landfills.zz The study used 1984 as a base yearand kept production levels constant; a verysmall sample of companies were surveyed.
Although for most cases it is, in principle,impossible to reach zero waste generation, inOTA’S survey, which stressed technical feasi-bility and a broad definition for hazardouswaste, 11 percent of the respondents felt that50 to 75 percent reduction was possible througha variety of efforts; 25 percent of the respond-ents felt that 25 to 50 percent was possible, and59 percent felt that less than 25 percent reduc-tion was possible. But, again, such estimatesmay be low.
—-‘~lcongressiona] Budget Office, Ffazardous Waste Management:Recent Changes and Policy Alternatives, op. cit. Another aspectof this study is that it is essentially an analysis based on model-ing. Although the total amount of waste generation obtained isin agreement with other data sources, none of the other detaileddata which deal with the distribution of waste generation amongwaste types, industries, management technologies, or States arein agreement with other data sources.
ZZBattelle Columbus Laboratories, “Report on Hazardous WasteManagement Needs Assessment, ” June 1984.

——
Ch. 3—Technology and Waste Reduction Decisions ● 107
Table 3“4.—State Information Related to Waste Reduction
ILLINOIS: The State Environmental Protection Agency collects data on generation of hazardous waste from all generators:
Millions of gallons
1982 ~ 983 1984
547.3 460,7 526.2
The agency does no analysis of these data for waste reduction.
SOURCE” Illlnols Environmental Protection Agency, Surnrnary of Annual Reports on Hazardous kVasfe for 1982, 1983, 1984, September 1985
MICHIGAN: State Department of Natural Resources data on generation of RCRA hazardous waste:
1983 425,000 tons
The Department estimated 6 percent maximum increase in generation from 1980 to 1990 attributable to economic develop-ment. After other factors were considered (waste reduction not among them) it is said that a 10-percent increase comparedto 1983 is reasonable for existing generators. Very little consideration of waste reduction.
SOURCE Mlch(gan Department of Natural Resources, Hazardous Waste Management in M/chigan, March 1984
MINNESOTA: The Waste Management Board has compiled data principally to aid in estimating the need for a hazardous wastedisposal facility in the State. The Board’s data on generation of industrial hazardous waste (RCRA waste only):
1984 123,000 tons
Of this total 31,000 tons is managed onsite. Estimates of waste generation in the years 1990 and 2000 are based on combinedeffects of economic growth and waste reduction efforts. Detailed economic growth rates for industry segments are given.Estimates of waste reduction for the year 1990 are based on 97 estimates of reduction by waste type and industry segment.From 1984 to 1990 waste generation is projected to increase to 153,000 tons because economic growth outweighs waste re-duction (no waste reduction figure given). For the year 2000, a weighted average of percent reduction figures given for wastetypes (without industry segments) yields an estimate of 47 percent reduction relative to 1984. Waste generation in the year2000 estimated to be 126,000 tons due to additive effects of slower economic growth and increased waste reduction. OnlyRCRA wastes considered. Analysis also given for reduction of waste treatment residuals.
SOURCE Minnesota Waste Management Board, Es//mate For Need, 1985 -.
MISSOURI: Study for the Environmental Improvement and Energy Resources Authority focused on the possibility of a Stateowned hazardous waste treatment and resource recovery facility. Generation data therefore includes only wastesshipped off site:
1982 1983 1987 2002
57,000 56,000 61,000 85,000 tons
Projections for future years are based on economic growth, source reduction, and projected additional RCRA waste from pretreat-ment (10,000 tons in 1987 and 13,000 tons in 2002). Source reduction for 1987 is estimated at 4 percent (2,000 tons); no furtherreduction is projected thereafter (3,000 tons in 2002), even though it is stated that “much more waste reduction may occurby 2002. ” Estimates are based on reduction of eight wastes in seven industries.
SOURCE” Enwronmental Improvement and Energy Resources Authority, Mlssourl Hazardous Waste Treatment and Resource Recovery Faci//fy Feas/b/llfy, January 1985— —
NEW JERSEY: The Facilities Siting Plan focuses on siting commercial hazardous waste management facilities and, there-fore, uses data on wastes shipped off site (manifest data):
1981 1982 1983
412,000 344,000 403,000 tons
Projected waste reduction for 1988: 33,000 tons. This is relative to 460,000 tons used as a composite average for 1981-83 plusthe effects of economic growth. The result is a waste reduction estimate of 7 percent over about a 6-year period, based onestimates for 30 industry-waste type possibilities (4 of which were increases). No similar analysis is given for waste generatedand managed onsite (1 1,767,000 tons for 1983, based on 242 annual reports). Potential increase in hazardous waste due tonew actions under Clean Water Act: 33,000 tons. No consideration of reduction of non-RCRA wastes.
SOURCES New Jersey Facllttles Siting Commission, New Jersey Hazardous Waste Fac///eses Plan, March 1985

108 ● Serious Reduction of Hazardous Waste
Table 3-4.—State Information Related to Waste Reduction—Continued
NEW YORK: The State Department of Environmental Conservation uses the following generation data on manifested, off siteRCRA wastes for siting purposes:
1982 1983
285,000 251,000 tons
Projections are made as follows for other years, based on consideration of many factors including economic growth and sourcereduction, but no details are given:
1984 1988 1994
280,000 308,000 365,000 tons
For one 1986 scenario involving high waste reduction, an additional degree of waste reduction (for RCRA wastes only) is specifiedabove that presently planned by industry; reduction there is projected to be 48,400 tons, or 16 percent, of the 1988 base. Thisis based on estimates for 34 waste types (no industry segment breakdown), of which 24 had no change.
SOURCE New York Department of Environmental Conservation, New York State Hazardous Waste facilities Needs Assessment, March 1985,
NORTH CAROLINA: The Governor’s Waste Management Board uses data for RCRA hazardous waste shipped off site becauseof its interest in siting:
1981 1982 1983
48,650 42,800 52,550 tons
No analysis of data for waste reduction.
SOURCE: Governor’s Waste Management Board, Hazardous Waste in North Caro/ina, undated
PENNSYLVANIA: Data on waste generation compiled by the Department of Environmental Resources are used for siting andtherefore focus only on manifested, off site RCRA waste:
1981 1982 1983 1984
774,0001 485,000 598,000 639,000 tons
Projected waste reduction for 1990: 181,000 tons (expected case) and 211,000 tons (high source reduction scenario) relativeto composite (1982-84) base of 661,000 tons, accounting for economic growth only. That is a reduction of 23 and 27 percentover about a 5-year period. These figures are based on estimates for 104 industry-waste type possibilities (16 of which hadno change). Data may be misleading as source reduction may include actions that reduce waste shipped off site, but sti II gen-erated. For waste generated and managed onsite (4,200,000 tons for 1983), no similar analysis of reduction is given. Potentialincrease in amount of hazardous waste generated due to new actions under Clean Water Act estimated at 4,000 tons. No con-sideration of reduction of non-RCRA wastes.
tCalculated by OTA on basis of reported data.
SOURCE Pennsylvania Department of Environmental Resources, Pennsylvania Hazardous Waste Fac//ities P/an, draft, November 1985— --
WISCONSIN: Department of Natural Resources RCRA hazardous waste generation data:
1979 1984
300,000 to 500,000 125,000 tons
Change attributed to waste reduction without detailed analysis of other factors. Goal of 100 percent reduction and recoveryfor 8,000 tons land filled in Wisconsin (another 26,000 tons Iandfilled in other States) in 1984, but now Wisconsin has no land-fill capacity for hazardous waste.
SOURCE: Wisconsin Department of Natural Resources, Wisconsin Waste Reduction and Recovery Plan, August 1985

Ch. 3—Technology and Waste Reduction Decisions “ 109—
CONCLUSIONS
There are technical reasons for concludingthat it is not possible to accurately estimate fu-ture waste reduction in terms of the maximumtechnologically possible. Indeed, the technicalpossibilities for waste reduction are rapidlychanging. Moreover, estimates are likely to below. People outside of industry are not likelyto be sufficiently familiar with industrial oper-ations to make good forecasts. People in indus-try are unlikely to be able to assess the full rangeof waste reduction techniques possible—andnot merely likely—in the near term and longrun.
The technological potential for waste reduc-tion is substantial, although it is quantifiableonly in the most approximate terms, across bothindustries and waste types. The conclusion thatthere are many opportunities for waste reduc-tion in the future rest on evidence that indus-
try has not yet been sufficiently motivated, hasnot had enough time to do more than get started,and has only begun to exploit the possibilitiestechnology offers.
It might be more useful to focus on a wastereduction goal rather than to try to calculatehow much is possible. For example, a goal ofperhaps 10 percent annually might do muchto stimulate and draw more national attentionto waste reduction. This goal is consistent withresults obtained so far and with goals used bysome companies. If waste reduction is to off-set increases in waste generation from eco-nomic growth and increases from more wastesbecoming regulated under pollution controlprograms, then such a goal maybe needed justto hold the line on requirements for hazardouswaste management.