chapter 53: causes and consequences of inflation...
TRANSCRIPT

Chapter 53: Causes and consequences of inflation
and deflation (2.3)
“Having a little inflation is like being a little pregnant – inflation feeds on itself and quickly passes the
‘little’ mark.” Dian Cohen.
Key concepts
Causes of inflation
o Demand pull inflation
o Cost-push inflation
o Excess money supply
Causes and consequences of deflation
Counter-inflationary policies
Evaluation of counter-inflationary policies
Consequences of deflation
• Discuss the possible consequences of deflation including high levels of cyclical unemployment and bankruptcies
Types and causes of inflation
• Explain, using a diagram, that demand pull inflation is caused by changes in the determinants of AD resulting in an increase in AD
• Explain, using a diagram, that cost-push inflation is caused by an increase in the costs of factors of production resulting in a decrease in SRAS
• Evaluate government policies to deal with the different types of inflation
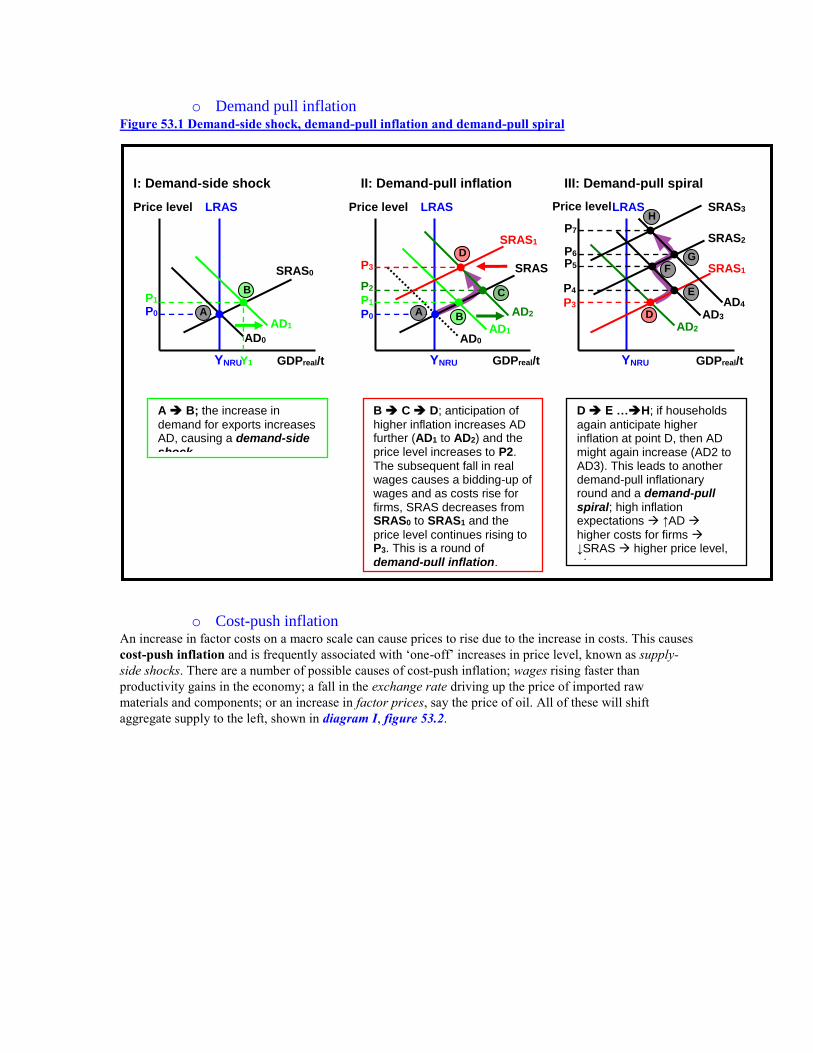
o Demand pull inflation Figure 53.1 Demand-side shock, demand-pull inflation and demand-pull spiral
o Cost-push inflation An increase in factor costs on a macro scale can cause prices to rise due to the increase in costs. This causes
cost-push inflation and is frequently associated with ‘one-off’ increases in price level, known as supply-
side shocks. There are a number of possible causes of cost-push inflation; wages rising faster than
productivity gains in the economy; a fall in the exchange rate driving up the price of imported raw
materials and components; or an increase in factor prices, say the price of oil. All of these will shift
aggregate supply to the left, shown in diagram I, figure 53.2.
I: Demand-side shock
A B; the increase in
demand for exports increases AD, causing a demand-side shock.
LRAS Price level
GDPreal/t
AD0
P0
YNRU
P1
Y1
SRAS0
AD1
B
II: Demand-pull inflation III: Demand-pull spiral
B C D; anticipation of
higher inflation increases AD further (AD1 to AD2) and the price level increases to P2.
The subsequent fall in real wages causes a bidding-up of wages and as costs rise for firms, SRAS decreases from SRAS0 to SRAS1 and the
price level continues rising to P3. This is a round of
demand-pull inflation.
D E …H; if households
again anticipate higher inflation at point D, then AD might again increase (AD2 to AD3). This leads to another demand-pull inflationary round and a demand-pull spiral; high inflation expectations ↑AD
higher costs for firms ↓SRAS higher price level,
etc.
LRAS Price level
GDPreal/t
AD0
P0
YNRU
P1
SRAS
0
AD1
A AD2
P2 C
SRAS1
P3 D
LRAS Price level
GDPreal/t
AD3
P4
YNRU
SRAS2
E
AD2
SRAS1
P3
P5
AD4
P6
SRAS3
P7
F G
H
D B A

Figure 53.2 Supply-side shock, cost-push inflation and cost-push spiral
I: Supply-side shock
A B; an increase in factor
costs causes a decrease in SRAS. This is a supply-side
shock.
LRAS
Price level
GDPreal/t
AD0
P0
YNRU
P1
Y1
SRAS0
SRAS1
A
B
LRAS Price level
GDPreal/t
AD0
P0
P1
SRAS0
SRAS1
A
P2
SRAS2 LRAS Price level
GDPreal/t
P4 P3
SRAS2
II: Cost-push inflation
AD1
AD1
D P3
SRAS3
SRAS4
AD2
AD3
P5
P6
P7
III: Cost-push spiral
B C D; the decrease in
real wages causes labourers to bid up wages and SRAS continues to decrease (SRAS1 to SRAS2). When
higher wages fuel consumption, AD increases from AD0 to AD1. We’ve now
seen a complete round of cost-push inflation.
D E …H; Should
labourers continue to bid up wages after the increase in AD (point D), another round of cost-push inflation commences. We now have a
cost-push spiral: price
level ↑wages ↑costs to firms ↑price level, etc.
E
F
G
H
D
B C
YNRU YNRU

(Type 3 Medium heading) The monetary transmission mechanism Figure 53.3 The (monetary) transmission mechanism
I: Supply and demand for
money
LRAS Price level
(index)
YNR
U
P0
Quantity of money ($bn/year)
Investment ($bn/year)
Dm
Sm0
I
II: The investment
schedule III: Affect on aggregate demand
r0
Q0 Q1
I0 I1
AD0
P1
Y1
AD1
SRAS
Interest rate
(%/year) Sm1
r1
r0
r1
GDPreal/t
Interest rate
(%/year)
Increased supply of money..........lowers the rate of interest..........which stimulates C and I in AD.

(Type 3 Medium heading) The neo-classical view of money-driven inflation – LR effects It is important to realise that monetarist theory views any increase in money that is not matched by an
increase in real potential output (LRAS) as being solely inflationary in the long run. As the increase in AD
(figure 53.3) has pushed equilibrium output beyond LRAS, the increase in real GDP shown in diagram III
will not last, since wages will rise to match labour demand, serving to increase costs for firms and thus
push the AS curve to the left (SRAS0 to SRAS1) as in figure 53.4. Output returns to the natural level of
output, YNRU but at a higher price level.
Milton Friedman coined a main monetarist article of faith by stating that “Inflation is always and
everywhere a monetary phenomenon”.1
Figure 53.4 The (monetary) transmission mechanism
1 One of my many cheeky students, Ms O’Connor, once sent me a picture of two machines; one had numerous dials,
knobs, levers, wires, connections, scales and indicators on it while the other machine had a single button, ‘On-Off’. The
first machine was labelled ‘Woman’ and the second ‘Man’. I often think of monetarist policy as a ‘Man’ machine, since
all the various forms of fiscal policies are basically replaced with a single knob labelled ‘Money: More Less’.
LRAS Price level (index)
YNRU
P0
LR effects of increased money supply
AD0
P1
Y1
AD1
SRAS
0
GDPreal/t
SRAS1
P2
Causes of deflation
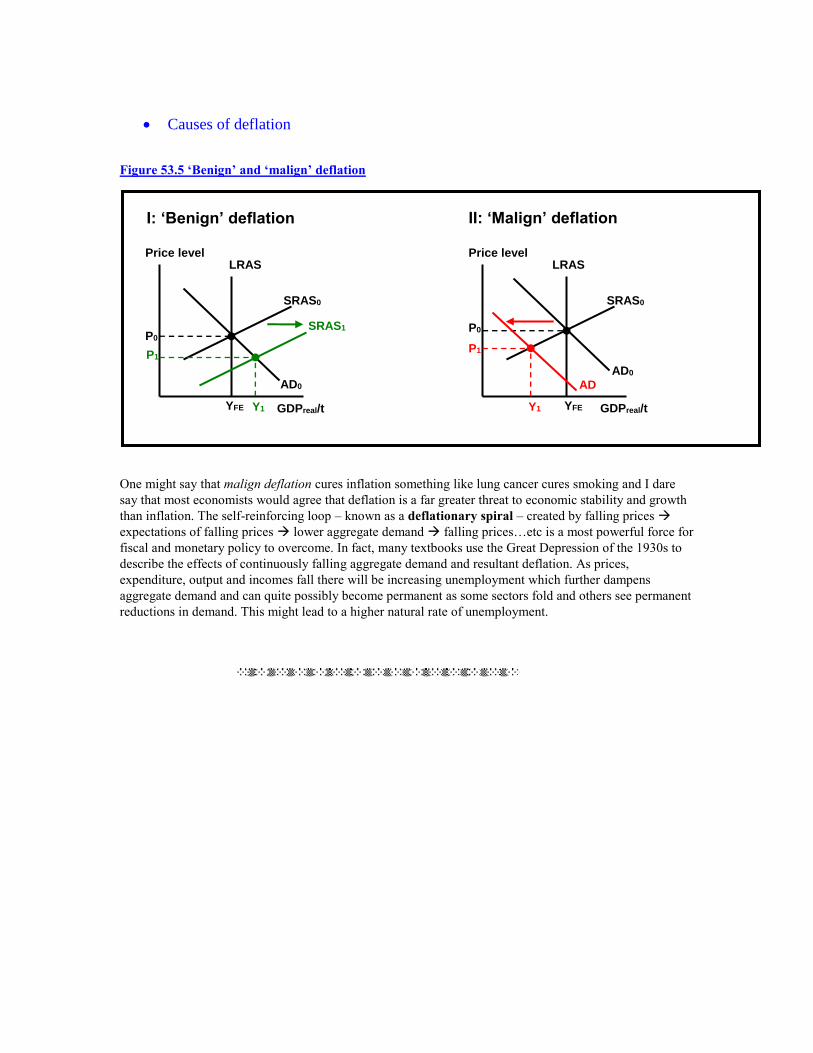
Figure 53.5 ‘Benign’ and ‘malign’ deflation
One might say that malign deflation cures inflation something like lung cancer cures smoking and I dare
say that most economists would agree that deflation is a far greater threat to economic stability and growth
than inflation. The self-reinforcing loop – known as a deflationary spiral – created by falling prices
expectations of falling prices lower aggregate demand falling prices…etc is a most powerful force for
fiscal and monetary policy to overcome. In fact, many textbooks use the Great Depression of the 1930s to
describe the effects of continuously falling aggregate demand and resultant deflation. As prices,
expenditure, output and incomes fall there will be increasing unemployment which further dampens
aggregate demand and can quite possibly become permanent as some sectors fold and others see permanent
reductions in demand. This might lead to a higher natural rate of unemployment.
I: ‘Benign’ deflation
LRAS Price level
GDPreal/t
AD0
P0
YFE
P1
Y1
SRAS0
SRAS1
II: ‘Malign’ deflation
LRAS Price level
GDPreal/t
AD0
P0
YFE
P1
Y1
SRAS0
AD
1
Counter-inflationary policies Using contractionary demand-side policies to combat inflation entails implementing policies which
decrease aggregate demand. Four key methods of dampening aggregate demand are:
Increasing the rate of interest: this monetary policy lowers consumption and investment and
thus decreases AD
Decreasing the supply of money: another monetary policy – this increases interest rates…etc…
Increasing taxes: the fiscal policy of higher income taxes will lower consumption, higher profit
taxes will decrease investment and both have a contractionary effect on AD
Decreasing government spending: the flip side of taxes, the fiscal policy of decreased
government spending has a direct effect in lowering AD
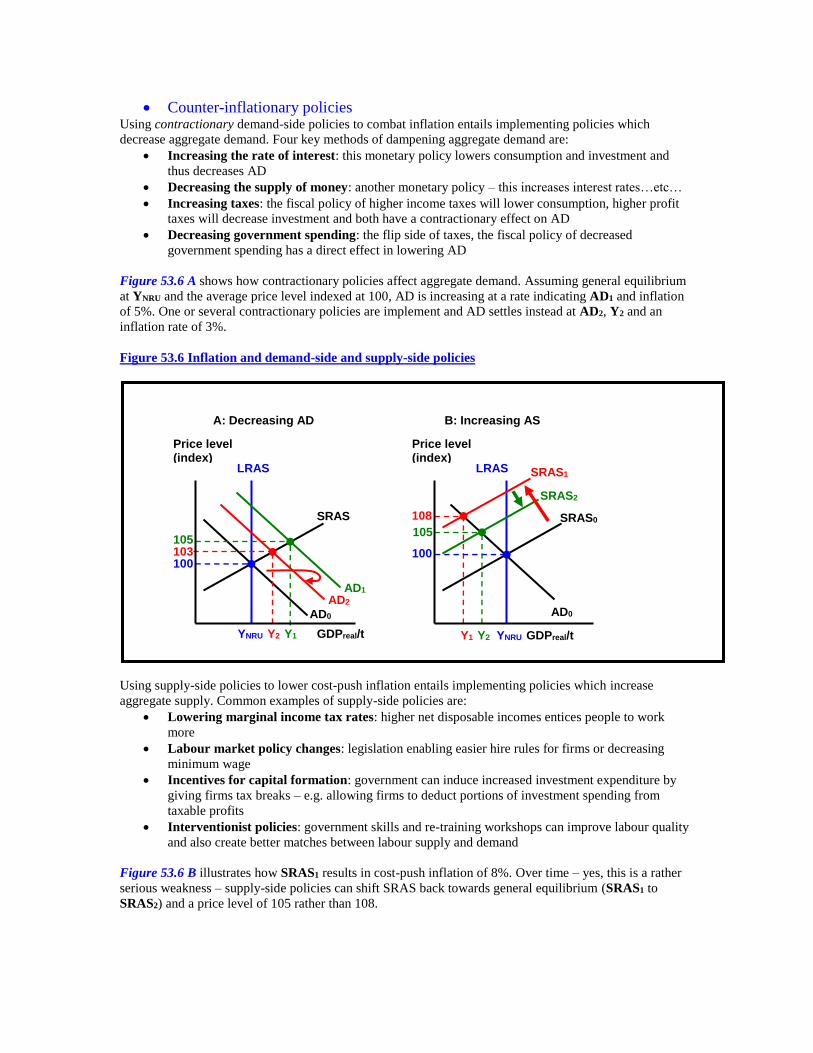
Figure 53.6 A shows how contractionary policies affect aggregate demand. Assuming general equilibrium
at YNRU and the average price level indexed at 100, AD is increasing at a rate indicating AD1 and inflation
of 5%. One or several contractionary policies are implement and AD settles instead at AD2, Y2 and an
inflation rate of 3%.
Figure 53.6 Inflation and demand-side and supply-side policies
Using supply-side policies to lower cost-push inflation entails implementing policies which increase
aggregate supply. Common examples of supply-side policies are:
Lowering marginal income tax rates: higher net disposable incomes entices people to work
more
Labour market policy changes: legislation enabling easier hire rules for firms or decreasing
minimum wage
Incentives for capital formation: government can induce increased investment expenditure by
giving firms tax breaks – e.g. allowing firms to deduct portions of investment spending from
taxable profits
Interventionist policies: government skills and re-training workshops can improve labour quality
and also create better matches between labour supply and demand
Figure 53.6 B illustrates how SRAS1 results in cost-push inflation of 8%. Over time – yes, this is a rather
serious weakness – supply-side policies can shift SRAS back towards general equilibrium (SRAS1 to
SRAS2) and a price level of 105 rather than 108.
LRAS
Price level (index)
SRAS
AD0
AD2
100
YNRU Y2 Y1 GDPreal/t
AD1
103
105
LRAS
Price level (index)
SRAS0
AD0
SRAS1
100
Y1 Y2 YNRU GDPreal/t
SRAS2
108 105
A: Decreasing AD B: Increasing AS
Evaluation of counter-inflationary policies This is a major issue and will be dealt with in greater depth in Sections 2.4 – 2.6. I limit the discussion here
to the key points arising from the examples and diagrams used in Figure 53.6.
1) To start with, contractionary demand-side policies can be hugely unpopular with citizens and are
basically not much of a crowd pleaser for politicians hoping to get re-elected. President Nixon was
most reluctant to implement much-needed contractionary policies when inflation started rising in
the late 1960s.2
2) Contractionary policies often lead to increased unemployment and lower incomes.
3) There is the very real risk that contractionary policies are too severe and that the result is
recession.
4) Any policy used will be subject to time lags – it can take up to two years for the full effect of
interest rate changes to feed through in an economy. Fiscal policies can take even longer. There is
therefore a very real risk that the economy is already cooling down when the policies kick in,
which could in fact worsen the economic downturn.
5) Supply-side policies avoid the issue of decreased incomes but are generally long term solutions
and will not have any immediate effect on inflation. Instead the aim is more along the lines of
allowing for long term growth while limiting inflationary pressure.
6) Lowering income tax rates can have serious repercussions on governments’ ability to balance the
budget. (See Chapter 56.)
7) In reality the effect on the labour market of lower personal income tax cuts is very limited and
simply does not increase labour supply.
2 See some fascinating economic history at Professor Bradford DeLongs site:
http://econ161.berkeley.edu/econ_articles/theinflationofthes.html

Summary and revision 1. Economics identifies three causes of inflation:
a. Demand-pull inflation caused by increasing AD
b. Cost-push inflation caused by decreasing AS
c. Excess money supply leading to demand-pull inflation
2. The monetary transmission mechanism describes how a change in money supply “feeds
through” to a change in AD. A ↓∆Sm → ↑∆r → ↓I → ↓AD.
3. Deflation is a general and consistent fall in the average price level. It is far more damaging
to an economy than ‘reasonable’ inflation. There are two types of deflation:
a. Benign deflation caused by increasing AS – there is deflation but rising GDPr
b. Malign deflation caused by falling AD – prices and incomes both fall
4. Counter-inflationary policies are:
a. Contractionary policies (e.g. policies aimed at decreasing AD) include raising
interest rates, decreasing the supply of money, raising taxes on income and profits,
decreasing government spending.
b. Supply-side policies (increasing AS) include lowering marginal income tax rates,
easing up on labour market regulations, privatisation of national industries,
decreasing union power, increased education and skills in the work force…etc.
5. Demand-side contractionary policies have negative effects such as a decrease in
government tax receipts, increased unemployment, lower GDP and personal income, time
lags which make it difficult to time the policies correctly and the possibility of creating
recession instead.
6. Supply-side policies have some serious weaknesses, such as actually increasing
unemployment in the short run, can take a long time to implement and take effect, lower
marginal tax rates can have serious consequences on the government budget, and studies
show very limited effects of personal income tax cuts on labour supply.