low inflation in the euro area: causes and consequences 2017 low inflation in the euro area : causes...
TRANSCRIPT

111June 2017 ❙ loW inflAtion in tHE Euro ArEA : cAusEs AnD consEQuEncEs ❙
Low inflation in the euro area : Causes and consequences
M. DerooseA. Stevens (*)
Introduction
since the onset of the financial crisis in 2007, inflation developments both in the euro area and globally have been more difficult to understand and predict. the first puzzle for economists emerged between 2009 and the end of 2011, when the depth and length of the reces-sion led to expectations of a sharp fall in inflation. in fact, inflation remained surprisingly stable (the “missing disinflation puzzle”). this was followed by a new puzzle in the 2012-16 period. this time, the ongoing economic recovery prompted forecasts of an upturn in inflation, whereas in fact it remained persistently below target (the “missing inflation puzzle”).
A more in-depth analysis of inflation dynamics in the euro area over the latter period reveals a number of stri-king developments. first, headline inflation fell sharply between 2012 and the end of 2016, even dropping below zero at times. the decline in core inflation (headline infla-tion with energy and food components stripped out) was less steep but – at an average of 1 % over the period – was still very low.
moreover, inflation forecasts from 2012 onwards sys-tematically overestimated the actual inflation rate. this applies not just for the Eurosystem inflation forecasts (see chart 1), but also for the forecasts from other internatio-nal institutions such as the European Commission, IMF and OECD, as well as those of other professional forecas-ters, including economists surveyed by the ECB.
finally, both short- and long-term inflation expectations also fell. short-term fluctuations in inflation expectations are unsurprising given the tendency of economic agents to adjust their expectations to macroeconomic shocks that impact prices. In view of its price stability objective, the ECB endeavours, however, to cushion these shocks over the medium term. If economic agents believe the EcB is committed to this, their longer-term inflation expectations should remain firmly anchored around the inflation target, and that was indeed the case in the euro area during the pre-crisis period. The sharp downturn in long-term inflation expectations derived from financial data (which also include risk premiums) and also, albeit slightly later and less steep, in expectations based on survey data (a purer measure) was thus exceptional, and therefore disconcerting.
in a bid to avert the risk of inflation staying too low for too long, the Eurosystem introduced a number of unconventional measures, including an asset purchase programme (App), and set up a working group, the low inflation task force (lift), which included a number of nBB economists, with a brief to investigate low inflation rates in the euro area between 2012 and 2016. this article presents a brief outline of the working group’s main findings ; a more detailed analysis can be found in the lift report itself (see ciccarelli and osbat, 2017). this article does not discuss the specific situation in Belgium, where inflation has risen sharply since early 2015 ; that is analysed in the article by jonckheere and Zimmer (2017) elsewhere in this Economic Review.
this article addresses four specific questions relating to low inflation in the euro area. it first gives a brief
(*) The authors would like to thank Jef Boeckx for his valuable comments and suggestions.

112 ❙ loW inflAtion in tHE Euro ArEA : cAusEs AnD consEQuEncEs ❙ NBB Economic Review
theoretical outline of why it is important to bring inflation back into line with the target and why this justifies uncon-ventional monetary policy measures. The empirical results from the LIFT report are then used to explain the factors that have held inflation down since 2012, suggesting that structural factors such as demographic or technological changes have played a rather limited role and that cyclical factors encompassed supply-side and demand-side shocks of domestic and global origin.
the consequences of low inflation are then analysed. if inflation stays too low for too long, this can cause inflation expectations to be revised downwards, with the threat of these becoming “de-anchored” from the central bank’s inflation target. this is worrying because it can lead to low inflation becoming self-sustaining. low inflation is then no longer merely a symptom of the economic malaise, but also becomes an obstacle to the recovery, for example by hampering debt deleveraging. low inflation itself then becomes a cause of low infla-tion. It is key here to examine whether de-anchoring signals persistence of the present low inflation rate or
whether actual inflation will follow expectations and return to lower levels. In the former case, it is assumed that temporary but prolonged negative demand shocks will exert disinflationary pressure but that over the lon-ger term expectations will return to the central bank’s inflation anchor. in the latter case, there is a risk of ex-pectations becoming permanently de-anchored from the inflation target. A growing persistence of low inflation rates implies that policy instruments are less effective in maintaining price stability, while a downward shift in the long-term inflation mean implies a dwindling belief in the central bank’s commitment to price stability.
Lastly, this article discusses what policy can do to bring inflation back to the target of “below but close to” 2 %. to break through a self-perpetuating spiral of low infla-tion, monetary policy needs to work on two fronts. First, every effort must be made to push inflation towards its target in good time and thus to avert de-anchoring. At the same time, an adequate response is needed to signals of a looming de-anchoring, so that changes in inflation expectations do not affect the desired monetary policy
Chart 1 LOW INFLATION IN THE EURO AREA SINCE 2012
(year-on-year percentage change)
1999
2001
2003
2005
2007
2009
2011
2013
2015
2017
–1
0
1
2
3
4
5
2011
2012
2013
2014
2015
2016
2017
2018
2019
2005
2007
2009
2011
2013
2015
2017
HICP INFLATION HICP INFLATION AND PROJECTIONS
–1.0
–0.5
0.0
0.5
1.0
1.5
2.0
2.5
3.0
3.5
J
LONG-TERM INFLATION EXPECTATIONS
0.5
1.0
1.5
2.0
2.5
3.0
Based on survey data(3)
Derived from financial data(2)
JCore inflation
Average in 1999-2007 Eurosystem inflation forecasts since 2012
(1)
Eurosystem inflation forecast of March 2017
(1)
Headline inflation Realised headline inflation
Sources : ECB, Thomson Reuters.(1) inflation forecasts are prepared by Eurosystem staff as part of broader quarterly macroeconomic forecasts for the euro area. the forecasts presented here are annual averages.(2) Quarterly averages of inflation forecasts derived from inflation swaps which cover the one-year inflation risk in the euro area, beginning four years after conclusion of the contract.(3) Average of the aggregated probability distribution of inflation projections for the next five years. the data are drawn from the EcB survey of professional forecasters (spf).

113June 2017 ❙ loW inflAtion in tHE Euro ArEA : cAusEs AnD consEQuEncEs ❙
stance. Given the limits to what monetary policy alone can achieve, there is also a role for other policy domains.
The analysis presented below focuses on the past but also offers insights which, despite seemingly changing inflation dynamics, remain relevant at the time of going to press. for example, headline inflation in the euro area has risen sharply since the end of 2016 – peaking at 2 % in february 2017 – but this was primarily due to rising oil prices. core inflation, by contrast, has stayed low and virtually flat, suggesting that domestic price pressures are still very weak and that the rise in headline inflation is not yet sustainable. There has also been a recent uptick in long-term inflation expectations, though these are still well below their pre-crisis levels. In short, while the danger of deflation in the euro area appears to have practically disappeared, it is too early to conclude that the risks pre-sented by low inflation have been completely overcome. The extensive package of monetary policy measures (asset purchases, a negative interest rate and the announcement that the measures will remain in force for a considerable time) is therefore implemented in full.
1. Why does the EcB want to keep inflation close to 2 % ?
Guaranteeing stable prices is considered the best contri-bution that monetary policy can make to economic growth and welfare. Accordingly, price stability is the
primary objective of the EcB. it is defined by its governing Council as :
“a year-on-year increase in the Harmonised Index of Consumer Prices (HICP) for the euro area of below, but close to, 2 % over the medium term.”
this explicit reference to the 2 % figure is intended to help anchor inflation expectations at around that level. the addition of the nuances “below” and “close to” makes clear that the EcB will not tolerate an inflation rate that is either too high or too low, both of which have in the past proved very damaging to the economy. The focus on the medium term, however, offers the ECB scope to respond cautiously to fluctuations in inflation, enabling it to avoid excessive volatility in economic acti-vity and its own policy instruments while at the same time contributing to macroeconomic stability. Finally, the price stability target applies for the euro area as a whole, with no specific focus on price developments in individual Member States.
maintaining a stable and positive inflation rate that is in line with the target is always important as it contributes to the smooth functioning of the economy, and this importance only increases when the economy is weak. Persistently low inflation is especially concerning in a weak economic climate because it can slow down the economic recovery. in the euro area, for example, low inflation has made it even more difficult to overcome the challenges following
Chart 2 LOW INFLATION: THREE QUESTIONS
Causes ? Consequences ?What can policy do ?
Low inflation
Self-perpetuating process
Structural changes
Cyclical factors
De-anchoring
Long-term inflation mean
Inflation persistence
If persistent
Source : NBB.

114 ❙ loW inflAtion in tHE Euro ArEA : cAusEs AnD consEQuEncEs ❙ NBB Economic Review
the financial crisis, including the need to reduce debt levels, even out macroeconomic imbalances in some Member States and address the issue of policy interest rates that are approaching their effective lower bound (ElB).
most financial contracts are drawn up in nominal terms, which means that an unexpected slowing of inflation pushes up the real costs of contractual liabilities. This makes it more difficult to reduce debt, which, all other things being equal, in turn increases the propensity to save and thus prompts a (further) reduction in demand. on the other hand, if inflation in the euro area were to come back into line with the target of “close to 2 %”, this would lead to a more rapid debt deleveraging, as well as avoiding an arbitrary redistribution of wealth from debtors to creditors.
persistently low inflation across the euro area also makes it more difficult to correct distorted competitive posi-tions, especially regarding costs. Restoring competitive-ness requires wages and prices to fall in absolute terms in Member States where the real exchange rate had appreciated sharply before the crisis. For various reasons, however, employers and employees are reluctant to act on this, and this slows the adjustment process, driving up unemployment and further eroding demand (1). By contrast, an inflation rate of around 2 % in the euro area, achieved through a combination of price rises of over 2 % in the stronger member states and lower inflation in the weaker countries, could speed up the adjustment process.
stable, positive inflation expectations that are in line with the target of close to 2 % also reduce the risk of policy rates hitting their effective lower bound. For nominal interest rates equal the sum of inflation expectations and real interest rates. Once nominal policy rates approach their effective lower bound, as is currently the case in the euro area, this constrains the central bank’s ability to cut real short-term interest rates further, thus narrowing its scope to pursue an effective and stabilising demand policy. if inflation expectations are then no longer solidly anchored and fall, they actually exert upward pressure on real interest rates, unintentionally bringing about a more restrictive monetary policy which holds back economic growth (2). this is not only problematic today : lower infla-tion expectations also reduce the central bank’s capacity to accommodate adverse shocks in the future, because nominal interest rates will still be low.
2. What causes low inflation ?
2.1 Role of structural factors rather limited
the inflation rate was systematically overestimated between 2012 and 2015, both by the Eurosystem in its projection exercises and by other organisations (see chart 1). one possible explanation is that the econome-tric models on which the projections were based took too little account of structural deflationary changes in the economy. On the other hand, there are numerous signals suggesting that structural factors, and especially population ageing and the increase in e-commerce, play but a small part in explaining subdued inflation during the recent period. this also fits the “classic” presumption that inflation in the long run is a monetary phenomenon and is therefore not permanently affected by real factors.
theoretically, population ageing could impact on inflation in several ways, each with conflicting effects. on the one hand, it could lead to a drop in demand which, if not accommodated by monetary policy, would result in deflatio-nary pressure. shirakawa (2012), for example, argues that an ageing population depresses expectations regarding po-tential growth, leading to a reduction in permanent house-hold incomes. this view is endorsed by Katagiri (2012), who posits that if population ageing is caused by increased life expectancy, the longer period spent in retirement prompts households to save more in order to fund their higher consumption and maintenance needs in the future. Both developments lead to more saving and less investment or consumption, in turn pushing down the real equilibrium interest rate (3) and slowing potential growth. Bullard et al. (2012) put forward another explanation for the negative relation between population ageing and inflation. they posit that older people – who are net savers – prefer low, stable inflation. As the electoral importance of older voters increases, the authors argue that they are more successful in imposing this preference. On the other hand, the life-cycle hypothesis states that older people begin dissaving after retirement and therefore consume more. This implies that an ageing population increases effective demand. If produc-tion capacity fails to keep pace with this rising demand, this gives rise to upward pressure on inflation.
Theoretical channels thus fail to provide a decisive ans-wer as to the correlation between population ageing and inflation. nor does empirical research ; the prevailing empirical finding is that an ageing population causes inflation to fall, though this is refuted by some studies (4). However, the different approaches all seem to suggest that demographic change in the first place affects the real equilibrium interest rate and potential growth. it is only
(1) For studies on downside price and wage rigidities in the euro area, see the work of two Eurosystem working groups, the Wage Dynamics network and the inflation persistence network.
(2) See for example Cordemans et al. (2016).(3) The rate of interest at which savings and investment are in balance, or at which
economic activity achieves its potential level and inflation is stable.(4) According to Bobeica et al. (2017), Anderson et al. (2014), yoon et al. (2014),
Bullard et al. (2012) and Katagiri (2012), an ageing population will tend to depress inflation, while juselius and takats (2015, 2016) find the reverse to be the case.
115June 2017 ❙ loW inflAtion in tHE Euro ArEA : cAusEs AnD consEQuEncEs ❙
when monetary policy does not or cannot address these developments (for example because policy rates have reached their effective lower bound) that demographic change impacts on inflation.
Technological innovations, such as the rise and spread of e-commerce, can also exert downward pressure on inflation. E-commerce brings down business operating costs, and these savings can be passed on to customers. Transparent pricing can also ramp up competition, again weighing on inflation. However, recent studies show that the strong growth in e-commerce explains only a very small part of the fall in inflation in the euro area over the recent period : an increase of one percentage point in the share of people searching for information about goods and services online would lead to a fall in inflation for non-energy products averaging just 0.025 percentage points per year across the EU (1). And once again monetary policy, provided it can be eased further, can accommodate the change in relative
prices brought about by e-commerce, which is therefore unable to erode inflation over a very protracted period.
2.2 Main cause : cyclical factors – initially on the domestic front
Since structural factors appear to have played only a minor role in the low inflation rate in the euro area in the 2012-16 period, an explanation must be sought more in cyclical factors. Monetary policy-makers have an interest in determining whether cyclical shocks are driven more by demand-side or supply-side factors, and whether they are mainly domestic or global in origin. The appro-priate response to fluctuations in inflation depends on the nature of the shock that causes them. For example, a negative domestic demand shock which weighs on both economic activity and inflation requires a swift policy response, because the central bank is able to stabilise both variables. A positive global supply shock, such as the fall in oil prices – which weighs on inflation but also props up economic potential – in principle requires a less
(1) This result was obtained from a LIFT panel data analysis carried out by M. Mohr and i. rubene (see ciccarelli and osbat (2017), Box 3, p. 71).
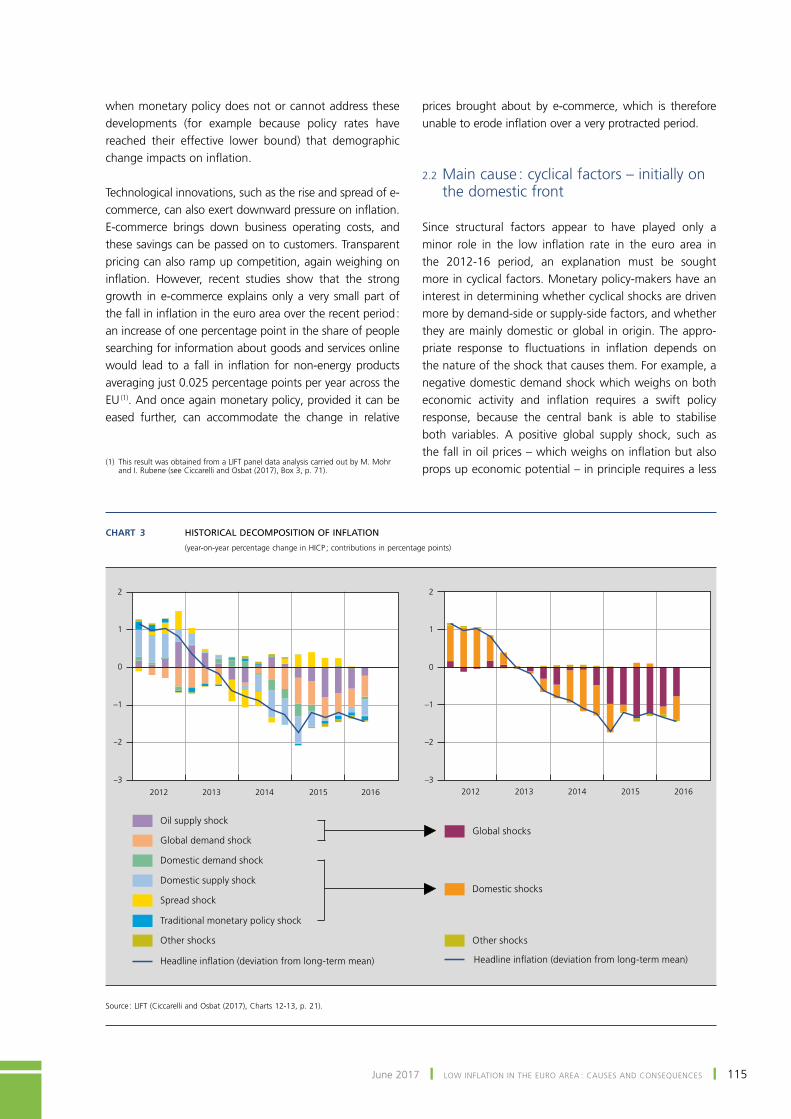
Chart 3 HISTORICAL DECOMPOSITION OF INFLATION
(year-on-year percentage change in Hicp ; contributions in percentage points)
2012 2013 2014 2015 2016
–3
–2
–1
0
1
2
2012 2013 2014 2015 2016–3
–2
–1
0
1
2
Oil supply shock
Global demand shock
Domestic demand shock
Domestic supply shock
Spread shock
Traditional monetary policy shock
Other shocks
Headline inflation (deviation from long-term mean)
Global shocks
Domestic shocks
Other shocks
Headline inflation (deviation from long-term mean)
source : lift (ciccarelli and osbat (2017), charts 12-13, p. 21).

116 ❙ loW inflAtion in tHE Euro ArEA : cAusEs AnD consEQuEncEs ❙ NBB Economic Review
urgent response because the central bank is faced with the dilemma of choosing between stabilising growth and inflation. if inflation expectations are eroded, a rapid response is justified regardless of the nature of the shock.
A vector autoregression (VAr) model was used to deter-mine the relative importance of seven cyclical shocks in explaining the low inflation since 2012 (see left-hand panel of chart 3) (1). This shows that, initially, the change in the contribution of domestic supply shocks has had a major downward impact on inflation, followed later on by the impact of the change in domestic demand shocks, from positive to negative. As of end 2014, the downward pressure stemming form lower oil prices and weak global demand gained importance though. The right-hand panel of chart 3 regroups the seven shocks and thus clearly shows that in the 2012-14 period domestic shocks caused infla-tion to fell after which global shocks took over.
the VAr model shows that the effective lower bound of nominal policy interest rates has not remained without consequences, as reflected in the slight negative contribu-tion of traditional monetary policy to inflation since 2014 (impact of the interest rate shock), confirming the central bank’s difficulty in accommodating negative shocks when policy rates are nearing their lower bound. By adopting unconventional stimulus measures, however, the ECB was able to help push inflation back towards its target (impact of the spread shock). the best-known unconventional measure, the asset purchase programme (App), came in the wake of the steep, sustained fall in oil prices in mid-2014. such persistent disinflationary supply shocks demand an immediate monetary policy response to head off the danger of economic agents, especially in a low interest rate environment with under-utilised production capacity, lowe-ring their inflation expectations – something that, through second-round effects, can influence the wage- and price-setting process and thus (further) erode core inflation.
2.3 Phillips curve remains relevant
The observation that domestic rather than global shocks were responsible for the disinflation of the 2012-14 pe-riod suggests that the Phillips curve is still a useful tool in understanding inflation dynamics, countering earlier assertions that, based on the two inflation puzzles which followed the onset of the financial crisis, this curve has
lost some of its explanatory power (2). In its simplest form, the Phillips curve expresses the relationship between domestic economic activity and inflation. theoretically, inflation falls (rises) when economic activity falls (rises) relative to its potential level. Monetary policy-makers are very interested in this relationship because the measures they take impact first on the real economy, and changes in the real economy subsequently influence inflation.
To determine empirically how well the Phillips curve explains disinflation in the euro area ex post, inflation projections obtained using the phillips curve – beginning in 2012 and assuming that the future after 2012 is not known – are compared with the realised inflation rate. A modern version of the phillips curve is estimated in which core inflation is driven not just by economic activity but also by other relevant factors (3). the phillips curve is specified as follows :
where core inflation (�t ) is a function of the past core infla-tion rate (�t – 1), a measure of inflation expectations (�t�
e), a measure of economic slack (xt – 1) and imported inflation (�t – 2� imp). given the uncertainty regarding the correct measure for inflation expectations and the position in the economic cycle, several variables are used. for example, inflation expectations can be measured based on the expectations of consumers or economists, while the economic perfor-mance can be measured using real GDP growth, the output gap, the unemployment gap or the unemployment rate.
For most combinations of variables the empirical exercise suggests a statistically significant link between inflation and economic activity. Moreover, some combinations result in inflation projections that are in line with the realised core inflation rate. these findings thus refute the idea of a decoupling of inflation from real economic acti-vity. the exercise does however also show that inflation dynamics, and in particular the relationship with econo-mic activity, has changed somewhat. the range of infla-tion projections is fairly wide, suggesting a high degree of model uncertainty. moreover, the realised inflation rate is at the lower end of this projection range.
overestimated inflation in the euro area could suggest underestimated economic weakness or a higher sensitivity of inflation to domestic economic slack. As regards the former, the models with the most negative estimates of the output gap did indeed deliver the best inflation projections. The second explanation implies that, for the same negative output gap, inflation is now falling more sharply than in the past. since the inflation projections referred to above are
� = μ + ρ� + θ� + ß x + γ � + ε ,t tt – 1 t – 1 t –impe
2 t
intercept slope
(1) the seven variables used in the VAr model were the price of oil, rest-of-the-world real gDp, real gDp in the euro area, Hicp inflation in the euro area, the EoniA, the spread between ten-year government bond yields in the euro area and the EONIA, and the nominal effective euro exchange rate. the seven shocks were identified using zero and sign restrictions. for more informations see Bobeica and jarocinski (2017).
(2) for an overview, see for example constâncio (2015).(3) for a discussion of the key determinants of inflation, see for example stevens (2013).

117June 2017 ❙ loW inflAtion in tHE Euro ArEA : cAusEs AnD consEQuEncEs ❙
based on Phillips curves with constant parameters, the pos-sibility that they overestimate inflation cannot be ruled out.
There is indeed evidence of some time variation in the parameters of the Phillips curve for the euro area. To examine this, the long-term variant of the Phillips curve is estimated over two periods, i.e. 1995 to 2012 and 1995 to 2016. this analysis shows that the slope (β) has steepened over the last four years (see chart 4), sugges-ting that inflation has recently become more sensitive to domestic economic slack. Increased sensitivity could point to structural changes in the economy, for example structural reforms in certain euro area countries could have made their economies more flexible and thus also enhanced the response of inflation to domestic slack. Nonlinearities may also play a role, making the slope of the Phillips curve steeper during periods of strong growth and deep recession. in other words, the sensitivity of infla-tion to domestic slack can vary depending on where the economy is in the business cycle.
The intercept of the Phillips curve seems also to have fallen recently due to a lower μ, weaker inflation expec-tations (� e) and the greater weight assigned to those expectations (θ). the increase in θ was however too small to neutralise the downturn in inflation expectations.
low inflation rates since 2012 are thus explained not only by repeated negative cyclical shocks weighing on econo-mic activity and therefore on inflation (the “bad luck” explanation), but also by the growing impact of economic activity on inflation (steeper slope) and a possible de-anchoring of inflation expectations (lower intercept). this latter phenomenon, which can be a source of persistently low inflation, is explored in more detail in the next section.
3. What are the consequences of low inflation ?
3.1 De-anchoring of inflation expectations : definition, risks and empirical relevance
When inflation remains far below the central bank’s target for a protracted period, this can lead to inflation expecta-tions being revised down, creating the risk of de-ancho-ring from the inflation target. such de-anchoring points to a loss of central bank credibility. If economic agents have strong confidence in the central bank’s commitment and ability to guarantee price stability over the medium term, they expect temporary shocks mainly to affect short-term inflation while longer-term inflation expectations
Chart 4 CHANGE IN PHILLIPS CURVE PARAMETERS SINCE 2012
0
Sam
ple
1995
Q1-
2016
Q2
0
0.1
0.2
0.3
0.4
0.5
0.1 0.2 0.3 0.4 0.5
Sample 1995 Q1-2012 Q1
Sam
ple
1995
Q1-
2016
Q2
1.2
1.4
1.6
1.8
2.0
1.2 1.4 1.6 1.8 2.0
Sample 1995 Q1-2012 Q1
PHILLIPS CURVE SLOPE IN TWO SAMPLES(points plotted above the 45° line indicate that the slope is becoming steeper in the specification shown on the y-axis)
PHILLIPS CURVE INTERCEPT IN TWO SAMPLES(points plotted below the 45° line indicate that the intercept is decreasing in the specification shown on the y-axis)
source : lift (ciccarelli and osbat (2017), chart 21, p. 29).
118 ❙ loW inflAtion in tHE Euro ArEA : cAusEs AnD consEQuEncEs ❙ NBB Economic Review
remain around the target. This implies that persistently low inflation can only lead to de-anchoring of inflation expectations if the central bank’s status as the anchor of price stability is under threat. The precise factors that can produce such a situation are discussed later in this section. first, we look in more detail at the potential consequences of a de-anchoring of inflation expectations, as well as at the seriousness and empirical relevance of this problem.
impaired credibility of the central bank inflation target and the associated de-anchoring of inflation expectations are problematic because they risk bringing about self-perpetuating inflation dynamics, where falling inflation and lower inflation expectations create a situation in which low inflation produces more low inflation ; section 1 explained why this is not desirable. There are two mechanisms at work here. first, lower expectations influence price and wage setting, and therefore the realised inflation rate. in addition, real interest rates rise when the downturn in inflation expectations is not sufficiently offset by the easing of monetary policy. These higher real interest rates put a brake on economic activity and therefore also on inflation itself. low inflation is then no longer just a symptom of the economic malaise – already concerning in itself – but also becomes a factor that impedes recovery, and therefore partly a cause of low inflation.
recent developments in measures of longer-term inflation expectations show that the EcB’s target for inflation of below but close to 2 % over the medium term is being undershot (see chart 1 in the introduction). this suggests that the persistently low inflation of recent years may
have increased the risk of de-anchoring. But are these developments significant enough to create a real threat of de-anchoring ?
the inflation expectations of chart 1, for one thing, vary depending on the information source used. inflation com-pensation measures derived from financial instruments to hedge inflation risks show a bigger downturn and more volatility than the inflation expectations captured in the inflation surveys. these divergent trends stem from the specific information content of the two types of measures. inflation surveys normally offer a pure measure of expected inflation, whereas inflation compensation measures express the extra return that investors demand in order to cover their portfolios against loss of value due to future inflation. this required compensation takes into account all possible future scenarios and therefore depends on both average inflation expectations and any risks surrounding that ave-rage. The relative valuation of those risks is expressed in the “inflation risk premium”. A positive (negative) premium means the consequences (in terms of welfare) of unexpec-tedly high (low) inflation are thought to be more important than the consequences of unexpectedly low (high) infla-tion, driving the required inflation compensation above (below) average inflation expectations.
the recent fall in inflation compensation measures may therefore overestimate the actual decline in inflation expectations, with the steeper fall reflecting a reduction in the inflation risk premium to below zero (1). this finding should concern monetary policy-makers, as negative infla-tion risk premiums imply greater worries about inflation being lower than expected in the future than concerns that it will be higher than expected. Whilst these concerns have no impact on the average market expectations regarding future inflation, this is nonetheless a sign that inflation expectations are in danger of becoming de-anchored (see box 1).
(1) it should be noted that the observed difference between inflation compensation measures and survey-based inflation expectations is not only explained by the inflation risk premium, but also by the the presence of liquidity premiums in market prices and measurement errors in survey data. That said, recent estimates, for example by camba-mendez and Werner (2017), suggest that these additional components have proved relatively unimportant in recent years. Empirical research shows that, since the onset of the financial crisis in 2008, the inflation risk premium has fallen steadily to below zero.
Box 1 – Determinants of the inflation risk premium
the inflation risk premium contained in measures of inflation compensation is the extra yield demanded by investors to hedge their investments in nominal securities (e.g. bonds) against unexpected movements in inflation. future inflation can turn out unexpectedly higher or lower than average market forecasts. Whether the inflation risk premium is positive or negative depends on how investors evaluate these upside and downside inflation risks. if concerns about unexpectedly high future inflation prevail, the inflation risk premium will be above zero, but it will dip into the red if investors are more concerned about the risk of inflation turning out lower than expected.
4

119June 2017 ❙ loW inflAtion in tHE Euro ArEA : cAusEs AnD consEQuEncEs ❙
What drives this risk evaluation ? put simply, the position in the economic cycle. regardless of whether the risk is positive or negative, it receives more attention if it occurs in times of economic difficulty. A positive risk that generates an extra source of income, while never amiss, is especially welcome when employment and income are under pressure. Conversely, negative risks which erode income will receive more attention if they occur mainly during recessions.
In other words, the type of risk that dominates in economically weak periods receives most attention. In the current context of falling and even negative inflation risk premiums (see for example camba-mendez and Werner (2017) for recent empirical evidence), in which the consequences of unexpectedly low inflation are consistently seen as more important, this means that investors think it is increasingly likely that periods of persistently low inflation will be accompanied by periods of slow growth. this in turn points to dwindling confidence in the central bank’s stabilisation function.
Econometric analysis offers deeper insights into the risk of de-anchoring of inflation expectations. A common method for measuring the degree of anchoring consists in estimating the pass-through of short-term develop-ments to long-term inflation expectations. if inflation expectations are solidly anchored, they should not react to
inflationary pressures either from current macroeconomic developments or from events expected to occur in the near future.
chart 5 shows the results of two econometric models esti-mating the response of long-term inflation expectations
Chart 5 PASS-THROUGH OF SHORT TERM (1Y / 1Y) (1) TO LONG-TERM INFLATION EXPECTATIONS (5Y / 5Y) (1)
(in percentage points, median and 68 % probability interval of the posterior distribution)
2007 2008 2009 2010 2011 2012 2013 2014 2015 2016 2017 2007 2008 2009 2010 2011 2012 2013 2014 2015 2016 2017–0.50
–0.25
0.00
0.25
0.50
0.75
1.00
–0.1
0
0.1
0.2
0.3
0.4
16th / 84th percentile
Median
UNIVARIATE REGRESSION (2) VAR REGRESSION(3)
sources : lift (ciccarelli and osbat (2017), charts 28 and 29, p. 35) and own calculations (update of the VAr regression).(1) inflation expectations derived from inflation swap contracts : “x”-year “y”-year refers to the inflation swap rate that covers the inflation risk for the x-year period that begins
y years after the conclusion of the contract.(2) time-varying estimates of the pass-through coefficient of changes in long-term inflation expectations over the previous six months onto changes in short-term inflation
expectations over the same period. the model is estimated with Bayesian techniques and allows for stochastic volatility.(3) time-varying estimates of the impact response of long-term inflation expectations to shocks that cause short-term inflation expectations to rise by one percentage point,
derived from a VAr model of dynamic interactions between weekly measures of short and longer-term inflation expectations, and where the structural identification of shocks based on a Cholesky decomposition assumes that shocks affecting short-term expectations can have an immediate impact on long-term expectations, but not vice versa. The time variation is estimated on the basis of a rolling sample. The estimates presented are dated at the end of each sample.

120 ❙ loW inflAtion in tHE Euro ArEA : cAusEs AnD consEQuEncEs ❙ NBB Economic Review
to changes in short-term inflation expectations over time. the pass-through coefficient has been significantly positive in several periods since the onset of the financial crisis in 2008, suggesting a real danger of de-anchoring of inflation expectations. there were clear signs of de-anchoring at the start of the financial crisis, following the collapse of lehman Brothers in october 2008, and in the wake of the sovereign debt crisis. The different models do not produce an unambiguous conclusion for the first two years of the period of low inflation that began in 2012 : while one estimate shows that de-anchoring risks rece-ded after EcB president Draghi’s August 2012 promise to overcome the debt crisis and do whatever it takes to protect the euro, the other suggests that the risks conti-nued to increase steadily. What is clear is that plumme-ting oil prices in the second half of 2014 reasserted the risk of inflation expectations being de-anchored, though that risk was curtailed by the ECB announcement of an expanded asset purchase programme in january 2015. in fact, recent developments actually suggest a significant reduction in the de-anchoring risk, or at least that the risk is becoming more uncertain. The policy options for defusing the de-anchoring risk – which turned out to be successful – are discussed in section 4.
3.2 Types of de-anchoring
the above findings show that there has been a real risk of de-anchoring of inflation expectations in recent years. However, there are different types of de-anchoring. How serious it is, in terms of its ability to disrupt price stability, depends on the underlying change in the inflation dyna-mics that cause de-anchoring, as, depending on the cause, the de-anchoring process impacts on a different aspect of the credibility of monetary policy’s ability to maintain price stability. To clarify this, credibility issues are discussed below in terms of the ECB’s price stability mandate.
on the one hand, de-anchoring of inflation expectations may indicate increasing inflation persistence. temporary ne-gative demand shocks are then expected to exert disinflatio-nary pressure, but eventually – after the shocks have played out – inflation returns to the nominal anchor of below but close to 2 %. However, this takes so long that it also impacts on longer-term inflation expectations. since price stability is the ECB’s primary objective, increasing persistence is an indicator that the policy instruments used to achieve this are becoming less effective. If the central bank fails to act or acts too late, there is then a danger of the medium-term price stability objective being implicitly redefined.
On the other hand, de-anchoring can also occur as a re-sult of changes in the public perception of the long-term
mean of inflation, i.e. the expected inflation rate for an economy that is in equilibrium, or a rate to which inflation will gravitate once all shocks have played out. A reduc-tion in the long term mean thus implies a questioning of the commitment to price stability. more specifically, it is not so much the central bank’s ability to steer inflation towards its target level that is questioned, but more its willingness to do so. Economic agents are then likely to in-terpret the target of “close to but below 2 %” differently, for example as 1.8 % rather than 1.9 %.
lower longer-term inflation expectations can of course also reflect a combination of both types of de-anchoring, with the present low inflation returning more slowly to a lower perceived inflation target.
De-anchoring of inflation expectations is less worrying when it reflects a perceived lack of policy effectiveness rather than a loss of credibility of the central bank’s inflation target. in a persistent low-inflation environment with interest rates around their effective lower bound, any reduction in the perceived inflation target leads to a structural rise in real interest rates and hence to secular stagnation, raising the prospect of permanent under-utilisation of production capacity and a deflationary spiral. By contrast, reduced policy effectiveness merely implies a slower recovery of the economy to its pre-crisis equili-brium level, with sustainable positive growth and inflation close to the central bank target. While that scenario is also problematic, as an impaired stabilisation function of the central bank increases macroeconomic volatility, it is less worrying than a permanent reduction in inflation expec-tations, which risks pushing the real interest rate above its equilibrium level for an extended period, resulting in secular stagnation.
The relative importance of these two sources of de-anchoring risks can be gauged by estimating inflation models which include data on inflation expectations. Measures of those expectations, and in particular the slope of their term structure, contain important infor-mation on the mean and persistence of the inflation process. changes in the long-term mean influence current and expected inflation to the same degree and therefore have no impact on the slope of the term structure. changes in inflation persistence, on the other hand, have a bigger effect on current inflation and short-term inflation expectations than on longer-term inflation expectations, and therefore do affect the term structure slope. With this in mind, combined analyses of observed and expected inflation, or of inflation expectations over different periods, can be useful in estimating both the trend in the long-term mean and the persistence of the inflation process.

121June 2017 ❙ loW inflAtion in tHE Euro ArEA : cAusEs AnD consEQuEncEs ❙
chart 6 summarises the results of two such analyses. the first model (based on gimeno and ortega, 2016) analyses the term structure of market-based inflation expectations by estimating three factors that together describe the term structure : the level factor, which reflects the long-term mean of inflation expectations and is therefore a measure of the perceived inflation target ; the slope of the term structure, reflecting the difference between the long-term level and the short-term inflation expectations ; and the curvature, which determines the rate at which inflation returns to its long-term mean when the eco-nomic equilibrium is disrupted by shocks : more negative (positive) values point to a slower (faster) pace and there-fore to a greater (lower) inflation persistence. the second model is a time-series model of observed and expected inflation. the autoregressive structure of this model determines the persistence of the inflation process, while the inflation rate at which the model is in equilibrium indicates the perceived inflation target.
Estimates by both models show that the observed risks of de-anchored inflation expectations in recent years were due to declining confidence in both the effectiveness of mone-tary policy and the inflation target. the measures of the per-ceived inflation target since 2012 show a clear downward
trend, for example, while the measures of inflation persis-tence follow a rising trend. This prompted the central bank to take a number of measures to guarantee price stability (see section 4). one encouraging element is that recent estimates suggest a turning point, as the persistence is esti-mated to be lower and the inflation trend higher.
3.3 Channels of de-anchoring
This section concludes with a brief description of the factors that can undermine the central bank’s credibility, either in terms of its effectiveness or its commitment to bring inflation back to target. understanding these fac-tors makes clear when persistently low inflation can give rise to de-anchoring of inflation expectations. As stated earlier, temporary shocks, even when frequent, have little impact on longer-term inflation expectations provided the central bank is able to retain its credibility.
Impaired effectiveness of monetary policy in guaranteeing price stability can result from increased nominal rigidities in the labour and product markets. These rigidities make the economy less resilient by making it harder to correct for disruptive cyclical factors using appropriate wage and
Chart 6 CHANGES IN INFLATION DYNAMICS
(time-varying estimates, in %)
2010 2011 2012 2013 2014 2015 2016 2017 2010 2011 2012 2013 2014 2015 2016 2017
MEASURES OF PERCEIVED INFLATION TARGET
1.0
1.2
1.4
1.6
1.8
2.0
2.2
2.4
2.6
2.8
3.0
–1.0
–0.5
0.0
0.5
1.0
1.5
2.0
2.5
3.0
3.5
4.0
Long-term inflation mean in a VAR model of observed and expected inflation
(1) (right-hand scale)
HICP inflation (right-hand scale)
Level factor in a term-structure model of inflation expectations
(2) (left-hand scale)
MEASURES OF INFLATION PERSISTENCE
0.80
0.82
0.84
0.86
0.88
0.90
0.92
0.94
0.96
0.98
1.00
0.4
0.0
–0.4
–0.8
–1.2
–1.6
–2.0
–2.4
–2.8
–3.2
–3.6
Autoregressive coefficient in a VAR model of observed and expected inflation
(1) (left-hand scale)
Curvature factor in a term-structure model of inflation expectations
(2) (right-hand scale – inverted)
sources : lift (ciccarelli and osbat (2017), charts 6-9, pp. 16-17), own reworkings and own calculations (update of the long-term inflation mean and autoregression coefficient derived from the VAr model).(1) the VAr model assumes that inflation expectations are formed in a consistent way. the time variation is estimated on the basis of a rolling sample. the estimates presented
are dated at the end of each sample.(2) Based on gimeno and ortega (2016).

122 ❙ loW inflAtion in tHE Euro ArEA : cAusEs AnD consEQuEncEs ❙ NBB Economic Review
price mechanisms. These dynamics make the economy – and inflation – more cyclical.
Another possible explanation is that disruptions to mone-tary policy transmission and consequently to the central bank’s stabilisation function undermine the effective-ness of monetary policy. This can happen when policy interest rates hit their effective lower bound, but also when financial fragmentation impedes the smooth trans-mission of policy interest rates to market rates. In such circumstances, economic agents will perceive that mone-tary policy is less able to accommodate negative inflation shocks and that inflation is thus set to remain low for an extended period. In addition, there are a number of am-plifying effects which weigh further on economic activity and inflation. if the policy response is inadequate, falling inflation expectations will lead to an ex-ante rise in real interest rates, effectively tightening monetary policy. This rise in real interest rates will also lead to a currency appre-ciation in real terms, resulting in reduced competitiveness. lastly, falling inflation – if nominal interest rates remain unchanged – increases the debt burden in real terms, at least compared with a scenario where inflation remains near the target level. If prices fall, and with them wages and profits, there is less money from which to repay the debt and interest, and this not only slows down debt reduction but also holds back new lending. Both effects put a brake on the economic recovery.
Importantly, impaired policy effectiveness – as a kind of second-round effect – can also erode trust in the central bank’s commitment to price stability. If the stabilisation function of monetary policy is under threat, inflation projections based on past experience can offer a more accurate picture of the future than the inflation anchor communicated by the central bank. In that case, it be-comes a rational choice for economic agents to base their inflation expectations on the actual rate of inflation rather than the official inflation target (a process referred to in the literature as “adaptive expectations”). A prolonged period of excessively low inflation far below target will then lead to the perceived inflation target being revised downwards, thus reinforcing low inflation.
4. How can economic policy combat low inflation ?
Having explored the causes and consequences of low inflation, the question now is what policy can do to counter excessively low inflation and growing risks of de-anchoring of inflation expectations. this question is all the more pertinent against the backdrop of interest rates that are approaching their effective lower bound and the
limited scope for accommodative fiscal policy in many euro area countries. this section first looks at whether unconventional monetary policy measures, and specifi-cally quantitative easing, can offer a solution, and then turns to the potential role of other policy domains such as fiscal policy and structural reforms.
4.1 Unconventional monetary policy measures
persistently low inflation and associated weak economic growth prompted the ECB to launch an unconventional “expanded asset purchase programme” in january 2015. Policy interest rates were approaching their effective lower bound, limiting the ability of traditional monetary policy to support the economy. Under the asset purchase pro-gramme, the ECB bought public and private-sector securi-ties in the euro area to the tune of € 60 billion per month from march 2015 to march 2016, rising to € 80 billion per month in April 2016. it was subsequently decided to cap the purchases at € 60 billion per month again from April 2017 until at least the end of December 2017, and in any event until inflation and inflation expectations were in line with the price stability target (see NBB Annual reports for 2015 and 2016).
these asset purchase programmes are termed “quanti-tative easing” (QE) because they increase the available money supply. The literature describes several channels via which QE measures are expected to support economic activity and boost inflation. for a recent intuitive descrip-tion of these channels, reference is made among others to Cordemans et al. (2016). put simply, while conventional monetary policy steers the funding costs of investment by adjusting short-term interest rates, QE aims to reduce those costs by driving down long-term interest rates directly. The ensuing paragraphs examine whether theory and practice align on this point, and more specifically whether the ECB’s asset purchase programme has proved to be effective in boosting inflation.
the econometric VAr analysis in section 2 suggests that this is the case. the historical decomposition of inflation dynamics in chart 3 shows that, since the announcement of the asset purchase programme in 2015, unconven-tional monetary policy measures have contributed to an acceleration of inflation. the empirical study in the lift report mentioned two specific channels explaining this positive impact of the asset purchase programme on inflation.
First of all, policy-driven expansions of the central bank ba-lance sheet make a positive contribution to re-anchoring

123June 2017 ❙ loW inflAtion in tHE Euro ArEA : cAusEs AnD consEQuEncEs ❙
longer-term inflation expectations. this is illustrated in chart 7, in which the pass-through coefficient of long-term to short-term inflation expectations described earlier is estimated under the condition of an expanding or contracting central bank balance sheet. in the 2009-16 sample, balance sheet contractions were clearly associa-ted with a positive pass-through coefficient, suggesting a growing risk of de-anchoring of inflation expectations in the period. By contrast, the pass-through coefficient, and thus the threat of de-anchoring, fell sharply in periods of balance sheet expansion.
Unconventional policy measures, though less persistent than conventional measures, also have a positive ex-change rate effect (see chart 8). the central bank’s asset purchases reduce long-term yields, leading to a currency depreciation and a concomitant rise in consumer prices, partly due to imported price inflation (1).
4.2 Positive synergies with other policy domains
The preceding analysis demonstrates the effectiveness of unconventional measures ; they thus can be put to use as an active policy instrument when conventional policy measures cease to have any impact. In such situations, monetary policy effectiveness may also benefit from positive synergies with measures taken in other policy domains.
Arce et al. (2016) clearly demonstrate this in their lift model simulations. Taking two countries representative of surplus and deficit countries in the euro area – germany and spain, for instance – they first simulate a scenario capturing the financial crisis, specifically assuming that an adverse financial shock results in stricter credit conditions in deficit countries, triggers a drop in demand across the euro area and slows down economic activity to such an extent that policy rates reach their effective lower bound. consequently, conventional monetary policy can no longer kick-start the economy through rate cuts. In this senario, the model simulations study the effects of a num-ber of policy options that might support the constrained monetary policy.
Structural reforms
As a first option supportive of monetary policy, structu-ral reforms in the labour and product markets aim both to boost competitiveness and eliminate inefficiencies in
Chart 7 EFFECT OF CENTRAL BANK BALANCE SHEET EXPANSION / CONTRACTION ON PASS-THROUGH FROM SHORT-TERM TO LONG-TERM INFLATION EXPECTATIONS
(estimated distribution of the 5y / 5y regression coefficient on 1y / 1y inflation swaps (1))
–2
0
2
4
6
8
10
12
-0.1 0 0.1 0.2 0.3 0.4 0.5 0.6
Balance sheet expansions
Balance sheet contractions
sources : lift (ciccarelli and osbat (2017), figure 41, p. 50).(1) “x” year “y” year refers to the inflation swap rate that covers the inflation risk
for the x-year period that begins y years after the conclusion of the contract.
(1) the estimation of the exchange rate pass-through (Erpt) was based on the VAr model described in section 2. The advantage of this model for an ERPT analysis is that it allows the estimate to be mapped to the shock that hits the economy. this approach, which was introduced by shambaugh (2008), takes account of the fact that the size and sign of the Erpt can vary depending on the disruption to the economy. chart 8 shows an estimation of the pass-through of an exchange rate depreciation to consumer prices based on the ratio of the dynamic effects of the shock concerned on, on the one hand, the exchange rate and, on the other hand, consumer prices.
Chart 8 IMPACT OF THE EXCHANGE RATE ON PRICES AFTER MONETARY POLICY SHOCKS
0 2 4 6 8 10 12 14 16 18 20
After x quarters
–0.05
0.00
0.05
0.10
0.15
0.20
0.25
0.30
Short-term interest rate shock : conventional monetary policy
Spread shock : measure for unconventional monetary policy
Impa
ct o
f a
1 %
cur
renc
y de
prec
iatio
n on
con
sum
er p
rices
(%)
sources : lift (ciccarelli and osbat (2017), chart 42, p. 52) and own calculations.

124 ❙ loW inflAtion in tHE Euro ArEA : cAusEs AnD consEQuEncEs ❙ NBB Economic Review
the wage- and price-setting process. Not only does this improve the outlook for the future growth potential, it also helps to create a more flexible economy able to correct existing imbalances faster through appropriate wage and price changes. The past years’ policy debates often revolved around structural reforms bolstering the competitiveness of deficit countries – which had been har-dest hit by the financial crisis – and thereby encouraging economic recovery.
While structural reforms have demonstrable beneficial effects in the longer term, they may also cause short-term drawbacks when interest rates languish close to their lower bound, as such reforms typically spark downward price pressures through a squeeze on corpo-rate profit margins or increased labour supply following labour market reforms. If monetary policy cannot accom-modate such disinflationary forces, real rates rise and monetary policy in effect tightens. Model simulations by Arce et al. (2016) suggest that this constitutes a not insi-gnificant negative effect. When policy interest rates hit their lower bound, structural reforms in deficit countries may help expand their own economies but simulta-neously slow down economic recovery in core countries, as a result of lower demand from deficit countries and real appreciation in surplus countries. The additional deflationary pressures so unleashed may be stemmed by the central bank credibly stating it will continue to pur-sue a low interest rate policy for a considerable length of time, thus constraining the upward pressure of structural reforms on real interest rates.
Fiscal policy
A second policy option might be – in theory at least – an appropriate fiscal stance addressing the demand side of the economy in addition to the accommodating monetary policy stance. This would make it less hard for monetary policy to remedy the fall in demand and would also help avoid monetary policy running into new constraints. In the real world, however, the feasibility of this particular policy option is often stymied by a multitude of issues and uncertainties.
A first important constraint on this policy option is that it will have to fall within the European governance fra-mework for public finances. With the past having seen many countries flout the fiscal rules, these days the focus tends to be on restoring confidence in the sustainability of public finances. if this fails, the past years’ – sometimes very painful – consolidation measures would appear to have been in vain. In fact, only a few surplus countries in the euro area have any real room for fiscal manoeuvre. in other words, an accommodating fiscal stance for the
Monetary Union would appear feasible only if it is driven by the euro area’s core. the question is whether this would fit into the Emu’s institutional framework and achieve what it set out to do.
The model simulations presented by Arce et al. (2016) in the LIFT report would appear to suggest that this is indeed the case : despite its limited size, a more expan-sive fiscal stance in the core countries when policy rates are at the effective lower bound has been demonstrated to work for the euro area at large. Compared with nor-mal circumstances in which policy rates are unrestrained, positive effects on economic activity in surplus countries are found to be larger, while deficit countries experience positive spillovers that were previously either not there or rather negative. That said, the economic literature does not unambiguously agree on the size of these spillovers : Arce et al. (2016) consider them significant, while Gadatsch et al. (2016) find them to be minor. it remains uncertain to what extent expansive fiscal policy in individual euro area countries may ease the job for monetary policy.
In addition, it should be noted that the euro area’s post-crisis under-utilisation of production capacity is nearly or fully cleared by surplus countries. conseqently, expansive fiscal policy in these countries might cause their eco-nomies to overheat – which begs the question of how desirable such a policy really is. And yet an intelligent approach to fiscal policy – paying sufficient attention to the economy’s demand side and government invest-ment – could well be conductive to sustainably supporting both supply and demand sides of the economy.
Conclusion
persistently low inflation coupled with systematically over-estimated inflation projections and declining inflation ex-pectations since 2012 have prompted the EcB to launch a range of unconventional measures, including an asset purchase programme (App). sailing blindly into uncharted waters is not advisable, however, hence staff at the ECB and the various national central banks, including the NBB, joined forces in the low inflation task force (lift). its remit was to investigate the causes and consequences of low inflation in the euro area, while it has also identified policy options that might help defuse the risks of too long a stretch of low inflation. this article has summarised the task force’s key findings (see ciccarelli and osbat, 2017).
Structural factors – e.g. demographics and technology – were found to constitute only a small part of the reason for low inflation in the euro area in the 2012-16 period,
125June 2017 ❙ loW inflAtion in tHE Euro ArEA : cAusEs AnD consEQuEncEs ❙
with cyclical factors a much more decisive force. More specifically, domestic shocks caused inflation to fall in the 2012-14 period, following which non-domestic shocks gained traction, particularly the strong and pro-tracted downturn in oil prices in 2015.
Although recent inflation dynamics would appear to be driven by the supply side, the launch of the APP in early 2015 was the right move. Empirical evidence suggested that persistently low inflation could cause economic agents to lower their inflation expectations, threatening to de-anchor them from the official inflation target. this, in turn, could have repercussions on wage and price set-ting and thereby depress core inflation further. inflation would thus become a self-perpetuating spiral : no longer a mere symptom of economic malaise, low inflation would beget low inflation.
To break through such a self-perpetuating spiral of low inflation, monetary policy needs to work on two fronts. on the one hand, every effort must be made to push inflation towards its target in good time and thus avert de-ancho-ring. on the other hand, an adequate response is needed to signals of a looming de-anchoring, so that changes in inflation expectations do not affect the desired monetary policy stance. The ECB’s asset purchase programme has proved successful on both fronts, not just by supporting actual inflation – e.g. through a favourable exchange rate effect – but also by contributing to the anchoring of infla-tion expectations. In the current environment of policy rates close to their effective lower bound, monetary policy does benefit from positive interactions with measures in other policy domains. Growth-friendly structural reforms and intelligent fiscal measures can help ease monetary policy’s task in kick-starting the economy and supporting inflation.
126 ❙ loW inflAtion in tHE Euro ArEA : cAusEs AnD consEQuEncEs ❙ NBB Economic Review
Bibliography
Anderson D., D. Botman and B. Hunt (2014), Is Japan's population aging deflationary ?, imf Working paper 14 / 139.
Arce, Ó., s. Hurtado and c. thomas (2016), Policy spillovers and synergies in a monetary union, EcB Working paper 1942.
Bobeica E., E. lis, c. nickel and y. sun (2017), Demographics and inflation, EcB Working paper 2006.
Bullard j., c. carriga and c.j. Walter (2012) “Demographics, redistribution and optimal inflation”, Federal Reserve Bank of St. Louis Review, 94(6), 419-439.
camba-mendez, g. and t. Werner (2017), The inflation risk premium in the post-Lehman period, EcB Working paper 2033.
ciccarelli m. and c. osbat (eds, 2017), Low inflation in the euro area : Causes and consequences, ECB Occasional Paper Series 181.
constâncio V. (2015), Understanding Inflation Dynamics and Monetary Policy, Panel remarks at the Jackson Hole Economic policy symposium, federal reserve Bank of Kansas city, 29 August.
cordemans n., m. Deroose, m. Kasongo Kashama and A. stevens (2016), “the ABc of quantitative easing or the basics of central bank asset purchases”, nBB, Economic Review, june, pp. 31-45.
gadatsch n., K. Hauzenberger and n. stähler (2016), “fiscal policy during the crisis : A look on germany and the Euro area with gEAr”, Economic Modelling, 52 (B), 997-1016.
gimeno, r. and E. ortega (2016), The Evolution of Inflation Expectations in Euro Area Markets, Banco de España, BdE Working paper 1627.
jonckheere j. and H. Zimmer (2017), “inflation in services : the Belgian exception”, nBB, Economic Review, June.
juselius m. and E. takats (2015), Can demography affect inflation and monetary policy ?, Bis Working paper 485.
juselius m. and E. takats (2016), The age-structure-inflation puzzle, Bank of finland research Discussion paper 4 / 2016.
Katagiri m. (2012), Economic consequences of population aging in Japan : Effects through changes in demand structure, Bank of japan, imEs Discussion paper series 2012-E-3.
nBB (2016), Report 2015.
NBB (2017, Report 2016.
shambaugh, j. (2008), “A new look at pass-through”, Journal of International Money and Finance, 27(3), 560-591.
shirakawa m. (2012), Demographic changes and macroeconomic performance : Japanese experiences, Opening remarks at the 2012 Boj-imEs conference hosted by the institute for monetary and Economic studies, Bank of japan, 30 may.
stevens A. (2013), “What inflation developments reveal about the phillips curve : implications for monetary policy”, NBB, Economic Review, December, pp. 73-82.
yoon j-W., j. Kim and j. lee (2014), Impact of demographic changes on inflation and the macroeconomy, IMF Working paper 14 / 210.