characterization of fountain pen inks by porous glass
TRANSCRIPT

Journal of Criminal Law and CriminologyVolume 53Issue 4 December, Article 13
Winter 1962
Characterization of Fountain Pen Inks By PorousGlass Chromatography and ElectrophoresisHerbert L. MacDonell
Follow this and additional works at: https://scholarlycommons.law.northwestern.edu/jclc
Part of the Criminal Law Commons, Criminology Commons, and the Criminology and CriminalJustice Commons
This Criminology is brought to you for free and open access by Northwestern University School of Law Scholarly Commons. It has been accepted forinclusion in Journal of Criminal Law and Criminology by an authorized editor of Northwestern University School of Law Scholarly Commons.
Recommended CitationHerbert L. MacDonell, Characterization of Fountain Pen Inks By Porous Glass Chromatography and Electrophoresis, 53 J. Crim. L.Criminology & Police Sci. 507 (1962)
CHARACTERIZATION OF FOUNTAIN PEN INKS BY POROUS GLASS CHROMA-TOGRAPHY AND ELECTROPHORESIS
HERBERT L. MAcDONELL
Herbert L. MacDonell is a Research Chemist at the Corning Glass Works and serves as an In-structor in Police Science at Coming Community College and as a consultant for various law enforce-ment agencies. He was formerly associated with the Rhode Island Laboratories for Scientific CriminalInvestigation and taught both Chemistry and Criminalistics at the University of Rhode Island.Mr. MacDonell's articles have appeared in this and other police journals.-EDIoR.
Identification of fountain pen inks and writingfluids has long been a subject of considerable in-terest to the examiner of questioned documents(1-5). In order to accurately identify the variousink formulations that are commercially available,many techniques using a variety of analyticalprocedures have been developed (6-13). Of these,perhaps the most accepted method in currentusage is that of paper chromatography (2) (12)(14-20). This separation method allows the variousink components, many of which are colored dyesubstances, to be separated into integral bands orzones that distribute themselves in a mannercharacteristic of the original combined formula-tion (21).
PAPER CHROMATOGRAPHY
The mechanism of paper chromatographicseparations is simple from both theoretical andpractical considerations. In practice, a samplespot of ink is placed near the end of a paper strip.This same end is then immersed into an appropri-ate solvent until the surface of the liquid is justbelow the sample spot. The solvent is then allowedto permeate the paper, rising by capillary action tosome predetermined point above the originalsample spot causing chromatographic develop-ment. During this process the components of theoriginal sample mixture are influenced and sepa-rated by two opposing forces. One tendency isfor the individual components to be washed up thestrip depending upon their relative solubilitiesin the chosen solvent; the other is for them todeposit themselves on the cellulose support mediumdepending upon their individual attraction forthis material and the tenaciousness with whichthey are bonded to it. The total effect is known aseither an adsorption or distribution phenomenonand may be measured as numerical coefficientswhich are dependent upon the chosen combination
of solvent and support medium. If the supportmedium itself is active, as is the case with paper,it exhibits adsorptive properties. If, however, thesupport medium has been coated with some othermore active substance, as is often the case withcolumn chromatography, then the distribution ofthe sample between the solvent and this substanceis described by a distribution coefficient.
The location, color, and intensity of the sepa-rated fractions is often of such significance that it ispossible to identify an unknown ink from its paperchromatogram alone. This technique may beextended in many ways to produce variations inboth the color and distribution of bands. Changingsuch parameters as the acidity of the solution usedfor development or the substitution of organicsolvent systems for aqueous developers are vari-ations often employed in paper chromatographyto acquire additional data. Data obtained fromsuch variations are often desirable, if not essen-tial, for the correct identification of some inks.In instances when the chromatograms of twoinks appear very similar, additional characteristicsmust be obtained to establish subtle differences.
The spectrophotometer has often been utilizedto assist the technician in transforming his visualimpressions into numerical values for both de-veloped chromatograms and for single color markson paper. Though well suited for many applica-tions, the investigator often experiences difficultieswith this instrument when attempting to obtainspectral transmission data from opaque paperchromatograms. As a result, reflectance measure-ments are usually taken with some compromise inaccuracy (13). Transmission data has been ob-tained, however, by rendering the paper chromato-gram either transparent or translucent usingclearing oils and placing the cleared strips betweenglass plates for scanning (22). It must be remem-bered that such measurements are often subject
HE2RBERT L. MacDONELL
to error if care is not taken to equalize backgrounddue to the clearing oils themselves. An alternatetechnique to obtain spectral data with low back-ground has been to physically cut the developedpaper chromatogram into separate pieces and thenelute samples from each cutting directly into spec-trophotometer cells. Transmission measurementsare then made on the resulting solutions. At best,this is a dilution method. Spectral data obtainedfrom any of these methods will have very limitedvalue unless performed by someone having con-siderable experience in the method or methodsselected.
PAPER ELECTROPHORESIS
Despite the superficial resemblance of paperstrip electrophoresis to paper chromatography,there are distinct differences between the twoseparation methods. Chromatographic separationsof substances in solution depend upon their dis-tribution between a mobile and a less-mobile ornon-mobile phase. In contrast, electrophoreticseparations depend upon the migration of ions orcharged partides at different rates through anelectrical field. In paper strip electrophoresis thepaper strip serves as a carrier of the solvent ordispersion medium and is not itself significantlyactive in effecting separation of the sample mixture.The solvent is a buffered electrolyte of low ionstrength which permits the application of a rela-tively high potential resulting in low current flow.
The application of paper strip electrophoresis forthe characterization of inks has resulted in addi-tional data that has proven helpful for the identi-fication of unknown samples (9) (11). Equipmentrequired for these separations is considerably morecomplex and expensive than that required forpaper chromatography. It is not always necessaryto purchase an expensive power supply for inkseparations, however. Crown has demonstratedthat a simple modification of radio receivers willprovide adequate power for electrophoretic re-quirements (23). Nevertheless, as the results ob-tainable from the two methods are comparable,it is understandable that paper chromatographyhas found greater favor with the majority of in-vestigators. Electrophoresis separations conductedin paper present the same problem as thoseobtained chromatographically; the backgroundmedium is opaque and difficulties arise when ac-curate spectral measurements are attempted.
PoRous GLASS
In an effort to overcome many of the inherentdifficulties associated with paper as a chromato-graphic or electrophoretic medium, it was con-ceived that porous glass might offer propertieswhich would permit such separations under awider range of conditions. In addition, the finalseparations would be in a medium which was itselfoptically transparent. This unique glass was ob-tained and found to be quite acceptable for theseapplications (24)(25)(26). Inasmuch as porousglass is a medium unknown to many readers per-haps a brief description of its properties should beincluded at this time.
Porous glass is not a new product. It was dis-covered thirty years ago by Dr. Martin E. Nord-berg and Mr. Harrison P. Hood, both of theComing Glass Works, and is correctly known asGlass Number 7930 (27). This interesting materialis not an end product but is an intermediate tothe production of a 96% silica glass, Glass Number7900. Porous glass is obtained by acid leaching aseparated phase of sodium, boron, and aluminumfrom a low melting alkali-borosilicate glass of lowchemical durability. The intermediate porous formis then consolidated at high temperatures into anon-porous or normal glass with excellent chemi-cal durability and thermal stability. This processpermits the fabrication of Vycor Brand laboratoryglassware of desirable shapes at relatively lowtemperatures rather than at the high temperaturesrequired to fuse and work pure silica.
Removal of sodium and boron by acid leachingresults in a porous silica network with channeledopenings of exceptionally small diameter. Theactual size of these pores is between 20 and 100Angstrom units or 2 to 10 millimicrons. Theaverage pore diameter is about 40 Angstrom units,resulting in a surface area of between 150 and200 square meters per gram of porous glass.This exceptionally high surface area is respon-sible for the absorption of moisture and smokefrom the air into porous glass. A void space ofapproximately 28 percent characterizes the glassas "thirsty" as it feels very dry to the touch andmay be used as a solid desiccant having about thesame efficiency as silica gel.
Porous glass which has been polished prior toleaching has every appearance of common glass.Considering the fact that the pores would have tobe enlarged some 12,000 times to admit a humanhair, it is not difficult to understand why they are
[Vol. 53
FOUNTAIN PEN INK CHARACTERIZATION
invisible and do not distract from the transparencyof the glass. For this reason, spectral transmissionmeasurements may be made directly on separationswhich have been effected in this medium. Porousglass is transparent to the ultraviolet and limitedmeasurements may be made in the infrared asdescribed by Little and others in recent investiga-tions (28) (29).
POROUS GLASS CHROMATOGRAPHY-
EXPERIMENTAL
Samples of five microliters each were applieddirectly to the surface of porous glass using amicroliter syringe. The tip of the needle had beenfiled flat to prevent scratching the glass. Samplesare placed on porous glass in the manner describedearlier for paper chromatography. Individualseparations were conducted on polished porousglass the size of a microscope slide, I x 3 x X6inches. Multiple separations .required a largerplate. For convenience in direct projection of thecompleted separations the standard lantern slidesize, 3Y4 x 4 x X6 inches, was adopted. In con-trast to paper, porous glass is a rigid, self-support-ing material. For this reason it need not be sus-pended but may be placed to stand upright inany convenient vessel. A 250 ml. electrolytic (tallform) beaker was found to be convenient whenusing the I x 3 inch slide. Larger beakers of stand-ard shape were required for 34 x 4 inch plateswith the exact volume of the beaker dependentupon the desired direction of development. Thesolvent chosen for development may be addedeither before or after the glass is inserted into thebeaker, however, in either case the proper solventlevel must be maintained slightly below the samplespot or spots. Within a few minutes a wave orsolvent front may be seen rising irfto the porousglass and may be observed at any later time duringdevelopment of the chromatogram. This migrationof solvent upward into the slide is very evidentdue to the higher transparency of the saturatedlower portion.
Chromatographic development is complete andshould be terminated after the solvent has raisedto the top of the glass slide. At this point, thesaturated porous glass is simply withdrawn fromthe development vessel and carefully wiped witha dean, soft towel to remove excess solvent fromits lower edge. Only that area which was actuallyimmersed in liquid need be dried in this manner.In air, porous glass will usually dry in about fourhours, however, this time may be reduced by
I iiI ______________________
I-
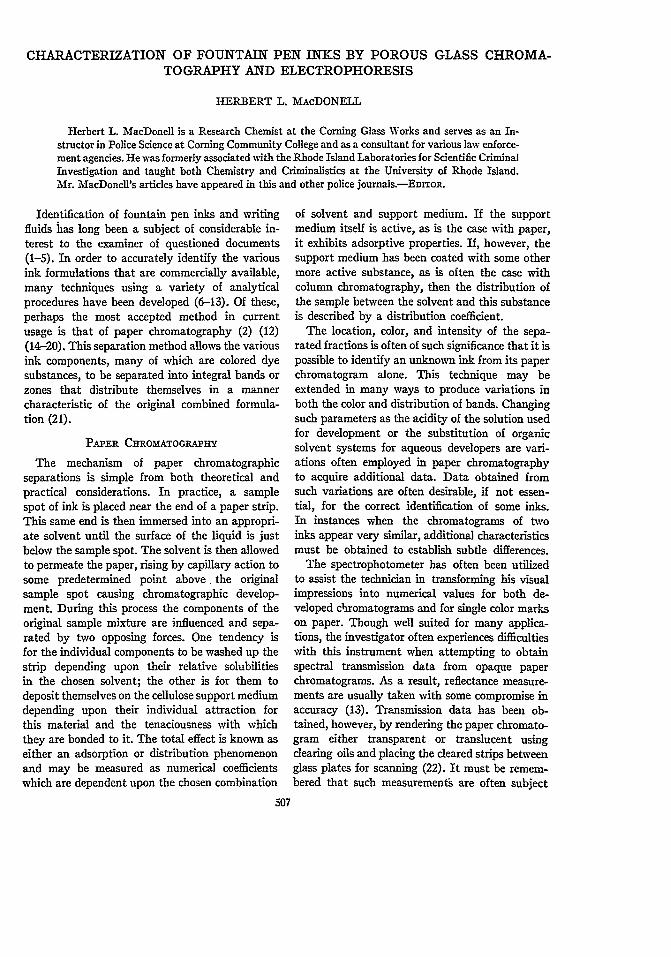
1 2 3 4 5Figure 1
Chromatographic Separations of Five Black Inksin Porous Glass
Developer, water; time, 12 hours. 1. Parker 5035;2. Sheaffer 64; 3. Sanford 235; 4. Waterman (new);5. Carter 986.
placing the slide in a warm (40-50*C) drying oven.Higher temperatures will cause severe fracturingof saturated porous glass and must be avoided. Aconvenient drying procedure is to place the glassbetween a folded paper towel on top of a 110Cdrying oven. One hour wvill usually be sufficientto effect complete drying under these conditions.Porous glass is very transparent when completelysaturated but during a intermediate dryingperiod it becomes white or opal. This conditiondisappears upon further drying.
PoRous GLASS CHR M:ATORAPHY-REsuLTs
The time required for development of a porousglass chromatogram is considerably longer than
that required for a corresponding separation inpaper. Normally, from tvelve to thirty hours arerequired for good chromatographic separation in
porous glass. During this time a flow of about two
to two and one-half inches is considered to be amaximum. A typical porous glass chromatogramof five black ink separations is shown in figure 1.Unfortunately, a black-and-white reproduction of
this figure does not do justice to the colorful resultswhich were actually obtained. Sample Number 5,for example, Carter's Number 986 black ink,resulted in a blue spot where the sample wasplaced before separation, a deep green over this, fol-lowed by orange and finally a rose or violet on top.
For purposes of recording the results of eachchromatographic separation, an arbitrary systemof zones was adopted as shown in figure 1. Colorspresent in these zones were simply recorded in
.tabular form to provide data characteristic ofeach ink sample. The first zone, called the spot, isthat area covered by the original sample before
V
2i
HERBERT L. MacDONELL
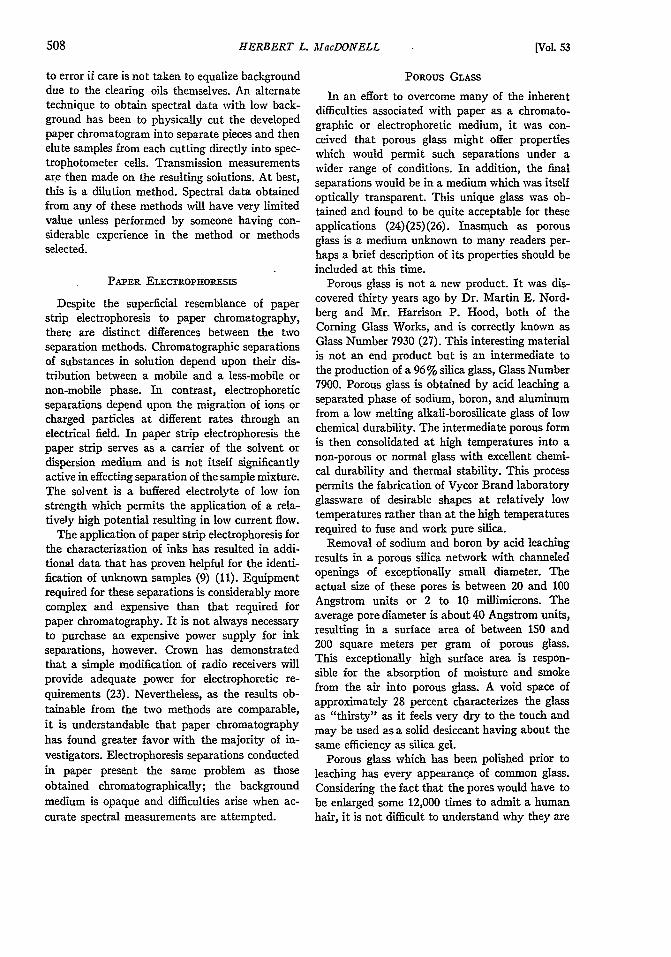
TABLE 1DEVELOPMENT WITH WATER: BLACK INKS
Sample Identification Spot Color Zone I Zone 2 Zone 5 Zone 4j
Parker Black 9 5035 ........ Deep Violet Violet Violet, Yellow VioletSheaffer Black # 34 ......... Black Faint Violet Faint Violet Faint Violet Faint VioletSheaffer Black # 64. ........ Light Blue Light Blue Light Blue Red, YellowCarter Black #99........ Violet Violet Violet Yellow VioletCarter Black 9986........] Blue Blue-Green Orange RoseSanford Black § 235 ........ Green-Violet Blue-Green Blue-Green Violet OrangeSanford Black § 236 ........ Black Faint Violet Faint VioletWaterman Black, New.... Blue Blue Violet Violet, Yellow BlueWaterman Black, Old ....... i Purple Purple Yellow, Violet Blue BlueHiggins Black § 812 ........ Purple Faint Purple Faint Purple Faint Purple Faint Purple
TABLE 2DEVELOPMENT WITM WATER: BLUE INKS
Sample Identification I Spot Color Zone 1 Zone 2 Zone 3 Zone 4t
Parker Turquoise # 5034 ........ Blue Blue Blue Violet BlueParker Royal Blue % 5038 ....... Violet Violet Violet I Violet VioletParker Blue 9 5039 ............ Violet Violet Violet Violet VioletSheaffer Blue §42 .............. Blue Blue Blue I Blue' BlueSheaffer Blue # 44 ......... Violet Violet Violet Violet Violet
Sheaffer Royal Blue N 54. . Violet Violet Violet Violet VioletSheaffer Purple # 84 ............ . Deep Violet Deep VioletSheaffer Peacock Blue # 114. ... 1 M Blue-Green Blue-Green Blue-GreenCarter Indigo Blue .............. Black Blue Faint VioletCarter Jewel Tone Purple #46. Deep VioletCarter Contrast Purple #49 .... Deep VioletCarter Blue .# 79 ................ Violet Violet Violet Violet VioletCarter Cdhtrist Turquoise #119. Blue-Green Blue-Green Blue-GreenSanford Violet #206 ............ Deep VioletSanford Royal Blue #256 ........ Blue Blue Blue Blue BlueSanford Peacock Blue #266 ... _.; Blue-Green Blue-Green Blue-Green iWaterman Blue #632 ........... Blue Blue Blue Blue Blue
TABLE 3
DEVELOPMENT WITH WATER: BLuE-BLAcK INKS
Sample Identification Spot Color Zone 1 iZone 2 Zone 3 ] Zone 4
Parker Blue-Black # 5033 ............ Violet Violet Violet Violet VioletCarter Blue-Black .................. Blue Blue Blue Blue BlueCarter Blue-Black #816 ............. Blue Blue Blue Blue BlueCarter Blue-Black # 919 ............. Blue Blue Blue Blue BlueSanford Blue-Black #276 ............ I Blue Blue Blue Blue BlueSheaffer Blue-Black # 22............. Blue Blue-Green Blue-Violet Violet Y2 VioletVaterman Blue-Black.............. Blue Blue Blue Blue Blue
Higgins Blue-Black # 822............ Blue Blue Blue Blue I Blue
[Vol. 53

FOUNTAIN PEN INK CHARACTERIZATION
TABLE 4DEVELOM:NT wrnm WATER: RED INKS
Sample Identification Spot Color Zone I Zone 2 Zone 3 Zone 4
Parker Red #5037 .................... Faint Red Red Band Red RedSheaffer Red # 04 ..................... Deep Red RedCarter Red # 39 ...................... Red Red Red Red Band RedCarter Carmine Red #382 ............. OrangeSanford Cardinal Red # 246 ............ OrangeSanford Dubonnet #286 ............... Purple Red Red
TABLE 5DEVELOPMENT WITH WATER: BROWN INKS
Sample Identification Spot Color Zone 1 Zone 2 Zone 3 Zone 4
Sheaffer Brown # 14 ........ Blue Violet-Brown YellowCarter Sunset Brown S 526.. Dark Brown Dark Brown Red-Brown Red-BrownSanford Brown N 296 ........ Purple Purple Rose-Bfown Yellow
TABLE 6DEVELOPMENT WrH WATER: GREEN INES
Sample Identification Spot Color Zone I Zone 2 Zone 3 Zone 4
Parker Emerald Green # 5043.. Blue-Green Blue-Green Blue-Green Yellow Blue-GreenSheaffer Emerald Green # 74... Y2 Blue-Green Plue-Green Blue-Green YellowCarter Green #56 ............ Green GreenCarter Contrast Green §59 .... Green GreenCarter Jewel Tone Green #56.. Green GreenCarter Green #959 ........... Green GreenSanford Green #216 .......... Blue-Green Blue-Green
I_______________ I_______________ I_______I __ I________________separation. The remaining distance from this spotto the extent of the solvent front during develop-ment was divided into four equal sections des-ignated as zone 1, zone 2, zone 3, and zone 4,respectively. In many cases no component willmigrate into zone 4 (such as ink #2 in figure 1).Nevertheless, during development the wave frontof complete solvent saturation is dearly visibleand the extent of its migration well defined. Forthis reason it is possible to determine the proper"zone classification" of a particular componenteven though only one ink is being separated. Whenno component has migrated into the fourth zone(immediately following the wave front), the extentof solvent migration must be marked beforedrying the slide. Without such a mark there wouldbe no way of knowing proportional distances andthe correct assignment of "zone classification"would be impossible. Data obtained on fifty-one
commercially available fountain pen inks follow-ing their chromatographic separation in porousglass is contained in tables 1 to 6.
It is important to realize that these tables areat best a guide rather than a firm rule for the identi-fication and location of various bands. No twoindividuals would agree completely on the exactcolor or position of these bands, therefore, a liberalinterpretation of position of these characteristicsis essential.
Additional data was obtained through the use ofsolvent systems other than water. The color ofcertain ink dyes is known to be pH sensitive andfor this reason both dilute acids and dilute baseswere evaluated as porous glass chromatographicdevelopers (30). Generally speaking, however,there was very little difference between develop-ment with dilute acid and water. For this reasondilute acid chromatographic results will be omitted
HERBERT L. MacDONELL
. 4 500
I.00
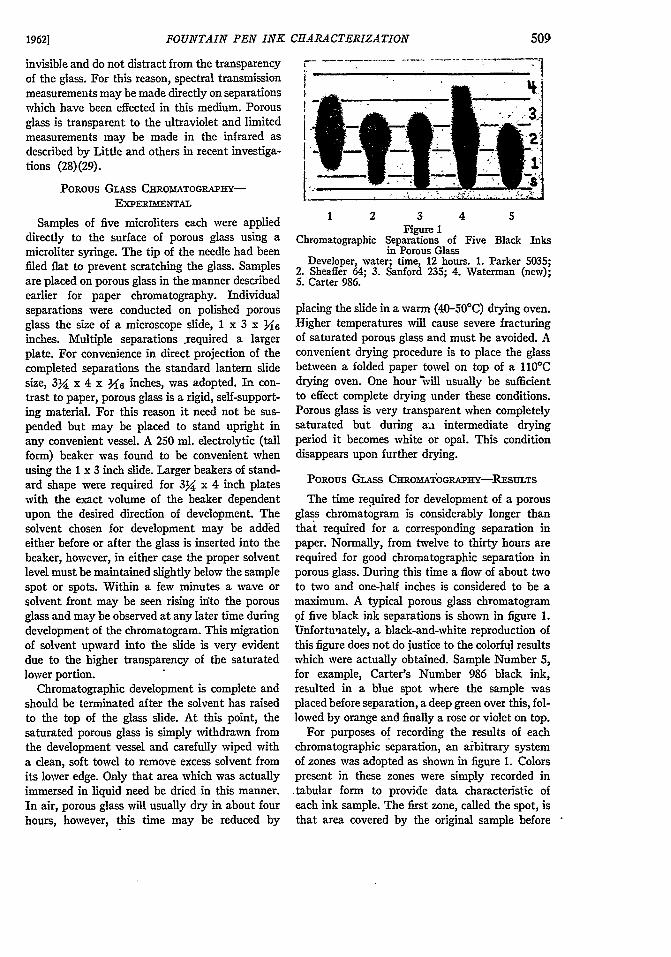
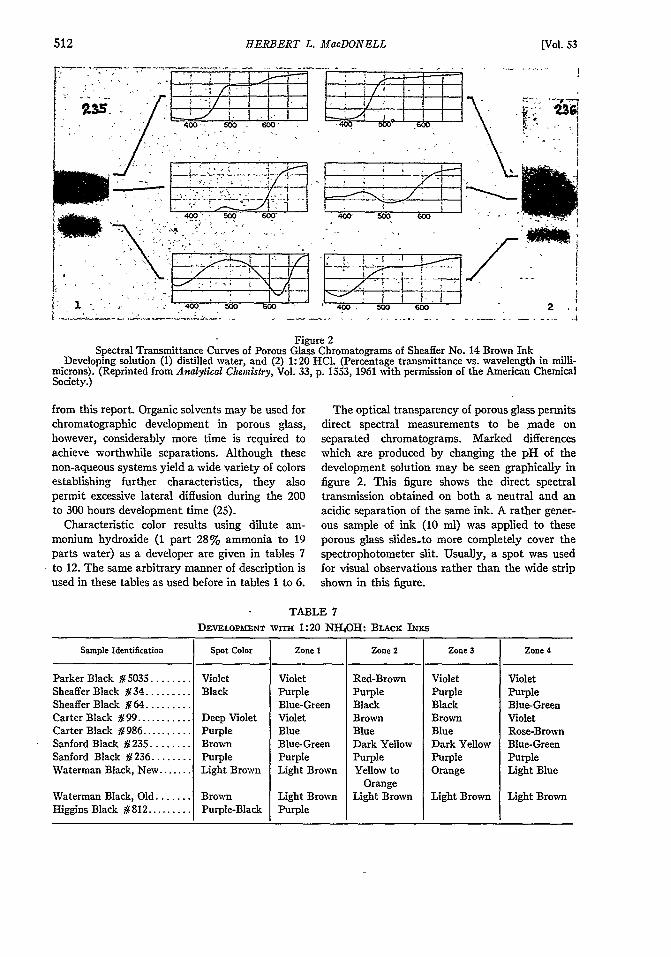
Figure 2Spectral Transmittance Curves of Porous Glass Chromatograms of Sheaffer No. 14 Brown Ink
Developing solution (1) distilled water, and (2) 1:20 HCl. (Percentage transmittance vs. wavelength in milli-microns). (Reprinted from Analytical Chemistry, Vol. 33, p. 1553, 1961 with permission of the American ChemicalSociety.)
from this report. Organic solvents may be used forchromatographic development in porous glass,however, considerably more time is required toachieve worthwhile separations. Although thesenon-aqueous systems yield a wide variety of colorsestablishing further characteristics, they alsopermit excessive lateral diffusion during the 200to 300 hours development time (25).
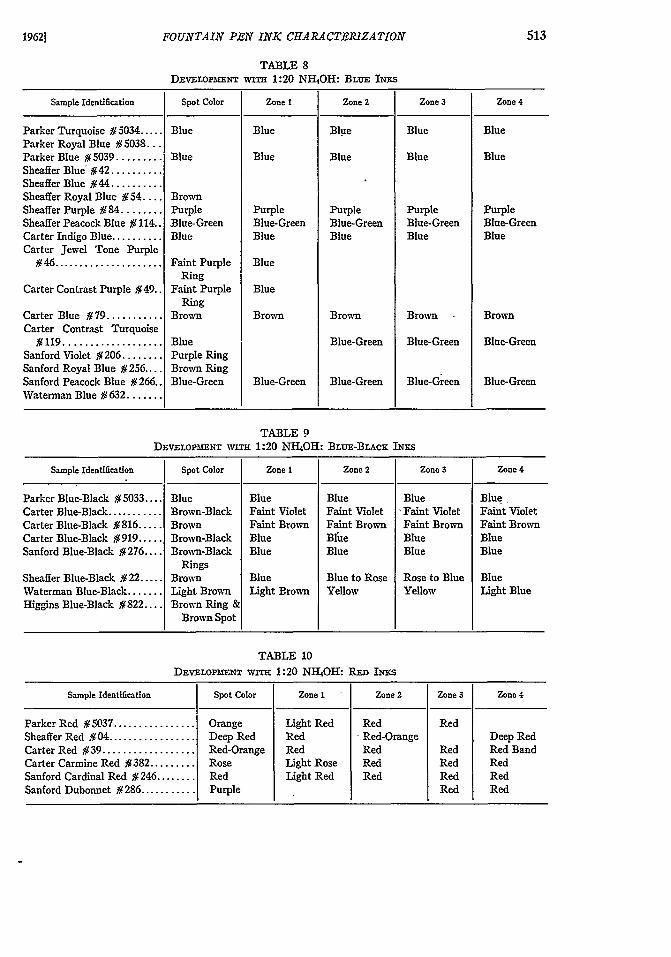
Characteristic color results using dilute am-monium hydroxide (1 part 28% ammonia to 19parts water) as a developer are given in tables 7to 12. The same arbitrary manner of description isused in these tables as used before in tables 1 to 6.
TAI
DnEv'opmEiNT wirTi 1:
The optical transparency of porous glass permitsdirect spectral measurements to be made onseparated chromatograms. Marked differenceswhich are produced by changing the pH of thedevelopment solution may be seen graphically infigure 2. This figure shows the direct spectraltransmission obtained on both a neutral and anacidic separation of the same ink. A rather gener-ous sample of ink (10 ml) was applied to theseporous glass slides.to more completely cover thespectrophotometer slit. Usually, a spot was usedfor visual observations rather than the wide stripshown in this figure.
3LE 7
20 NIHOH: BLAcK Im5cKs
Sample Identification Spot Color Zone 1 Zone 2 Zone S Zone 4
Parker Black # 5035 ........ Violet Violet Red-Brown Violet VioletSheaffer Black N#34 ......... Black Purple Purple Purple PurpleSheaffer Black //64 ......... Blue-Green Black Black Blue-GreenCarter Black §#99 ........... Deep Violet Violet Brown Brown VioletCarter Black 9 986 .......... Purple Blue Blue Blue Rose-BrownSanford Black # 235 ........ Brown Blue-Green Dark Yellow Dark Yellow Blue-GreenSanford Black # 236 ....... Purple Purple Purple Purple PurpleWaterman Black, New ....... Light Brown Light Brown Yellow to Orange Light Blue
OrangeWaterman Black, Old ....... Brown Light Brown Light Brown Light Brown Light BrownHiggins Black #%812 ......... Purple-Black Purple
[Vol. 53
FOUNTAIN PEN INK CHARACTERIZATION
TABLE 8DEVELOPMENT WrTH 1:20 NH4OH: BLUE INES
Sample Identification Spot Color Zone I Zone 2 Zone 3 Zone 4
Parker Turquoise N5034 ..... Blue Blue Blue Blue BlueParker Royal Blue N 5038...Parker Blue #5039 ......... Blue Blue Blue Blue BlueSheaffer Blue #42 ..........Sheaffer Blue N44 ..........Sheaffer Royal Blue N 54 .... BrownSheaffer Purple N 84 ........ Purple Purple Purple Purple PurpleSheaffer Peacock Blue # 114.. Blue-Green Blue-Green Blue-Green Blue-Green Blue-GreenCarter Indigo Blue .......... Blue Blue Blue Blue BlueCarter Jewel Tone Purple
#46 ..................... Faint Purple BlueRing
Carter Contrast Purple S#49.. Faint Purple BlueRing
Carter Blue S79 ........... Brown Brown Brown Brown BrownCarter Contrast Turquoise
§ 119 ................... Blue Blue-Green Blue-Green Blue-GreenSanford Violet #206 ........ Purple RingSanford Royal Blue # 256.... Brown RingSanford Peacock Blue #266.. Blue-Green Blue-Green Blue-Green Blue-Green Blue-GreenWaterman Blue # 632 .......
TABLE 9DEVELOPMENT WITH 1:20 NH4OH: BLE-BLAcK INKS
Sample Identification Spot Color Zone I Zone 2 Zone 3 Zone 4
Parker Blue-Black #5033 .... Blue Blue Blue Blue BlueCarter Blue-Black ........... Brown-Black Faint Violet Faint Violet Faint Violet Faint VioletCarter Blue-Black #816..... Brown Faint Brown Faint Brown Faint Brown Faint BrownCarter Blue-Black #919..... Brown-Black Blue Blue Blue BlueSanford Blue-Black # 276 .... Brown-Black Blue Blue Blue Blue
RingsSheaffer Blue-Black # 22 ..... Brown Blue Blue to Rose Rose to Blue BlueWaterman Blue-Black ....... Light Brown Light Brown Yellow Yellow Light BlueHiggins Blue-Black #822 .... Brown Ring &
Brown Spot
TABLE 10DEVELOPMENT wITH 1:20 NH 4OH: RED INxs
Sample Identification Spot Color Zone I Zone 2 Zone 3 Zone 4
Parker Red #5037 ................ Orange Light Red Red RedSheaffer Red #04 ................. Deep Red Red Red-Orange Deep RedCarter Red #39 .................. Red-Orange Red Red Red Red BandCarter Carmine Red N#382 ......... Rose Light Rose Red Red RedSanford Cardinal Red # 246 ........ Red Light Red Red Red RedSanford Dubonnet #286 ........... I Purple Red Red
HERBERT L. MacDONELL
TABLE 11
DEVELOPMENT WITH 1:20 NH4OH: BROWN INiS
Sample Identification Spot Color Zone 1 Zone 2 Zone 3 Zone 4
Sheaffer Brown S 14 ....... Blue Yellow to Brown toBrown Yellow
Carter Sunset Brown #526.. Dark Brown Brown Brown Brown Light Brown
Sanford Brown #296 ........ Dark Purple Purple Yellow Yellow-Brown Yellow
TABLE 12
DEVELOPMENT WITH 1:20 NH4OH: GREEN INES
Sample Identification Spot Color Zone 1 Zone 2 Zone 3 Zone 4
Parker Emerald Green N 5043 ...... Blue Blue Green Blue-GreenSheaffer Emerald Green #74 ....... Blue-Green Blue-Green Green Green Blue-Green
Carter Green 956 ................ Blue Blue Blue Blue Blue
Carter Contrast Green #59 ........ Blue Blue Blue Blue Blue
Carter Jewel Tone Green #56...-. Blue Blue Blue Blue Blue
Carter Green S 959 ............... Blue Ring Blue Blue Blue BlueSanford Green #216 .............. Faint Blue
PoRous GLASS ELEcTROPoaHOEsIs-EXPERIMENTAL
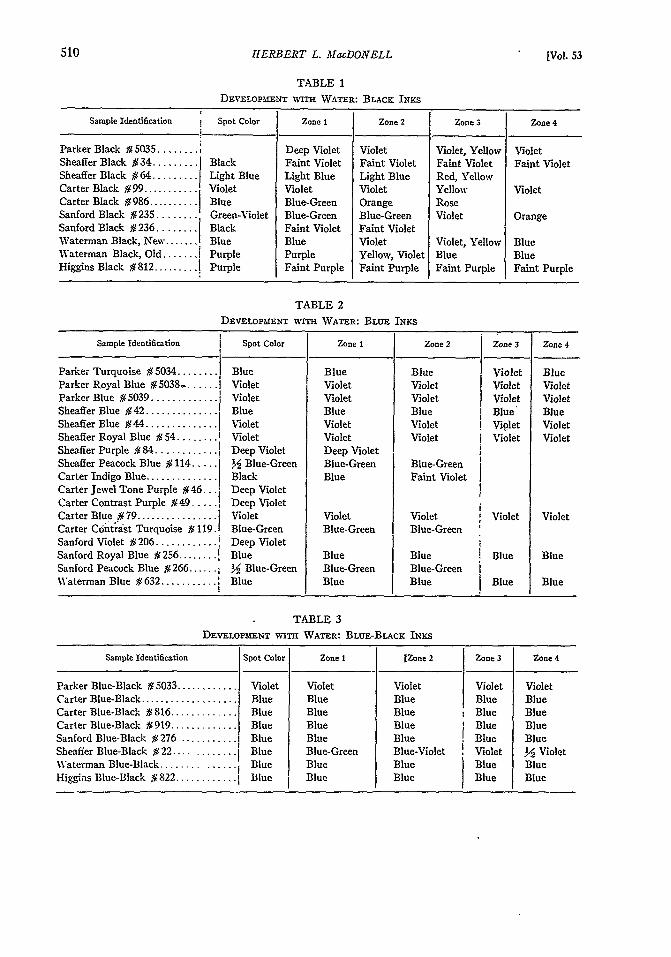
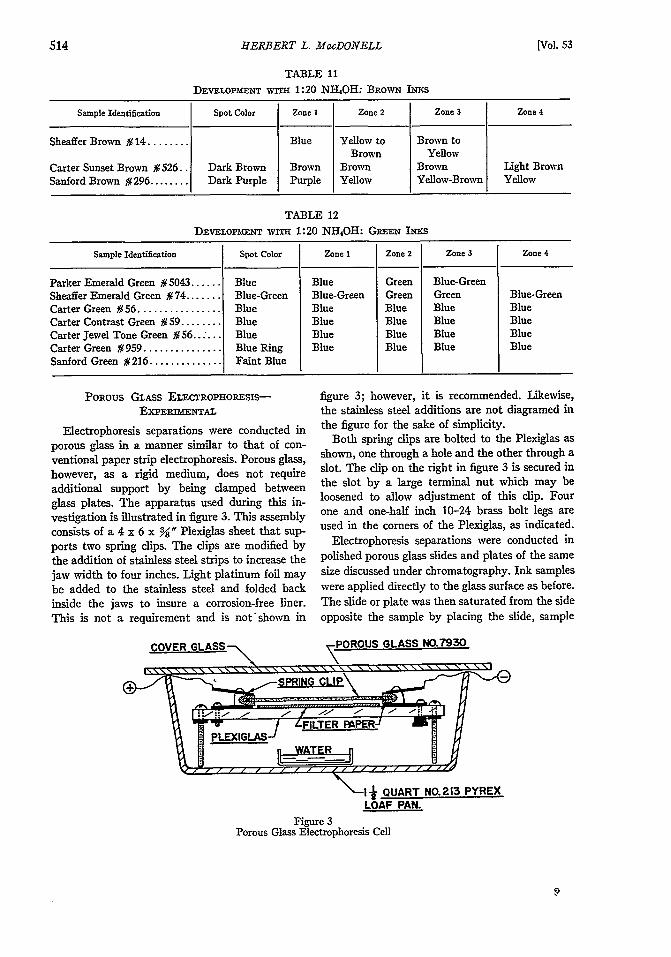
Electrophoresis separations were conducted inporous glass in a manner similar to that of con-ventional paper strip electrophoresis. Porous glass,however, as a rigid medium, does not requireadditional support by being damped betweenglass plates. The apparatus used during this in-vestigation is illustrated in figure 3. This assemblyconsists of a 4 x 6 x %, Plexiglas sheet that sup-ports two spring dips. The dips are modified bythe addition of stainless steel strips to increase thejaw width to four inches. Light platinum foil maybe added to the stainless steel and folded backinside the jaws to insure a corrosion-free liner.This is not a requirement and is not'shown in
figure 3; however, it is recommended. Likewise,the stainless steel additions are not diagramed inthe figure for the sake of simplicity.
Both spring dips are bolted to the Plexiglas asshown, one through a hole and the other through aslot. The dip on the right in figure 3 is secured inthe slot by a large terminal nut which may beloosened to allow adjustment of this clip. Fourone and one-half inch 10-24 brass bolt legs areused in the corners of the Plexiglas, as indicated.
Electrophoresis separations were conducted inpolished porous glass slides and plates of the samesize discussed under chromatography. Ink sampleswere applied directly to the glass surface as before.The slide or plate was then saturated from the sideopposite the sample by placing the slide, sample
\-Ij QUART NO.213 PYREXLOAF PAN.
Figure 3Porous Glass Electrophoresis Cell
[Vol. 53

FOUNTAIN PEAT INK CHARACTERIZATION
Figure 4Electrophoresis Separation of Five Black Inks
iii Porous GlassBuffer, pH 8.6 Veronal; potential, 160 volts; current
flow, 8 ma.; time, 2 hours. Migration was toward theanode (top). 1. Parker 5035; 2. Sheaffer 64; 3. San-ford 235; 4. Waterman (new); 5. Carter 986.
side up, into either a large watch glass or a petridish. If the petri dish is used some provision mustbe made to support the under side of the porousglass above the bottom of the dish. Cementingseveral glass beads with epoxy cement was foundconvenient for this purpose.
Buffer should be carefully poured into the watchglass (or petri dish) until it just wets the bottomside of the sample slide. As the slide becomes satu-rated with buffer a noticeable meniscus developsfrom all sides. This phenomenon disappears en-tirely when complete saturation is achieved; usu-ally within five minutes. The glass is then re-moved from the container and excess buffer iswiped from the bottom side, using a dean, softcloth. Filter paper strips are placed over the endsof the glass and the slide is inserted into the clampsas shown in figure 3. All filter paper should beimmediately saturated with buffer to retard sur-
face evaporation from and provide intimateelectrical contact with the porous glass. A medicinedropper facilitates this operation.
After these conditions have been satisfied, thecover of the cell should be secured and a potentialapplied to effect separation of the samples. Allseparations were conducted at 160 volts with aresulting current flow of 2 to 3 ma for a 1" stripand 6 to 10 ma for a 34 x 4" plate. After separa-tion is complete, the sample slide is removed fromthe cell, wiped dry with a soft doth, and placed ina warm drying oven at 40-50'C unftil completelydry.
PoRous GLASS ELEcrRoPHoREsIs-R suLTs
Separations achieved from porous glass electro-phoresis are rapid, distinct, and do not developdistortion during drying. Figure 4 illustrates theporous glass electrophoresis separations of fiveblack inks shown earlier as chromatograms infigure 1. By comparing these two figures it isevident that better resolution and more completeseparations are possible when the dectrophoresistechnique is employed. An additional comparisonbetween the two methods is shown in figure 5.
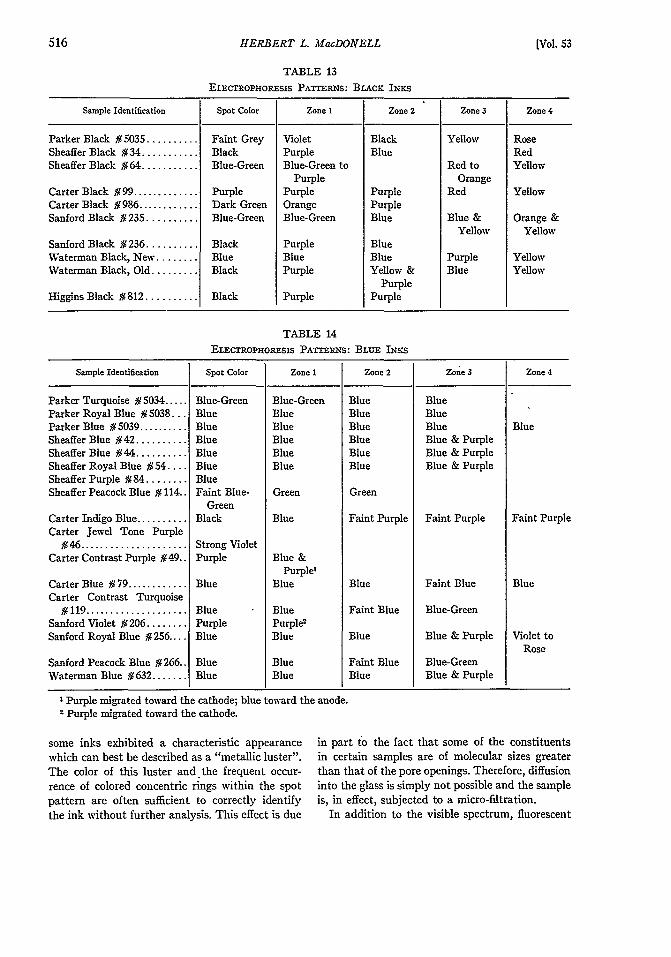
The electrophoresis characterization of fifty-onecommercially available fountain pen inks arelisted in tables 13 to 18. Results are expressed inthe same system as used in the preceding-tables.
ADDITIONAL CHARACTERISTICS
Initial experiments using porous glass as achromatographic medium disclosed an unexpectedand interesting aspect of this material. After asample has been placed on porous glass an almostinstantaneous drying occurs due to the extremelylarge surface area. When dry the sample spot of
Figure 5Comparison of Electrophoresis and Chromatography Patterns in Porous Glass
Chromatography (left); developer, water; time, 12 hours. Electrophoresis (right); buffer, pH 8.6 Veronal;potential, 160 volts; current flow, 8 ma.; time, 2 hours. Migration (electrophoresis) was toward the anode (top).1. Parker 5037 Red: 2. Sheaffer 04 Red; 3. Carter 39 Red; 4. Parker 5043 Green; 5. Sanford 296 Brown.
19621
HERBERT L. MacDONELL
TABLE 13
ELECTROPnORESIS PATTERNS: BLAcK INKS
Sample Identification Spot Color Zone I Zone 2 Zone 3 Zone 4
Parker Black N#5035 .......... Faint Grey Violet Black Yellow RoseSheaffer Black #34 ........... Black Purple Blue RedSheaffer Black ]/64 ........... Blue-Green Blue-Green to Red to Yellow
Purple OrangeCarter Black #99 ............. Purple Purple Purple Red YellowCarter Black #986 ........... Dark Green Orange PurpleSanford Black § 235 .......... Blue-Green Blue-Green Blue Blue & Orange &
Yellow Yellow
Sanford Black #236 .......... Black Purple BlueWaterman Black, New........ Blue Blue Blue Purple YellowWaterman Black, Old ......... Black Purple Yellow & Blue Yellow
PurpleHiggins Black # 812 .......... Black Purple Purple
TABLE 14ELECTROPHORESIS PATrERNs: BLUE INKS
Sample Identification Spot Color Zonel Zone 2 Zone 3 Zone 4
Parker Turquoise # 5034 ..... Blue-Green Blue-Green Blue BlueParker Royal Blue # 5038.. Blue Blue Blue BlueParker Blue # 5039 .......... Blue Blue Blue Blue BlueSheaffer Blue # 42 .......... Blue Blue Blue Blue & PurpleSheaffer Blue # 44 .......... Blue Blue Blue Blue & PurpleSheaffer Royal Blue 54 .... Blue Blue Blue Blue & PurpleSheaffer Purple §84 ........ BlueSheaffer Peacock Blue # 114.. Faint Blue- Green Green
GreenCarter Indigo Blue .......... Black Blue Faint Purple Faint Purple Faint PurpleCarter Jewel Tone Purple
#46 ..................... Strong VioletCarter Contrast Purple # 49.. Purple Blue &
Purple'Carter Blue # 79 ............ Blue Blue Blue Faint Blue BlueCarter Contrast Turquoise
§#119 .................... Blue Blue Faint Blue Blue-GreenSanford Violet # 206 ........ Purple Purple;Sanford Royal Blue # 256... Blue Blue Blue Blue & Purple Violet to
Rose
Sanford Peacock Blue # 266.. Blue Blue Faint Blue Blue-GreenWaterman Blue #632 ....... Blue Blue Blue Blue & Purple
I Purple migrated toward the cathode; blue toward the anode.
2 Purple migrated toward the cathode.
some inks exhibited a characteristic appearance in part to the fact that some of the constituents
which can best be described as a "metallic luster". in certain samples are of molecular sizes greater
The color of this luster and the frequent occur- than that of the pore openings. Therefore, diffusion
rence of colored concentric rings within the spot into the glass is simply not possible and the sample
pattern are often sufficient to correctly identify is, in effect, subjected to a micro-filtration.
the ink without further analysis. This effect is due In addition to the visible spectrum, fluorescent
[Vol. 53

FOUNTAIN PEN INK CHARACTERIZATION
TABLE 15
EEcTnOPrORESis PAT ERNS: BLUE-BLACK INKS
Sample Identification. Spot Color Zone 1 Zone 2 Zone 3 Zone 4
Parker Blue-Black # 5033 ......... Blue Blue Blue & Blue YellowPurple
Carter Blue-Black ................. Dark Blue Blue Blue BlueCarter Blue-Black # 816 .......... Blue Blue Blue Blue Very Faint
YellowCarter Blue-Black S#919 ........... Blue Blue Blue BlueSanford Blue-Black #276 .......... Blue Blue Blue BlueSheaffer Blue-Black S22 ........... Blue-Green Blue Blue Rose-PurpleWaterman Blue-Black ........... :. Blue Blue Blue YellowHiggins Blue-Black #822 .......... Strong Blue Blue Blue Blue
TABLE 16
ELECrOPHOREsIS PATTERNS: RED INxS
Sample Identification Spot Color Zone I Zone 2 Zone 3 Zone 4
Parker Red §5037 .......... Y Faint Red Orange Orange OrangeSheaffer Red # 04 ............. Y Orange %
RoseCarter Red S#39 .............. Orange Orange OrangeCarter Carmine Red S382 ..... OrangeSanford Cardinal Red S 246 .... Orange Rose Y RoseSanford Dubonnet # 286 ....... Purple Faint Purple Faint Purple Red Red
TABLE 17
EEC mTopHoRESis PATwENS: BROWN INKS
Sample Identification Spot Color Zone I Zone 2 Zone 3 Zone 4
Sheaffer Brown N#14 ........ Blue-Green Brown Yellow-BrownCarter Sunset Brown N 526.. Dark Brown Brown Purple RedSanford Brown # 296 ........ Purple Faint Purple Purple Rose Yellow
TABLE 18
ELECTROPHORESIS PATTERNS: GREEN INKS
Sample Identification Spot Color Zone 1 Zone 2 Zone 3 Zone 4
Parker Emerald Green N5043.... Blue Green Violet YellowSheaffer Emerald Green N#74 .... Blue-Green YellowCarter Green #56 .............. Green Y Blue-GreenCarter Contrast Green 59 ...... Green M GreenCarter jewel Tone Green # 56 .... Green Y Blue-GreenCarter Green #959 ............. Green Y Blue-GreenSanford Green #216 ............ Blue-Green Blue-Green
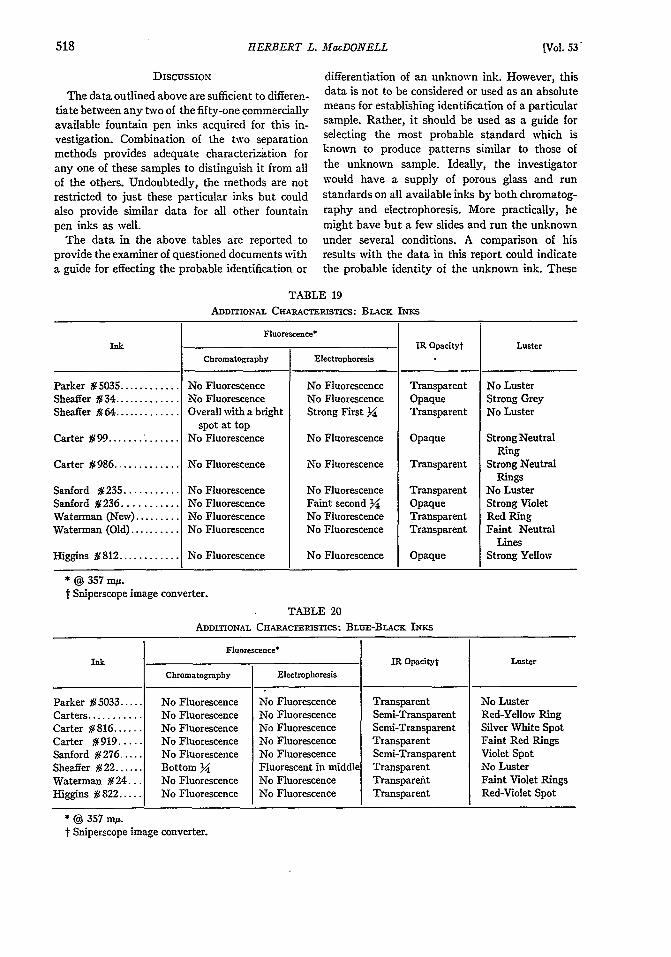
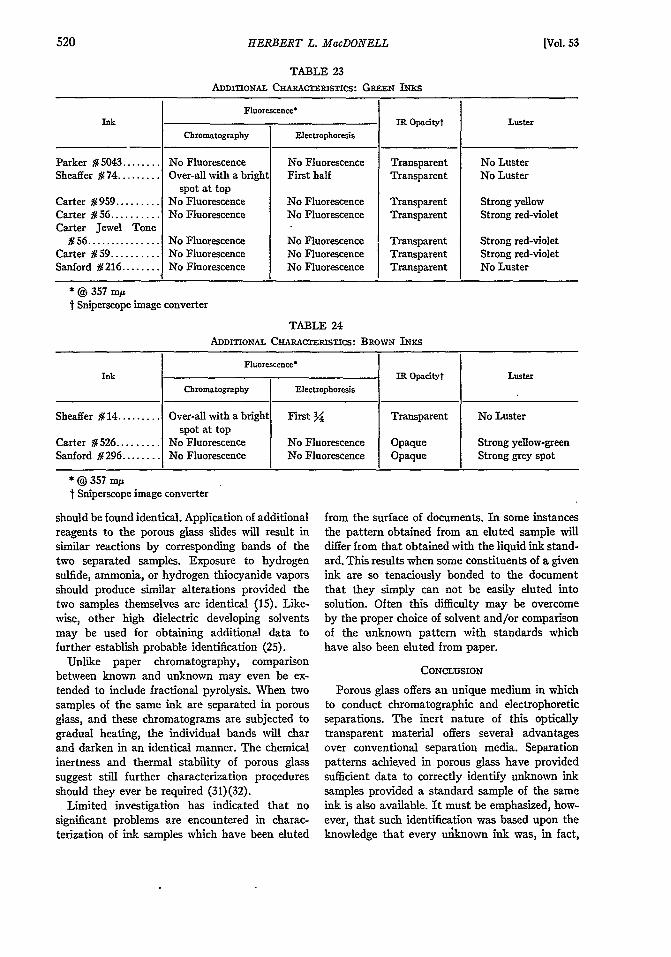
activity of the developed porous glass separationswas observed. Also, the infrared opacity was ob-tained by observing the developed chromatogramsthrough an infrared "sniperscope" image con-
verter while holding the glass slides in front of a100 watt incandescent bulb. Data obtained fromthese observations are recorded in tables 19 to 24,as follows.
19621
HERBERT L. MacDONELL
DISCUSSION
The data outlined above are sufficient to differen-tiate between any two of the fifty-one commerciallyavailable fountain pen inks acquired for this in-vestigation. Combination of the two separationmethods provides adequate characterization forany one of these samples to distinguish it from allof the others. Undoubtedly, the methods are notrestricted to just these particular inks but couldalso provide similar data for all other fountainpen inks as well.
The data in the above tables are reported toprovide the examiner of questioned documents witha guide for effecting the probable identification or
differentiation of an unknown ink. However, thisdata is not to be considered or used as an absolutemeans for establishing identification of a particularsample. Rather, it should be used as a guide forselecting the most probable standard which isknown to produce patterns similar to those ofthe unknown sample. Ideally, the investigatorwould have a supply of porous glass and runstandards on all available inks by both chromatog-raphy and electrophoresis. More practically, hemight have but a few slides and run the unknownunder several conditions. A comparison of hisresults with the data in this report could indicatethe probable identity of the unknown ink. These
TABLE 19ADDITIONAL CHARACTEisTIcs: BLACK INKS
Fluorescence*
Ink IR Opaeityt Luster
Chromatography Electrophoresis
Parker S 5035 ............ No Fluorescence No Fluorescence Transparent No LusterSheaffer S 34 ............. No Fluorescence No Fluorescence Opaque Strong GreySheaffer N 64 ............. Overall with a bright Strong First Y Transparent No Luster
spot at topCarter # 99 ............. No Fluorescence No Fluorescence Opaque Strong Neutral
RingCarter #986 ............ No Fluorescence No Fluorescence Transparent Strong Neutral
RingsSanford # 235 ........... No Fluorescence No Fluorescence Transparent No LusterSanford # 236 ........... No Fluorescence Faint second Y Opaque Strong VioletWaterman (New) ......... No Fluorescence No Fluorescence Transparent Red RingWaterman (Old) ......... No Fluorescence No Fluorescence Transparent Faint Neutral
LinesHiggins 9 812 ............ No Fluorescence No Fluorescence Opaque Strong Yellow
* @ 357 rmy.
t Sniperscope image converter.
TABLE 20
ADDITIONAL CHARACTERISTICS: BLUE-BLAcK INKS
Fluorescence*Ink IR Opacityt Luster
Chromatography Electrophoresis
Parker § 5033 ..... No Fluorescence No Fluorescence Transparent No LusterCarters ........... No Fluorescence No Fluorescence Semi-Transparent Red-Yellow RingCarter 9 816 ...... No Fluorescence No Fluorescence Semi-Transparent Silver White SpotCarter S 919 ..... No Fluorescence No Fluorescence Transparent Faint Red RingsSanford S 276 ..... No Fluorescence No Fluorescence Semi-Transparent Violet SpotSheaffer #22 ...... Bottom Y4 Fluorescent in middle Transparent No LusterWaterman # 24... No Fluorescence No Fluorescence Transparefnt Faint Violet RingsHiggins X 822 ..... No Fluorescence No Fluorescence Transparent Red-Violet Spot
* @ 357 mps.t Sniperscope image converter.
[Vol. 53"

FOUNTAIN PEN INK CHARACTERIZATION
TABLE 21ADDIIONAL CHARAcTERIsTIcs: BLUE INS
Fluorescence*Ink IR Opacityt Luster
Chromatography Electrophoress
Parker N#5034 ........ No Fluorescence No Fluorescence Transparent No LusterParker #5038 ....... No Fluorescence No Fluorescence Transparent Red ring & LinesParker S 5039 ....... No Fluorescence Faint first 4 Transparent No LusterSheaffer #42 ........ Over-all with a bright Spot & middle Transparent No Luster
spot at topSheaffer §44 ........ Over-all with a bright Spot & middle Transparent No Luster
spot at topSheaffer # 54 ......... Faint over-all with a In middle Transparent No Luster
faint spot at topSheaffer §#84 ........ No Fluorescence First X4 Transparent Strong Yellow-goldSheaffer S 114 ........ Over-all with a bright Overspot & middle Transparent No Luster
spot at topCarter Indigo ........ No Fluorescence No Fluorescence Opaque Faint red ringCarter S#46 .......... No Fluorescence No Fluorescence Transparent Strong yellow-green
ringCarter S49 .......... No Fluorescence No Fluorescence Transparent Strong yellow-green
ringCarter N 79 ......... No Fluorescence No Fluorescence Transparent No LusterCarter S 119 ........ No Fluorescence No Fluorescence Transparent Strong blueSanford S 206 ....... No Fluorescence No Fluorescence Transparent Strong yellow-green
ringSanford 256.......No Fluorescence No Fluorescence Transparent Red-violet ringsSanford 266........ No Fluorescence No Fluorescence Transparent No LusterWaterman 632 . No Fluorescence No Fluorescence Transparent No Luster
* @ 357 mu
j Sniperscope image converter
TABLE 22
ADDITIONAL CHARACTERISTICS: RED INKS
Fluorescence*Ink IR Opacityt Luster
Chromatography Electrophoresis
Parker #5037 ........ No Fluorescence No Fluorescence Transparent Faint linesSheaffer h 04 ........ Yellow over-all (only Faint first Y Transparent Strong yellow ring
when acidic, notwhen basic.)
Carter #39 .......... No Fluorescence No Fluorescence Transparent Strong yellowCarter S382 ......... No Fluorescence No Fluorescence Transparent Strong yellow-red ringsSanford S246 ........ No Fluorescence No Fluorescence Transparent No LusterSanford S 286 ........ No Fluorescence No Fluorescence Transparent Faint lines
* @ 357 np
f Sniperscope image converter
two inks, standard and unknown, should then besubjected to porous glass under neutral, acidic,and basic conditions and also electrophoreticseparation. The fluorescent activity, infrared
opacity, and original character of the dried samplespot should also be determined.
If the unknown ink sample and the known inkstandard are actually the same, all characteristics
1962]
HERBERT L. MacDONELL
TABLE 23
ADDITIONAL CHARACTEiSTICS: GREEN INES
Fluorescence*Ink IR Opacityt Luster
Chromatography Electrophoresis
Parker # 5043 ...... No Fluorescence No Fluorescence Transparent No LusterSheaffer N 74 ......... Over-all with a bright First half Transparent No Luster
spot at topCarter # 959 ......... No Fluorescence No Fluorescence Transparent Strong yellowCarter 9 56 .......... No Fluorescence No Fluorescence Transparent Strong red-violetCarter Jewel Tone
#56 ............... No Fluorescence No Fluorescence Transparent Strong red-violetCarter # 59 .......... No Fluorescence No Fluorescence Transparent Strong red-violetSanford #216 ........ No Fluorescence No Fluorescence Transparent No Luster
*@ 357 mpL
t Sniperscope image converter
TABLE 24ADDITIONAL CHARAcTERiSTIcs: BROWN INKS
Fluorescence*
Ink IR Opacityt Luster
Chromatography Electrophoresis
Sheaffer # 14 ......... Over-all with a bright First 4 Transparent No Lusterspot at top
Carter # 526 ....... No Fluorescence No Fluorescence Opaque Strong yellow-greenSanford # 296 ........ No Fluorescence No Fluorescence Opaque Strong grey spot
*@357mgt Sniperscope image converter
should be found identical. Application of additionalreagents to the porous glass slides will result insimilar reactions by corresponding bands of thetwo separated samples. Exposure to hydrogensulfide, ammonia, or hydrogen thiocyanide vaporsshould produce similar alterations provided thetwo samples themselves are identical (15). Like-wise, other high dielectric developing solventsmay be used for obtaining additional data tofurther establish probable identification (25).
Unlike paper chromatography, comparisonbetween known and unknown may even be ex-tended to include fractional pyrolysis. When twosamples of the same ink are separated in porousglass, and these chromatograms are subjected togradual heating, the individual bands will charand darken in an identical manner. The chemicalinertness and thermal stability of porous glasssuggest still further characterization proceduresshould they ever be required (31)(32).
Limited investigation has indicated that nosignificant problems are encountered in charac-terization of ink samples which have been eluted
from the surface of documents. In some instancesthe pattern obtained from an eluted sample willdiffer from that obtained with the liquid ink stand-ard. This results when some constituents of a givenink are so tenaciously bonded to the documentthat they simply can not be easily eluted intosolution. Often this difficulty may be overcomeby the proper choice of solvent and/or comparisonof the unknown pattern with standards whichhave also been eluted from paper.
CONCLUSION
Porous glass offers an unique medium in whichto conduct chromatographic and electrophoreticseparations. The inert nature of this opticallytransparent material offers several advantagesover conventional separation media. Separationpatterns achieved in porous glass have providedsufficient data to correctly identify unknown inksamples provided a standard sample of the sameink is also available. It must be emphasized, how-ever, that such identification was based upon theknowledge that every udknown ink was, in fact,
[Vol. 53
FOUNTAIN PEN INK CHARACTERIZATION
one of the several samples which had been charac-
terized during the course of this investigation.When one considers that there are hundreds ofother ink formulations which have not been socharacterized, it is apparent that in other instancesa final conclusion must be limited to a "presump-tive identification." Nevertheless, differences be-tween two samples definitely may be establishedusing porous glass separation techniques. Veryoften it is this information which is of more sig-nificant evidential value to the examiner of ques-tioned documents.
ACKNOWLEDGEMENTS
The author expresses his appreciation to ComingGlass Works for providing both the porous glass andlaboratory facilities used throughout this research.Thanks are extended to the following companies fortheir consideration in supplying many of the ink sam-ples: Higgins Ink Company, The Parker Pen Company,Sanford Ink Company, and W. A. Shaeffer Pen Com-pany. Encouragement and advice from Dr.J. P. Williamsduring many phases of the investigation are also ac-knowledged. The typing efforts of Miss Patricia A.Hyland are greatly appreciated.
BIBLIOGRAPHY1. OSBORN, ALBERT S., QUESTIONED DoCuMENTs,
Second Edition, Boyd, New York, 1929.2. GODOWN, LINTON, Differentiation and Identifi-
cation of Writing Inks by ChromatographicAnalysis. Unpublished Paper, American Societyof Questioned Documents Examiners, Rochester,New York, 1951.
3. SoMERFoR , ALBERT W., Comparison of WritingInks by Chromatography, IDENTIFICATIONNEWS, 2, p. 4 (April), 1952.
4. GROSS, HANS, CRIMINAL INVESTIGATION, FourthEdition, Sweet & Maxwell, Ltd., London, 1950,p. 297-301.
5. SODERMAN, HARRY, AND O'CONNELL, JOHN J.,MODERN CRIMINAL INVESTIGATION, FourthEdition, Funk & ,Vagnalls Company, NewYork, 1952, p. 445-449.
6. O'HARA, CHARLES E., AND OSTERBURG, JAMES W.,AN INTRODUCTION TO CRIMINALISTICS, Mac-Millan Company, New York, 1949, p. 457-479.
7. FEIGL, FRITZ, SPOT TESTS IN INORGANIC ANALYSIS,Fifth Edition, Elsevier, Amsterdam, 1958, p.479-481.
8. FINN, JOHN, AND CORNISH, ROBERT E., Determina-tion of Age of Inks by the Chloride Method,INDUSTRIAL AND ENGINEERING CHEMISTRY,10, p. 524-525, 1938.
9. GODOWN, LINTON, Report on Experiments onExamination of Ink by Electrophoresis. Un-published Paper, American Society of Ques-tioned Documents Examiners, Chicago, Illi-nois, 1956.
10. CROWN, DAve A., et. al., Differentiation of Ball-Point Pen Inks, JOURNAL OF CRIMINAL LAW,CRIMINOLOGY, AND POLICE SCIENCE, 52, p.338-343, 1961.
11. BROWN, CHARLOTTE, AND KIRK, PAUL L., PaperElectrophoresis in the Identification of WritingInks, JOURNAL OF CRIMINAL LAW, CRIMINOLOGY,AND POLICE SCIENCE, 45, p. 473-480, 1954.
12. SOMERFORD, ALBERT V., Comparison of Writing
Inks by Paper Chromatography, JOURNAL OFCRIMN.AL LAW, CRIMINOLOGY, AND POLICESCIENCE, 43, p. 124-127, 1952.
13. BAILEY, C. F., AND CASEY, ROBERT S., Spectro-photometric Evaluation of the Color of InkMarks on Paper, INDUSTRIAL & ENGINEERINGCHEMISTRY, ANALYTICAL EDITION, 19, p. 1020-1022, 1947.
14. McBAY, ARTHUR J., Chromatographic Methodsof Analysis Applied to Forensic Problems,JOURNAL OF FORENSIC SCIENCES, 3, p. 364-369,1958.
15. BRACEEFT, JAMES W., AND BRADFORD, LOWELLIV., Comparison of Ink Writing on Documentsby Means of Paper Chromatography, JOURNALOF CgUmINAL LAW, CRMINOLOGY, AND POLICESCIENCE, 43, p. 530-539, 1952.
16. BROWN, CHARLOTTE, AND K=UI, PAUL L., Hori-zontal Paper Chromatography in the Identifi-cation of Ball-Point Pen Inks, JoURNAL OFCRIMINAL LAW, CRIMINOLOGY, AND POLICEScIENCE, 45, p. 334-339, 1954.
17. CoLDwELL, B. B., The Comparison of Inks andWritings by Paper Chromatography, ANALYST,80, p. 68-72, 1955.
18. SOUDER, WILMER, AND SMrrH, W. HAROLD, Com-parisons of Writing Inks by Paper Chroma-tography, IDENTI ICATION NEWS, 1, p. 4, 1951.
19. Boscir, K., AND MUELLER, B., To What ExtentCan Ball Pen Inks be Differentiated by PaperChromatography, ARcHiv FUER KRIMNOLOGIE,126, p. 77-86, 1960.
20. DoUD, DONALD, Chromatographic Analysis ofInks, JouRNAL oF FORENSIC SCIENCES, 3,, p.486-492, 1958.
21. LEDERER, EDGAR, AND LEDERER, MICHAEL,CHROMATOGRAPHY, Second Edition, Elsevier,Amsterdam, 1957, p. 115-146.
22. SMITH, IVOR, CHROMATOGRAPHIC AND ELECTRO-PHORETIC TECHNIQUES, Volume II, Zone Elec-trophoresis, William Heinemann Medical Books,Ltd., London, p. 69, 1960.
23. CROWN, DAvm A., Simple Power Sources forElectrophoresis. Paper, American Academy ofForsenic Sciences Annual Meeting, Chicago,Illinois, 1962.
24. MAcDONELL, HERBERT L., Porous Glass Chroma-tography, NATURE, 189, 302, 1961.
25. MAcDoELL, H. L., AND WILLLAmS, J. P., PorousGlass Chromatography Used for the Char-acterization of Water-Soluble Inks, ANALYTICALCHEMISTRY, 33, p. 1552-1554, 1961.
26. MAcDONELL, H. L., Porous Glass Electrophoresis,ANALYTICAL CHEMISTRY, 33, p. 1554-1555,1961.
27. NORDBERG, MARTIN E., Properties of Some Vycor-Brand Glasses, JOURNAL OF THE AMERICANCERAMIC SOCIETY, 27, p. 229-305, 1944.
28. LITTLE, L. H., et al., Infrared Spectra of Chemi-sorbed Molecules, PROCEEDINGS OF THE ROYALSOCIETY, A, 259, p. 242-256, 1960.
29. LITTLE, L. H., et. al., An Infrared Study of theAdsorption of Butenes on Surfaces of PorousVycor Glass, CANADIAN JOURNAL OF CHEMISTRY,39, p. 42-60, 1961.
30. CASEY, ROBERT S., Ink, Writing, ENCYCLOPEDIAOF CHEMICAL TECHNOLOGY, p. 870-877, Inter-science, New York, 1951.
31. BENARIE, MICHAEL M., Chromatography ofMolten Salts on a Glass Powder Column,SCIENCE, 128, p. 1008, 1958.
32. Anon, Glass Paper Aids Chromatography, CHEMI-CAL AND ENGINEERING NEWS, 38, February22, 1960, p. 51.