characterization of u-6nb ingots produced via the electron …/67531/metadc687964/m2/1/high... ·...
TRANSCRIPT

UCRL-JC-129311 PREPRINT
Characterization of U-6Nb Ingots Produced via the Electron Beam Cold Hearth Refining Process
R. H. McKoon
This paper was prepared for submittal to the Electron Beam Melting and Refining State of the Art 1997 Conference
Reno, NV October 5-7,1997
November 14,1997
\
Thisisapreprintofapaperintendedforpublicationina journalorproceedings. Since P changes may be made before publication, this preprint is made available with the understanding that it will not be cited or reproduced without the permission of the author.

DISCLAIMER
This document was prepared as an account of work sponsored by an agency ofthe United States Government. Neither the United States Government nor theUniversity of California nor any of their employees, makes any warranty, expressor implied, or assumes any legal liability or responsibility for the accuracy,completeness, or usefulness of any information, apparatus, product, or processdisclosed, or represents that its use would not infringe privately owned rights.Reference herein to any specific commercial product, process, or service by tradename, trademark, manufacturer, or otherwise, does not necessarily constitute orimply its endorsement, recommendation, or favoring by the United StatesGovernment or the University of California. The views and opinions of authorsexpressed herein do not necessarily state or reflect those of the United StatesGovernment or the University of California, and shall not be used for advertisingor product endorsement purposes.
Characterization of U-6Nb Ingots Produced via the Electron Beam Cold Hearth Refining Process
Robert H. McKoon
Lawrence Livermore National Laboratory Livermore, California 94551
October 15,1997
Report on FY-97 Process Development Program Activity
Abstract A study was undertaken at Lawrence Livermore National Laboratory to
characterize uranium, 6% niobium ingots produced via electron beam melting,
hearth refining and continuous casting and to compare this material with
conventional VIM/skull meit/VAR material. Samples of both the ingot and
feed material were analyzed for niobium and trace metallic elements, carbon,
oxygen and nitrogen. This material was also inspected metallographically and
via microprobe analysis.
Introduction
Since the mid .lUM’s, uranium metal has been fabric,ltcd into a wide variety of parts at the Department of Energy’s Y-12 complex in Oak Ridge, Tennessee. In the case of the uranium-60,) niobium alloy, the reactivity of this material in the liquid .state results in large amounts of non-recyclable scrap and waste being generated during production. Approximately half of this waste is a direct result of producing the alloy and the remaining half results from thermo-mechanical component fabrication processes. The 10~1: yield of the current multi-step flow sheet creates substantial environmental, safety and health liabilities and high cost in the production of these parts.
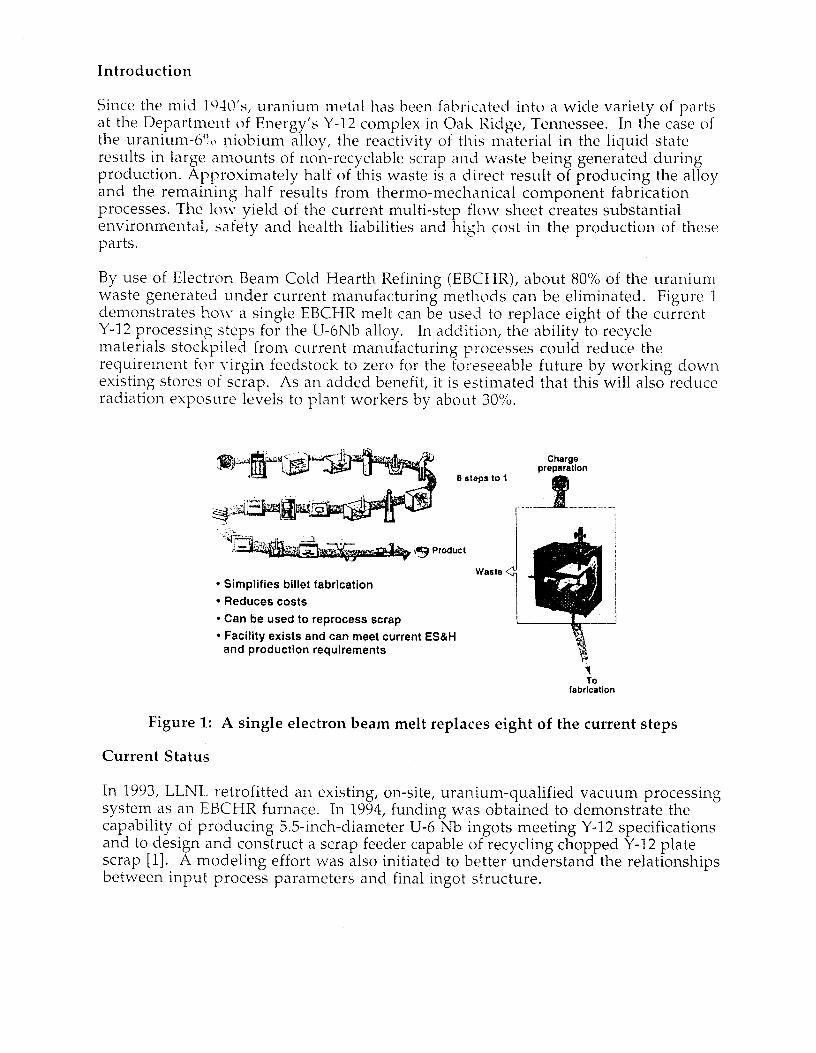
By use of Electron Beam Cold Hearth Refining (EBCHR), about 80% of the uranium waste generated under current manufacturing methods can be eliminated. Figure 1 demonstrates horv a single EBCHR melt can be used to replace eight of the current Y-12 processing steps for the U-6Nb alloy. In addition, the ability to recycle materials stockpiled from current manufacturing processes could reduce the requirement for \-irgin feedstock to zero for the foreseeable future by working down existing stores of scrap. As an added benefit, it is estimated that this will also reduce radiation exposure levels to plant workers by about 30%.
Charge
Wij Product
Waste
l Simplifies billet fabrication
l Reduces costs
l Can be used to reprocess scrap
l Facility exists and can meet current ES&H and production requirements
‘! To
Figure 1: A single electron beam melt replaces eight of the current steps
Current Status
In 1993, LLNL retrofitted an existing, on-site, uranium-qualified vacuum processing system as an EBCHR furnace. In 1994, funding was obtained to demonstrate the capability of producing 5.5-inch-diameter U-6 Nb ingots meeting Y-12 specifications and to design and construct a scrap feeder capable of recycling chopped Y-12 plate scrap [l]. A modeling effort was also initiated to better understand the relationships between input process parameters and final ingot structure.

This facility, shown in Figure 2, is complete and has produced U-6 Nb from both virgin and scrap feedstock which meet Y-12 specifications. In 1996, the furnace was modified to allow the production of 8.25inch diameter ingots which are necessary to meet the requirements of the current Y-12 production flowsheet. Figure 3 shows both the 5.5” and 8.25” diameter ingot product from this EBCHR furnace.
Vat :uum
bratory scrap feeder
de tlds
Figure 2: Experimental e-beam casting system at LLNL
Figure 3: 8.25” and 5.5” diameter U-6Nb ingots

The 1997 effort centered around characterizing the EBCHR produced U-6Nb and comparing it to conventional Vacuum Induction Melted/Skull Melted/Vacuum Arc Remelted (VIM/SM/VAR) material produced at the Y-12 plant. Previous work by Y-12 established the characterization protocol for U-Nb ingots during each stage of the VIM, SM and VAR processing [2] and variations in Nb composition top to bottom and with radial location within the ingot [3]. This current effort attempts to follow these established protocols in characterizing the EBCHR material.
Ingot Production
A full sized 8.25” diameter ingot, 24” long and weighing 315 kg, produced under typical operating conditions was selected for characterization. Raw material for producing this ingot was 100% scrap plate from the Y-12 processing facilities. The plate was nominally .25”-.5” thick and sheared into pieces with a maximum dimension of 3.5” in any direction. The plate was sandblasted at Y-12 to remove loose scale, and was used in the as-received condition at LLNL to produce the ingot. The LLNL EBCHR system utilizes a vibratory feeder to continuously feed this chopped scrap to a refining hearth where it is melted by the electron beam. A light dross forms over the liquid metal in the melt region, presumably from uranium oxides, and possibly silicon oxide from the Y-12 sandblasting, but appears to dissipate in the downstream region of the hearth resulting in a clean, oxide free metal stream being poured from the hearth to the crucible. The mechanism for this dross removal appears to be that the high energy electron beam breaks down the uranium and silicon oxides into higher vapor pressure sub-oxides which are then volatilized.
Total EB power input during the run was held constant at 230 kW and approximately 66% of this power was directed to the refining hearth and 34% to the crucible. The casting rate for this ingot was held fairly constant at -370 kg/hr. as shown in Figure 4. Table 1 shows typical casting rates for VAR systems at the Y-12 plant which have roughly twice the capacity of the current LLNL 250 kW system.
20 /.
Casting Rate-C.43 lnlmln -370 kG/hr
110 110 120 120
Elapsed lima (min) Elapsed lima (min)
Figure 4: Ingot casting rate

Process
VAR EB
Diameter - Length - Melt Rate - in. in. kg/hr
8.25 30 - 40 630-900 8.25 24 300-500
Table 1. Comparison of VAR and EB melting parameters
Characterization Procedures
The procedures used to characterize the EBCHR ingot closely followed the evaluations first devised by Y-12 [2,3] for standard VIM/SM/VAR product. A process flow diagram for these procedures is shown in Figure 5. The characterization efforts were organized into sectioning, wet chemical analysis, interstitial analysis, microprobe analysis and metallography. A somewhat detailed explanation of the procedures used for each of these operations is given below.
Casl ingot Saw cut off top Saw cut Ingot Saw cut hemi- Machine them cut 4 Cut samples for --c& bonomY -3 longitudinally to samples from metallographic Interstitial
hemi-cytinder me 1‘ CllCBS samples analysis
1 1 1 1 1 _ 1 _ Machine oft Cut 1fZ thick Transter five 3” Polish Analyze for center 8 edge slab from shces to storage melallographic cartIon. oxygen. samples heml-cylinder samples nitrogen
Figure 5: Ingot characterization flow sheet
1.0 Sectioning All machining operations were performed using “Trimsol” water soluble lubricant. The following sectioning procedures were used:
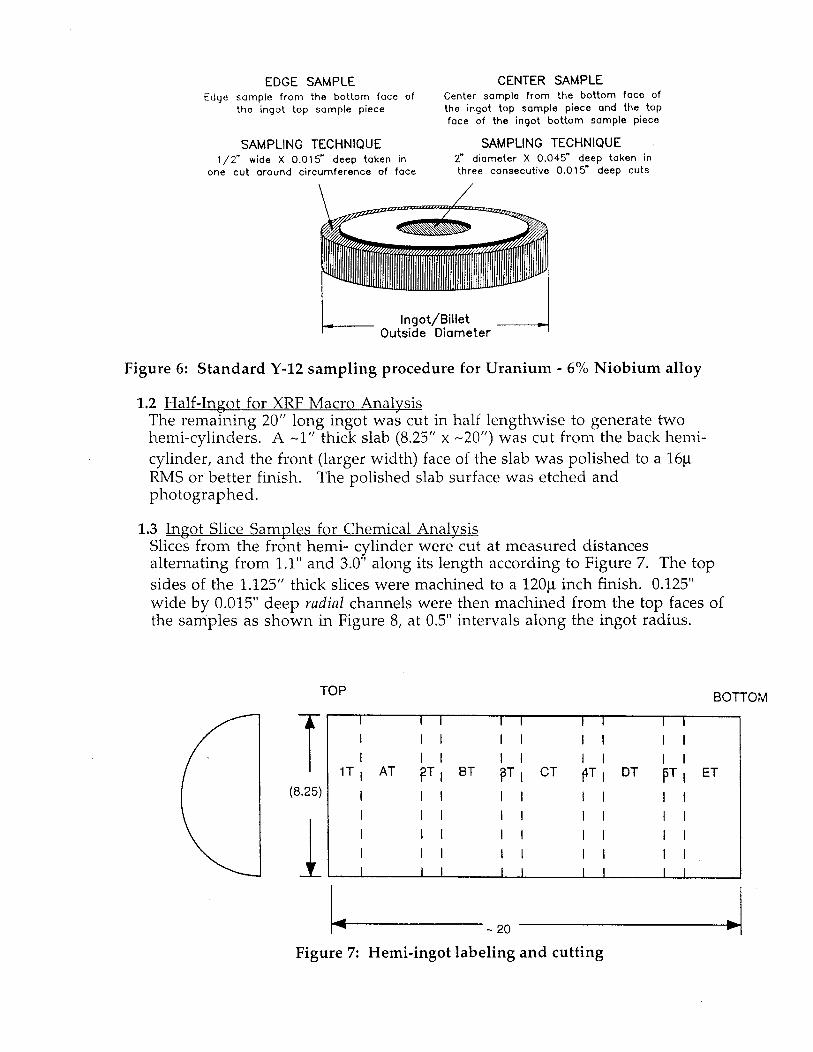
1.1 Top and Bottom of Inpot for Chemical Analysis The top 2” portion and the bottom 2” portion were cut from the ingot. Center and edge samples were obtained from the bottom of the top piece and the top of the bottom piece following standard Y-12 procedures [4] as shown in Figure 6.
EDGE SAMPLE Edge sample from the bottom face of
the ingot top sample piece
CENTER SAMPLE Center sample from the bottom face of the ingot top sample piece and the top face of the ingot bottom sample piece
SAMPLING TECHNIQUE SAMPLING TECHNIQUE l/2” wide X 0.015” deep taken in 2” diameter X 0.045” deep taken in
one cut around circumference of face three consecutive 0.015” deep cuts
Ingot/Billet Outside Diameter
Figure 6: Standard Y-12 sampling procedure for Uranium - 6% Niobium alloy
1.2 Half-Ingot for XRF Macro Analvsis The remaining 20” long ingot was cut in half lengthwise to generate two hemi-cylinders. A -1” thick slab (8.25” x -20”) was cut from the back hemi- cylinder, and the front (larger width) face of the slab was polished to a 16~ RMS or better finish. The polished slab surface was etched and photographed.
1.3 Ingot Slice Samples for Chemical Analvsis Slices from the front hemi- cylinder were cut at measured distances alternating from 1.1” and 3.0” along its length according to Figure 7. The top sides of the 1.125” thick slices were machined to a 120~ inch finish. 0.125” wide by 0.015” deep mdiaf channels were then machined from the top faces of the samples as shown in Figure 8, at 0.5” intervals along the ingot radius.
t
(8.25)
TOP Boll-OM
I I I I 1 I I I I I I I I I I I I I I
lTI AT bT ; BT g, ; CT ;T ; DT IT ; ET
I I I I I I I I I I I I I I I I I I I I I I I I I I I I I I I I I I I I
L-2o 14
Figure 7: Hemi-ingot labeling and cutting

Figure 8: chemistry sample locations
1.4 Carbon/Oxvg;en and Metallographic Samples Four cubes approximately 1” by 1” were cut from each 1” thick slice as shown in Figure 9.
i (Ml) ; (M2) ; (M3) ; (M
(typical)
Figure 9: Ingot slice labeling

2.0 Chemical Analysis
Chemical analysis of the ingot was performed using the following procedures:
2.1 Niobium and Trace Metallics Machine turnings from the top and bottom pieces, and from ingot slices obtained in section 1.3 were analyzed for niobium and trace metallics via Inductively Coupled Plasma - Optical Emission Spectrometry (ICI’-OES) using standard Y-12 analytical procedures [5]. Three samples, approximately 1 gm each, were taken for analysis at each location, All samples were ultrasonically cleaned in detergent and rinsed in Hz0 followed by ethyl alcohol. Chip samples were dissolved in acid and analyzed for uranium, niobium and trace metallics.
2.2 Carbon, Oxvgen and Nitrogen Samples generated in section 1.4 were analyzed for C, 0, and N using standard LECO combustion equipment. Approximately 2mm cubes were cut from the bottom face of each metallography cube using a diamond saw wheel, and electropolished in a solution of 90% acetic, 10% perchloric acid. Samples were etched in 1N HN03 for 1 minute to remove all oxides then rinsed in de- ionized water, dried and immediately stored in acetone until ready for analysis. Typically, analysis was performed within 1 hour of cleaning. Samples were then analyzed for Carbon, Oxygen an Nitrogen.
3.0 Metallography and Microprobe
The 1” cubes generated in section 1.4 were examined for grain size, niobium dendritic microstructure, and carbide and oxide size and distribution using the following procedure:
The top’ face of each l-inch cubes of U-6Nb was polished using established procedures for uranium alloys. Samples were oxidized in room temperature air to bring out structures of interest. Carbide and oxide inclusions, grain size and microstructure were then observed and recorded in digital format. Selected 1” cubes were examined via electron microprobe techniques for niobium variations on a micro scale.
Results
Full ingot slice
A photograph of the ingot slice showing typical U-Nb banding is shown in Figure 10. Banding is a result of solidification dynamics for this particular alloy system and indicate areas of high and low niobium within the ingot on a macro scale. The liquid pool at steady state, as judged from the band profiles is about 1.3” deep compared with a pool depth of around 4”[6] for typical VAR product. EB processing gives the ability to independently vary rate and power input to promote shallow or deep pools as desired for a particular metal. In the case of the U-6Nb alloy, a shallow pool is desired to minimise banding. To promote this desired shallow solidification front, power was input to the ingot as a ring shaped beam directed to the periphery of the ingot only. As a result, banding appears less pronounced in the center of the ingot compared to the edge regions. It should be remembered, however, that this ingot was cast at roughly 2/3 of the nominal VAR rate so that a somewhat shallower pool would be expected. Note also the absence of porosity throughout the ingot. Electron beam hot topping was used to insure a completely sound ingot.

Figure 10: U-6Nb ingot slice showing banding
Ingot top and bottom
Analytical results for the feed material, and the ingot top and bottom (center and edge) for niobium and trace metallic elements are shown below in Table 2. Niobium is within the specified range of 5.2-6.5 percent by weight in the three areas of merit for the Y-12 specification: Top center and edge, and bottom center. As with VAR melted ingots, niobium analysis of the edge sample 2” up from the bottom of the ingot is high. It should also be noted that only 2” of material was removed from top of the EB melted ingot prior to analysis as compared with 4.6” in standard Y-12 melted material[ 71.
Previous Y-12 investigations [S] on purification of uranium by electron beam refining have shown substantial reductions in high vapor pressure metallic impurities after a single electron beam melt. Table 2 shows similar results for this current investigation. Chromium and manganese levels, the two high vapor pressure constituents measured, are preferentially lowered during electron beam processing. The more reactive metals (MO, Ni, Ti and Zr) also appear to be somewhat lower in the ingot than in the feed although it is not clear if this is due to their higher vapor pressures with respect to uranium, or to their reactivity with carbon in the melt to form insoluble metal carbides. Overall, tramp impurities are lowered by EBCHR, resulting in a modest improvement in material purity. While it is known that certain tramp impurities affect corrosion resistance in the U-6Nb system, whether or not EB processing actually produces an improved product remains to be seen. The niobium appears to be slightly enriched compared to the feed, however as will be shown in the next section on niobium distribution within the ingot, this is at odds with results of niobium analysis for the individual ingot slices.

Spec.
Feed
Bottom-edge
Bottom-center
Top-edge
Top-center
Nb Al Cr Mn MO Ni Ti Zr 5.2-6.5” 75 7s 75 75 500
6.09 0 23 14 16 20 61 31
6.87 0 7 2 2 18 73 18
6.28 0 7 4 6 14 61 16
6.31 0 15 8 18 15 56 22
6.18 0 26 4 8 20 66 22
* The Y-12 specification [4] calls for niobium analysis of the top center and edge and the bottom center only.
Table 2. Ingot top and bottom analysis
Niobium distribution
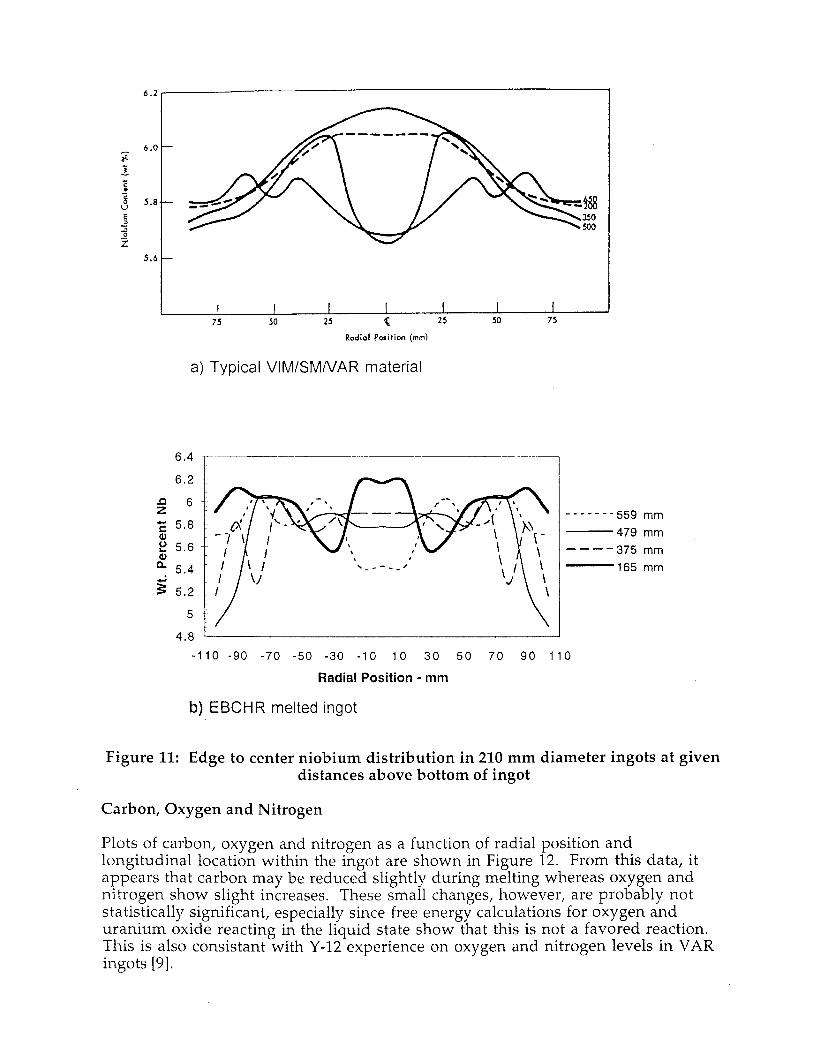
Niobium distribution as a function of both radial position and top to bottom location within the ingot are shown in Figure 11 for both the typical VIM/ SM/ VAR material and the EBCHR material. From these curves, it can be seen that in both cases, niobium tends to be higher in the center of the ingot near the bottom of the ingot whereas toward the top of the ingot, the situation reverses and niobium is lower in the center. Various theories have been put forth in the literature for the solidification patterns seen in this alloy, some of which imply that judicious programming of the electron beam on the ingot during casting may lead to more optimal ingot structures. For this particular set of casting conditions, however, EBCHR appears to produce a product comparable to the standard Y-12 material.
I 75
I 50
I I I I I 25 e 25 50 75
Radial Politica (mm)
a) Typical VIMISMIVAR material
6.4 r-
- -7
6.2 +
i? 6
-------559 mm
-479 mm
----375 mm
165 mm
4.8 ' I
-110 -90 -70 -50 -30 -10 10 30 50 70 90 110
Radial Position - mm
b) EBCHR melted ingot
Figure 11: Edge to center niobium distribution in 210 mm diameter ingots at given distances above bottom of ingot
Carbon, Oxygen and Nitrogen
Plots of carbon, oxygen and nitrogen as a function of radial position and longitudinal location within the ingot are shown in Figure 12. From this data, it appears that carbon may be reduced slightly during melting whereas oxygen and nitrogen show slight increases. These small changes, however, are probably not statistically significant, especially since free energy calculations for oxygen and uranium oxide reacting in the liquid state show that this is not a favored reaction. This is also consistant with Y-12 experience on oxygen and nitrogen levels in VAR ingots [9].

E g 50 +-‘Starting g 40 ---+-Ml
$ 30 mm- ---M2
0 20 : M3 ‘.-
-+X---M4 10
0
5T
a) Carbon
60 E “p 50
$ 40 m $30 0.
20
IO
0
W Oxygen
Sample Position
_f_ Starting
--H--Ml _-- ---M2
M3
+M4
5T 4T 3T
Sample Position
2T 1T
10 --
0 i
5T
c) Nitrogen 4T 3T
Sample Positon
2T 1T
Figure 12: Interstitial element levels in EBCHR ingot

Metallography
Metallographically, the material appears similar to the baseline Y-12 U-6Nb. Grain size, center to edge, and distribution and size of inclusions appear typical of,the VIM/ SM/VAR material. The material appears free of major inclusions and voids. Figure 13 is a typical metallographic photo showing that carbides are randomly distributed and all below 20 microns in size.
Figure 13: Metallographic photo

Microprobe analysis
A plot of electron microprobe scans of both the VIM/ SM/ VAR and the EBCHR material is shown in Figure 14. As expected, since the interdendritic coring giving rise to these micro-variations are a function of the particular alloy system r,ather than processing conditions, the EBCHR material looks very similar to the standard VIM/SM/VAR material [lo].
8
3
2 ~ll~~~~~~.i..,~...‘.I,“““‘~~ LLNL 1
0 500 1000 1500 Distance (pm)
Figure 14: Macrosegregation in U-6Nb ingots
Discussion
This EBCHR ingot produced from 100% recycled scrap plate appears to be comparable to the standard Y-12 product in all areas studied. Gross segregation (top- bottom) is comparable. Macro-segregation (banding) of the EBCHR material appears to be slightly less distinct than in the standard Y-12 material. Micro-segregation (dendritic coring) is same as for the Y-12 material. Carbon, oxygen and nitrogen appear to be unchanged by EB processing, whereas in the Y-12 material, carbon is increased by about 50 ppm with each melt. The slight differences seen between Y-12 reported results and LLNL reported results probably have more to do with differences in analytical equipment and techniques between the two institutions than in actual variations in ingot chemistries.

0ne of the limitations in electron beam processin g is maintaining correct chemistry when melting alloys. Higher vapor pressure metallic constituants tend to be preferrentially evaporated and are depleted in the final ingot. Both uranium and niobium, however, have very low vapor pressures at processing temperatures and evaporatiLre losses during electron beam melting of U-6Nb are quite 101~ - typically less than 0.5% in the LLNL furnace. Gross ingot chemistry, therefore, is strictly dependant upon the chemistry of the feed stream. Moreover, the only losses in the process are croppings from the ingot top and bottom, which, because EBCHR is a non-contaminating process, can be recycled indefinitly.
This study has shown that a single EBCHR melt can produce uranium 6% niobium ingot material meeting current specifications and which appears comparable to the baseline, triple melted material. The technolog), development phase of this project is considered to be complete, and the process is no\v ready to be transferred to the Y- 12 production facility where further characterization and statistical comparisons will need to be made prior to final certification of the process. With the current reduced le\,el of parts needed, and an approximate capital investment of $2.5 M needed to install an EBCHR facility at Y-12 hoMTever, there is no plan to replace Y-12 baseline in the foreseeable future. Components are at present being fabricated from EBCHR ingot material, and will be e\raluated o\rer the course of the coming year.
This work was performed under the auspices of the U.S. Department of Energy by Lawrence Livermore National Laboratory under contract No. W-7405-Eng-48.

References
1.
2.
3.
4.
5.
6.
7.
8.
9.
R. H. McKoon, “Progress toward uranium scrap recycling via EBCHR,” UCRL- JC-118173, October 1994.
L. R. Chapman, “Metallurgical Characterization of Vacuum-Induction-Melted, Skull-Arc-Melted and Vacuum-Arc-Remelted Uranium-Niobium Alloy Castings,” Y-12 Development Division Technical Progress Report, Y-2414-3, pages 91-140, September 1989.
J. G. Banker, H. L. Wigginton, “Niobium Segregation in Uranium-6 Niobium Ingots, U-6Nb Alloy Progress Report, Y-12 document number Y/DA-7602, pages 16-23, March 1977.
Material specification, “Depleted Uranium - 6 wt.% Niobium Alloy”, Y-12 document number 00-M-200, September, 1992.
“Determination of Niobium, Yttrium, and Zirconium in Uranium/b% Niobium Alloy By Inductively Coupled Plasma-Optical Emission Spectrometry (ICI’-OES)“, Y-12 Analytical Operating Procedure Y/P65-0013 rev. B, December, 1993.
P. S. Lewis, Jr. “Uranium-6 Weight Percent Niobium Alloy Double Vacuum Arc Refining Melting”, Y-12 Development Division Technical Progress Report Y-2302-3, pages 85-103, August, 1982.
W. G. Reis, H. L. Wigginton, E. K. Beeler, S. E. Stinnette, M. A. Taylor, “Increasing the Material Utilization of 203.2-mm-Diameter Uranium-6 wt%
Niobium Alloy Ingots”, Y-12 Development Division Technical Progress Report Y-2336-3, pages 58-63, August, 1985.
G. L. Powell, A. L. Williamson, J. J. Dillon, J. B. Soward, “Electron-Beam Melting of Mulberry and Uranium”, Y-12 report Y/AJ-169, November 19, 1976.
P. S. Lewis, Jr. “Gas Analyses of Uranium-6 Weight Percent Niobium Alloy”, Y- 12 Development Division Technical Progress Report Y-2304-3, page 58-62, December, 1982.
10. W. B. Snyder, Jr, “Homogenization of Arc-Melted Uranium-6 Weight Percent Niobium Alloy Ingots, Y-12 report number Y-2102, January, 1978.

Technical Inform
ation Departm
ent • Lawrence Liverm
ore National Laboratory
University of C
alifornia • Livermore, C
alifornia 94551