chemical engineering...1 abstract nanoscale metals and semiconductors for the storage of solar...
TRANSCRIPT

Nanoscale metals and semiconductors for the storage of solar energy in chemical bonds
By
Karthish Manthiram
A dissertation submitted in partial satisfaction of the
requirements for the degree of
Doctor of Philosophy
in
Chemical Engineering
in the
Graduate Division
Of the
University of California, Berkeley
Committee in charge:
Professor A. Paul Alivisatos, Co-Chair
Professor Roya Maboudian, Co-Chair
Professor Nitash Balsara
Professor Tanja Cuk
Summer 2015

Nanoscale metals and semiconductors for the storage of solar energy in chemical bonds
Copyright 2015
By
Karthish Manthiram

1
Abstract
Nanoscale metals and semiconductors for the storage of solar energy in chemical bonds
By
Karthish Manthiram
Doctor of Philosophy in Chemical Engineering
University of California, Berkeley
Professor A. Paul Alivisatos, Co-Chair
Professor Roya Maboudian, Co-Chair
The transduction of electrical energy into chemical bonds represents one potential
strategy for storing energy derived from intermittent sources such as solar and wind.
Driving the electrochemical reduction of carbon dioxide using light requires (1)
developing light absorbers which convert photons into electron-hole pairs and (2)
catalysts which utilize these electrons and holes to reduce carbon dioxide and oxidize
water, respectively. For both the light absorbers and catalysts, the use of nanoscale
particles is advantageous, as charge transport length scales are minimized in the case of
nanoscale light absorbers and catalytic surface-area-to-volume ratio is maximized for
nanoscale catalysts. In many cases, although semiconductors and metals in the form of
thin films and foils are increasingly well-characterized as photoabsorbers and
electrocatalysts for carbon dioxide reduction, respectively, the properties of their
nanoscale counterparts remain poorly understood.
This dissertation explores the nature of the light absorption mode of non-stoichiometric
semiconductors which are utilized as light absorbers and the development of catalysts
with enhanced stability, activity, and selectivity for carbon dioxide reduction. Chapter 1
provides an overview of the state of development of methods of transducing the energy of
photons into chemical bonds.
Chapters 2 and 3 investigate the development of stable, active, and selective catalysts for
the electrochemical reduction of carbon dioxide. Chapter 2 examines how copper
nanoparticles have enhanced activities and selectivities for methanation compared to
copper foils. Chapter 3 focuses on the development of strategies to stabilize high-surface-
area catalysts to prevent surface area loss during electrochemical carbon dioxide
reduction.
Chapters 4 and 5 entail a fundamental understanding of the light absorption mode of
nanoscale photoabsorbers used in both photoelectrochemical cells and in photovoltaics.
Chapter 4 focuses on the nature of the light absorption mode of non-stoichiometric
tungsten oxide, a material which has been explored as a photoanode for the photon driven

2
oxidation of water. Chapter 5 examines the tunability of the light absorption mode of
nanoscale copper sulfide, a material which has been explored as a photoabsorber for
photovoltaics. An understanding of the light absorption mode of non-stoichiometric
oxides and sulfides at the nanoscale is critical for the use of these materials in redox
active environments.

i
Dedicated to my loving parents and sister.

ii
Table of Contents
List of Figures ......................................................................................................................v
List of Tables ................................................................................................................... viii
Acknowledgements ............................................................................................................ ix
Chapter 1. Introduction: Synthesis of fuels and feedstocks using solar energy ...........1
1.1 Mitigating carbon dioxide emissions ................................................................1
1.2 Chemical reactions involved in the reduction of carbon dioxide .....................2
1.3 Light harvesting for solar-driven chemical conversion of carbon dioxide ...3
1.4 Challenges associated with solar-driven electrochemical reduction of carbon
dioxide .....................................................................................................................5
1.4.1 Activity, selectivity, and stability of nanoscale metals for
electrochemical carbon dioxide reduction ..................................................5
1.4.2 Impact of non-stoichiometry of semiconductors used in
photoelectrochemical cells and photovoltaics on their light absorption
properties .....................................................................................................6
1.5 References ..........................................................................................................8
Chapter 2. Enhanced electrochemical methanation of carbon dioxide with a
dispersible nanoscale copper catalyst.............................................................................10
2.1 Single-step reduction of carbon dioxide to methane........................................10
2.2 Limitations of existing catalysts .....................................................................11
2.3 Morphological evolution .................................................................................10
2.4 Catalytic behavior ...........................................................................................12
2.5 Continuum from nanoparticle-like to foil-like behavior .................................15
2.6 Mechanism of CO2 reduction ..........................................................................17
2.7 Conclusion ......................................................................................................20

iii
2.8 References ........................................................................................................20
Chapter 3. Dendritic assembly of gold nanoparticles during fuel-forming
electrocatalysis .................................................................................................................23
3.1 Factors contributing to loss of nanoparticle catalyst surface area during
electrocatalysis ......................................................................................................23
3.2 Experimentally-observed dendritic assembly of nanoparticles during
electrocatalysis ......................................................................................................24
3.3 Random walk simulations of dendritic assembly of nanoparticles .................25
3.4 Impact of electrode potential and electrolyte on dendritic assembly ...............28
3.5 Assembly of nanoparticles embedded in practical catalyst architectures .......30
3.6 Conclusion .......................................................................................................30
3.7 References .......................................................................................................31
Chapter 4. Tunable localized surface plasmon resonances in tungsten oxide
nanocrystals ......................................................................................................................33
4.1 Free charge-carriers confined in nanoscale transition metal oxides ...............33
4.2 Polaronic and plasmonic absorption in tungsten oxide ...................................34
4.3 Synthesis of structural characterization of tungsten oxide nanorods ..............34
4.4 Optical characterization of tungsten oxide nanorods ......................................35
4.5 Tunability of plasmon mode of tungsten oxide nanorods ...............................38
4.6 Conclusion ......................................................................................................39
4.7 References ........................................................................................................39
Chapter 5. Redox tunability of the plasmonic mode of copper sulfide nanocrystals 42
5.1 Conventional plasmonic sensing through changes in refractive index ...........42
5.2 Semiconductor plasmons for sensing local chemical events via changes in
carrier concentration .............................................................................................42
iv
5.3 Copper sulfide nanorods offer improved plasmonic tunability compared to
metals ....................................................................................................................43
5.4. Chemistry of copper vacancies in copper sulfide ..........................................43
5.5. Ligand and redox mediated tuning of copper sulfide plasmons ....................44
5.6 Sensing copper extraction via increase in plasmon energy ............................44
5.7 Sensing copper insertion via decrease in plasmon energy ..............................46
5.8 Electrical measurements confirm carrier behavior .........................................48
5.9 Sensing of single chemical events using semiconductor plasmons ................49
5.10 Conclusion ....................................................................................................50
5.11 References ......................................................................................................50
Appendix ..........................................................................................................................53
A.1 Supporting information for enhanced electrochemical methanation of carbon
dioxide with a dispersible nanoscale copper catalyst ...........................................53
A.2. Supporting information for dendritic assembly of gold nanoparticles during
fuel-forming electrocatalysis ................................................................................59
A.3 Supporting information for tunable localized surface plasmon resonances in
tungsten oxide nanocrystals ..................................................................................69
A.4 Supporting information for redox tunability of the plasmonic mode of copper
sulfide nanocrystals ...............................................................................................73
A.5 References ......................................................................................................79

v
List of Figures
Figure 1.1. Historical and projected United States energy consumption ............................2
Figure 1.2. Motion of charge carriers in a photoelectrochemical cell ................................4
Figure 1.3. Electrolyzer for converting water and carbon dioxide into methane and
oxygen .................................................................................................................................5
Figure 1.4. Product distribution of various metal foils for electrochemical CO2 reduction
..............................................................................................................................................6
Figure 1.5. Architectures for electrolyzers .........................................................................7
Figure 2.1. Morphological evolution of copper nanoparticles during the course of
electrochemical CO2 reduction .........................................................................................13
Figure 2.2. Comparison of current densities and Faradaic efficiencies for n-Cu/C and
copper foil electrodes ........................................................................................................14
Figure 2.3. Stability of the n-Cu/C and copper foil catalysts ............................................15
Figure 2.4. Continuum of catalytic behavior between nanoparticle-like and foil-like
electrodes ..........................................................................................................................16
Figure 2.5. Mechanistic insights from Tafel analysis .......................................................18
Figure 3.1. SEM and TEM of gold nanoparticles supported on glassy carbon ................25
Figure 3.2. Random walk simulations of dendrite formation ...........................................27
Figure 3.3. Impact of electrode potential on dendritic assembly ......................................28
Figure 3.4. Impact of pH and ionic strength on dendritic assembly .................................29
Figure 3.5. Comparison of model system and practical electrode ....................................30
Figure 4.1. Morphology and structure of tungsten oxide nanorods ...................................35
Figure 4.2. Optical absorption of tungsten oxide nanorods ..............................................37
Figure 4.3. Tunability of optical absorption .....................................................................38
Figure 5.1. Chemical sensitivity of copper (I) sulfide ......................................................44

vi
Figure 5.2. LSPR detection of vacancies formed in copper (I) sulfide nanorods by means
of ligands or common oxidants .........................................................................................45
Figure 5.3. LSPR detection of vacancy filling in copper (I) sulfide nanorods .................47
Figure 5.4. Reversible formation and filling of vacancies in copper (I) sulfide nanorod
films probed electrically ...................................................................................................49
Figure A.1.1. SEM of n-Cu/C electrode following polarization .......................................55
Figure A.1.2. Normalized current for n-Cu/C and copper foil .........................................55
Figure A.1.3. Methanation current density as a function of concentration of sodium
bicarbonate buffer .............................................................................................................56
Figure A.1.4. Faradaic efficiencies for CH4, H2, CO, and C2H4 on n-Cu/C ......................57
Figure A.2.1. Current density versus time for dodecanethiol-capped gold nanoparticles
polarized to -1.2 V in 0.1 M NaHCO3 buffer ....................................................................61
Figure A.2.2. Current density versus time for dodecanethiol-capped gold nanoparticles
polarized to -1.2 V in 0.1 and 0.5 M KOH ........................................................................62
Figure A.2.3. Steady-state geometric current density versus potential ..............................63
Figure A.2.4. XPS of gold nanoparticles on glassy carbon ...............................................65
Figure A.2.5. XPS survey of gold nanoparticles on glassy carbon ...................................66
Figure A.2.6. SEMs of dendrites produced from dodecanethiol-capped and
dodecylamine-capped gold nanoparticles .........................................................................69
Figure A.3.1. Calculated absorption of tungsten oxide nanorods ......................................70
Figure A.3.2. HRTEM of tungsten oxide nanorods ..........................................................71
Figure A.3.3. Length and width distributions of tungsten oxide nanorods ........................72
Figure A.4.1. TEM images before and after copper extraction and insertion ...................74
Figure A.4.2. Gate transconductance for a copper (I) sulfide nanorod film FET .............75
Figure A.4.3. Formation of copper iodide and copper amine complex ............................76
Figure A.4.4. Reversibility of LSPR absorption ...............................................................77

vii
Figure A.4.5. Effect of copper oxide shell on LSPR spectra of copper(I) sulfide nanorods.
............................................................................................................................................78

viii
List of Tables
Table A.1.1. Alternative mechanisms for the early steps of CO2 reduction .....................58

ix
Acknowledgements
My adviser has always reminded us that graduate school is a very personal journey in
which we each make discoveries that lead to our personal development. I cannot imagine
a better guide on this journey than my own adviser. Paul places an enormous amount of
trust in every graduate student by treating us as colleagues in full, providing each of us
with the intellectual freedom and space that we need to grow on this journey. While
giving us this freedom, he still continues to invest significant time into each student to
assist them in learning how to ask the right questions. He has a rare style of patient
curiosity and a unique ability to drive Socratic dialogue that I can only strive to emulate.
I have much gratitude for my committee members Roya Maboudian, Nitash Balsara, and
Tanja Cuk, who have always made themselves available and engaged with me in many
scientific discussions. Several of my mentors have gone far beyond what anyone could
expect of any mentor to help me on this journey. Yi Cui taught me the power of sharing
one’s enthusiasm for science – we do our best work when we are happy. Prashant Jain
showed me how to break down a complex problem into simple, addressable questions
that can be tackled day-to-day. Yogi Surendranath shared with me his love for
electrochemistry and displayed an inquisitiveness that drove all around him to be more
discerning scientists. Rachel Segalman showed me that making an investment of time in
developing one’s scientific talent requires an investment in them as a person.
The Alivisatos group has a wonderful, collaborative environment that I benefited from
enormously. I would like to thank our group administrator Negest Williams for all her
support and for promptly taking care of all our questions and concerns; we are truly lucky
to have an administrator who cares so deeply about the well-being of the group.
During nearly the past decade in the Bay Area, I have had the fortune of making several
friends that are like family. In addition to several of the mentors I mentioned above, I
would especially like to thank Brandon Beberwyck, Anton Dam, Khang Dinh, Danny
Hellebusch, Boris Russ, and Genia Vogman for their support and thoughtfulness as
friends. They epitomize what it means to be selfless in friendship.
My parents and sister have done more to mold me than anyone else. My mom has an
unparalleled ability to make all around her feel cherished and precious. My mom taught
me the joy of working with my hands and we have always made a great team for building
new things. My mom and dad showed me by example that one’s intrinsic skills mean
little without clarity of mind and an ability to get things done through hard work. My dad
taught me the importance of freedom of thought and how important it is to love what you
do everyday such that it blurs the lines of work and hobby. My sister, who is rare in how
much she cared for me as a little brother, taught me the joy of imparting knowledge and
engaging in creative thought. From a young age, she enthusiastically taught me a wide
range of subjects and invented exciting games for us to play. I am lucky that the three
people that I most want to be like I have had at my side since I was born: my mom, dad,
and sister. I hope that I can give back to them even a small amount of the joy of living
they have given me.

1
Chapter 1.
Introduction: Synthesis of fuels and feedstocks using solar energy
The solar-driven electrochemical synthesis of hydrocarbons fuels and chemical
feedstocks from carbon dioxide represents one potential strategy for mitigating carbon
dioxide emissions. This strategy can allow for the utilization of existing infrastructure for
the distribution and consumption of electrosynthesized products. We provide an overview
of the projected need for mitigating carbon dioxide emissions, reactions involved in
chemically reducing carbon dioxide via thermochemical and electrochemical routes, and
strategies for driving electrochemical CO2 reduction via solar energy, through integrated
photoelectrochemical cells and photovoltaics linked to electrolyzers. We conclude with
an overview of the challenges addressed in this dissertation, including (1) understanding
the stability, selectivity, and activity of nanoscale metals used to catalyze electrochemical
CO2 reduction and (2) understanding the light absorption modes of non-stoichiometric
semiconductors used in photoelectrochemical cells and photovoltaics.
1.1. Mitigating carbon dioxide emissions
Even with increasing use of energy sources which do not emit carbon dioxide in the
United States, it is projected that use of carbon dioxide emitting sources of energy will
continue to increase in the decades to come (Figure 1.1). At present, approximately 80
quadrillion BTUs of domestic energy consumption are from carbon dioxide emitting
sources, such as natural gas, coal, and petroleum, while only 16 quadrillion BTUs are
from sources which do not emit carbon dioxide, including biofuels, solar, and wind; by
2040, it is projected that these numbers will increase to 86 and 20 quadrillion BTUs,
respectively.1 In large part, the increased use of energy sources which emit carbon
dioxide is driven by improved domestic availability of natural gas.
Hence, even with increasing penetration of clean energy sources, there will still be a need
to contend with significant CO2 generation, which will contribute to global warming if
emitted.2 There are numerous strategies that one may consider to prevent generated CO2
from being emitted, which generally fall into two categories: (1) methods of effectively
removing the carbon dioxide from the global carbon cycle and (2) methods of closing the
carbon cycle by converting the carbon dioxide into fuels. The former could involve
sequestration of carbon dioxide by injection into underground reservoirs3 or chemical
conversion of carbon dioxide into plastics such as polyethylene. The latter could involve
chemical conversion of carbon dioxide into hydrocarbon fuels, which when later burned,
emit carbon dioxide that was originally captured. The chemical conversion of carbon
dioxide4 is attractive because if done in an efficient manner, it could present a route to
mitigate CO2 emissions while producing useful products.

2
Figure 1.1. Historical and projected United States energy consumption. Energy
consumption is categorized based on whether it is from CO2 emitting sources or non-CO2
emitting sources, using data tabulated by the Energy Information Administration.1
1.2. Chemical reactions involved in the reduction of carbon dioxide
There are a variety of thermochemical routes for reducing carbon dioxide, including the
reverse water-gas shift for reducing CO2 to CO and the Sabatier process for reducing CO2
to methane. The reverse water-gas shift reaction involves reacting carbon dioxide and
hydrogen over a copper on alumina catalyst at temperatures above 500 K:
CO2 + H2 → CO + H2O (1.1)
The generated CO can then be utilized for the synthesis of a wide range of industrial
feedstocks, including alcohols, aldehydes, and hydrocarbons. Alternatively, the CO2 may
also be thermochemically reduced to more reduced products, such as methane. The
Sabatier process5 involves thermochemical reduction of carbon dioxide using hydrogen
over a nickel catalyst at temperatures above 550 K to generate methane:
CO2 + 4 H2 → CH4 + 2 H2O (1.2)
The vast majority of hydrogen is currently derived from steam reforming of methane (eq.
1.3) and the water-gas shift reaction6 (eq. 1.4):
CH4 + H2O → CO + 3H2 (1.3)
CO + H2O → CO2 + H2 (1.4)
3
If hydrogen derived from the above process were used for CO2 reduction, this would
defeat the purpose of mitigating CO2 emissions since there is no useful net conversion.
Instead, it is necessary to produce the hydrogen through splitting water, which can be
achieved via thermochemical and electrochemical routes.7 Electrochemical routes are
appealing because they can be conducted at low temperatures that impose less severe
materials requirements compared to thermochemical routes.
The electrochemical water splitting reaction consists of two half-reactions: oxygen
evolution (eq. 1.5) and hydrogen evolution (eq. 1.6). The overall reaction (eq. 1.7)
requires input of 237 kJ/mol of water.8
H2O → ½ O2 + 2e- +2H+ (1.5)
2H+ + 2e- → H2 (1.6)
H2O → H2 + ½ O2 (1.7)
This two-step process involving electrochemical generation of hydrogen followed by
thermochemical reduction of CO2 to CH4 in the Sabatier process is practiced at a pilot
plant in Germany at the 6 MW scale.9 An alternative to the two-step route described
above is to directly, electrochemically reduce the carbon dioxide at the surface of an
electrode, to products such as CO (eq. 1.8) and CH4 (eq. 1.9):
CO2 + 2e- +2H+ → CO + H2O (1.8)
CO2 + 8e- +8H+ → CH4 + 2H2O (1.9)
These cathodic reactions are coupled to the oxygen evolution reaction (eq. 1.5) at the
anode. The direct electrochemical reduction of carbon dioxide is of interest because
fewer unit operations are required compared to the two-step process.
Of the various target products, it may appear that methane is the least attractive given the
increased domestic availability of natural gas.1 Methane is the simplest hydrocarbon
product; once an understanding of routes which can lead to its efficient synthesis are
developed, then routes to more complex, energy-dense fuels can be devised. In addition,
if methane does eventually become the energy carrier of choice, there exists significant
infrastructure for the distribution and consumption of natural gas.
1.3. Light harvesting for solar-driven chemical conversion of carbon
dioxide
Because the conversion of carbon dioxide into fuels is thermodynamically uphill, input of
energy is required. Since the core motivation for this conversion is the mitigation of
carbon dioxide emissions, it is essential that the process be driven by a source of energy
which does not lead to carbon dioxide emissions, such as solar. Nature has developed

4
robust reaction pathways, collectively known as photosynthesis, for storing the energy
delivered by sunlight in chemical fuels. The simplest inorganic analogue of
photosynthesis is a semiconductor which absorbs sunlight to generate electron-hole pairs
that are consumed by two electrochemical half reactions to form a fuel of interest.10 The
light absorption process and the electrochemical reactions may either be integrated on a
single device, known as a photoelectrochemical cell, or conducted on separate devices,
with a photovoltaic cell connected to an electrolyzer.11
A photoelectrochemical cell conducts both the light absorption and electrochemical fuel
synthesis processes. The two half reactions may be driven by the same semiconductor if
the valence and conduction bands are sufficiently oxidizing and reducing, respectively.
However, this has the consequence that the bandgap must be very large, leading to poor
absorption of visible light. To overcome this limitation, the two half reactions are often
conducted on separate semiconductors referred to as the photoanode, where the oxidation
reaction occurs, and the photocathode, where the reduction reaction occurs (Figure 1.2).12
Figure 1.2. Motion of charge carriers in a photoelectrochemical cell. Both the
photoanode and photocathode each absorb a photon (hv), leading to the generation of two
electron-hole (e--h+) pairs. The conduction band (CB) electron in the photoanode is
annihilated by the valence band (VB) hole in the photocathode. The hole in the
photoanode and electron in the photocathode participate in the electrochemical half
reactions of interest.
An alternative approach is to utilize separate photovoltaic cells and electrolyzers (Figure
1.3).13 In this method, electricity generation and fuel synthesis occur in separate devices
which alleviate many of the concurrent materials constraints that exist in an integrated
photoelectrochemical device. In addition, the power may be conditioned between the
photovoltaic and the electrolyzer to achieve the current and potential which provide the
desired selectivity for the electrochemical process.

5
Figure 1.3. Electrolyzer for converting water and carbon dioxide into methane and
oxygen. The electrolyzer contains a membrane electrode assembly, consisting of an
anode and cathode on either side of a membrane. Water is oxidized at the anode,
liberating protons, which traverse the membrane, and electrons, which pass through the
external circuit and are raised in chemical potential by a potentiostat. The electrons and
protons react with CO2 at the cathode, producing methane and water. The thermodynamic
potential difference for the anodic and cathodic reactions is 1.06 V, leading to storage of
818 kJ/mol of methane.
1.4. Challenges associated with solar-driven electrochemical reduction
of carbon dioxide
In this dissertation, we address challenges associated both with the development of (1)
nanoscale metals for electrochemical CO2 reduction and (2) light absorbers for
photoelectrochemical cells and photovoltaics.
1.4.1. Activity, selectivity, and stability of nanoscale metals for
electrochemical carbon dioxide reduction
The vast majority of research on electrochemical carbon dioxide reduction has been
conducted on foil cathodes, leading to in-depth understanding of their product
distributions (Figure 1.4).14–16 Because CO2 is electrochemically reduced from an
aqueous solution that serves as the source of protons, hydrogen evolution is a competing
reaction at the potentials at which CO2 reduction occurs. For this reason, metals which
have relatively low hydrogen evolution reaction overpotentials and high adsorbate
binding energies, such as titanium, iron, nickel, and platinum, predominantly evolve
hydrogen and very little CO2 is reduced at their surface; the small amount of CO2 that is
reduced at their surface is converted to CO which poisons many of the active sites.17 On
the other hand, metals with high hydrogen evolution reaction overpotential and low
adsorbate binding energies, such as cadmium, indium, tin, mercury, tantalum, lead, and
bismuth, are effective at outer-sphere reduction of carbon dioxide to produce formic acid.
Metals with intermediate hydrogen evolution reaction overpotentials and adsorbate

6
binding energies, such as zinc, gallium, palladium, silver, and gold, reduce CO2 to CO;
the CO is bound strongly enough that it is stabilized as a product but weakly enough that
it desorbs rather than being further reduced. Copper has a slightly higher CO binding
enthalpy compared to these metals that evolve CO as a terminal product, such that the CO
is also further reduced; the product distribution is a mixture of CO, CH4, C2H4, HCOO-,
and H2.17
Figure 1.4. Product distribution of various metal foils for electrochemical CO2
reduction. Copper is unique in its ability to produce hydrocarbon products but with poor
selectivity for any single product.14
Although foils are a useful architecture for benchmarking a wide range of metals,
practical electrolyzers require dispersible, high surface area catalysts; the high surface
areas enable high current densities per unit geometric area and the use of a dispersible
material allows for the catalyst to be incorporated into a gas-diffusion-layer and deposited
on either side of a membrane in order to minimize the ionic resistance (Figure 1.5).18,19 In
a gas diffusion layer, it is difficult to deconvolute kinetic and transport limitations since
the catalysts are embedded within an electrically and ionically conductive matrix. As a
result, we utilize a model system for dispersible catalysts in which the catalysts are
deposited in a monolayer on the surface of a glassy carbon electrode, which provides a
uniformly accessible catalytic surface.

7
Figure 1.5. Architectures for electrolyzers. Transitioning from foil based electrodes to
high surface area, dispersible catalysts incorporated into a membrane electrode assembly,
will enable high current densities and minimize ionic resistance.
In Chapter 2, we investigate how the activity and selectivity of copper nanoparticles
differ from copper foils for electrochemical carbon dioxide reduction. In Chapter 3, we
study the stability of gold nanoparticles during electrochemical CO2 reduction and
develop a mechanism to explain how gold nanoparticles lose surface area during
electrochemical CO2 reduction. Altogether, these studies represent a first step towards
integrating highly dispersed catalysts into practical electrolyzers for CO2 reduction.
1.4.2. Impact of non-stoichiometry of semiconductors used in
photoelectrochemical cells and photovoltaics on their light absorption
properties
Despite the apparent simplicity of the inorganic photocatalytic scheme (Figure 1.2),
nature’s photosynthetic scheme excels as a method of energy harvesting because of its
scalability and operational robustness.20 Current inorganic schemes are not scalable due
to high costs, as particular materials exhibit either poor photostability, contain expensive
raw materials, or are inefficient. The vast majority of investigations of photocatalysts
have been conducted on transition-metal oxides (TMOs), as many TMOs exhibit
excellent photostability.21 However, TMOs tend to have large bandgaps which limit
visible light absorption, leading to low external quantum efficiency.22 For instance, the
first material identified for semiconductor photocatalysis, TiO2, has excellent
photostability and can be produced cheaply, but it has a very low external quantum
efficiency for conversion of sunlight into a chemical fuel because it has a large bandgap
(3.2 eV) which limits visible light absorption.23 Like TiO2, WO3-δ also exhibits excellent
photostability and can be produced cheaply but is unusual among transition metal oxides
for its smaller bandgap (2.6 eV – 3 eV, depending on the oxygen stoichiometry δ) which
improves visible light absorption.24 The valence band position of WO3-δ is sufficiently
oxidizing that a catalyst is generally not necessary to enhance the rate of the oxygen
evolution reaction on a bare WO3-δ surface, while the conduction band position of WO3-δ
is not reducing enough for the hydrogen evolution reaction. As a result, WO3-δ is
employed as a photoanode and must be combined with a photocathode for overall water
splitting.25 One of the key shortcomings of tungsten oxide as a photoanode is that it is a
weak light absorber, such that thick layers are necessary for significant light absorption.
In Chapter 4, we investigate the light absorption mode of oxygen deficient phases of

8
tungsten oxide to understand how oxygen deficiency impacts the light absorption
properties.
Non-stoichiometry also impacts the light absorption properties of semiconductors
employed in photovoltaic cells. Copper chalcogenides have been extensively explored as
light absorbers,26,27 and these materials can experience copper deficiency due to the
tendency for copper to be extracted from the host lattice. In Chapter 5, we explore how
chemical reductants and oxidants can be used to insert and extract copper from copper
sulfide and how this impacts the light absorption mode and electrical properties of this
material.
1.5. References
(1) Annual Energy Outlook 2014; Energy Information Agency: Washington, DC,
2014.
(2) Climate Change 2013: The Physical Science Basis; 2013.
(3) IPCC Special Report on Carbon Dioxide Capture and Storage; Metz, B.;
Davidson, O.; Coninck, H.; Loos, M.; Meyer, L., Eds.; Cambridge University
Press: Cambridge, 2005.
(4) Appel, A. M.; Bercaw, J. E.; Bocarsly, A. B.; Dobbek, H.; Dubois, D. L.; Dupuis,
M.; Ferry, J. G.; Fujita, E.; Hille, R.; Kenis, P. J. A.; Kerfeld, C. A.; Morris, R. H.;
Peden, C. H. F.; Portis, A. R.; Ragsdale, S. W.; Rauchfuss, T. B.; Reek, J. N. H.;
Seefeldt, L. C.; Thauer, R. K.; Waldrop, G. L. Chem. Rev. 2013, 113, 6621.
(5) Sabatier, P.; Senderens, J. B. C. R. Acad. Sci. 1902, 134, 689.
(6) Ratnasamy, C.; Wagner, J. P. Catal. Rev. 2009, 51, 325.
(7) Grimes, C. A.; Varghese, O. K.; Ranjan, S. In Light, Water, Hydrogen; Springer:
New York, 2008; pp. 35–113.
(8) Amouyal, E. Sol. Energy Mater. Sol. Cells 1995, 38, 249.
(9) Schiebahn, S.; Grube, T.; Robinus, M.; Zhao, L.; Otto, A.; Kumar, B.; Weber, M.;
Stolten, D. In Transition to Renewable Energy Systems; Stolten, D.; Scherer, V.,
Eds.; Wiley: Weinheim, Germany, 2013; pp. 813–847.
(10) Tan, M. X.; Laibinis, P. E.; Nguyen, S. T.; Kesselman, J. M.; Stanton, C. E.;
Lewis, N. S. Prog. Inorg. Chemisry 1994, 41, 21.
(11) Jacobsson, T. J.; Fjällström, V.; Edoff, M.; Edvinsson, T. Energy Environ. Sci.
2014, 7, 2056.

9
(12) Somorjai, G. A.; Turner, J. E. Naturwissenschaften 1984, 71, 575.
(13) Winkler, M. T.; Cox, C. R.; Nocera, D. G.; Buonassisi, T. Proc. Natl. Acad. Sci.
2013, 110, E1076.
(14) Hori, Y.; Wakebe, H.; Tsukamoto, T.; Koga, O. Electrochim. Acta 1994, 39, 1833.
(15) Hori, Y.; Kikuchi, K.; Suzuki, S. Chem. Lett. 1985, 11, 1695.
(16) Kuhl, K. P.; Hatsukade, T.; Cave, E. R.; Abram, D. N.; Kibsgaard, J.; Jaramillo, T.
F. J. Am. Chem. Soc. 2014, 136, 14107.
(17) Hori, Y. In Modern Aspects of Electrochemistry; Vayenas, C. G.; White, R. E.;
Gamboa-Aldeco, M. E., Eds.; Springer: New York, 2008; pp. 89–189.
(18) Weidner, J. W.; Sethuraman, V. A.; Van Zee, J. W. Interface 2003, 12, 40.
(19) Zhu, W.; Michalsky, R.; Metin, O.; Lv, H.; Guo, S.; Wright, C. J.; Sun, X.;
Peterson, A. A.; Sun, S. J. Am. Chem. Soc. 2013, 135, 16833.
(20) Singhal, G. S.; Renger, G.; Sopory, S. K.; Irrgang, K. D. Concepts in
Photobiology; Kluwer: Boston, 1999.
(21) Walter, M. G.; Warren, E. L.; McKone, J. R.; Boettcher, S. W.; Mi, Q.; Santori, E.
A.; Lewis, N. S. Chem. Rev. 2010, 110, 6446.
(22) Chen, X.; Shen, S.; Guo, L.; Mao, S. S. Chem. Rev. 2010, 110, 6503.
(23) Fujishima, A.; Honda, K. Nature 1972, 238, 37.
(24) Hodes, G.; Cahen, D.; Manassen, J. Nature 1976, 260, 312.
(25) Hu, C. C.; Nian, J. N.; Teng, H. Sol. Energy Mater. Sol. Cells 2008, 92, 1071.
(26) Guo, Q.; Ford, G. M.; Yang, W. C.; Walker, B. C.; Stach, E. A.; Hillhouse, H. W.;
Agrawal, R. J. Am. Chem. Soc. 2010, 132, 17384.
(27) Todorov, T. K.; Reuter, K. B.; Mitzi, D. B. Adv. Mater. 2010, 22, 156.

10
Chapter 2.
Enhanced electrochemical methanation of carbon dioxide with a
dispersible nanoscale copper catalyst
Reproduced in part with permission from: Karthish Manthiram, Brandon J. Beberwyck,
and A. Paul Alivisatos, “Enhanced electrochemical methanation of carbon dioxide with a
dispersible nanoscale copper catalyst,” Journal of the American Chemical Society 2014,
136, 13319-13325. Copyright 2014 by American Chemical Society.
Although the vast majority of hydrocarbon fuels and products are presently derived from
petroleum, there is much interest in the development of routes for synthesizing these
same products by hydrogenating CO2. The simplest hydrocarbon target is methane, which
can utilize existing infrastructure for natural gas storage, distribution, and consumption.
Electrochemical methods for methanizing CO2 currently suffer from a combination of
low activities and poor selectivities. We demonstrate that copper nanoparticles supported
on glassy carbon (n-Cu/C) achieve up to 4 times greater methanation current densities
compared to high-purity copper foil electrodes. The n-Cu/C electrocatalyst also exhibits
an average Faradaic efficiency for methanation of 80% during extended electrolysis, the
highest Faradaic efficiency for room-temperature methanation reported to date. We find
that the level of copper catalyst loading on the glassy carbon support has an enormous
impact on the morphology of the copper under catalytic conditions and the resulting
Faradaic efficiency for methane. The improved activity and Faradaic efficiency for
methanation involves a mechanism that is distinct from what is generally thought to
occur on copper foils. Electrochemical data indicate that the early steps of methanation
on n-Cu/C involve a pre-equilibrium one-electron transfer to CO2 to form an adsorbed
radical, followed by a rate-limiting non-electrochemical step in which the adsorbed CO2
radical reacts with a second CO2 molecule from solution. These nanoscale copper
electrocatalysts represent a first step toward the preparation of practical methanation
catalysts that can be incorporated into membrane-electrode assemblies in electrolyzers.
2.1. Single-step reduction of carbon dioxide to methane
The conversion of CO2 into hydrocarbons is an alternative route for synthesizing fuels
and feedstocks that are typically derived from oil or natural gas, representing one
potential strategy to store electrical energy derived from intermittent sources of clean
energy, such as wind and solar.1,2 Although electrosynthetic pathways for converting CO2
into hydrocarbon products are not economically feasible at present,3 expected decreases
in the price of electricity derived from clean energy sources4 and policy changes
regarding greenhouse gas emissions5 may alter the economics of reducing CO2
dramatically. In fact, growing use of intermittent renewable energy sources in certain
regions has accelerated the deployment of small-scale electrical energy storage systems,
including pilot plants for methanizing CO2.6 These pilot plants utilize a two-step process,
in which electrical energy is used to power an electrolyzer that splits water to produce
hydrogen and oxygen. The hydrogen is then used in the Sabatier reaction,7 in which CO2
and H2 are reacted over a heterogeneous nickel catalyst at temperatures of 250 - 400 oC

11
and pressures of 1 - 80 bar to produce methane, which can be injected into existing
natural gas networks. A single-step electrochemical process that can directly convert CO2
to methane under conditions of ambient pressure and temperature may represent an
attractive alternative.
2.2. Limitations of existing catalysts
Of the metals explored as catalysts for electrochemical CO2 reduction,8 the most active
and selective identified to date are gold, silver, and bismuth,9–14 which produce CO as
their terminal product. Copper is attractive in comparison, as it produces more reduced
hydrocarbon products.8,15–17 One of the hydrocarbon products formed on copper
electrocatalysts is methane, which forms through the following half-reaction:
CO2 + 8H+ +8e– → CH4 + 2H2O (2.1)
Because the reaction involves eight electron-transfer steps at 0.17 V (all potentials
reported versus reversible hydrogen electrode (RHE)) that can easily bifurcate to form a
wide range of products, the process exhibits poor selectivity for any single product,
forming a mixture of methane, ethylene, hydrogen, carbon monoxide, and formic
acid.18,19 The highest Faradaic efficiencies for methane reported to date are 64% on a
(210) copper single crystal18,20 and 73% on an electrodeposited copper electrode.21
Although studies conducted on high-purity foils, single crystals, and electrodeposited
materials have served as benchmarks and provide fundamental insights into how copper
catalyzes the reduction of CO2, these model materials are impractical for electrolyzers as
they have low surface areas, cannot be incorporated into the membrane electrode
assemblies22 that are needed to achieve high current densities with low ionic resistances,
or are expensive. From the point of view of cost and ease of manufacturing, highly
dispersed nanoparticle catalysts are much better suited for electrolyzers.23 Here, we
demonstrate that well-dispersed copper nanoparticles supported on glassy carbon show
high activities and Faradaic efficiencies for methanation, comparable to those of much
more expensive single-crystal electrodes. Systematic studies of nanoparticle loading on
the glassy carbon support and electrochemical analysis indicate that the altered reactivity
of the copper nanoparticles is due to distinct catalytic sites present on isolated
nanoparticle catalysts supported on glassy carbon.
2.3. Morphological evolution
We colloidally synthesized copper nanoparticles capped with tetradecylphosphonate of
diameter 7.0 ± 0.4 nm (Figure 2.1a,b).24 These particles were spin-coated onto glassy
carbon plates (Figure 2.1c), hereafter referred to as n-Cu/C, which served as the working
electrode in a three-electrode setup containing CO2-saturated 0.1 M sodium bicarbonate
electrolyte, pH 6.8. As a control, we also used high-purity copper foils as the working
electrode. All current densities for nanoparticle electrodes are surface-area normalized.
During the course of electrochemical CO2 reduction, the morphology of the copper
nanoparticles changes significantly, growing in size to 23 ± 8 nm in diameter (Figure

12
2.1d). The nanoparticles that form are highly polycrystalline, as revealed using high-
resolution transmission electron microscopy (Figure 2.1e,f). We find that irrespective of
the initial size of the nanoparticles on glassy carbon, the particles evolve in size to form
particles which are ~25 nm in diameter, even if we begin with larger particles. For
instance, if we treat the initially cast particles (Figure 2.1c) with trimethylsilyl chloride,
the tetradecylphosphonate ligand is stripped off of the surface of the particles, causing the
particles to ripen to a diameter of 52 ± 21 nm prior to polarization (Figure 2.1g). These
large, irregular particles then evolve in size and shape during the course of
electrochemical CO2 reduction to form smaller, uniform, roughly spherical particles
which are 25 ± 8 nm in diameter (Figure 2.1h). Similar changes in size are also observed
in the absence of CO2 (Figure A.1.1). The morphological evolution observed, which may
be due to a combination of particle coalescence and dissolution-redeposition, points
toward the importance of verifying if size distributions are maintained in studies of size-
dependent electrocatalysis.25
2.4. Catalytic behavior
Although the n-Cu/C electrodes and copper foil electrodes exhibit comparable current
densities at lower overpotentials, the current densities for n-Cu/C electrodes are over
twice as high at more reducing potentials (Figure 2.2a). Of this increased current, a much
greater fraction from the n-Cu/C electrode goes toward methane compared to the copper
foil (Figure 2.2b). The Faradaic efficiency for methane is improved at more reducing
potentials for n-Cu/C, reaching 76% at -1.35 V. This is significantly higher than the
Faradaic efficiency of 44% achieved on a polycrystalline copper foil at the same potential
(Figure 2.2b). The combined enhancement in both the overall current density and
Faradaic efficiency for methanation on n-Cu/C leads to partial current densities for
methane that are four times higher for n-Cu/C compared to the copper foil at -1.35 V
(Figure 2.2c). Hydrogen evolution, which is undesirable since the intended reduction
target is CO2, is also suppressed on n-Cu/C compared to the copper foil. The Faradaic
efficiency for hydrogen is 13% at -1.25 V on n-Cu/C, half that of a polycrystalline copper
foil at the same potential (Figure 2.2d).

13
Figure 2.1. Morphological evolution of copper nanoparticles during the course of
electrochemical CO2 reduction. Transmission electron microscopy (TEM) images of as-
synthesized copper nanoparticles of diameter 7.0 ± 0.4 nm at (a) low magnification and
(b) high magnification, showing that the initial particles are highly polycrystalline. (c)
Scanning electron microscopy (SEM) of n-Cu/C electrode, consisting of copper
nanoparticles supported on glassy carbon substrate. (d) SEM of n-Cu/C electrode
following polarization for 10 min at -1.25 V under CO2 electroreduction conditions,
demonstrating that the average particle diameter grows to 23 ± 8 nm. TEM images of
copper nanoparticle transferred from glassy carbon substrate following polarization onto
TEM grid at (e) low magnification and (f) high magnification, in which it is evident that
the particles that form under polarization are highly polycrystalline. (g) SEM of
trimethylsilyl chloride-treated n-Cu/C electrode prior to polarization, in which particles
have an average diameter of 52 ± 21 nm. (H) SEM of the same electrode following
polarization for 10 min at -1.25 V, in which the particles that form are 25 ± 8 nm in
diameter.

14
Figure 2.2. Comparison of current densities and Faradaic efficiencies for n-Cu/C
and copper foil electrodes. (a) Total current density, demonstrating that n-Cu/C has
greater overall reduction activity than the copper foil. (b) Faradaic efficiency for
methane, in which it is evident that n-Cu/C is more selective for methane than the copper
foil. (c) Methanation current density, in which the combined effect of the improved
current density and Faradaic efficiency on n-Cu/C is apparent. (d) Faradaic efficiency for
hydrogen as a function of potential, showing suppressed hydrogen evolution on the n-
Cu/C catalyst.

15
The current densities for n-Cu/C are relatively stable at -1.25 V during extended periods
of CO2 reduction (Figure 2.3a), decaying only 3% over the course of 1 h, indicating a
stability surpassing copper foil electrodes, for which the current density decays by 11%
(Figure A.1.2). The Faradaic efficiency for methane on n-Cu/C does not decay during
extended periods of CO2 reduction (Figure 2.3b), remaining in the range of 71-90%, with
an average yield of 80% over 1 h, which is the highest Faradaic efficiency for
methanation reported to date.
Figure 2.3. Stability of the n-Cu/C and copper foil catalysts. (a) Total current density
and (b) Faradaic efficiency for methanation as a function of time for both n-Cu/C and
copper foil polarized at -1.25 V, demonstrating that the n-Cu/C catalyst is stable.
2.5. Continuum from nanoparticle-like to foil-like behavior
There are many structural, morphological, and chemical differences between the copper
nanoparticles supported on glassy carbon and copper foil electrodes, which could
hypothetically be responsible for the increased Faradaic efficiencies for methanation.
Some sources of the differences include the presence of tetradecylphosphonate ligand
capping the nanoparticles and impurities present in the initial nanoparticles, since they
are prepared from a 97% pure copper precursor. In order to determine the effect of these
various factors, we utilized a distinctly different method of preparation of the
electrocatalyst, by evaporating a thin film of copper onto glassy carbon using a high-
purity copper source. For a 3 nm film (Figure 2.4a), we find that a Faradaic efficiency for
methanation of 76% can be achieved (Figure 2.4e), allowing us to conclusively exclude
the possibility that the presence of ligands and impurities in the starting material
influence the observed improvement in Faradaic efficiency for methanation on n-Cu/C.
16
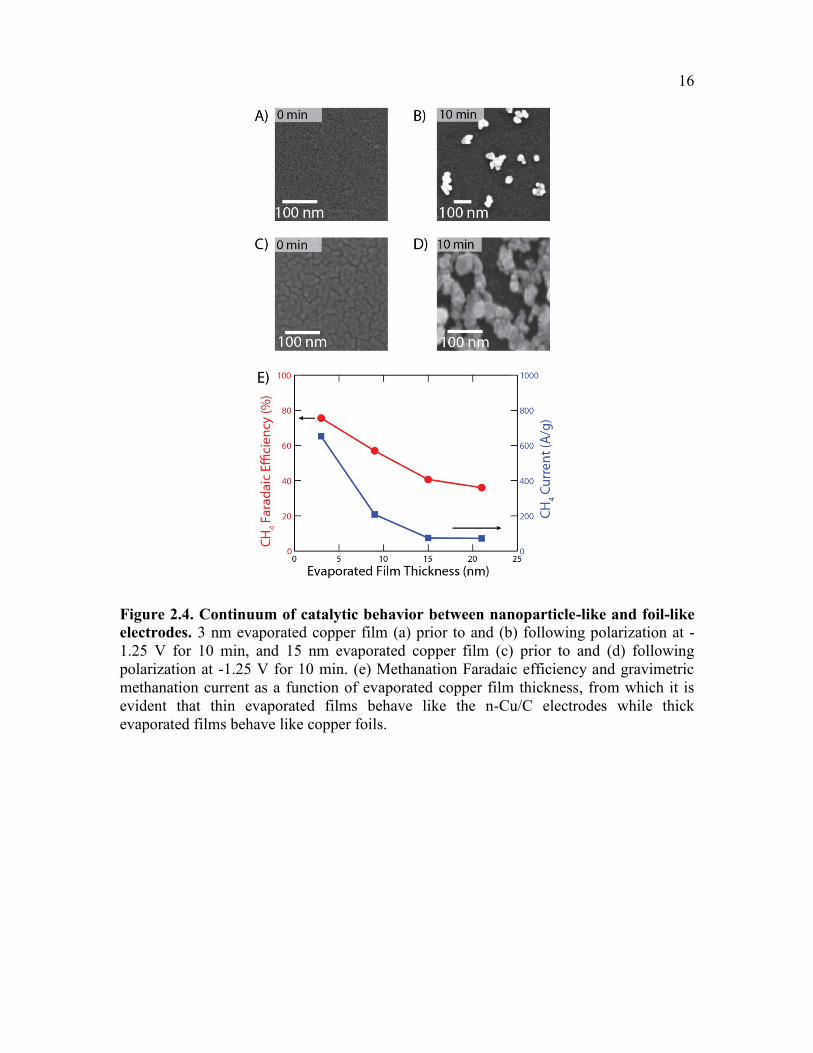
Figure 2.4. Continuum of catalytic behavior between nanoparticle-like and foil-like
electrodes. 3 nm evaporated copper film (a) prior to and (b) following polarization at -
1.25 V for 10 min, and 15 nm evaporated copper film (c) prior to and (d) following
polarization at -1.25 V for 10 min. (e) Methanation Faradaic efficiency and gravimetric
methanation current as a function of evaporated copper film thickness, from which it is
evident that thin evaporated films behave like the n-Cu/C electrodes while thick
evaporated films behave like copper foils.

17
The thickness of the initially evaporated copper film has a dramatic impact on the
Faradaic efficiency for methane. Evaporated films that are relatively thin (Figure 2.4a)
produce isolated nanoscale aggregates upon polarization on the electrode (Figure 2.4b)
which somewhat resemble the n-Cu/C electrodes (Figure 2.1d); these electrodes have
high methanation yields (Figure 2.4e). In contrast, thicker films (Figure 2.4c) produce
highly connected networks of fused nanoparticles upon polarization (Figure 2.4d); these
electrodes have low Faradaic efficiencies for methanation (Figure 2.4e), as we would
expect for an architecture that resembles a polycrystalline foil. This possibly explains
why previous studies of dense films of copper nanoparticles have not observed enhanced
methanation yields.26–28 A systematic study of single crystal electrodes for CO2 reduction
has put forth the possibility that the introduction of a particular step-edge present on a
(210) single crystal can enhance methanation yields.20 This suggests that more isolated
nanoparticles expose catalytic sites that are more effective for methanation, which are
lost as they fuse to form dense aggregates. Structural differences have also been
implicated in the enhanced selectivity for CO observed on copper foil catalysts which are
oxidized and then reduced.27,29 Our results demonstrate a continuum of catalytic
behavior that exists between electrodes that exhibit nanoparticle-like and foil-like
behavior, and that this behavior can be systematically tuned by adjusting the mass
loading of copper on glassy carbon (Figure 2.4e).
2.6. Mechanism of CO2 reduction
In order to glean mechanistic insights regarding the altered catalytic behavior of n-Cu/C
compared to copper foils, we measured the Tafel slope of the n-Cu/C catalyst. In the
region of Tafel linearity, the Tafel slope for methanation is 60 ± 4.2 mV/decade for n-
Cu/C (Figure 2.5a), close to a value of 59 mV/decade, indicative of a one-electron pre-
equilibrium step prior to a rate-limiting non-electrochemical step.11,12,30,31 Tafel slopes for
methanation on copper foils vary widely depending on surface preparation, ranging from
as low as 86 ± 4.6 mV/decade (Figure 2.5a) to as high as 175 mV/decade.32 It is generally
thought that the rate-limiting step for methanation on copper foils involves a single
electron transfer to CO2 on copper foils,18 which would correspond to a Tafel slope of
120 mV/decade. The reduced Tafel slope on n-Cu/C is advantageous because smaller
excursions in potential are needed to drive logarithmic gains in methanation current.

18
Figure 2.5. Mechanistic insights from Tafel analysis. (a) Tafel plot for n-Cu/C and
copper foil, with linear fit at low current densities demonstrating that these catalysts have
Tafel slopes of 60 ± 4.2 and 86 ± 4.6 mV/decade, respectively. The Tafel slope for n-
Cu/C indicates a one electron pre-equilibrium step precedes a non-electrochemical rate
limiting step. (b) Methanation current density as a function of partial pressure of CO2 at -
1.25 V, demonstrating that methanation current density has a 2.03 ± 0.08 order
dependence on the partial pressure of CO2 at lower CO2 partial pressures. (c) Proposed
mechanism for the electrochemical reduction of CO2 to methane, including the rate-
limiting step (RLS). This mechanism is consistent with the gathered electrochemical data
and known intermediates for CO2 reduction that have been identified in the literature.
While the Tafel slope provides general insights into the nature of the possible rate-
limiting and pre-equilibrium steps, the order dependence of the methanation current on
reactants provides a more detailed picture of the rate-limiting step. We find an unusual
second-order (2.03 ± 0.08) dependence of methanation current on CO2 partial pressure
for the n-Cu/C catalyst (Figure 2.5b).33 Based on work on other metals, such as gold9 and
mercury,34 it is often assumed that CO2 reduction on copper foils proceeds with a first-
order dependence on CO2 in aqueous electrolytes,35,36 although we observe an ill-defined
order (Figure 2.5b). The methanation current on the n-Cu/C catalyst exhibits no clear
order dependence on sodium bicarbonate concentration (Figure A.1.3), although
optimization of the buffer concentration can further enhance Faradaic efficiencies for
methanation by approximately 10% (Appendix A.1).
Combining the insights provided by the preceding electrochemical analysis, we propose
early steps in a possible mechanism that could lead to methane formation (Figure 2.5c).
In this proposed mechanism, the CO2 1 reacts in a one-electron transfer pre-equilibrium
step to form a surface adsorbed CO2 radical 2. The CO2 radical has been experimentally
observed on other metals, and it is inferred that it also forms on copper.18,34,37,38 If we
assume that the surface coverage of the CO2 radical θ ≪ 1, consistent with the

19
observation that copper surfaces are predominantly covered in CO under CO2 reduction
conditions,39–41 then θ is related to the overpotential η and CO2 partial pressure pCO2 as:
θ = 𝐾1𝑝𝐶𝑂2exp (
𝐹𝜂
𝑅𝑇) (2.2)
where K1 is the equilibrium constant for the conversion of 1 to 2, F is Faraday’s constant,
R is the gas constant, and T is temperature (Appendix A.1).30 Following the pre-
equilibrium step, the adsorbed CO2 radical 2 is proposed to undergo rate-limiting carbon-
oxygen coupling with a Lewis acid CO2 molecule from solution to form a CO2-CO2¯•
adduct 3, which could be either a transition state or a genuine intermediate. Such an
adduct has been postulated for electrochemical reduction of CO2 in non-aqueous solvents
on other metals.38,42–44 The rate of the CO2-CO2¯• adduct formation step, expressed as a
methanation current, is:
𝑖𝐶𝐻4= 𝑛𝐹𝑘2𝑝𝐶𝑂2
𝜃 (2.3)
where n is the total number of electron transfers needed to convert CO2 1 to methane 5
and 𝑘2 is the rate constant for the conversion of 2 to 3. Combining equations 2.2 and 2.3,
we obtain:
𝑖𝐶𝐻4= 𝑛𝐹𝑘2𝐾1𝑝𝐶𝑂2
2 exp (𝐹𝜂
𝑅𝑇) (2.4)
This rate law is consistent with the second-order dependence on CO2 partial pressure that
we experimentally observe. The Tafel slope is given by the partial derivative of the
overpotential η with respect to the logarithm of current,30 which we apply to equation 2.4,
yielding:
(𝜕𝜂
𝜕 log 𝑖𝐶𝐻4 )
𝑝𝐶𝑂2
=2.3𝑅𝑇
𝐹= 59 𝑚𝑉/𝑑𝑒𝑐𝑎𝑑𝑒 (2.5)
Hence, the theoretical Tafel slope of 59 mV/decade for the proposed mechanism is
consistent with our experimental measurement of 60 ± 4.2 mV/decade (Figure 2.5a). The
preceding analysis involving the Tafel slope and order-dependence on pCO2 has also
allowed us to exclude several alternative mechanisms, such as the self-coupling of two
CO2¯• and rate-limiting electron transfer to CO2 (Appendix A.1).
Based on mechanistic understanding of CO2 reduction on other metals, we may also
propose downstream steps for the conversion of CO2-CO2¯• into methane. In studies done
on mercury and lead in dimethylformamide,38,42–44 the CO2-CO2¯• adduct 3 is believed to
reductively disproportionate to yield both CO32- and CO, which is a terminal product on
these electrodes. Our experimental observation of CO as a minor product on n-Cu/C
electrodes (Figure A.1.4) is consistent with its appearance as an intermediate in our
proposed mechanism. Given CO is known to bind to copper with an adsorption enthalpy
of ~20 kcal/mol,45 we may expect it to bind to the copper and further react. The
downstream steps in which the adsorbed CO molecule 4 reacts to form methane 5 may be

20
similar to what has been previously proposed for copper foil electrodes based on detailed
studies of their reactivity with CO.36,46
2.7. Conclusion
These nanoscale copper electrocatalysts represent a first step toward the development of a
dispersed electrochemical methanation catalyst that can be used in practical
electrolyzers.22 Copper nanoparticles are ideal for preparing gas diffusion layers for
membrane-electrode assemblies which minimize polarization losses, maximizing the
energy efficiency of electrolyzers. In addition, these colloidally-prepared copper
nanoparticles have catalytic properties that rival those of much more expensive high-
purity foils and single-crystal electrodes. The finding of improved methanation activity
and Faradaic efficiency for copper nanoparticle catalysts on glassy carbon through a
unique mechanism paves the way for complementary computational and spectroscopic
studies to develop a more detailed mechanistic understanding of the origin of the
improved catalytic properties.
2.8. References
(1) Nocera, D. G. ChemSusChem 2009, 2, 387.
(2) Lewis, N.; Nocera, D. Proc. Natl. Acad. Sci. 2006, 104, 15729.
(3) Banholzer, W.; Jones, M. AIChE J. 2013, 59, 2708.
(4) Reichelstein, S.; Yorston, M. Energy Policy 2013, 55, 117.
(5) Climate Change 2014: Mitigation of Climate Change; Intergovernmental Panel on
Climate Change: Geneva, 2014.
(6) Schiebahn, S.; Grube, T.; Robinus, M.; Zhao, L.; Otto, A.; Kumar, B.; Weber, M.;
Stolten, D. In Transition to Renewable Energy Systems; Stolten, D.; Scherer, V.,
Eds.; Wiley: Weinheim, Germany, 2013; pp. 813–847.
(7) Sabatier, P.; Senderens, J. B. C. R. Acad. Sci. 1902, 134, 689.
(8) Hori, Y.; Kikuchi, K.; Suzuki, S. Chem. Lett. 1985, 11, 1695.
(9) Hori, Y.; Murata, A.; Kikuchi, K.; Suzuki, S. J. Chem. Soc. Chem. Commun. 1987,
728.
(10) Zhu, W.; Michalsky, R.; Metin, O.; Lv, H.; Guo, S.; Wright, C. J.; Sun, X.;
Peterson, A. A.; Sun, S. J. Am. Chem. Soc. 2013, 135, 16833.

21
(11) Lu, Q.; Rosen, J.; Zhou, Y.; Hutchings, G. S.; Kimmel, Y. C.; Chen, J. G.; Jiao, F.
Nat. Commun. 2014, 5, 3242.
(12) Chen, Y.; Li, C. W.; Kanan, M. W. J. Am. Chem. Soc. 2012, 134, 19969.
(13) DiMeglio, J. L.; Rosenthal, J. J. Am. Chem. Soc. 2013, 135, 8798.
(14) Medina-Ramos, J.; Dimeglio, J. L.; Rosenthal, J. J. Am. Chem. Soc. 2014, 136,
8361.
(15) Hori, Y.; Murata, A.; Takahashi, R. J. Chem. Soc. Faraday Trans. 1989, 85, 2309.
(16) Peterson, A. A.; Abild-Pedersen, F.; Studt, F.; Rossmeisl, J.; Nørskov, J. K.
Energy Environ. Sci. 2010, 3, 1311.
(17) Peterson, A.; Nørskov, J. J. Phys. Chem. Lett. 2012, 2, 251.
(18) Hori, Y. In Modern Aspects of Electrochemistry; Vayenas, C. G.; White, R. E.;
Gamboa-Aldeco, M. E., Eds.; Springer: New York, 2008; pp. 89–189.
(19) Kuhl, K. P.; Cave, E. R.; Abram, D. N.; Jaramillo, T. F. Energy Environ. Sci.
2012, 5, 7050.
(20) Hori, Y.; Takahashi, I.; Koga, O.; Hoshi, N. J. Phys. Chem. B 2002, 106, 15.
(21) Cook, R.; MacDuff, R.; Sammells, A. J. Electrochem. Soc. 1988, 135, 1320.
(22) Weidner, J. W.; Sethuraman, V. A.; Van Zee, J. W. Interface 2003, 12, 40.
(23) Rand, D.; Dell, R. Hydrogen Energy: Challenges and Prospects; Hunt, J., Ed.; 1st
ed.; RSC Publishing: Cambridge, 2007.
(24) Hung, L.-I.; Tsung, C.-K.; Huang, W.; Yang, P. Adv. Mater. 2010, 22, 1910.
(25) Manthiram, K.; Surendranath, Y.; Alivisatos, A. P. J. Am. Chem. Soc. 2014, 136,
7237.
(26) Tang, W.; Peterson, A.; Varela, A. Phys. Chem. Chem. Phys. 2012, 4, 76.
(27) Li, C. W.; Kanan, M. W. J. Am. Chem. Soc. 2012, 134, 7231.
(28) Reske, R.; Mistry, H.; Behafarid, F.; Roldan Cuenya, B.; Strasser, P. J. Am. Chem.
Soc. 2014, 136, 6978.
(29) Li, C. W.; Ciston, J.; Kanan, M. W. Nature 2014, 508, 504.

22
(30) Gileadi, E. Physical Electrochemistry: Fundamentals, Techniques and
Applications; 1st ed.; Wiley-VCH: Weinheim, Germany, 2011.
(31) Chen, Y.; Kanan, M. W. J. Am. Chem. Soc. 2012, 134, 1986.
(32) Kim, J. J.; Summers, D. P.; Frese, K. W. J. Electroanal. Chem. 1988, 245, 223.
(33) Hammouche, M.; Lexa, D.; Momenteau, M.; Saveant, J. M. J. Am. Chem. Soc.
1991, 113, 8455.
(34) Paik, W.; Andersen, T.; Eyring, H. Electrochim. Acta 1969, 14, 1217.
(35) Gattrell, M.; Gupta, N.; Co, A. J. Electroanal. Chem. 2006, 594, 1.
(36) Schouten, K. J. P.; Kwon, Y.; van der Ham, C. J. M.; Qin, Z.; Koper, M. T. M.
Chem. Sci. 2011, 2, 1902.
(37) Jordan, J.; Smith, P. T. Proc. Chem. Soc. 1960, 246.
(38) Aylmer-Kelly, A.; Bewick, A. Faraday Discuss. Chem. Soc. 1973, 56, 96.
(39) Hori, Y.; Murata, A.; Yoshinami, Y. J. Chem. Soc., Faraday Trans. 1991, 87, 125.
(40) Hori, Y.; Murata, A.; Tsukamoto, T.; Wakebe, H.; Koga, O.; Yamazaki, H.
Electrochim. Acta 1994, 39, 2495.
(41) Hori, Y.; Koga, O.; Yamazaki, H.; Matsuo, T. Electrochim. Acta 1995, 40, 2617.
(42) Amatore, C.; Saveant, J. M. J. Am. Chem. Soc. 1981, 103, 5021.
(43) Amatore, C.; Saveant, J. M. J. Electroanal. Chem. 1981, 126, 1.
(44) Gennaro, A.; Isse, A. A.; Severin, M.-G.; Vianello, E.; Bhugun, I.; Saveant, J.-M.
J. Chem. Soc. Faraday Trans. 1996, 92, 3963.
(45) Toyoshima, I.; Somorjai, G. A. Catal. Rev. 1979, 19, 105.
(46) Hori, Y.; Takahashi, R. J. Phys. Chem. B 1997, 5647, 7075.

23
Chapter 3.
Dendritic assembly of gold nanoparticles during fuel-forming
electrocatalysis
Reproduced in part with permission from: Karthish Manthiram, Yogesh Surendranath,
and A. Paul Alivisatos, “Dendritic assembly of gold nanoparticles during fuel-forming
electrocatalysis,” Journal of the American Chemical Society 2014, 136, 7237-7240.
Copyright 2014 by American Chemical Society.
We observe the dendritic assembly of alkanethiol-capped gold nanoparticles on a glassy
carbon support during electrochemical reduction of protons and CO2. We find that the
primary mechanism by which surfactant-ligated gold nanoparticles lose surface area is by
taking a random walk along the support, colliding with their neighbors, and fusing to
form dendrites, a type of fractal aggregate. A random walk model reproduces the fractal
dimensionality of the dendrites observed experimentally. The rate at which the dendrites
form is strongly dependent on the solubility of the surfactant in the electrochemical
double layer under the conditions of electrolysis. Since alkanethiolate surfactants
reductively desorb at potentials close to the onset of CO2 reduction, they do not poison
the catalytic activity of the gold nanoparticles. Although catalyst mobility is typically
thought to be limited for room-temperature electrochemistry, our results demonstrate that
nanoparticle mobility is significant under conditions at which they electrochemically
catalyze gas evolution, even in the presence of a high surface area carbon and binder. A
careful understanding of the electrolyte- and polarization-dependent nanoparticle
aggregation kinetics informs strategies for maintaining catalyst dispersion during fuel-
forming electrocatalysis.
3.1. Factors contributing to loss of nanoparticle catalyst surface area
during electrocatalysis
Critical catalytic transformations, such as the electrochemical reduction of carbon
dioxide, require the development of high surface area catalysts that maintain their
dispersion over time. Practical electrocatalysts typically consist of nanoscale crystallites,
which provide high surface-area-to-volume ratios and can be easily incorporated into
membrane electrode assemblies.1 Nanocrystalline catalysts also exhibit unique electronic
and surface structures compared to their bulk counterparts.2 However, highly dispersed
nanocrystals are thermodynamically unstable relative to their corresponding bulk
crystalline phase because of the high degree of coordinative unsaturation of their surface
atoms. This provides a strong driving force for reducing catalyst dispersion, which occurs
via two principal mechanisms: (1) diffusion of atomic species between nanoparticles,
commonly referred to as Ostwald ripening,3 or (2) diffusion, collision, and coalescence of
entire nanoparticles.4 Limiting these two transport processes is critical for maintaining
high catalyst dispersion and preserving high activity per unit mass of the material.
Noble metals, such as gold, are attractive for electrocatalysis because they exhibit
increased resistance to Ostwald ripening compared to other metals.5 Gold, in the form of

24
foils,6,7 nanoparticles,8,9 and clusters,10 is a selective catalyst for reducing CO2 to CO. For
gold under reducing conditions, the primary mechanism available for surface area loss is
the diffusion and fusion of entire nanoparticles. At elevated temperature, successive
diffusion of individual atoms along the surface of the nanoparticle collectively leads to a
random walk of the entire nanoparticle along the support. At room temperature, though,
there is insufficient thermal energy to drive such a process for gold.11,12 Despite this, we
find that during the electrochemical reduction of protons and CO2, a gold nanoparticle
electrocatalyst takes a random walk along the support, fuses with its neighbors, and forms
dendrites.
As a model catalytic system, we use gold nanoparticles supported on glassy carbon to
electrochemically reduce CO2. Dodecanethiol-capped gold nanoparticles13 of diameter
4.2 ± 0.5 nm were spin-coated onto a glassy carbon plate (Appendix A.2). This deposition
method gives rise to a random array of individual gold nanoparticles at an areal density of
~ 3 x 10¹¹ particles/cm2 (Figure 3.1a). Gold nanoparticle-coated glassy carbon plates
prepared in this fashion served as the working electrode in a three-electrode
electrochemical cell containing saturated CO2/0.1 M NaHCO3 electrolyte (hereafter
referred to as 0.1 M NaHCO3 buffer) (Appendix A.2). Experiments were conducted
potentiostatically by polarizing to a desired potential and measuring the current versus
time (Figures A.2.1). All potentials are reported versus the reversible hydrogen electrode
(RHE). Alkanethiols are a convenient ligand for synthesizing gold nanoparticles14 but are
generally thought to poison catalytic sites by blocking access to reactants.15 The thiol is
not a poison for electrochemical CO2 reduction because it is desorbed from the gold
surface at potentials at which we observe appreciable current densities. Indeed, we
observe comparable current densities for CO2 reduction on our gold nanoparticle
electrodes and gold foils when we normalize for surface area (Figure A.2.3), although the
Faradaic efficiency for CO2 reduction to CO is lower for our dodecanethiol-capped gold
nanoparticle electrodes (Appendix A.2).
3.2. Experimentally-observed dendritic assembly of nanoparticles
during electrocatalysis
Upon polarization at −1.2 V, small dendrites with an average diameter of 13 nm formed
after 10 min (Figure 3.1b) and even larger dendrites with an average diameter of 140 nm
formed after 100 min (Figure 3.1c) of electrolysis, as found using ex situ scanning
electron microscopy (SEM). Transmission electron microscopy (TEM) analysis reveals
that the initially spherical particles (Figure 3.1d) fused into branched dendritic structures
(Figure 3.1e).

25
Figure 3.1. SEM and TEM of gold nanoparticles supported on glassy carbon. SEM
taken after (a) 0, (b) 10, and (c) 100 min of polarization at -1.2 V in 0.1 M NaHCO3
buffer. TEM of (d) as-synthesized gold nanoparticles and e) a dendrite formed after 100
min of polarization.
3.3. Random walk simulations of dendritic assembly of nanoparticles
To further examine the mechanism by which dendrites form, we modeled the diffusion
and coalescence of nanoparticles using a random walk algorithm (Appendix A.2).
Simulations of this type are well suited to modeling dendrite formation as they have been
shown to reproduce the patterns that arise from colloid aggregation.16,17 For each
simulation, the initial state consists of a square lattice with periodic boundary conditions
that is randomly populated with particles (Figure 3.2a) at the areal density that we
experimentally observe by SEM (Appendix A.2). In each iteration of the simulation, a
randomly chosen particle moves randomly by one unit in any direction. When two
particles occupy neighboring sites, they fuse irreversibly to form an aggregate with a
probability given by the sticking coefficient ps, which we briefly assume to be unity. If
the system is constrained such that fused particles remain immobile on the substrate,
small unbranched aggregates result from the simulation when no more individual
particles remain (Figure 3.2b). In order to form the larger, highly branched structures
observed experimentally (Figure 3.1c), this constraint must be lifted. When the initially
formed aggregates are also allowed to move, much larger dendrites are produced (Figure
3.2c) if the simulation is allowed to run until the average diameter of the dendrites is

26
equal to that observed experimentally after 100 min of electrolysis (Figure 3.1c). While
this model suggests that small aggregates remain mobile over the course of electrolysis,
the forces that drive this motion remain unclear. In addition to Brownian motion, bubble
formation and particle charging may contribute, particularly at very negative applied
potentials.
If we impose a kinetic barrier to particle fusion by decreasing the sticking coefficient to
ps=0.1, we observe that dendrites composed of thicker segments of approximately two
initial particle diameters form (Figure 3.2d), more closely matching the dendrite filament
thickness of two to three initial particle diameters obtained experimentally (Figure 3.1e).
The dendrites formed upon electrolysis can be viewed as fractal structures, which are
self-similar on multiple length scales.21,22 Fractals are characterized by a non-integer
dimensionality, which is given by the slope of a linear fit to a plot of the logarithm of the
area occupied by a dendrite versus the logarithm of the maximum caliper diameter of the
same dendrite (Appendix A.2). We expect fractal dimensionalities between the Euclidean
dimensions of 1 and 2, with larger values denoting more space-filling structures.
We first calculate the fractal dimensionality of dendrites produced after 100 min of
polarization at -1.2 V. Then, random walk simulations of dendrite formation are allowed
to proceed until the average of the maximum caliper diameters of the simulated dendrites
is the same as that measured experimentally. Figure 3.2e plots the logarithm of area
versus the logarithm of maximum caliper diameter for experimental and simulated
dendrites. Both sets of dendrites span a similar range and display a roughly linear trend.
The fractal dimensionality of the experimentally produced dendrites is 1.5 ± 0.1, which is
comparable to the fractal dimensionalities of 1.4 ± 0.1 and 1.3 ± 0.1 for reaction-limited
and diffusion-limited dendrite formation, respectively. This analysis further suggests that
a diffusion-collision model is sufficient to describe the pathway for dendrite formation
during electrolysis.

27
Figure 3.2. Random walk simulations of dendrite formation. (a) Initial condition. (b)
Simulated dendrites if only individual particles move with a sticking coefficient of ps=1.
Simulated dendrites if dendrites also move with a sticking coefficient of (c) ps=1 and (d)
ps=0.1. (e) Dendrite area versus diameter. The solid line indicates a linear fit to the data.
The dendrite diameter and area were non-dimensionalized using the particle diameter and
square of the particle diameter, respectively.

28
3.4. Impact of electrode potential and electrolyte on dendritic assembly
The course of dendrite formation is strongly dependent on electrode potential. At -0.2 V,
there is no observable dendritic assembly (Figure 3.3a), and the electrode appears
identical to the unpolarized electrode (Figure 3.1a). However, dendritic assembly is
observed at -0.6 V (Figure 3.3b) and at more negative potentials (Figure 3.1b).
Importantly, the potential of this transition coincides with the alkanethiolate reductive
desorption potential of -0.6 V,23,24 suggesting that productive particle fusion occurs more
readily when thiols are no longer chemisorbed to the gold nanoparticle surface.
Figure 3.3. Impact of electrode potential on dendritic assembly. SEM of electrodes
after polarization for 10 min in 0.1 M NaHCO3 buffer at (a) -0.2 V and (b) -0.6 V.
Surprisingly, dodecanethiol also influences the nanoparticle assembly behavior well
beyond its reductive desorption potential. At potentials beyond -0.6 V, the thiolate-gold
chemisorption bond is ruptured; however, the dissociated thiolate may remain
physisorbed to the gold surface or carbon support. Indeed, X-ray photoelectron
spectroscopy of gold nanoparticle decorated electrodes subjected to exhaustive
polarization beyond -1.2 V reveals that thiolates remain on the surface (Figures A.2.4 and
A.2.5).25 The degree to which the alkanethiol physisorbs is related to its solubility in the
electrolyte, which can be modulated by changing the pH.23,26 To interrogate the impact of
physisorbed ligands, we examined the dendritic assembly in acidic and basic electrolytes
under argon gas in the absence of CO2. Although only H2 is evolved under these
conditions, the pH dependence of dendritic assembly provides insights into the role of the
physisorbed thiolates. There is no observable dendritic assembly in 0.1 M H2SO4, pH 1,
but rapid dendritic assembly is observed during electrolysis in both 0.1 M NaHCO3, pH
6.8, and 0.1 M KOH, pH 12 (Figures 3.4a, 3.4c, and 3.4e). This pH dependence is in line
with the significantly higher solubility of dodecanethiolate relative to dodecanethiol in
aqueous electrolytes.27 As dodecanethiol has a pKa of ~10.5, reductive desorption is
accompanied with protonation to form a surface adsorbed thiol in acidic media. These
adsorbed thiols sterically impede productive gold nanoparticle fusion events; thus, the
sticking coefficient is sufficiently low such that we observe essentially no dendritic
assembly (Figure 3.4a). In contrast, in alkaline media, in which the thiolate is not
protonated upon reductive desorption, there is rapid dendritic assembly (Figure 3.4e). At
a nearly neutral pH of 6.8, the observation of dendritic assembly (Figure 3.4c) appears
contrary to what we would expect on the basis of the thiol pKa of 10.5; however, under
reductive polarization, the electrolyte can become significantly more basic in the vicinity
of the electrode, especially in electrolytes with low buffer capacity. We believe that the
increased local pH under polarization is responsible for increasing the local solubility of
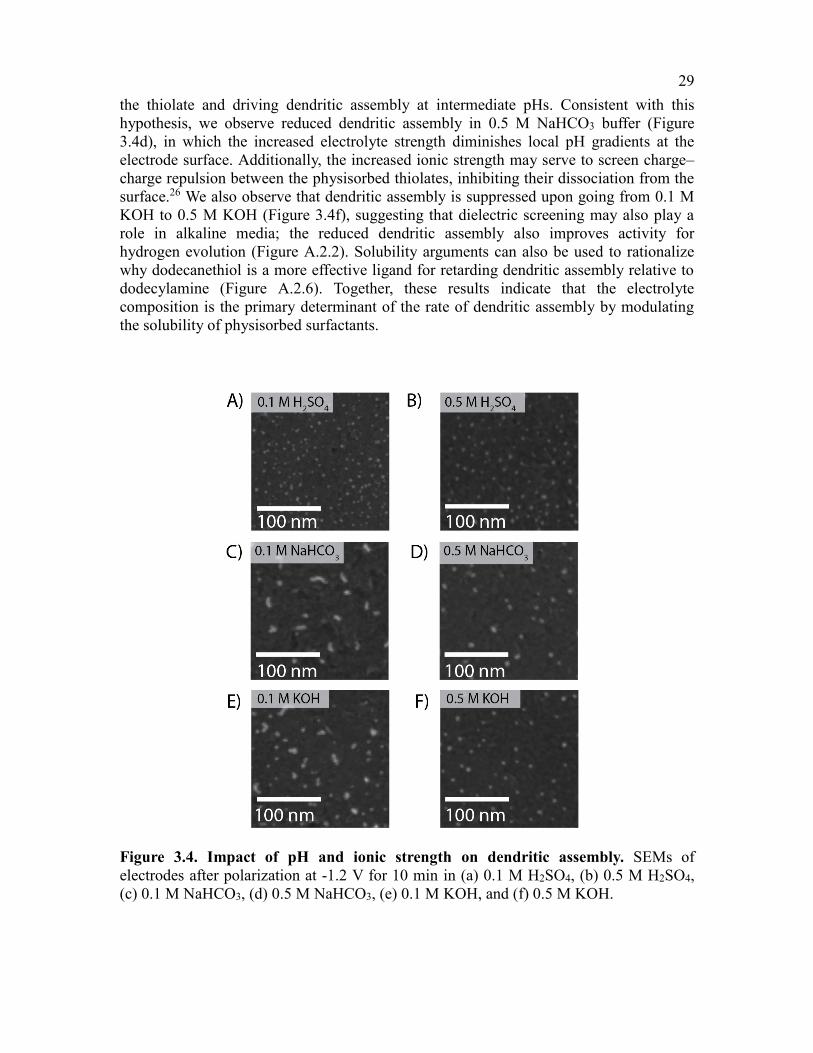
29
the thiolate and driving dendritic assembly at intermediate pHs. Consistent with this
hypothesis, we observe reduced dendritic assembly in 0.5 M NaHCO3 buffer (Figure
3.4d), in which the increased electrolyte strength diminishes local pH gradients at the
electrode surface. Additionally, the increased ionic strength may serve to screen charge–
charge repulsion between the physisorbed thiolates, inhibiting their dissociation from the
surface.26 We also observe that dendritic assembly is suppressed upon going from 0.1 M
KOH to 0.5 M KOH (Figure 3.4f), suggesting that dielectric screening may also play a
role in alkaline media; the reduced dendritic assembly also improves activity for
hydrogen evolution (Figure A.2.2). Solubility arguments can also be used to rationalize
why dodecanethiol is a more effective ligand for retarding dendritic assembly relative to
dodecylamine (Figure A.2.6). Together, these results indicate that the electrolyte
composition is the primary determinant of the rate of dendritic assembly by modulating
the solubility of physisorbed surfactants.
Figure 3.4. Impact of pH and ionic strength on dendritic assembly. SEMs of
electrodes after polarization at -1.2 V for 10 min in (a) 0.1 M H2SO4, (b) 0.5 M H2SO4,
(c) 0.1 M NaHCO3, (d) 0.5 M NaHCO3, (e) 0.1 M KOH, and (f) 0.5 M KOH.

30
3.5. Assembly of nanoparticles embedded in practical catalyst
architectures
The mobility of nanoparticles electrochemically catalyzing gas evolution is a
fundamental process that occurs even when the nanoparticles are encapsulated in a
binder, as is common in practical catalytic systems. To demonstrate this, we have
examined the nanoparticle mobility and fusion events in a composite system, comprised
of acetylene black and poly(vinyledene fluoride). In this binder, dendritic assembly still
occurred (Figure 3.5) but at a slower rate than in the absence of these additives. This
suggests that the additives simply act to provide steric hindrance between the diffusing
particles, thereby reducing the collision frequency. To block the diffusion-aggregation
process completely would require that the nanoparticles be bound to the substrate tightly
enough to perturb the nanoparticles themselves. What we have found here is that the
diffusion-aggregation process can be controlled by tuning the ligand chemistry in such a
way as to allow aggregation to proceed up to a point, while retaining functional catalytic
activity.
Figure 3.5. Comparison of model system and practical electrode. SEM of electrodes
consisting of gold nanoparticles, acetylene black, and poly(vinylidene fluoride) (a) prior
to polarization and (b) following 100 min of polarization at -1.2 V in 0.1 M NaHCO3
buffer.
3.6. Conclusion
Our work demonstrates that carbon supported nanoparticles are subject to diffusion,
collision, and fusion to form dendritic assemblies under reductive polarization, even at
room temperature and in the presence of a high surface area carbon and binder. A simple
random walk model is sufficient to describe the formation of dendrites with agreement
between the simulated and experimental fractal dimensionalities. Additionally, this study
highlights the critical role of electrolyte- and polarization-dependent surface chemistry in
mediating nanoparticle aggregation during electrocatalysis. By giving an improved
understanding of the mechanism by which gold nanoparticles lose surface area via
dendritic assembly, these studies inform strategies for preserving catalyst dispersion in
order to maintain activity under harsh electrochemical conditions.

31
3.7. References
(1) Weidner, J. W.; Sethuraman, V. A.; Van Zee, J. W. Interface 2003, 12, 40.
(2) Catalysis and Electrocatalysis at Nanoparticle Surfaces; Wieckowski, A.;
Savinova, E. R.; Vayenas, C. G., Eds.; Marcel Dekker: New York, 2003.
(3) Ostwald, W. Z. Phys. Chem 1900, 34, 495.
(4) Smoluchowski, M. Z. Phys. Chem 1917, 1210, 129.
(5) Pourbaix, M. Atlas of Electrochemical Equilibria in Aqueous Solutions; 2nd ed.;
National Association of Corrosion Engineers: Houston, 1974.
(6) Hori, Y.; Kikuchi, K.; Suzuki, S. Chem. Lett. 1985, 11, 1695.
(7) Hori, Y. In Modern Aspects of Electrochemistry; Vayenas, C. G.; White, R. E.;
Gamboa-Aldeco, M. E., Eds.; Springer: New York, 2008; pp. 89–189.
(8) Zhu, W.; Michalsky, R.; Metin, O.; Lv, H.; Guo, S.; Wright, C. J.; Sun, X.;
Peterson, A. A.; Sun, S. J. Am. Chem. Soc. 2013, 135, 16833.
(9) Chen, Y.; Li, C. W.; Kanan, M. W. J. Am. Chem. Soc. 2012, 134, 19969.
(10) Kauffman, D. R.; Alfonso, D.; Matranga, C.; Qian, H.; Jin, R. J. Am. Chem. Soc.
2012, 134, 10237.
(11) Wynblatt, P.; Gjostein, N. Prog. Solid State Chem. 1975, 9, 21.
(12) Baker, R. J. Catal. 1982, 78, 473.
(13) Hussain, I.; Graham, S.; Wang, Z.; Tan, B.; Sherrington, D. C.; Rannard, S. P.;
Cooper, A. I.; Brust, M. J. Am. Chem. Soc. 2005, 127, 16398.
(14) Love, J. C.; Estroff, L. A.; Kriebel, J. K.; Nuzzo, R. G.; Whitesides, G. M. Chem.
Rev. 2005, 105, 1103.
(15) Kuhl, K. P.; Cave, E. R.; Abram, D. N.; Jaramillo, T. F. Energy Environ. Sci.
2012, 5, 7050.
(16) Brust, M.; Walker, M.; Bethell, D.; Schiffrin, D. J.; Whyman, R. J. Chem. Soc.,
Chem. Commun. 1994, 7, 801.
(17) Oudar, J. Catal. Rev. Eng. 1980, 22, 37.
(18) Witten, T.; Sander, L. Phys. Rev. Lett. 1981, 47, 1400.

32
(19) Meakin, P. Phys. Rev. Lett. 1983, 51, 1119.
(20) Meakin, P. Phys. Lett. A 1985, 107A, 269.
(21) Mandelbrot, B. B. The Fractal Geometry of Nature; W. H. Freeman and Company:
New York, 1982.
(22) Meakin, P. Annu. Rev. Phys. Chem. 1988, 39, 237.
(23) Yang, D.; Wilde, C.; Morin, M. Langmuir 1996, 12, 6570.
(24) Widrig, C.; Chung, C.; Porter, M. J. Electroanal. Chem. 1991, 310, 335.
(25) Byloos, M.; Al-Maznai, H.; Morin, M. J. Phys. Chem. B 1999, 6554.
(26) Yabroff, D. Ind. Eng. Chem. 1940, 32, 257.
(27) Emmet, E. E. Organic Chemistry of Bivalent Sulphur; Chemical Publishing
Company: New York, 1958.

33
Chapter 4.
Tunable localized surface plasmon resonances in tungsten oxide
nanocrystals
Reproduced in part with permission from: Karthish Manthiram and A. Paul Alivisatos,
“Tunable Localized Surface Plasmon Resonances in Tungsten Oxide Nanocrystals,”
Journal of the American Chemical Society 2012, 134, 3995-3998. Copyright 2012 by
American Chemical Society.
Transition-metal oxide nanocrystals are interesting candidates for localized surface
plasmon resonance hosts because they exhibit fascinating properties arising from the
unique character of their outer-d valence electrons. WO3-δ nanoparticles are known to
have intense visible and near-IR absorption, but the origin of the optical absorption has
remained unclear. Here we demonstrate that metallic phases of WO3-δ nanoparticles
exhibit a strong and tunable localized surface plasmon resonance, which opens up the
possibility of rationally designing plasmonic tungsten oxide nanoparticles for light
harvesting, bioimaging, and sensing.
4.1. Free charge-carriers confined in nanoscale transition metal oxides
Free charge-carriers that are dielectrically confined to a nanoparticle at sufficient density
participate in resonant, collective oscillations known as localized surface plasmon
resonances (LSPRs). There is a dramatic enhancement in the optical field in the vicinity
of a plasmonic nanoparticle, which provides for unprecedented control over light-induced
excitations at length scales smaller than the diffraction limit. This control has led to the
development of plasmonic nanoparticles tailored for applications as diverse as
biosensing,1 cancer photothermal therapy,2 and light-harvesting in photovoltaics.3
The vast majority of investigations of LSPRs have been conducted on noble metals, as
they are stable under a wide range of conditions and have a high charge carrier density.
LSPRs have also been reported in heavily doped semiconductor nanocrystals, including
tin oxide, 4 - 7 copper chalcogenides, 8 - 11 and zinc oxide. 12 LSPRs in heavily doped
semiconductors are unique because the LSPR energy may be tuned by adjusting the
doping or stoichiometry, providing an additional means of tuning the optical properties
that is not as readily available in metals.13
Transition-metal oxides (TMOs) are interesting candidates for LSPR hosts because they
exhibit fascinating properties arising from the unique character of the outer-d valence
electrons.14 Some of the hallmarks of TMOs include metal-insulator transitions, high-
temperature superconductivity, fast ionic transport, and colossal magnetoresistance,
which have led to unique applications in the areas of microelectronics, quantum
computing, spintronics, and energy conversion and storage. We expect that the exotic
properties of TMOs will lead to distinctive plasmonic effects at the nanoscale. For
instance, metal-insulator transitions, which have been well-studied in TMOs, may be
leveraged to generate LSPRs that are switchable in response to a variety of stimuli,

34
including temperature, pressure, and composition. In fact, a temperature-switchable
LSPR has been identified in vanadium dioxide.15 An LSPR has also been identified in
rhenium trioxide, 16 but the tunability of its charge carrier density has not been
demonstrated; in addition, rhenium is among the most expensive metals, which limits
practical applications.
4.2. Polaronic and plasmonic absorption in tungsten oxide
Tungsten oxide nanocrystals are a system of particular interest for the study of tunable
plasmon resonances in nanoparticles, as tungsten oxide is stable under a wide range of
conditions and has a band gap of 2.6 eV, which is ideal for absorption of visible light.
These properties have led to the use of tungsten oxide as an anode in
photoelectrochemical cells for water splitting.17 In the bulk, tungsten oxide exhibits a
strong color change upon intercalation of small ions such as Li+ or H+ or due to oxygen
deficiency.18 In the case of WO3-δ, which generally has a strong blue color, a variety of
oxygen-deficient stoichiometries can be obtained, e.g., WO2.72 (W18O49), WO2.8 (W5O14),
WO2.83 (W24O68), and WO2.9 (W20O58). These are ordered phases with precise
stoichiometries. For 0 < δ < 0.1 in bulk WO3-δ, the electrical and optical properties are
dominated by localized electrons involved in polarons, which are quasiparticles
consisting of a charge carrier and its polarization field in a lattice. Bulk WO3-δ undergoes
a metal-insulator transition at δ = 0.1, as the localized polaronic wave functions begin to
overlap and form delocalized states.19 As a result, for δ > 0.1 in bulk WO3-δ, the electrical
and optical properties are dominated by free electrons. The metal-insulator transition has
been firmly established in bulk WO3-δ by a combination of temperature-dependent
conductivity measurements,20 reflectivity measurements of the bulk plasma frequency,21
and X-ray photoelectron spectroscopy (XPS).22 Thus, there is a wide range of known
phenomena from the bulk that may exhibit interesting size- and shape-dependent
behavior at the nanoscale.
To date, studies of nanoscale WO3-δ have led to some contradictory results. For instance,
WO2.72 (W18O49) nanowires appear to be semiconducting on the basis of electrical
transport23 and photoluminescence studies;24 it has been proposed that the blue color of
nanoscale WO2.72 may arise from polaron hopping. In contrast, WO2.8 (W5O14) nanowires
appear to be metallic on the basis of XPS and electrical transport measurements;25 this
material is also blue, but the origin of its optical absorption has not been discussed in the
literature. We demonstrate in this communication that nanoscale WO2.83 (W24O68) can
support strong LSPRs and that these LSPRs account for a strong absorption feature
ranging from the red edge of the visible to the near-IR (NIR).
4.3. Synthesis of structural characterization of tungsten oxide nanorods
WO2.83 nanorods were prepared by hot injection of tungsten(V) ethoxide into a solvent
mixture of oleic acid and trioctylamine at 315 oC under an inert atmosphere (Appendix
A.3).26 The recovered product exhibited a strong blue color (Figure 4.1a). Transmission
electron microscopy (TEM) revealed a rod-like morphology (Figure 4.1b) with an
average width of 5.4 nm and an average length of 62 nm (Appendix A.3). X-ray

35
diffraction (XRD) demonstrated that the particles have the monoclinic structure of
W24O68 (Figure 4.1c), which corresponds to a stoichiometry of WO2.83.27 Like many
nonstoichiometric TMOs, WO3-δ has rich phase behavior, and the particular phase that is
obtained depends significantly on the synthetic conditions used.
Figure 4.1. Morphology and structure of tungsten oxide nanorods. (a) Photograph of
WO2.83 nanorods in N-methylpyrolidone. (b) TEM micrograph of WO2.83 nanorods. (c)
XRD pattern of WO2.83 nanorods (top) and the reference pattern for WO2.83 (bottom).
4.4. Optical characterization of tungsten oxide nanorods
The optical absorption spectrum of our WO2.83 nanorods has a peak centered at
approximately 900 nm (Figure 4.2a). We used Mie-Gans theory28 to predict the LSPR
spectrum that we would expect for our WO2.83 nanorods. The LSPR absorbance A of a
solution of nanorods is given by
(4.1)
where ω is the angular frequency of incident light, εm is the dielectric constant of the
medium, ε1 and ε2 are the real and imaginary parts, respectively, of the dielectric function
ε(ω) of WO2.83, and the Pj are the depolarization factors for axes A, B, and C of the rod
(A is the long axis, while B and C are the short axes). We assume that axes B and C have
the same width for a rod. The depolarization factors in eq. 4.1 are given by:

36
(4.2)
(4.3)
The geometric parameter s that appears in eq. 4.2 is
(4.4)
where R is the aspect ratio of the rods. We approximate the dielectric function ε(ω) of
WO2.83 in eq. 4.1 as that of a free-electron gas in the energy range of interest:
(4.5)
where ωp is the bulk plasma frequency and γ is the collision frequency. The bulk plasma
frequency ωp in eq. 4.5 is
(4.6)
where N is the charge carrier density, e is the elementary charge, ε o is the permittivity of
free space, and me is the effective mass of an electron. The collision frequency γ in eq.
4.5 is given by
(4.7)
where τ is the scattering time of an electron and σ is the conductivity. We had to estimate
several of the parameters in the above equations in order to calculate the LSPR spectrum
of our WO2.83 nanorods. From the TEM images of our nanorods, we know that the aspect
ratio is R = 11 (Appendix A.3). If it is assumed that each oxygen vacancy generates two
electrons, the charge carrier density in WO2.83 is N = 6.3*1021 1/cm3. The effective mass
of WO3-δ has been found to be in the range of mo to 1.4mo, where mo is the rest mass of
an electron; hence, we used me = 1.2mo.29 The conductivity of WO2.83 has been
previously measured to be σ = 2*103 1/( cm).19
Using eq. 4.1, the parameters defined in eqs. 4.2-4.7, and the assumptions defined above,
we calculated the absorption spectrum of WO2.83 nanorods (Figure 4.2a). We found that
Mie-Gans theory predicted the short-axis mode of WO2.83 nanorods in N-
methylpyrrolidone to occur at a wavelength of 860 nm, which is remarkably close to the
experimentally observed wavelength of 900 nm. We expect that the experimentally
observed short-axis mode is broader than predicted by Mie-Gans theory because of

37
sample inhomogeneity and damping of the plasmon arising from surface scattering of
electrons.30
Figure 4.2. Optical absorption of tungsten oxide nanorods. (a) Comparison of
experimentally observed and theoretically predicted absorption spectra of the short-axis
mode of WO2.83 rods in N-methylpyrrolidone. (b) Experimentally observed short-axis
LSPR wavelength as a function of refractive index of solvent.
In a rod-shaped sample, the long-axis mode is ordinarily the easier mode to observe
because of strong coupling to the electromagnetic field. However, in this case, the
absorption due to the long-axis mode is expected to occur at very low energy and to be
quite broad, rendering it difficult to observe; in fact, our calculations suggested that for a
high enough aspect ratio, the long-axis mode does not exhibit a maximum in absorption
(Appendix A.3). In contrast, the short-axis mode is quite strong and readily observable in
the near-IR to visible regime.
The observed decrease in the LSPR energy with increasing refractive index of the
medium is consistent with what we would expect for an LSPR (Figure 4.2b). The
magnitude of the experimentally observed shift in the LSPR energy as the solvent was
changed from methanol to N-methylpyrrolidone was 40 nm, which is smaller than the
shift of 60 nm predicted using eq. 4.1. This is reasonable since the solvent may not have
complete access to the surface of the particle because of ligand coverage, leading to a
weaker dependence of the LSPR energy on the solvent refractive index. Chemical
interactions between the solvent and nanoparticle surface can also contribute to
differences between the experimental and theoretical LSPR shifts. The complex effect of
steric and chemical interactions on the magnitude of the LSPR shift has been well-

38
established for gold nanoparticles.31 In addition, if some population of electrons are still
involved in a polaronic transition,19 there may be a polaronic contribution to the optical
absorption in WO2.83, which would also reduce the magnitude of the observed shift in the
LSPR energy.
4.5. Tunability of plasmon mode of tungsten oxide nanorods
The plasmon energy of WO2.83 particles could be tuned by heating in an oxidizing
environment. When a solution of particles in N-methylpyrolidone was heated at 175 oC in
air, we observed a red shift and a decrease in the intensity of the plasmon (Figure 4.3a).
We expect that the plasmon is red shifted and reduced in intensity due to the
incorporation of oxygen into the lattice, leading to a decrease in the carrier concentration.
We did not observe the same effect when the solution was heated under an argon
atmosphere, suggesting that oxygen plays a key role in this process. The observed blue
shift in the band-gap absorption upon heating (Figure 4.3a) is also consistent with oxygen
incorporation, as it has been previously observed that the band gap of WO3-δ is blue-
shifted with decreasing δ. XRD of the heated particles suggested that they have a
disordered structure (Figure 4.3b), which demonstrates that although oxygen may enter
the structure at a low temperature and annihilate the charge carrier, the particles do not
fully retain their crystallinity. The disorder may also decrease the effective mass of the
electron, further red-shifting the LSPR energy.
Figure 4.3. Tunability of optical absorption. (a) UV-vis-NIR absorption spectra of
WO2.83 nanorods in N-methylpyrrolidone upon heating at 175 oC in air for 0, 2, and 6
min. (b) XRD pattern of WO2.83 nanorods in N-methylpyrrolidone (top) before and
(middle) after heating at 175 oC for 6 min in air and (bottom) the reference pattern for
WO2.83 (bottom).

39
The short-axis mode of the WO2.83 nanorods exhibited a high plasmonic sensitivity of 280
nm per refractive index unit (nm/RIU), which is comparable to those of silver nanoprisms
(200 nm/RIU for prisms of 50 nm height and 100 nm width),32 gold nanoshells (130 to
360 nm/RIU for nanoshell thickness to core radius ratios of 3 to 0.1, respectively),33 and
spherical Cu2-xS (350 nm/RIU).8 Normalizing the plasmonic sensitivity by the LSPR line
width gave a sensing figure of merit of 0.5. The quality factor, defined as the ratio of the
LSPR energy to the line width was 1.6, which is less than those of gold and silver
nanostructures. 34 The quality factor serves as an indicator of the local electric field
enhancement. As a result, the electric field in the vicinity of a WO2.83 nanoparticle is
expected to be weaker than that of gold and silver nanoparticles.
4.6. Conclusion
The high energy of the WO2.83 LSPR relative to other identified semiconductor LSPRs,
which arises from the high charge carrier density of N = 6.3*1021 1/cm3, opens up many
practical applications for semiconductor plasmons in the areas of bioimaging, sensing,
and light harvesting. The plasmon energy of WO2.83 is especially desirable for in vivo
bioimaging, as it falls in the “therapeutic window” in which light has a large penetration
depth in tissue.35 In addition, nanostructured WO3-δ has been investigated for gas sensing
applications, as the selectivity for various gases can be tuned by adjusting the
stoichiometry of WO3-δ.36 With increasing interest in the use of nanostructured tungsten
oxide as an anode in photoelectrochemical cells, it will be important to pay attention to
how oxygen deficiency impacts its photocatalytic properties. Previous studies have used
nanostructured WO3-δ for photocatalysis, as it is stable under photocatalytic conditions
and its band gap may be tuned by changing the stoichiometry.37 The new understanding
of the LSPR mode present in WO2.83 may provide a better understanding of these
previous results and enable the rational design of new plasmonically enhanced tungsten
oxide nanostructures for bioimaging, sensing, and light harvesting.
4.7. References
(1) Jain, P. K.; Huang, X.; El-Sayed, I. H.; El-Sayed, M. A. Plasmonics 2007, 2, 107.
(2) West, J.L; Halas, N. J. Annu. Rev. Biomed. Eng. 2003, 5, 285.
(3) Atwater, H. A.; Polman, A. Nature Mater. 2010, 9, 205.
(4) Nutz, T.; Felde, U.; Haase, M. J. Chem Phys. 1999, 110, 12142.
(5) Kanehara, M.; Koike, H.; Yoshinaga, T.; Teranishi, T. J. Am. Chem. Soc. 2009,
131, 17736.
(6) Garcia, G.; Buonsanti, R.; Runnerstrom, E. L.; Mendelsberg, R. J.; Llordes, A.;
Anders, A.; Richardson, T. J.; Milliron, D. J. Nano Lett. 2011, 11, 4415.

40
(7) Li, S. Q.; Guo, P.; Zhang, L.; Zhou, W.; Odom, T. W.; Seideman, T.; Ketterson, J.
B.; Chang, R. P. H, ACS Nano, 2011, 11, 9161.
(8) Zhao, Y.; Pan, H.; Lou, Y.; Qiu, X.; Zhu, J.; Burda, C. J. Am. Chem. Soc., 2009,
131, 4253.
(9) Luther, J. M.; Jain, P. J.; Ewers, T.; Alivisatos, A. P. Nature Mater. 2011, 10, 361.
(10) Dorfs, D.; Hartling, T.; Miszta, K.; Bigall, N. C.; Kim, M. R.; Genovese, A.;
Falqui, A.; Povia, M.; Manna, L. J. Am. Chem. Soc. 2011, 133, 11175.
(11) Kriegel, I.; Jiang, C.; Rodriguez-Fernandez, J.; Schaller, R. D.; Talapin, D. V.;
Como, E.; Feldmann, J. J. Am. Chem. Soc. 2012, 134, 1583.
(12) Buonsanti, R.; Llordes, A.; Aloni, S.; Helms, B.; Milliron, D. J. Nano Lett. 2011,
11, 4706.
(13) Boltasseva, A.; Atwater, H. A. Science 2011, 331, 290.
(14) Goodenough, J. B. Prog. Solid State Chem. 1971, 5, 145.
(15) Rini, M.; Cavalleri, A.; Schoenlein, R. W.; Lopez, R.; Feldman, L. C.; Haglund, R.
F.; Boatner, L. A.; Haynes, T. E. Opt. Lett. 2005, 30, 558.
(16) Biswas, K.; Rao, C. N. R. J. Phys. Chem. B 2006, 110, 842.
(17) Hodes, G.; Cahen, D.; Manassen, J. Nature 1976, 260, 312.
(18) Deb, S. K. Sol. Energy Mater. Sol. Cells 1992, 25, 327.
(19) Salje, E.; Guttler, B. Phil. Mag. B 1984, 50, 607.
(20) Sahle, W.; Nygren, M. J. Solid State Chem. 1983, 48, 154.
(21) Viswanathan, K.; Brandt, K.; Salje, E. J. Solid State Chem. 1981, 36, 45.
(22) Gehlig, R.; Salje, E. J. Solid State Chem. 1983, 49, 318.
(23) Shi, S.; Xue, X.; Feng, P.; Liu, Y.; Zhao, H.; Wang, T. J. Cryst. Growth 2008, 310,
462.
(24) Su, C.-Y.; Lin, H.-C. J. Phys. Chem. C 2009, 113, 4042.
(25) Remskar, M.; Kovac, J.; Virsek, M.; Mrak, M.; Jesih, A.; Seabaugh, A. Adv. Func.
Mater. 2007, 17, 1974.

41
(26) Yella, A.; Tahir, M. N.; Meuer, S.; Zentel, R.; Berger, R.; Panthöfer, M.; Tremel,
W. J. Am. Chem. Soc. 2009, 131, 17566.
(27) Booth, J.; Ekstrom, T.; Iguchi, E.; and Tilley, R. J. D. J. Solid State Chem. 1982,
41, 293.
(28) Link, S.; Mohamed, M. B.; El-Sayed, M. A. J. Phys. Chem. B 1999, 103, 3073.
(29) Molenda, J.; Kubik A. Phys. Stat. Sol. 1995, 191, 471.
(30) Alvarez, M. M.; Khoury, J. T.; Schaaff, T. G.; Shafigullin, M. N.; Vezmar, I.;
Whetten, R. L. J. Phys. Chem. B 1997, 101, 3706.
(31) Ghosh, S. K.; Nath, S.; Kundu, S.; Esumi, K.; Pal, T. J Phys. Chem. B. 2004, 108,
13963.
(32) Malinsky, M. D.; Kelly, K. L.; Schatz, G. C.; Van Duyne, R. P. J. Am. Chem. Soc.
2001, 123, 1471.
(33) Jain, P. K.; Huang, W.; El-Sayed, M. A. J. Phys. Chem C 2007, 111, 17451.
(34) Sonnichsen, C.; Franzl, T.; Wilk, T.; Plessen, G.; Feldman, J. Phys. Rev. Lett.
2002, 88, 77402.
(35) Richards-Kortum, R.; Sevick-Muraca, E. Annu Rev. Phys. Chem. 1996, 47, 555.
(36) Berger, O.; Hoffman, T.; Fischer, W.-J. J. Mater. Sci. 2004, 15, 483.
(37) Sun, S.; Chang, X.; Dong, L.; Zhang, Y.; Li, Z.; Qiu, Y. J. Solid State Chem. 2011,
184, 2190.

42
Chapter 5.
Redox tunability of the plasmonic mode of copper sulfide nanocrystals
Reproduced in part with permission from: Prashant K. Jain, Karthish Manthiram, Jesse
Engel, Sarah L. White, Jacob A. Faucheaux, and A. Paul Alivisatos, “Doped
semiconductor nanocrystals as plasmonic probes of redox chemistry,” Angewandte
Chemie International Edition 2013, 52, 13671-13675. Copyright 2013 by Wiley-VCH.
Copper chalcogenides have been extensively explored as light absorbers for
photovoltaics. We demonstrate how local chemical events in the vicinity of copper
sulfide nanocrystals can be probed through their perturbation of the carrier density and
plasmon mode. Examples demonstrate that redox processes and ligand chemistry can
induce changes in the vacancy density within copper (I) sulfide nanorods, allowing such
events to be detected by strong shifts in localized surface plasmon resonance.
5.1. Conventional plasmonic sensing through changes in refractive index
The use of nanostructured probes for chemical sensing has opened up the ability to detect
ultra-low analyte volumes and achieve nanoscale spatial resolution. Metal nanoparticles
exhibiting localized surface plasmon resonances (LSPRs) have been at the forefront of
this research1-5 for two reasons: (1) LSPR scattering can be routinely measured from
single nanoparticle probes and (2) the frequency of the LSPR band is highly sensitive to
the local refractive index (nm) around the nanoparticle as per the resonance condition:6,7
εr() = -2nm2 (5.1)
where εr is the real part of the metal dielectric function as a function of optical frequency
. Analytes, which induce a change in the local refractive index around the nanoparticle,
are detected via shifts in the frequency of the LSPR scattering band. The method, while
powerful, is limited: chemical events, which do not involve a large enough change in
refractive index, go undetected.
5.2. Semiconductor plasmons for sensing local chemical events via
changes in carrier concentration
Here, we describe LSPRs of doped semiconductor nanocrystals that are sensitive to redox
and ligand binding processes. We take advantage of the fact that the LSPR frequency is
proportional to the square root of the carrier concentration within the nanocrystal. We
show, using a few different examples, that chemical events occurring locally on the
nanocrystal can cause a change in the doping level and carrier concentration within the
nanocrystal, resulting in large shifts in the LSPR. The basis of this sensitivity is therefore
truly chemical, rather than refractive index-mediated, unlike conventional metal
nanoparticle-based plasmonic probes.

43
5.3. Copper sulfide nanorods offer improved plasmonic tunability
compared to metals
We employ nanorods of the semiconductor copper (I) sulfide, which the Alivisatos and
Burda groups have shown to exhibit near-infrared LSPRs due to heavy p-doping resulting
from a high level of copper vacancies. 8 , 9 Others have shown similar LSPRs in
nanocrystals of copper (I) selenide and copper (I) telluride. 10 - 16 LSPR tunability by
variation of the copper vacancy concentration has also been demonstrated by the
Alivisatos and Manna groups: the greater the vacancy concentration, the higher the LSPR
frequency.9,10 Metal nanoparticles do not possess such tunability since their free carrier
concentrations are large and difficult to perturb appreciably.
5.4. Chemistry of copper vacancies in copper sulfide
We exploit the well-known chemical sensitivity of copper (I) sulfide,17 which can be
summarized by the chemical reaction:18
Cu32S16 Cu32-nS16 + nCu0 (5.2)
The creation of one Cu vacancy per unit cell (n = 1) results in copper-deficient sulfide
(with a unit cell of Cu31S16), which is thermodynamically more stable, by -7.3 eV, than
the fully stoichiometric form (with a unit cell of Cu32S16). The reaction direction is,
however, dictated by the chemical potential of Cu (μCu) in the additional copper species
formed on the right. In general, conditions which stabilize copper (i.e. lower μCu) favor
the forward reaction involving the formation of copper vacancies and valence band holes.
For instance, copper is much more stable in the form of copper oxide compared to Cu0;
therefore, creation of copper vacancies is strongly favored (Figure 5.1a) in the presence
of air or other oxidants: 9
Cu32S16 + ½nO2 → Cu32-nS16 + nCuO (5.3)
Along with CuO, 12 Cu2O, known to be stable on the nanoscale19, may also be formed.
Reducing conditions, on the other hand, favor the backward reaction involving the filling
of copper vacancies (Figure 5.1b). Due to the high diffusivity of copper atoms in copper
(I) sulfide, a well-known solid-state ionic material, 20 reaction kinetics do not appear to be
a limiting factor, especially in nanocrystals.

44
Figure 5.1. Chemical sensitivity of copper (I) sulfide. (a) Conditions such as the
presence of oxidants like iodine favor the creation of copper vacancies resulting in holes
in the valence band of copper (I) sulfide. (b) Conditions such as presence of electron
donors like sodium biphenyl result in filling of the copper vacancies.
5.5. Ligand and redox mediated tuning of copper sulfide plasmons
In particular, we show that ligands such as alkylamines and oxidants such as iodine cause
p-doping of the copper sulfide nanorods, manifested by strengthening of the LSPR band
and a blue-shift. On the other hand, ligands such as thiols and electron donating reagents
such as sodium biphenyl reduce the p-doping level of the nanorods, resulting in a red-
shift and suppression of the LSPR. We corroborate by means of electrical measurements
that shifts in carrier concentrations are indeed the cause of the observed LSPR changes.
The p-type conductivity of copper (I) sulfide nanorod films is enhanced under oxidizing
conditions. Application of reducing conditions causes a reversal of the conductivity
increase. Our results suggest that doped semiconductor nanocrystals can be used for
plasmonic detection of chemical events such as charge transfer, redox chemistry, doping,
and ligand binding. In particular, the ability of common ligands such as amines and thiols
to electronically dope quantum dots is verified by taking advantage of the optical and
electrical sensitivity of the copper (I) sulfide system. We also characterize in detail
chemical changes that accompany redox chemistry and doping of nanocrystals.
5.6. Sensing copper extraction via increase in plasmon energy
Copper(I) sulfide nanorods used for the studies here were obtained by the cation
exchange of cadmium sulfide nanorods with excess Cu+ (Appendix A.4), a method
known to yield nanorods with negligible number of copper vacancies, 9 evidenced by the
low electrical conductivity of the nanorods and lack of plasmonic absorption in the near-
infrared region.
The equilibrium copper vacancy density and p-type doping of copper sulfide nanorods
can be increased by addition of ligands or oxidants. We hypothesized that the addition of
amines, which bind strongly to copper, should assist in extracting copper from the copper
sulfide lattice, thus pushing the equilibrium indicated in reaction I to the right. More

45
copper-deficient stoichiometries (Cu30S16, Cu29S16, and so on...) are also possible.21 Upon
addition of amine to stoichiometric copper sulfide nanocrystals, we observed that a strong
LSPR mode appeared. Copper appears to be removed from the lattice by way of
formation of a copper:amine complex, detected by its absorption band at ca. 680 nm
(Figure A.4.3b). The LSPR mode blue-shifted and increased in intensity upon each
subsequent addition of decylamine (Figure 5.2a), demonstrating the use of the LSPR to
monitor progressive changes in the carrier density.
Figure 5.2. LSPR detection of vacancies formed in copper (I) sulfide nanorods by
means of ligands or common oxidants. Addition of (a) decylamine or (b) iodine to fully
stoichiometric copper sulfide nanorods results in the emergence of an LSPR mode due to
the formation of copper vacancies and associated hole carriers. With increasing addition
of amine or iodine, the vacancy concentration increases as manifested by a progressive
blue-shift and increase in intensity of the LSPR band. The band-gap absorption onset and
excitonic peak also blue-shift as expected from an increase in free carrier concentration
(Moss-Burstein shift). The starting nanorods were prepared by the cation exchange of
CdS with Cu+ salt under air-free conditions, a method which yields fully stoichiometric
or vacancy-free Cu2S.
Given that copper extraction from copper sulfide is an oxidative process, we also
hypothesized that common oxidants, like iodine, should be capable of oxidative
extraction of copper ions from copper sulfide via formation of copper iodide as:
Cu32S16 + ½nI2 → Cu32-nS16 + nCuI (5.4)
The addition of iodine to copper sulfide nanorods led to the emergence of an LSPR mode,
which gradually blue-shifted and increased in intensity upon incremental iodine additions
(Figure 5.2b). The ca. 1 eV peak position of the LSPR mode achieved by the addition of
200 µM iodine corresponds to a stoichiometry of Cu29S16 or Cu1.8S (Appendix A.4),
known to be the digenite phase. Concomitant to copper extraction, copper iodide was

46
formed as verified by the appearance of its characteristic absorption band at 410 nm
(Appendix A.4).
Thus, both oxidative and non-oxidative copper extraction can be detected via blue-shifts
in the LSPR band. Upon copper extraction, the band-edge absorption also blue-shifts,
known as a Moss-Burstein shift, as expected from an increase in the free carrier
concentration within the nanocrystals. 9
5.7. Sensing copper insertion via decrease in plasmon energy
Just as the equilibrium of reaction 5.2 can be driven to the right by addition of ligands or
oxidants, we expected that the equilibrium could also be shifted to the left by addition of
reducing agents. Thiols are known to be mild reducing agents; incremental addition of
undecanethiol to air-oxidized copper(I) sulfide nanorods drove the filling of copper
vacancies, as evidenced by a gradual shift in the LSPR to lower energies and a reduction
in the intensity of the mode. A possible mechanism can involve either disulfide formation
or co-ordination of the thiol to metal atoms on the nanocrystal surface as:
Cu32-nS16 + nCuO + 2nRSH → Cu32S16 + nRS-SR + nH2O (5.5)
Cu32-nS16 + nCuO + 2nRSH → Cu32S16 + 2nRS-surface bound + nH2O (5.6)
Similarly, addition of strong reducing agents such as sodium biphenyl (Figure 5.3b) also
resulted in a red-shift and suppression of the LSPR band. Sodium biphenyl has been
shown to inject electrons into nanocrystals22 which serves to reverse the hole vacancies in
the lattice (Figure 5.1b), although it is unclear as to whether the vacancy is filled by a
sodium ion or a copper ion: 23
Cu32-nS16 + nNa(C6H5-C6H5) → Cu32-nNanS + n(C6H5-C6H5) (5.7)
Cu32nS16 + nCuO + 2nNa(C6H5-C6H5) → 2nNa2O + Cu32S16 + 2n(C6H5-C6H5)
(5.8)
The absorption band-edge also shifted to lower energies upon addition of either reducing
agent, as expected from a decrease in the carrier concentration within the nanocrystals.
Complete reversal to Cu2S did not appear possible (Figure 5.3a), at least with the mildly
reducing thiol. Near-complete suppression of the LSPR was, however, observed (Figure
A.4.4) with the stronger reducing ability of sodium biphenyl and another reagent
cobaltocene, probably when employed in excess. 24 Copper oxide or copper iodide could
present a physical barrier, in the form of a thick shell over the nanorod, or a chemical
barrier against complete vacancy filling. Also, copper oxide and iodide are p-type
semiconductors, whose electronic properties can complicate plasmonic spectra of the
nanorods. But, the influence of a copper oxide or iodide shell on the NIR LSPR of the
nanorods is estimated to be a small non-resonant dielectric effect, since both these
semiconductors have band-to-band transitions in the visible region (Figure A.4.5). Also,

47
the hole-density of either p-type semiconductor is not adequate to support a NIR
intraband absorption or LSPR of its own.
Figure 5.3. LSPR detection of vacancy filling in copper (I) sulfide nanorods by (a)
reduction with thiol or (b) electron injection with sodium biphenyl. The addition of
undecanethiol or sodium biphenyl to a solution of copper (I) sulfide nanorods results in a
progressive red-shift of the LSPR mode and a reduction in its intensity. A concomitant
red-shift of the band-edge absorption onset is also seen, i.e., a reverse Moss-Burstein
shift. These effects are a manifestation of the progressive filling of vacancies in the
nanorod lattice, due to the reducing ability of the thiol or the electron injecting ability of
the sodium biphenyl. Note, features around 0.72 eV, 0.87 eV, and 1.0 eV are due to
ligand/thiol vibrational absorption. The sharp step at 1.5 eV is an instrumental artifact
due to a spectrophotometer grating change. Copper-deficient copper (I) sulfide nanorods
were prepared by oxidation of fully stoichiometric Cu2S nanorods in air. Reduction
experiments were carried out in air-free environment in tetrachloroethylene or carbon
tetrachloride, solvents with low near-infrared absorbance. The concentration of
undecanethiol or sodium biphenyl added to achieve complete reversal was ca. 100 mM.
Electrical measurements serve to directly confirm that the chemical events responsible
for LSPR changes indeed modulate the doping level and carrier concentration within the
nanocrystal.25 The conductivity of a nanocrystal film scales monotonically with the free
carrier concentration of the effective media:
= N e μ (5.9)
where N is the majority free carrier density, e is the elemental charge, and μ is the free
carrier mobility. Equation 5.9 assumes ohmic conduction and carrier concentration-
independent mobility, which are reasonable approximations for a heavily doped transistor
device.26 Moreover, regardless of the assumptions, conductivity still varies monotonically
with the free carrier concentration.

48
5.8. Electrical measurements confirm carrier behavior
We investigated the effects of redox doping on the electrical properties of nanorod films
through field-effect transistor (FET) measurements. Films of freshly exchanged copper
(I) sulfide nanorods were drop-cast from solution onto highly doped silicon substrates
with 300 nm of thermally grown gate oxide and patterned gold contacts. Film thicknesses
were estimated at ~150 ± 50 nm from profilometry. After drop-casting, films were
initially soaked in a solution of 1 mM ethanethiol (EtSH) in ethanol to permit exchange
with the native long-chain oleic acid or phosphonic acid ligands, decrease interparticle
spacing, and increase conductivity.27 Typical for heavy doping, films exhibited large
linear conductivity and no transconductance modulation with applied gate voltage,
prohibiting the extraction of field-effect mobilities (Appendix A.4).
As shown in Fig. 3a, the small-field (10 mV source-drain) conductivity of the initial film
increases dramatically upon exposure to air, rising over two orders of magnitude over 40
hours as oxygen creates copper vacancies within the nanocrystals (reaction 5.3). Fig. 3b
demonstrates a complete reversal of this trend upon soaking of the film in 1 mM
ethanolic solution of EtSH, a reducing agent. These oxidation and reduction steps are
shown to be reversible and repeatable (Figure 5.4c), exhibiting near identical response
upon consecutive treatments. In nanoparticle films treated with thiols, oxidation can often
lead to a lowering of effective mobility as surface oxides can increase quantum
confinement and edge-edge hopping distances. 26 While it is infeasible to deconvolute
changes in mobility and carrier concentration for these heavily doped films, the changes
in conductivity likely represent a lower bound for the relative changes in doping level. If
the redox processes do introduce changes in effective mobility, they also must be
reversible, as Figure 5.4c shows the conductivity to be sequentially reversible on the
same device. Irreversible chemical changes likely do not play a large role in these
treatments, demonstrating the thermodynamic nature of copper vacancy formation and
reversal.

49
Figure 5.4. Reversible formation and filling of vacancies in copper (I) sulfide
nanorod films probed electrically. The small-field conductivity of copper (I) sulfide
nanorod thin-film FETs (a) increases over two orders of magnitude upon exposure to air
and (b) completely reverses upon soaking in a solution of 1 mM ethanethiol (EtSH) in
ethanol. (c) Conductivity measurements on a single device demonstrate reversible
vacancy-formation and filling via sequential oxidation and reduction steps. For the
measurements, films were initially soaked in EtSH solution to displace long-chain ligands
and boost interparticle conductivity. The oxidation steps were performed in air with
continuous measurement on an open-air probe station. The reduction steps were
performed in an argon glovebox. Conductance was measured between patterned gold
contacts with channel lengths of 10 µm and widths of 250 µm.
5.9. Sensing of single chemical events using semiconductor plasmons
A doped semiconductor nanocrystal may potentially be used to achieve plasmonic
detection of a single molecule or a single chemical event. This is possible by using a
nanocrystal of small-enough size. For instance, in a 4-nm nanocrystal, which has a
volume of 34 nm3, creation of a single copper vacancy is equivalent to an increase dN in
the carrier concentration by 3 x 1019 cm3. For a nominally copper-deficient nanocrystal,
with a carrier concentration N of 1.5 x 1021 cm3, this is equivalent to a 2% increase in
carrier concentration. Since the LSPR wavelength is related to carrier concentration as:7
(5.10)

50
we have:
(5.11)
Thus, the formation of a single copper vacancy would result in a blue-shift in the LSPR
wavelength by 1%, which is about 15-20 nm in the 2- μm spectral region. Such shifts can
be measured without difficulty, allowing quantized events to be detected on a
nanocrystal. While the acquisition of single-particle LSPR scattering spectra in the near-
infrared remains a challenge, the approach is feasible, in principle.
5.10. Conclusion
In summary, our work demonstrates qualitatively the ability to use semiconductor
nanocrystals for plasmonic probing of processes such as redox reactions, electrochemical
charging or discharging, ligand binding, and impurity doping occurring in nanoscale
volumes. In the past, such probing has been carried out by means of electrical detection
on nanostructures, 28 to which optical detection serves as a complimentary method.
Detection of single-molecule events also seems feasible by use of small nanocrystals.
Given the promise, there is a need to explore a wider range of chemical and redox
processes beyond the limited examples we have provided in the current work.
5.11. References
(1) Sun, Y.; Xia, Y. Anal. Chem. 2002, 74, 5297–5305.
(2) McFarland, A. D.; Van Duyne, R. P. Nano Lett. 2003, 3, 1057-1062.
(3) Tam, F.; Moran, C.; Halas, N. J. J. Phys. Chem. B 2004, 108, 17290–17294.
(4) Willets, K. A.; Van Duyne, R. P. Annu. Rev. Phys. Chem. 2007, 58, 267-97.
(5) Yan, B.; Boriskina, S. V.; Reinhard, B. M. J. Phys. Chem. C, 2011, 115, 24437-
24453.
(6) Underwood, S.; Mulvaney, P. Langmuir 1994, 10, 3427–3430.
(7) Jain, P. K.; El-Sayed, M. A. J. Phys. Chem. C 2007, 111, 17451–17454
(8) Zhao, Y.; Pan, H.; Lou, Y.; Qiu, X.; Zhu, J.; Burda, C. J. Am. Chem. Soc. 2009,
131, 4253–4261.
(9) Luther, J. M.; Jain, P. K.; Ewers, T. E.; Alivisatos, A. P. Nature Mater. 2011, 10,
361-366.

51
(10) Choi, J.; Kang, N.; Yang, H. Y.; Kim, H. J.; Son, S. U. Chem. Mater. 2010, 22,
3586–3588.
(11) Hessel, C. M.; Pattani, V. P.; Rasch, M.; Panthani, M. G.; Koo, B.; Tunnell, J. W.;
Korgel, B. A. Nano Lett. 2011, 11, 2560–2566.
(12) Dorfs, D.; Härtling, T.; Miszta, K.; Bigall, N. C.; Kim, M. R.; Genovese, A.;
Falqui, A.; Povia, M.; Manna, L. J. Am. Chem. Soc. 2011, 133, 11175–11180
(13) Scotognella, F.; Valle, G. D.; Kandada, A. R. S.; Dorfs, D.; Zavelani-Rossi, M.;
Conforti, M.; Miszta, K.; Comin, A.; Korobchevskaya, K.; Lanzani, G.; Manna, L.;
Tassone, F. Nano Lett., 2011, 11, 4711–4717.
(14) Routzahn, A. L.; White, S. L.; Fong, L.-K.; Jain, P. K. Israel J. Chem. 2012, 52,
983-991.
(15) Kriegel, I.; Jiang, C.; Rodríguez-Fernández, J.; Schaller, R. D.; Talapin, D. V.; da
Como, E.; Feldmann, J. J. Am. Chem. Soc. 2012, 134, 1583–1590.
(16) Kriegel, I.; Rodríguez-Fernández, J.; Wisnet, A.; Zhang, H.; Waurisch, C.;
Eychmüller, A.; Dubavik, A.; Govorov, A. O.; Feldmann, J. ACS Nano, 2013, 7,
4367-4377.
(17) Lotfipour, M.; Machani, T.; Rossi, D. P.; Plass, K. E., Chem. Mater. 2011, 23,
3032-3038.
(18) Lukashev, P.; Lambrecht, W. R. L.; Kotani, T.; van Schilfgaarde, M. Phys. Rev. B
2007, 76, 195202.
(19) Yin, M.; Wu, C.-K.; Lou, Y.; Burda, C.; Koberstein, J. T.; Zhu, Y.; O’Brien, S. J.
Am. Chem. Soc. 2005, 127, 9506-9511.
(20) Knauth, P.; Tuller, H. L. J. Am. Ceram. Soc. 2002, 85, 1654-1680.
(21) Putnis, A. Am. Mineralogist 1977, 62, 107-l 14.
(22) Shim, M.; Guyot-Sionnest, P. Nature 2000, 407, 981-983.
(23) Kim, J. S.; Kim, D.-Y.; Cho, G.-B.; Nam, T.-H.; Kim, K.-W.; Ryu, H.-S.; Ahn, J.-
H.; Ahn, H. J. J. Power Sources 2008, 189, 864-868.
(24) Koh, W.-K.; Koposov, A. Y.; Stewart, J. T.; Pal, B. N; Robel, I.; Pietryga, J. M.;
Klimov, V. I. Sci. Rep. 2013, 3, 2004.
(25) Klem, E. J. D.; Shukla, H.; Hinds, S.; MacNeil, D. D.; Levina, L.; Sargent, E. H.
Appl. Phys. Lett. 2008, 92, 212105.
52
(26) Zarghami, M. H.; Liu, Y.; Gibbs, M.; Gebremichael, E.; Webster, C.; Law, M.
ACS Nano 2010, 4, 2475–85.
(27) Luther, J. M.; M. Law, M.; Song, Q.; Perkins, C. L.; Beard, M. C.; Nozik, A. J.
ACS Nano 2008, 2, 271–80.
(28) Cui, Y.; Wei, Q.; Park, H.; Lieber, C. M. Science 2001, 293, 1289-1292.

53
Appendix.
A.1. Supporting information for enhanced electrochemical methanation
of carbon dioxide with a dispersible nanoscale copper catalyst
Synthesis of copper nanoparticles
Copper nanoparticles capped with tetradecylphosphonate and suspended in hexane were
synthesized following a literature method.1 Briefly, 10 mL of trioctylamine (Sigma
Aldrich, 98%) was heated in a 25 mL three neck flask equipped with a condenser and stir
bar to 130 oC under argon for 1 h in order to dry the solvent. The trioctylamine was then
cooled to room temperature; while keeping the flask purged with argon,123 mg of copper
(I) acetate (Sigma Aldrich, 97%) and 139 mg of n-tetradecylphosphonic acid (TCI
Synthesis, Lot No. 808002N09) were added to the trioctylamine. The solution was then
rapidly heated to 180 oC under argon, swirled briefly to release any precursors adhered to
the walls of the flask, and kept at this temperature for 30 min. The solution was rapidly
heated to 270 oC and held at that temperature for 30 min. After cooling to room
temperature, the copper particles were removed using air-free techniques and transferred
to a glovebox. Just prior to electrode fabrication, 0.15 mL of the as-synthesized particles
in trioctylamine was diluted with 0.75 mL of hexane, and then precipitated by adding 1.4
mL of isopropanol, under air-free conditions. The particles were separated by
centrifuging at 8000 rpm for 8 min. The solvent was decanted under ambient conditions,
and the particles were resuspended in 1 mL of hexane by vortexing. The volume of
hexane in which the particles are resuspended can be changed in order to optimize the
particle loading on glassy carbon; this is critical for achieving high methanation yields.
Glassy carbon plates (Type 2, Alfa Aesar) with 5.2 cm2 of active surface area were
polished using 1 μm alpha alumina (CH Instruments) and 50 nm gamma alumina (CH
Instruments). The plates were rinsed with Milli-Q water, sonicated briefly, and blown dry
with nitrogen. 600 μL of copper nanoparticles suspended in hexane were deposited on the
substrate, which was then spun at 1000 rpm on a spin-coater for 60 s. 600 μL of ethanol
was deposited on the substrate, which was allowed to sit for 30 s, and then spun at 1000
rpm for 60 s. Then, for trimethylsilyl chloride-treated electrodes, the substrate was
covered in 600 μL of 2 wt % trimethylsilyl chloride in hexane and spun at 1000 rpm for
60 s, which was repeated once; then, the substrate was covered in 600 μL of ethanol and
spun at 1000 rpm for 60 s, which was also repeated once.
Fabrication of evaporated copper electrodes
Glassy carbon plates were polished as described above. A thermal evaporator (Edwards
Auto 500, FTM7) in an argon glovebox was used to evaporate copper films on the glassy
carbon, using a high-purity copper source (99.9999%, Alfa Aesar). The films ranged in
thickness from 3 to 21 nm, as measured using a quartz crystal monitor, and were
deposited at a rate of approximately 3 nm/min. The plates were transferred under ambient
conditions for use in the electrochemical cell.

54
Preparation of copper foil electrodes
High-purity copper foils were wet-sanded using 1500 grit sandpaper (Norton Blackice),
rinsed with Milli-Q water, dipped in 8% nitric acid for 30 s, rinsed again with Milli-Q
water, and then blown dry with nitrogen.
Microscopy of electrodes
As synthesized copper nanoparticles were imaged by drop-casting on a TEM grid
(Electron Microscopy Sciences, CF-400-Cu) and acquiring images on a 200 kV Tecnai
G2 20 S-TWIN with a Gatan SC200 CCD camera. After polarization, glassy carbon
electrodes were rinsed with Milli-Q water and blown dry with nitrogen. Particles were
transferred from the glassy carbon electrode to a TEM grid by placing a grid on top of the
electrode and applying pressure to the grid using a glass microscope slide for a few
seconds. SEM images of electrodes were acquired using a Zeiss Ultra 55 field emission
scanning electron microscope with an InLens detector, 5 kV accelerating voltage, and 5
mm working distance.
Electrochemical methods
Electrochemical measurements were conducted in a two-compartment electrochemical
flow cell fabricated from polychlorotrifluoroethylene (Kel-F), similar to a design used in
the literature.2 The working electrode compartment and counter electrode compartment,
which each had an electrolyte volume of 5 mL and a gas headspace of ~1 mL, were
separated by a Selemion membrane (AMV, AGC Engineering). A Ag/AgCl reference
electrode (BASi, RE-6), which was stored in saturated KCl when not in use, was used; all
measured potentials were converted to the RHE scale. The current densities measured for
nanoparticle electrodes were normalized by the copper surface area; the surface area was
determined by measuring the diameter of particles using SEM and calculating their
surface area by treating them as spheres. For copper foils, the geometric surface areas
were used, such that the reported current densities serve as upper bounds for the activity
of copper foils. 0.1 M NaHCO3 in Milli-Q water was used as the electrolyte, which was
prepared by bubbling CO2 (Praxair, CD M-50, >99%) through a solution of half the
molarity of Na2CO3 (99.9999%, Sigma Aldrich), producing a solution of pH 6.8 after
approximately 2 h. The electrochemical cell was continuously purged with CO2 at a flow
rate of 20 mL/min and a pressure of 1.2 atm; cells were purged for at least 5 min
following assembly and before electrochemical polarization. For the experiments where
CO2 partial pressure was varied, the total flow rate and pressure of CO2 were kept
constant, while adding in a diluent stream of argon. Potentiostatic experiments were
conducted by stepping to the desired potential, holding at that potential for 10 min, and
sending a sample to the gas chromatograph (SRI Instruments, MG #3 Configuration) at
the end of the 10 min interval. The gas chromatograph was equipped with TCD and FID
detectors, a methanizer, and Molsieve 13x and Hayesep D columns.

55
Morphological evolution in the absence of carbon dioxide
We polarized copper nanoparticles supported on glassy carbon in 0.1 M potassium
phosphate buffer (pH 7) under argon gas in order to understand how the morphological
evolution proceeds in the absence of carbon dioxide; we find that the final morphology is
similar with and without carbon dioxide (Figure A.1.1).
Figure A.1.1. SEM of n-Cu/C electrode following polarization for 10 minutes at -1.25
V in (a) CO2 saturated sodium bicarbonate and (b) Ar saturated potassium phosphate (pH
7), demonstrating that the morphological evolution is similar in both buffers.
Electrode stability over time
The relative stability of the electrodes over time was quantified by plotting the
normalized current expressed as a percentage (Figure A.1.2).
Figure A.1.2. Normalized current for n-Cu/C and copper foil expressed as a
percentage.

56
Dependence of methanation current on bicarbonate concentration
The n-Cu/C catalyst shows no clear order dependence on the concentration of the sodium
bicarbonate buffer (Figure A.1.3). The optimal buffer concentration for methanation
activity on n-Cu/C is at approximately 130 mM sodium bicarbonate, at which we achieve
a Faradaic efficiency for methanation of 86%. The methanation current on the copper foil
catalyst exhibits a clearer order dependence on bicarbonate of 1.56 ± 0.03.
Figure A.1.3. Methanation current density as a function of concentration of sodium
bicarbonate buffer, for both n-Cu/C and copper foil catalysts at -1.25 V.

57
Faradaic efficiencies
We have quantified the Faradaic efficiencies for minor products, including CO and C2H4,
on n-Cu/C (Figure A.1.4).
Figure A.1.4. Faradaic efficiencies for CH4, H2, CO, and C2H4 on n-Cu/C.
Surface coverage of CO2 radical
For the pre-equilibrium step, the currents in the forward and reverse direction are equal,
and we may write3:
𝑘1𝑝𝐶𝑂2(1 − 𝜃) exp (
𝛽𝐹𝜂
𝑅𝑇) = 𝑘−1 𝜃exp (
−(1−𝛽)𝐹𝜂
𝑅𝑇) (A.1.1)
where k1 and k-1 are the forward and reverse rate constants, respectively, for the pre-
equilibrium step, pCO2 is the partial pressure of CO2, θ is the surface coverage of the
adsorbed CO2 radical as a fraction of the total sites available for CO2 radical binding, β is
the symmetry factor, F is Faraday’s constant, η is the overpotential, R is the gas constant,
and T is the temperature. Equation S1 can be rearranged yielding:
θ
1−θ= 𝐾1𝑝𝐶𝑂2
exp (𝐹𝜂
𝑅𝑇) (A.1.2)
where 𝐾1 is the equilibrium constant for the pre-equilibrium step. In the limit that θ << 1,
we obtain:
θ = 𝐾1𝑝𝐶𝑂2exp (
𝐹𝜂
𝑅𝑇) (A.1.3)

58
Excluding alternative mechanisms
The gathered electrochemical data allows us to exclude several potential mechanisms
(Table A.1.1), following the same type of derivation as shown in the manuscript.
Table A.1.1. Alternative mechanisms for the early steps of CO2 reduction and the
corresponding Tafel slope and order dependence of methanation current on pCO2,
demonstrating that these mechanisms are inconsistent with the experimental data.
Mechanism Order dependence on pCO2 Tafel Slope
𝐶𝑂2 + 𝑒− 𝑅𝐿𝑆→
𝐶𝑂2−∙
𝑎𝑑𝑠 1 120 mV/decade
𝐶𝑂2 + 𝑒− ⇆ 𝐶𝑂2−∙
𝑎𝑑𝑠
2𝐶𝑂2−∙
𝑎𝑑𝑠
𝑅𝐿𝑆→
…
2 30 mV/decade
𝐶𝑂2 + 𝑒− ⇆ 𝐶𝑂2−∙
𝑎𝑑𝑠
𝐶𝑂2−∙
𝑎𝑑𝑠+ 𝐶𝑂2 + 𝑒−
𝑅𝐿𝑆→
…
2 40 mV/decade

59
A.2. Supporting information for dendritic assembly of gold
nanoparticles during fuel-forming electrocatalysis
Synthesis of gold nanoparticles
Gold nanoparticles were produced by sodium borohydride reduction of an aqueous
solution of tetrachloroauric acid with a polymeric dodecylthioether end-functionalized
poly(methacrylic acid) ligand, based on a previously published protocol.4
Briefly, the dodecylthioether end-functionalized poly(methacrylic acid) was prepared by
adding 5 g methacrylic acid, 1.17 g dodecanethiol, and 95 mg 2,2’-azobisisobutyronitrile
to 25 mL of ethanol in a 3 neck flask with a reflux condensor. The solution was heated to
75 oC under argon for 5 hours with stirring. Once the solution cooled to room
temperature, the polymer was precipitated using cold diethylether and collected by
filtration on a Buchner funnel. The product, dodecylthioether end-functionalized
poly(methacrylic acid), was allowed to dry under vacuum at 45 oC overnight. The
polymeric stabilizer was dissolved in Milli-Q water (Millipore) at a concentration of 66
mg/mL.
17 μL of the polymeric stabilizer solution was added to 20 mL of a 0.5 mM solution of
tetrachloroauric acid in Milli-Q water. After allowing the solution to stir for 1 hour, 2 mL
of a freshly prepared 50 mM solution of sodium borohydride in Milli-Q water was
injected into the gold-polymer solution; the injection was done in two aliquots of 1 mL
each in rapid succession. The solution was allowed to stir for 4 hours.
The aqueous particles were then ligand exchanged to dodecanethiol or dodecylamine. 10
mL of the aqueous gold nanoparticle solution was mixed with 10 mL of 1% v/v
dodecanethiol in ethanol. The solution was allowed to stir overnight. Then, after adding 2
mL of hexane to the solution, it was mixed by inversion, and centrifuged at 2000 rpm for
2 minutes to create a clean interface between the two phases. The top hexane layer
containing the gold nanoparticles was removed using a pipette. To prepare dodecylamine-
capped particles, the same procedure was used as for dodecanethiol-capped particles,
except that the 1% v/v dodecanethiol in ethanol was substituted with 1% w/w
dodecylamine in ethanol.

60
Preparation of working electrodes
Glassy carbon plates (Type 2; Alfa Aesar) were used as electrodes. The electrodes were
polished using 1500 grit sandpaper (Norton Blackice), 1 μm alpha alumina (CH
Instruments), and 50 nm gamma alumina (CH Instruments). The electrodes were then
sonicated in Milli-Q water for 30 seconds and blown dry with nitrogen.
Electrodes consisting of only gold nanoparticles on glassy carbon were prepared as
follows. Gold nanoparticles in hexane were diluted to an optical density of 0.32 at the
absorption maximum of 515 nm. The glassy carbon substrate was placed on a spin-
coater, covered in gold nanoparticle solution (100 μL/cm2) while stationary, and then
immediately spun at 1000 rpm for 60 seconds. The substrate was then covered in ethanol
(100 μL/cm2) while stationary for 30 seconds and spun at 1000 rpm for 60 seconds in
order to remove any excess ligand.
Electrodes consisting of a composite of gold nanoparticles, high surface area carbon, and
a binder were prepared as follows. Dodecanethiol-capped gold nanoparticles in hexane
were cleaned by adding 1.5 times the volume of ethanol and centrifuging at 8000 rpm for
6 minutes and then redispersing in hexane. 600 μL of gold nanoparticles in hexane of OD
2.2 were then mixed with 60 μL of a 1 mg/mL solution of >99.9% purity acetylene black
(Alfa Aesar) in hexane and 6 μL of a 1 mg/mL solution of poly(vinylidene fluoride)
(VWR) in hexane. The mixture was sonicated for 10 minutes. The glassy carbon
substrate was placed on a spin-coater, covered in this mixture (100 μL/cm2) while
stationary, and then immediately spun at 1000 rpm for 60 seconds.
Gold foil working electrodes of 99.9975% purity (Alfa Aesar) were polished using 1500
grit sandpaper, dipped in freshly prepared aqua regia for 30 seconds, rinsed with Milli-Q
water, and then blown dry with nitrogen. Dodecanethiol SAMs on gold foils were
prepared by then immersing the gold foil in a 10 mM dodecanethiol solution in ethanol
for 1 hour, rinsing the foil with ethanol thoroughly, and then blowing dry with nitrogen.5
Electrochemical analysis
All electrochemical measurements were performed using a CH Instruments 760D
potentiostat and a three electrode setup, consisting of a 99.99% platinum foil (Alfa Aesar)
counter electrode, Ag/AgCl reference electrode (BASi, RE-6) stored in saturated KCl,
and the desired working electrode. The reference electrode was positioned at the edge of
the working electrode about 2 mm from its surface. In a typical experiment using 0.1 M
NaHCO3, the IR loss in the cell was approximately 5 Ω which was compensated for using
the automated IR compensation algorithm built into the potentiostat. All measured
potentials were converted to the reversible hydrogen electrode scale (RHE) scale using
the following formula:
𝑉𝑅𝐻𝐸 = 𝑉𝐴𝑔/𝐴𝑔𝐶𝑙 + 0.2 + 0.059 ∗ 𝑝𝐻 (A.2.1)
where 𝑉𝑅𝐻𝐸 is the potential versus RHE and 𝑉𝐴𝑔/𝐴𝑔𝐶𝑙 is the potential versus Ag/AgCl.

61
The defined electrode area for the counter and working electrodes was 3.5 cm2. A two-
compartment electrochemical cell was fabricated from polychlorotrifluoroethylene (Kel-
F), with an electrolyte volume of 15 mL and a gas headspace of 3 mL in each chamber.
CO2 was bubbled through the working electrode chamber at 6 mL/min and a pressure of
1.2 atm. The counter electrode chamber was open to atmosphere. The two compartments
were separated by a Selemion membrane (AGC Engineering). The standard electrolyte
used was 0.1 M NaHCO3, except where noted; the electrolyte was produced by bubbling
CO2 through a Na2CO3 (Sigma Aldrich, 99.9999% purity, batch number BCBJ6089V)
solution of half the molarity until the solution was saturated, as determined by measuring
the pH. The pH of the saturated solution was 6.8. For experiments conducted in 0.1 M
H2SO4, 0.5 M H2SO4, 0.1 M KOH, and 0.5 M KOH as the electrolyte, argon was
continuously bubbled through the electrolyte at 10 mL/min. The measurements were
conducted at room temperature. Potentiostatic measurements were conducted by first
purging the electrochemical cell using CO2 for 10 minutes at open circuit and then
stepping to the desired potential (Figures A.2.1 and A.2.2).
Figure A.2.1. Current density versus time for dodecanethiol-capped gold
nanoparticles polarized to -1.2 V in 0.1 M NaHCO3 buffer.

62
Figure A.2.2. Current density versus time for dodecanethiol-capped gold
nanoparticles polarized to -1.2 V in 0.1 and 0.5 M KOH.
Although the initial currents are similar in potassium hydroxide buffer at 0.1 M and 0.5
M concentrations, the currents at the end of the polarization step are much greater in 0.5
M KOH than 0.1 M KOH, reflecting the greater catalyst surface area in the higher
electrolyte strength due to reduced dendritic assembly.
Plots of current versus voltage were determined by stepping through the range of
potentials beginning from -0.2 V and ending at -1.2 V, holding at each potential for 20
seconds, recording the stable current at the end of each 20 second step, and then
immediately repeating this current staircase ten times total.
From the particle coverage determined by scanning electron microscopy (SEM) and the
average particle diameter determined by transmission electron microscopy (TEM), it was
calculated that the surface area of the gold nanoparticles prior to polarization is
approximately one seventh that of the geometric area of the electrode. This calculated
surface area was used to correct the measured geometric current densities for the
dodecanethiol-capped gold nanoparticles so that the current density per unit area of gold
could be determined. Because the surface area of the gold nanoparticles decreases during
polarization, the corrected current density serves as a lower-bound for the current per unit
area of gold.
We observe comparable current densities for pristine gold foils and gold foils decorated
with dodecanethiol self-assembled monolayers (SAM) suggesting that adsorbed thiols do
not strongly inhibit charge transfer at the gold surface under strongly reducing conditions
(Figure A.2.3). Dodecanethiol-capped nanoparticles display higher current densities than
dodecylamine-capped nanoparticles (Figure A.2.3), consistent with their higher surface
area (Figure A.2.6). While dodecanethiol-capped gold nanoparticle electrodes display
lower geometric current densities than gold foils, the activity normalized to the initial

63
surface area of the nanoparticles (as determined by SEM, see above) is slightly greater
than that of the foils (Figure A.2.3). This surface area normalized activity likely
represents a lower bound because particle coalescence decreases the electroactive surface
area over the course of the measurement. The products of CO2 reduction at gold foil
electrodes have been thoroughly characterized at a potential of -0.74 V, at which the
faradaic efficiencies are 87% CO, 10% H2, and <1% HCOOH.6 In contrast, the faradaic
efficiencies of dodecanethiol-capped gold nanoparticles are 49% CO, 48% H2, and <1 %
HCOOH. Although the selectivity for CO is lower compared to gold foils6 and oxide-
derived gold nanoparticles,7 the mixture of CO and H2 can be used as synthesis gas. In
comparison to other metals, the dodecanethiol-capped gold nanoparticles exhibit higher
Faradaic efficiencies for reducing CO2 to CO than palladium (28.3%) and gallium
(23.2%) but lower than that of silver (81.5%) and zinc (79.4%).6
Figure A.2.3. Steady-state geometric current density versus potential in 0.1 M
NaHCO3 buffer for a bare glassy carbon electrode, dodecanethiol- and dodecylamine-
capped gold nanoparticles (Au NP) cast on a glassy carbon support, and a gold foil with
and without a dodecanethiol SAM. For the dodecanethiol-capped gold nanoparticles, the
current density is also plotted after correcting for the initial surface area of the gold.
Product analysis using gas chromatography and NMR
Gas phase products in the reactor effluent were quantified using a SRI Gas
Chromatograph with Hayesep D and MoleSieve 13x columns, a methanizer, and TCD
and FID detectors. Formic acid was quantified using a Bruker AVB-400 NMR
Spectrometer, following a previously published protocol.2 Briefly, following polarization
at -0.74 V for 10 minutes (total charge passed is approximately 0.5 C), 720 μL of the
electrolyte was mixed with 80 μL of a standard solution of 10 mM DMSO and 50 mM
phenol in D2O in an NMR tube. A proton spectrum was acquired for 1 hour. The
concentration of formic acid was determined by measuring the ratio of the area of the
formic acid singlet at 8.33 ppm versus the phenol triplet at 7.2 ppm and comparing to the
ratio of areas observed for standard solutions.

64
Microscopy of electrodes
Following polarization, electrodes were rinsed with Milli-Q water and blown dry with
nitrogen. SEMs of electrodes were acquired using a Zeiss Ultra 55 Field Emission
Scanning Electron Microscope with an InLens detector, 5 kV accelerating voltage, and 5
mm working distance.
As-synthesized gold nanoparticles were imaged by casting on a TEM grid (Electron
Microscopy Sciences, CF-400-Cu). Dendrites were transferred to a TEM grid by placing
the grid on a glassy carbon substrate and applying gentle pressure with a glass
microscope slide for a few seconds. TEMs were acquired using a 200 kV Tecnai G2 20
S-TWIN with a Gatan SC200 CCD camera.
X-Ray photoelectron spectroscopy
X-Ray photoelectron spectroscopy was conducted on electrodes prior to and following
polarization at -1.2 V for 10 minutes in 0.1 M NaHCO3. A Kratos Analytical AXIS Ultra
DLD X-Ray Photoelectron Spectrometer was used with an Al Kα source. 5 sweeps with a
50 meV step size and 300 ms dwell time were used to record the Au 4f and S 2p spectra
(Figure A.2.4), and 1 sweep with a 1000 meV step size and a 100 ms dwell time was used
to record the survey spectra (Figure A.2.5). The sulfur peak is still present following
polarization (Figure A.2.4), consistent with the fact that the alkanethiol influences
assembly behavior even beyond the thiol stripping potential of -0.6 V. We anticipate that
although the alkanethiol may be soluble in the boundary layer due to the locally increased
pH in the vicinity of the electrode under polarization, when the polarization is released,
the thiols physisorb onto the electrode surface.

65
Figure A.2.4. XPS of gold nanoparticles on glassy carbon before and after polarization
at -1.2 V for 10 minutes in 0.1 M NaHCO3. Au 4f spectrum (a) before and (b) after
polarization, and S 2p spectrum (c) before and (d) after polarization.

66
Figure A.2.5. XPS survey of gold nanoparticles on glassy carbon (a) before and (b)
after polarization at -1.2 V for 10 minutes in 0.1 M NaHCO3.

67
Comparison of dodecylamine and dodecanethiol
Solubility arguments can also be used to rationalize why dodecanethiol is a more
effective ligand for retarding dendritic assembly relative to dodecylamine (Figure A.2.6).
Dodecylamine is charged at intermediate pH values and is therefore more soluble than
dodecanethiol under the conditions of electrochemical CO2 reduction catalysis and less
effective at hindering particle fusion.
Figure A.2.6. SEMs of dendrites produced from (a) dodecanethiol- and (b)
dodecylamine-capped gold nanoparticles after polarization at -1.2 V for 10 minutes in
0.1 M NaHCO3 buffer.
Random walk simulations
Random walk simulations were conducted using Matlab (Mathworks, R2013b). A 500 x
500 square lattice with periodic boundary conditions was randomly populated with
10,000 isolated particles, corresponding to a fractional coverage of 0.04. For each
particle, a pair of random coordinates were generated and a particle was placed at that site
if the site was not occupied and the site had no neighbors in the four surrounding sites; if
these criteria were not satisfied, a new set of random coordinates for the particle were
generated until these criteria were satisfied. The simulation was conducted on a square
lattice, as it has been previously shown that the results obtained on square lattices are
comparable to those obtained on off-lattice simulations.8
An individual particle or dendrite was randomly selected, using a random number
generator, and took a unit step with a probability that is inversely proportional to its size,
1/n, where n is the number of particles in the dendrite. This scaling assumes a constant
average force associated with the particle displacements, which when divided by the
mass of a dendrite, provides the acceleration of the particle. The mass of a dendrite is
directly proportional to the number of particles in the dendrite. For a uniform acceleration
beginning from zero velocity, the displacement is then inversely proportional to the
number of particles in the dendrite. There were five equally weighted outcomes for a
step, including staying at the current site or moving to any of the four neighboring sites.
Following a step, if a particle or dendrite came into contact with another particle or
dendrite, the two fused irreversibly with a probability given by the sticking coefficient
multiplied by the number of nearest neighbors; if there were n contact points between a
dendrite that collided with another dendrite, then the sticking coefficient was multiplied
by n to determine the probability of a fusion event. If the fusion event did not occur, the

68
particle was returned to its original location before it took a unit step, prior to the
collision.
In all cases, because the fusion events were irreversible, there were no further changes to
the internal structure of a dendrite following a fusion event. The simulations were halted
when the system no longer evolved in time, which was the case when dendrites could not
move, or once the average of the maximum caliper diameters of the dendrites was the
same as the average of the maximum caliper diameters after 100 minutes of polarization
at -1.2 V. The maximum caliper diameter of the dendrites were calculated by measuring
the distance between the two furthest points within a single dendrite and the area was
calculated by counting the number of particles contained in the dendrite.
Image analysis
SEMs of dendrites after 100 minutes of polarization at -1.2 V were analyzed in order to
determine the maximum caliper diameter and area of individual dendrites. The Image
Processing Toolbox in Matlab was used to identify individual dendrites in the image by
finding the edge of each dendrite using the Sobel method, dilating the edge, and filling
interior gaps – this methodology is described in detail in in the Matlab R2013b Image
Processing Toolbox documentation, in the example titled “Detecting a Cell Using Image
Segmentation.” The maximum caliper diameter was calculated by determining the
distance between the two furthest points within the dendrite and the area was calculated
as the number of pixels within the dendrite.

69
A.3. Supporting information for tunable localized surface plasmon
resonances in tungsten oxide nanocrystals
Synthesis
The synthesis of tungsten oxide rods was carried out by adapting a procedure reported by
Yella et al.9 All steps were carried out with standard Schlenk line techniques. 12.5 mL of
oleic acid (Sigma Aldrich, Technical Grade, 90%) and 17.5 mL of trioctylamine (Sigma
Aldrich, 98%) were mixed in a 100 mL 3-neck flask and degassed under vacuum at 150 oC for 1 h. The flask was then placed under flowing Ar and heated to 335 oC for 3 h. It is
important to use a bump trap as the contents of the flask could bump during this step. The
solution was then cooled to 315 oC and 0.5 mL of tungsten (V) ethoxide (Alfa Aesar,
94%) was rapidly injected; the solution boiled vigorously following the injection. The
reaction was held at 315 oC for 5 min and then cooled to room temperature before
exposing to air. 15 mL of ethanol was added to the reaction, followed by centrifugation at
4000 rpm. The pellet was then resuspended in acetone and centrifuged at 4000 rpm; the
acetone washing step was repeated. After decanting the solvent, the final product was left
as a moist powder and stored at ambient conditions.
Characterization
The powder was resuspended in various polar solvents, including N-methylpyrollidone,
dimethylformamide, acetonitrile, and methanol, with the assistance of brief sonication.
Spectra were acquired using a Shimadzu UV3600 spectrophotometer. Transmission
electron microscope (TEM) images were taken with a 200 kV Tecnai G220 S-TWIN with
a Gatan SC200 CCD camera. X-Ray Diffraction (XRD) patterns were acquired with a
Bruker GADDS Hi-Star D8 diffractometer using Co Kα radiation (1.79 Å). The patterns
were background-subtracted and matched with standard patterns in the Joint Committee
of Powder Diffraction Standards (JCPDS) Database.
Absorption due to short and long axis modes as a function of aspect ratio
We calculated the absorption due to the short- and long-axis modes as a function of
aspect ratio (Figure A.3.1). We found that the short-axis mode shifts over a small
wavelength range due to changes in the aspect ratio. However, the aspect ratio
significantly impacts the energy of the long-axis mode. We found that Mie-Gans theory
predicts that the peak of the long-axis mode may be observed for shorter aspect ratios; for
longer aspect ratios, the long-axis mode contributes to the optical absorption at very small
energies but does not pass through a maximum.

70
Figure A.3.1. Calculated absorption of tungsten oxide nanorods for aspect ratios of
R/2 = 5.5, R = 11, and 2R = 22, for both (a) the short-axis mode and (b) the long-axis
mode. The x-axis in the plot of the short-axis mode is provided in units of wavelength.
The plot of the long-axis mode is normalized at the maximum absorption for each
individual curve and the x-axis is provided in units of energy to facilitate visualization of
the data.

71
High resolution transmission electron microscopy
High resolution TEM (HRTEM) images of tungsten oxide nanocrystals were acquired
both before and after heating in NMP at 175 oC for 6 minutes. The HRTEM demonstrates
that the growth direction is along the (0 0 4) direction, which has a lattice spacing of 4.1
Å, similar to the experimentally observed values (Figure A.3.2). We see that fringing is
evident both before and after heating in NMP, suggesting that some degree of
crystallinity is retained during the heating process.
Figure A.3.2. HRTEM of tungsten oxide nanorods (a) before and (b) after heating in
NMP at 175 oC for 6 minutes.

72
Size distribution
The length and width distributions of the tungsten oxide nanorods were determined by
measuring the dimensions of more than 50 particles using ImageJ (Figure A.3.3). The
average width was 5.4 nm and the average length was 62 nm. The ratio of the length and
width leads to an aspect ratio of R = 11.
Figure A.3.3. (a) Length and (b) width distributions of tungsten oxide nanorods.

73
A.4. Supporting information for redox tunability of the plasmonic mode
of copper sulfide nanocrystals
Synthesis and characterization of copper (I) sulfide nanorods
Copper (I) sulfide nanorods were prepared by the cation exchange of CdS nanorods with
excess Cu ions. The method yields nanorods with negligible copper vacancies, as
established in a past study.10
CdS nanorods were synthesized as per a procedure adapted from Sadtler et al.11 0.207 g
of CdO, 1.08 g of octadecylphosphonic acid (ODPA), 0.010 g of propylphosphonic acid
(PPA), and 2.75 g of trioctylphosphine oxide (TOPO) were loaded into a 25 mL three-
neck flask and heated to 120°C for 1 h under vacuum. The mixture was heated to 320°C
under flowing argon to produce an optically clear solution. After the CdO completely
dissolved, the solution was cooled to 120°C and put under vacuum for 1 h for the
removal of water, after which it was heated to 320°C under flowing Ar. At this time, 2 g
of TOP was injected and the flask was allowed to return to 320°C. TOP:S was prepared
by reacting equimolar amounts of TOP and elemental sulfur under an inert atmosphere.
1.3 g TOP:S was rapidly injected into the flask at 320°C. The reaction temperature was
adjusted to 305°C, and the reaction proceeded for 20 min, followed by an additional
injection of 0.65 g TOP:S. The reaction was stopped after a total of 45 min by the
removal of heat and the injection of 4 mL of anhydrous toluene once the reaction had
cooled below 100°C. The nanorods were isolated and cleaned by a few cycles of
precipitation with isopropanol/acetone as non-solvent and re-dissolution in
toluene/hexane, with alternating addition of 1-2 mL of octylamine and nonanoic acid.
Precipitation was achieved by centrifugation at 4000 rpm for 10-15 min. Typically, this
procedure yields CdS nanorods approximately 4 nm in diameter and 50 nm in length.
Cation exchange was carried out at room temperature in an oxygen- and moisture-free
environment in the glove-box. The Cd2+ concentration of the CdS nanorods was
estimated from the absorbance (OD) of the sample at 400 nm as per the formula:12
[Cd2+] in ppb = 82043.2*OD - 694.9 (A.4.1)
We typically exchange a nanorod solution ( [Cd2+] ≤ 10-3 M) with a 20x molar excess of
Cu+ (10x stoichiometric excess since each Cd2+ ion needs to be replaced by two Cu+
ions). In a typical reaction, a solution of 11 mg tetrakis(acetonitrile)copper(I)
hexafluorophosphate (30 μmol Cu+) in 1 mL methanol was added drop-wise to a
vigorously stirred solution of the seeded rods (1.5 μmol Cd2+) in 2 mL toluene. Methanol
solvates the divalent Cd2+ more strongly compared to Cu+, driving the Cu(I) exchange
reaction forward. An immediate (< 1 s) color change to golden brown was observed on
addition, following which the exchange reaction was allowed to proceed for a few
minutes. The Cu2S rods were precipitated out by addition of 1-2 mL of methanol and
centrifugation at 4000 rpm for 20 min. The supernatant containing excess unreacted Cu+,
released Cd2+, and surfactants was discarded and the nanorods were redispersed in 3 mL

74
tetrachloroethylene or carbon tetrachloride, both with high transmission throughout the
near-infrared.
Electron microscopy
Transmission electron microscopy images of copper (I) sulfide nanorods were acquired
on a FEI Tecnai G2 20 200 kV LaB6 transmission electron microscope. Samples were
prepared by drop-casting a few drops of the nanorod solution on amorphous carbon on
Cu grids or ultrathin carbon (< 3 nm) over holey carbon film, followed by rinsing with
methanol and drying in the glovebox. The nanorods are about 4 nm in width and 20-30
nm in length. Using electron microscopy, we find that the nanorods maintain their
morphology and crystallinity throughout vacancy formation (oxidation) and reversal
(reduction) processes.
Figure A.4.1. TEM images before and after copper extraction and insertion. TEM
images of (a) copper (I) sulfide nanorods obtained from cation exchange and (b) after
amine treatment for creation of copper vacancies followed by (c) thiol treatment for
filling of vacancies. The images show that the overall morphology of the nanorods is
conserved throughout the copper vacancy formation and reversal processes. The scale bar
represents 10 nm.
Optical spectra
UV-visible-NIR absorption spectra were acquired in infrared-transparent quartz cuvettes
sealed to prevent exposure to oxygen or moisture. Spectra of the CdS nanorods were
measured in toluene or hexane in the visible region (300-800 nm). Spectra of the copper
(I) sulfide nanorods were measured in anhydrous tetrachloroethylene or carbon
tetrachloride in the visible and near-infrared region (300-3300 nm). A Shimadzu UV-
3600 scanning spectrophotometer (full range: 185–3300 nm) was used with 1-nm step
size and the appropriate solvent as background. Nanorods obtained from exchange were
ensured to have negligible absorption in the near-infrared region (1200-3000 nm),
signifying that the nanorods are unoxidized and/or free of copper vacancies.

75
Electrical transistor measurements
All fabrication and measurement were carried out in an argon glovebox. Patterned gold
electrodes were deposited onto p+-doped (<5 mW-cm) silicon wafers with 300 nm of
gate oxide (Addison Engineering) using standard photolithography techniques. Contacts
were comprised of a 5 nm titanium adhesion layer, topped with 45 nm of gold. Channel
lengths and widths were 10 μm and 250 μm respectively. Nanocrystal thin-films were
fabricated via layer-by-layer drop-casting with sequential ligand exchange. Dilute
solutions of Cu2S nanorods in hexane (<5 mg/ml) obtained from cation exchange were
deposited onto transistor substrates and allowed to dry fully. To achieve ligand exchange,
the films were dipped into a solution of 1 mM ethanethiol in ethanol. The process was
repeated several times to build up a smooth thin film (~150 ± 50 nm, measured using a
Tencor AS500 Profilometer) of nanoparticles.
Electrical measurements were conducted using a Keithley 2636a dual source-meter unit,
controlled with a home-built LabView (National Instruments) program. Substrates were
contacted using a home-built probe station enclosed in an argon glovebox. The oxidation
steps were performed in air with continuous measurement on an open-air probe station.
The reduction steps were performed in an argon glovebox.
Figure A.4.2. Gate transconductance for a copper (I) sulfide nanorod film FET. Due
to the high degree of doping within the film, the change in conductance induced by the
gate is small and is overwhelmed by the gate leakage current, preventing extraction of
field-effect mobilities. Source-drain bias is 1 V and contact length and width are 5 μm
and 750 μm, respectively.

76
Formation of copper iodide and copper amine complex
Figure A.4.3. Formation of copper iodide and copper amine complex. (a)
Experimental spectra indicate that I2 removes copper atoms from the copper(I) sulfide
NRs through the formation of copper iodide. As I2 is added, a NIR LSPR develops due to
the creation of copper vacancies. Concomitantly, an absorption band attributable to
copper iodide13 develops at 3 eV (410 nm) as indicated by the arrow. The band becomes
prominent when excess iodine is added, however the LSPR feature weakens, likely due to
bulk conversion of copper(I) sulfide to copper iodide. (b) Similarly, oleylamine removes
copper atoms from the lattice of the NRs by formation of a copper:amine complex. Upon
addition of oleylamine, an LSPR develops. Simultaneously, a peak attributable to a
copper-amine complex14,15 develops at 1.8 eV (680 nm), as indicated by the arrow.
Experiments were performed with copper(I) sulfide NRs dispersed in tetrachloroethylene
in air-tight cuvettes. The sequence of spectra in each plot corresponds to a single titration.
Where appropriate, spectra were scaled and overlayed for presentation.
1 2 3
Absorb
ance
Energy / eV
Unoxidized Cu2S
7L of Oleylamine
30L of Oleylamine
1 2 3
Absorb
ance
Energy / eV
Unoxidized Cu2S
80L I2 Soln
200L I2 Soln
350L I2 Soln
A B

77
Reversibility of LSPR absorption
Figure A.4.4. Reversibility of LSPR absorption. The NIR LSPR can be completely
reversed through the addition of strong reducing agents such as (a) cobaltocene and (b)
sodium biphenyl, which inject electrons into the NR lattice filling vacancies. Experiments
were performed with copper(I) sulfide NRs dispersed in tetrachloroethylene in air-tight
cuvettes. The sequence of spectra in each plot corresponds to a single titration.
1.0 1.5 2.0 2.5 3.0
Ab
so
rba
nce
Energy / eV
Unoxidized Cu2S
Oxidized with I2
Reduced with
Cobaltocene
1.0 1.5 2.0 2.5 3.0
Absorb
ance
Energy / eV
Unoxidized Cu2S
Oxidized with Amine
Reduced with Sodium
Biphenyl
A B

78
Effect of copper oxide shell on LSPR spectra of copper(I) sulfide nanorods
0.8 1.0 1.2 1.4 1.6 1.8
0.0
0.1
0.2
0.3
0.4
Abso
rban
ce (arb. u
nits) E
xti
nct
ion E
ffic
iency
Energy (eV)
Cu2-xS nanorod
with Cu2O shell
with CuO shell
Expt. LSPR band
Figure A.4.5. Effect of copper oxide shell on LSPR spectra of copper(I) sulfide
nanorods. Extinction efficiency spectra of Cu2-xS nanorods calculated by discrete dipole
approximation. Spectra of 4-nm diameter and 40-nm length Cu2-xS nanorods, Cu2-xS
nanorods with a 0.25-nm thick shell of Cu2O, and Cu2-xS rods with a 0.25-nm thick shell
of Cu2O are shown. For comparison, we show the experimental absorbance spectrum of
Cu2-xS nanorods exhibiting a band due to the transverse LSPR mode.
In order to probe the effect of a copper oxide shell on the plasmonic properties of copper
(I) sulfide, nanorod spectra were calculated using the discrete dipole approximation
(DDA) with a 0.25-nm dipole spacing and light polarization along the nanorod short axis.
The dielectric function (εr+i.εi) of the Cu2-xS in the near-infrared (NIR) is dominated by
the free carrier contribution, so it can be modeled by the Drude model as follows:
ε𝑟 = 𝜀∞ −𝜔𝑝
2
𝜔2+𝛾2 (A.4.2)
ε𝑖 =𝜔𝑝
2𝛾
𝜔(𝜔2+𝛾2) (A.4.3)

79
where, ε∞ is the high frequency dielectric function chosen to be 3.16 The damping
constant γ was determined from the FWHM (0.49 eV) of the experimental spectrum fit to
a Gaussian. The plasma frequency ωp was chosen to have a value of 3.13 eV to closely fit
the experimental LSPR frequency. ωp is dependent on the hole density N as per the
relation:
𝑁 =𝜔𝑝
2ε0𝑚ℎ
𝑒2 (A.4.4)
where e is the electronic charge, ε0 is the free space permittivity, 𝑚ℎ is the hole effective
mass in Cu2-xS known to be 0.8 times the free electron mass.17 The above value of ωp
corresponds to a hole density N of 4.7 x 1021 cm-3 assuming. This value of N is equivalent
to 11% copper vacancies (assuming all vacancies are ionized) resulting in a stoichiometry
close to the digenite phase (Cu1.8S).
Cu2-xS rods with a 4-nm diameter and 40-nm in length were modeled with and without
oxide shells. Nanorods were assumed to have a cylindrical shape. Bulk dielectric
functions of Cu2O and CuO were taken from Ching, Xu, and Wong and used without
modification.18 In thin shells, quantum size effects and surface electron scattering would
result in a modified dielectric function. However, these non-trivial corrections were not
employed here; therefore, our calculations are not meant to be strictly quantitative. Oxide
shells of both Cu2O and CuO were taken to be 0.25 nm in thickness. This thickness is
close to the value of ca. 0.2 nm estimated from the calculated number of copper atoms
removed from the Cu2-xS nanorod, based on the copper vacancy concentration of 11%.
Upon formation of the thin copper oxide shell, the Cu2-xS nanorod LSPR band increases
in linewidth and decreases in intensity but shows only a slight shift to lower energies
(0.04 eV in the case of Cu2O and 0.06 eV in the case of CuO). These changes in the
LSPR are simply due to a non-resonant dielectric effect of the copper oxides, both of
which have band-to-band transitions in the visible region, far away from the spectral
location of the LSPR. A shell of copper iodide, which has its band-edge transition in the
visible region (3.1 eV), can be expected to have similar effects on the Cu2-xS LSPR.
A.5. References
(1) Hung, L.-I.; Tsung, C.-K.; Huang, W.; Yang, P. Adv. Mater. 2010, 22, 1910.
(2) Kuhl, K. P.; Cave, E. R.; Abram, D. N.; Jaramillo, T. F. Energy Environ. Sci.
2012, 5, 7050.
(3) Gileadi, E. Physical Electrochemistry: Fundamentals, Techniques and
Applications; 1st ed.; Wiley-VCH: Weinheim, Germany, 2011.
(4) Hussain, I.; Graham, S.; Wang, Z.; Tan, B.; Sherrington, D. C.; Rannard, S. P.;
Cooper, A. I.; Brust, M. J. Am. Chem. Soc. 2005, 127, 16398.

80
(5) Love, J. C.; Estroff, L. A.; Kriebel, J. K.; Nuzzo, R. G.; Whitesides, G. M. Chem.
Rev. 2005, 105, 1103.
(6) Hori, Y. In Modern Aspects of Electrochemistry; Vayenas, C. G.; White, R. E.;
Gamboa-Aldeco, M. E., Eds.; Springer: New York, 2008; pp. 89–189.
(7) Chen, Y.; Li, C. W.; Kanan, M. W. J. Am. Chem. Soc. 2012, 134, 19969.
(8) Meakin, P. Phys. Lett. A 1985, 107A, 269.
(9) Yella, A.; Tahir, M. N.; Meuer, S.; Zentel, R.; Berger, R.; Panthöfer, M.; Tremel,
W. J. Am. Chem. Soc. 2009, 131, 17566.
(10) Luther, J. M.; Jain, P. K.; Ewers, T.; Alivisatos, A. P. Nat. Mater. 2011, 10, 361.
(11) Sadtler, B.; Demchenko, D. O.; Zheng, H.; Hughes, S. M.; Merkle, M. G.;
Dahmen, U.; Wang, L.; Alivisatos, a P. 2009, 5285.
(12) Robinson, R. D.; Sadtler, B.; Demchenko, D. O.; Erdonmez, C. K.; Wang, L.-W.;
Alivisatos, a P. Science 2007, 317, 355.
(13) Amalina, M. N.; Rusop, M. 2011 IEEE Symp. Ind. Electron. Appl. ISIEA 2011
2011, 440.
(14) Cuya Huaman, J. L.; Sato, K.; Kurita, S.; Matsumoto, T.; Jeyadevan, B. J. Mater.
Chem. 2011, 21, 7062.
(15) Broome, F. K.; Ralston, a. W.; Thornton, M. H. J. Am. Chem. Soc. 1946, 68, 67.
(16) Rafea, M. A.; Farag, a. a. M.; Roushdy, N. Mater. Res. Bull. 2012, 47, 257.
(17) Zhao, Y.; Pan, H.; Lou, Y.; Qiu, X.; Zhu, J.; Burda, C. J. Am. Chem. Soc. 2009,
131, 4253.
(18) Ching, W. Y.; Xu, Y. N.; Wong, K. W. Phys. Rev. B 1989, 40, 7684.