china testbed fmi-enfuser in langfang by adj. prof. ari karppinen
TRANSCRIPT

China testbed FMI-ENFUSER in Langfang
15.5.2015 Hangzhou Res. Manager,Adj.Prof. Ari Karppinen
Model developer, Res. Scientist Lasse Johansson

• What is the FMI-ENFUSER model?
• A brief description
• Setting up the system in China • Main objective and the selected test region • Implementation of GIS-datasets for environment profiling • Gaining access to AQ measurements and meteorological data
• Status and preliminary results
• What works and what needs more work • Observed seasonal average concentrations in Hebei province
2
Outline

10/06/15 3
What is FMI-ENFUSER? (1/3)
ENFUSER Historical
concentration time series in the region
Land use mappings
Population density
mappings
Emission source mappings
Modelled input
Observed input
Traffic Households Industrial
Based on ALL available input, estimate pollutant spatial and temperal variation
of concentrations
Understand and describe the environment
Understand the historical behavior of pollutants (in various environments)
Understand the conditions and pollutant concentrations at hand

10/06/15 4
What is FMI-ENFUSER? (2/3) FMI-ENFUSER = (The Finnish Meteorological Institute’s ENvironmental information FUsion SERvice) The fusion of information (a separate task for the model) has been described in (Johansson et al, 2014) • Combines land-use
regression (LUR) and dispersion modelling into a novel approach named as ”dynamic land-use regression”
• Essentially, this is 3D land-use
regression taking into account the meteorological conditions, especially the evolution of the wind direction.
• There are several different layers of ”land-use” for which the method is applied simultaneously.

• Benefits: • High resolution, especially suitable for urban areas (if map information available !) • Iinformation on emission sources not ABSOLUTELY necessary
• Automatic calibration • Information on emission sources, if known, can still be included (e.g. shipping)
• Fusion algorithm => latest sensor measurements & modelled data can be included in the pool of information
• Weather forecast + regional background forecast => ENFUSER • forecasting possible IF forecast model information available
• Drawbacks: • Statistical relationships between pollutant concentrations and special/extreme meteorological conditions is difficult to define and utilize • Calibration is difficult with incomplete/low quality GIS-dataset
10/06/15 5
What is FMI-ENFUSER? (3/3)
Main issue in China at the moment
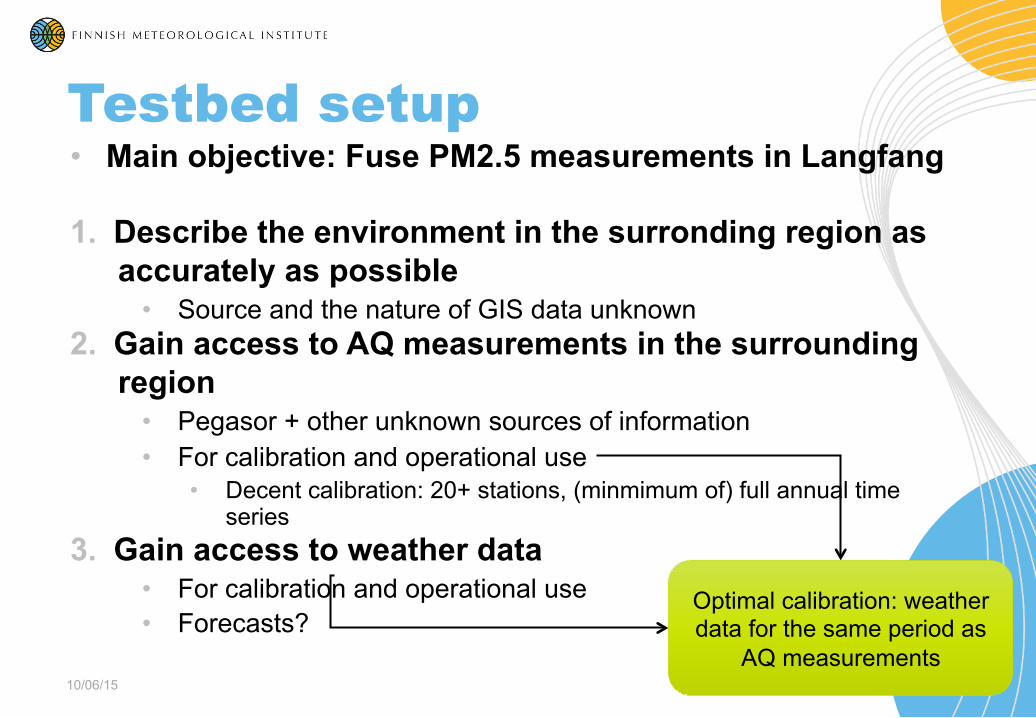
• Main objective: Fuse PM2.5 measurements in Langfang
1. Describe the environment in the surronding region as accurately as possible
• Source and the nature of GIS data unknown 2. Gain access to AQ measurements in the surrounding
region • Pegasor + other unknown sources of information • For calibration and operational use
• Decent calibration: 20+ stations, (minmimum of) full annual time series
3. Gain access to weather data • For calibration and operational use • Forecasts?
10/06/15 6
Testbed setup
Optimal calibration: weather data for the same period as
AQ measurements

10/06/15 7
Testbed region
To obtain realistic behaviour in the model it is not enough to concentrate only on Langfang The surrounding area is equally important for the calibration of the model. The selected testbed region also includes Beijing, Tianjin, Tangshan, Baoding and several other cities. For all of these other cities the environment has been mapped with the same detail as in Langfang.
=> When calibrated and operational ENFUSER should work all across the selected region.

10/06/15 8
Open source Land-use Finland/Europe Langfang/China
Forests, plains, parks, lakes, sea, roads (5), residential, industrial, buildings
Lakes, sea, roads (5)

10/06/15 9
Enhancing Open source Land-use with satellite images
• New approach: analyse rudimentary land use from satellite images => Fill in the gaps in OSM mappping
• Vegetation, Urban, Suburban • Simple image processing technique
• Deduction based on • Dominant color • Brigtness • Saturation
• Approach seems to work well in Hebei province when the ”eye altitude” of satellite is approx. 100km
• 100 x 100m resolution acheived • Better resolution would require more
sophisticated image processing and possibly shape/polygon detection
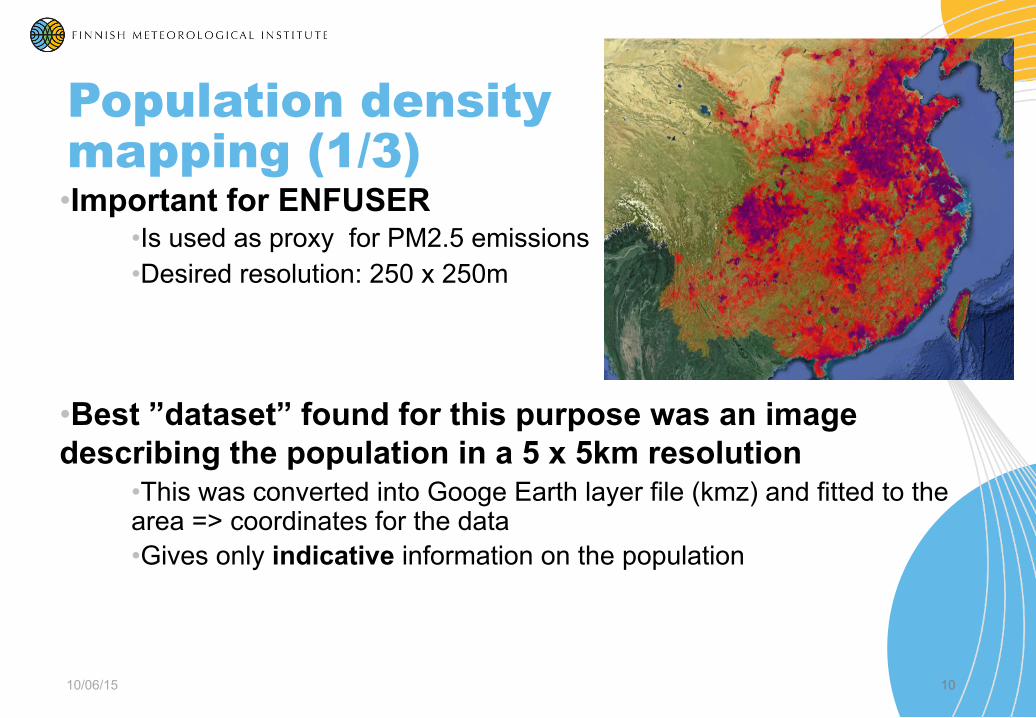
• Important for ENFUSER • Is used as proxy for PM2.5 emissions • Desired resolution: 250 x 250m
• Best ”dataset” found for this purpose was an image describing the population in a 5 x 5km resolution
• This was converted into Googe Earth layer file (kmz) and fitted to the area => coordinates for the data • Gives only indicative information on the population
10/06/15 10
Population density mapping (1/3)

10/06/15 11
Population density mapping (2/3)
Average aerosol optical depth, indicating the relative amount of particles that absorb sunlight. Based on satellite remote sensing during 2007-2011. (available near-real-time) Modis Terra (NASA), aerosol optical depth at 550nm 2007-01 to 2011-12 average.Data source:http://daac.gsfc.nasa.gov/giovanni

10/06/15 12
Indicative population mapping 250 x 250m resolution
Indicative population mapping 5x5km resolution
Satellite data
Population density mapping (3/3)
Original population data redistributed emphasizing urban and suburban areas
Langfang
Langfang
Satellite data enhances both land-use and population mapping

10/06/15 13
OpenStreetMap & street canyons(1/2) OpenSreetMap (OSM) is an open access map service provider that offers high resolution maps world wide.
FMI-ENFUSER uses OSM-maps with 5 x 5m resolution, covering all main cities in Finland Street canyons and buildings can be analyzed from the image.
This is how FMI-ENFUSER ”sees” the crossing of Lönrotinkatu and Fredrikinkatu after image processing. The vicinity of buildings can be taken into account when the concentration is being estimated in urban areas.

10/06/15 14
OpenStreetMap & street canyons(1/2) An example of NO2 fusion at the center of Helsinki based on local measurements. Colorscale: [10,120] µgm-3. With street canyon detection ENFUSER understands the input data (measurements) better and associates higher concentrations in all street canyons. OSM-data in China doesn’t contain buildings!

Describe the environment as accurately as possible • 75% of work hours done, more difficult than predicted • New approach: OSM layer implemented
• Information content low in China • No buildings => no street canyon detection
• New approach: Satellite data implementation with image processing • Enhances the OSM-data some what
• A population density mapping implemented • Quality and reliability poor • Enhancement based on satellite data
• Road specific traffic flow mapping for Langfang received from Dr. Mao • Not yet implemented, but should prove useful
• Road traffic should not be the key driver for observed PM2.5 concentrations however
10/06/15 15
Testbed status (1/2)
5/10 Needs more work!
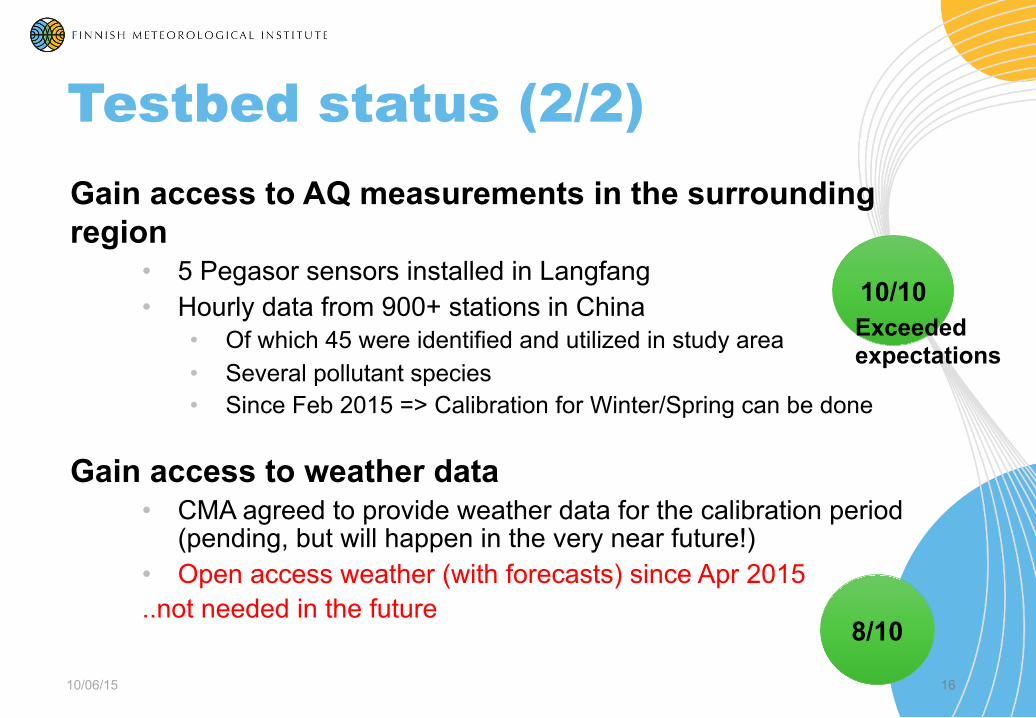
Gain access to AQ measurements in the surrounding region
• 5 Pegasor sensors installed in Langfang • Hourly data from 900+ stations in China
• Of which 45 were identified and utilized in study area • Several pollutant species • Since Feb 2015 => Calibration for Winter/Spring can be done
Gain access to weather data • CMA agreed to provide weather data for the calibration period
(pending, but will happen in the very near future!) • Open access weather (with forecasts) since Apr 2015 ..not needed in the future
10/06/15 16
Testbed status (2/2)
10/10 Exceeded expectations
8/10

17
Working days, Winter Sundays, Spring
Seasonal PM2.5 averages (1/2)
Based on the archived measurements from 45 stations. Visualization: Simple Kriging extrapolation (with ENFUSER visualization toolbox). No fusion of information, this kind of raw data would be used for the calibration of the model together with meteorological data.

• Besides seasonal variation there’s also a clear diurnal variation to be seen in average PM2.5 concentrations (not shown here)
• Highest concentrations during Winter (Monday-Friday) • Current GIS-datasets cannot explain why the highest concentrations are observed near Baoding and Tangshan
• More explaining factors (layers of information, are needed
• Demographics? • Wealth? • Industry? • Other? • Longrange transport?
10/06/15 18
Seasonal PM2.5 averages (2/2)
Working days, Winter

10/06/15 19
40
50
60
70
80
90
100
110
120
130 Av
erag
e PM
2.5
conc
entr
atio
n [µ
gm-3
]
Winter
Spring
= in Langfang
The measurement height for the included sensors is unknown presumably 5-20m, and may cause additional bias in the calibration process.
Winter season includes February only (no data for Decemer and January) Spring: March ->

• Despite the difficulties in obtaining GIS-data a preliminary collection of information has been implemented for environment profiling
• A satisfactory amount of pollutant and weather data is available
in China • Quality will further improve after the addition of PEGASOR and CMA data
• Denser sensor network will reveal better the ”micro structure” of PM2-5 concentrations
• The added benefit from using ENFUSER in China increases as the input data gets better and the training is based on sufficiently long statistics
• A better and more complete collection of information for calibration is piling up hour after hour.
• Real (added value) fusion output expected from the model; June 2015
10/06/15 20
Summary

www.fmi.fi
Johansson, L., Epitropou, V., Karatzas, K., Karppinen, K., Wanner, L., Vrochidis, S., Bassoukos, A., Kukkonen, J. and Kompatsiaris I. Fusion of meteorological and air quality data extracted from the web for personalized environmental information services. Environmental Modelling & Software, Elsevier, Volume 64, February 2015, Pages 143–155, 2014.