chinchohol survey 1 nov v2
TRANSCRIPT
WHY OUR CHILDREN ARE UNDERWEIGHT?Chinchohol Study
Presented by Dr Dhruv Mankad, Director, VACHAN, Nasik
CHINCHOHOL PHC PROFILE
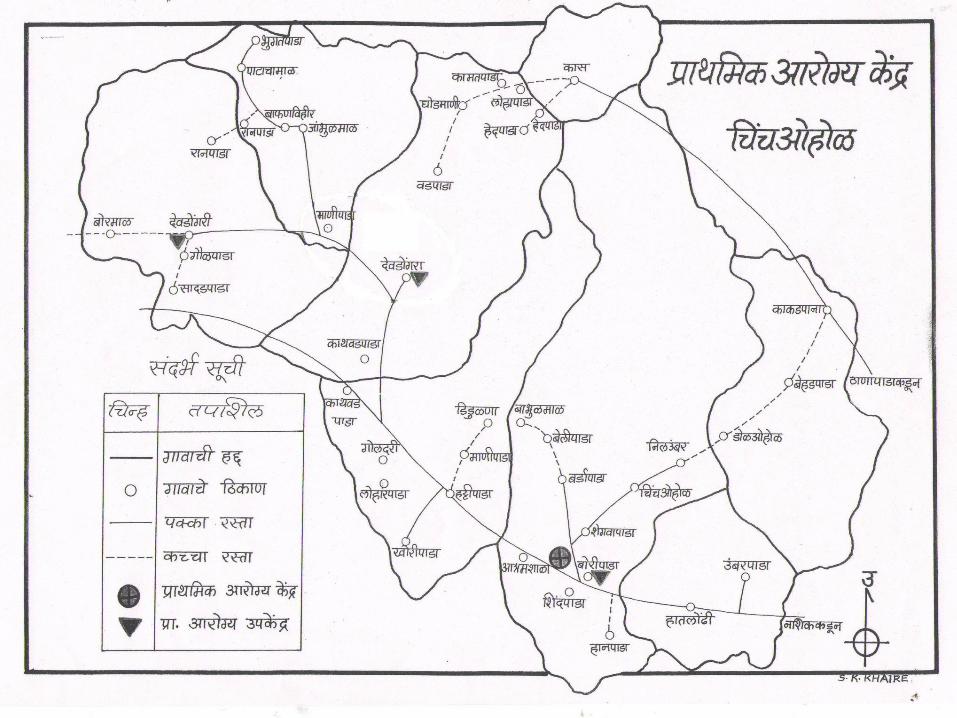

Chinchohol PHC Profile
PHC Area Profile
Gram Panchayats 4
Villages 9
Habitations* 34
Population (Census 2001) 9656
% SC 3%
% ST 93%
HHs (est.) 2500
Anganwadis (ICDS, 2010) 32
Sub centres3+1(at PHC)
PHC Performance Profile
TotalInstitutional Deliveries
%
2008-09 47 16
2009-10 66 21
2010-11 133 37
Sources: Census 2001 Source: Chinchohol PHC reports 2009, 2010 and 2011

POPULATION PROFILE

About the study
Population Pyramid

NUTRITIONAL ASSESSMENTChildren of 0-60 months age group
(WHO Anthro)
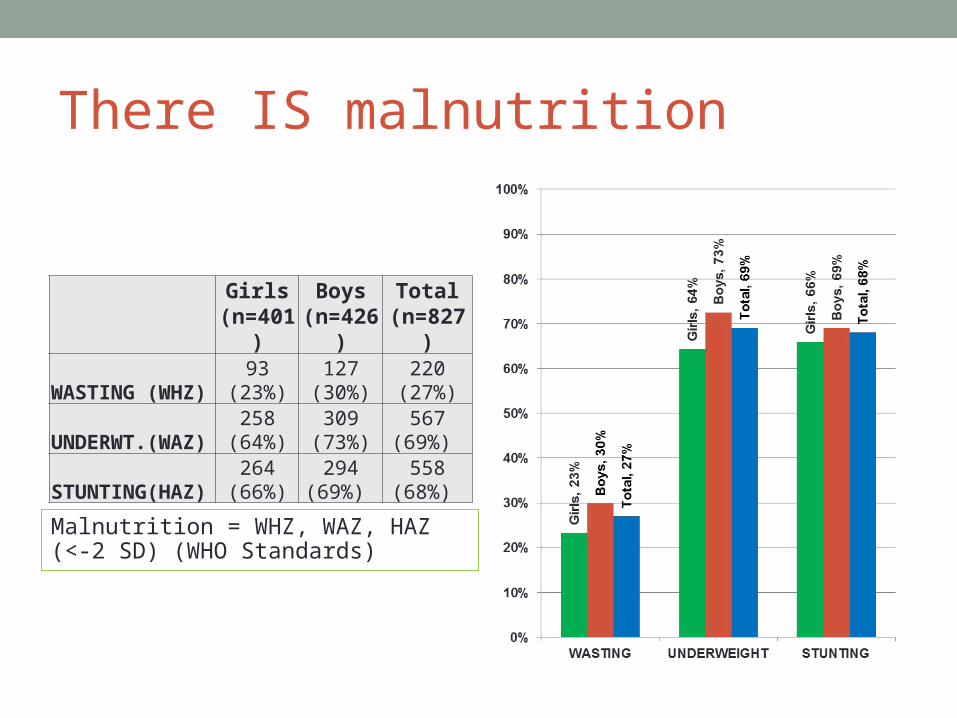
There IS malnutrition
Girls
(n=401)Boys
(n=426)Total
(n=827)
WASTING (WHZ)93
(23%)127
(30%)220
(27%)UNDERWT.(WAZ)
258 (64%)
309 (73%)
567 (69%)
STUNTING(HAZ)264
(66%)294
(69%) 558
(68%)
Malnutrition = WHZ, WAZ, HAZ (<-2 SD) (WHO Standards)

WASTING=> SAM/MAM
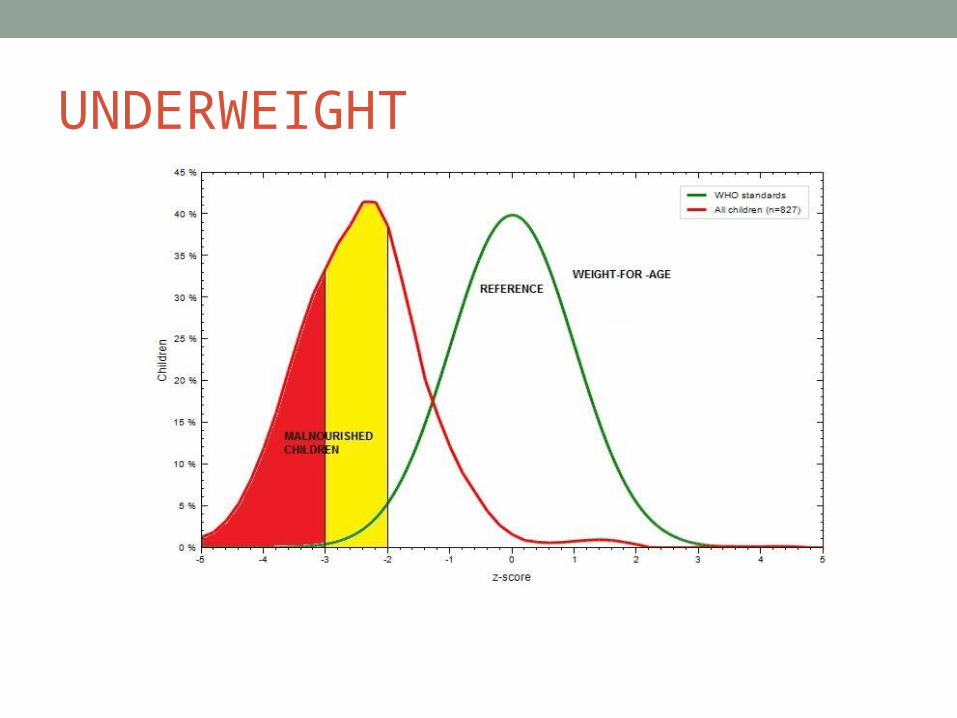
UNDERWEIGHT
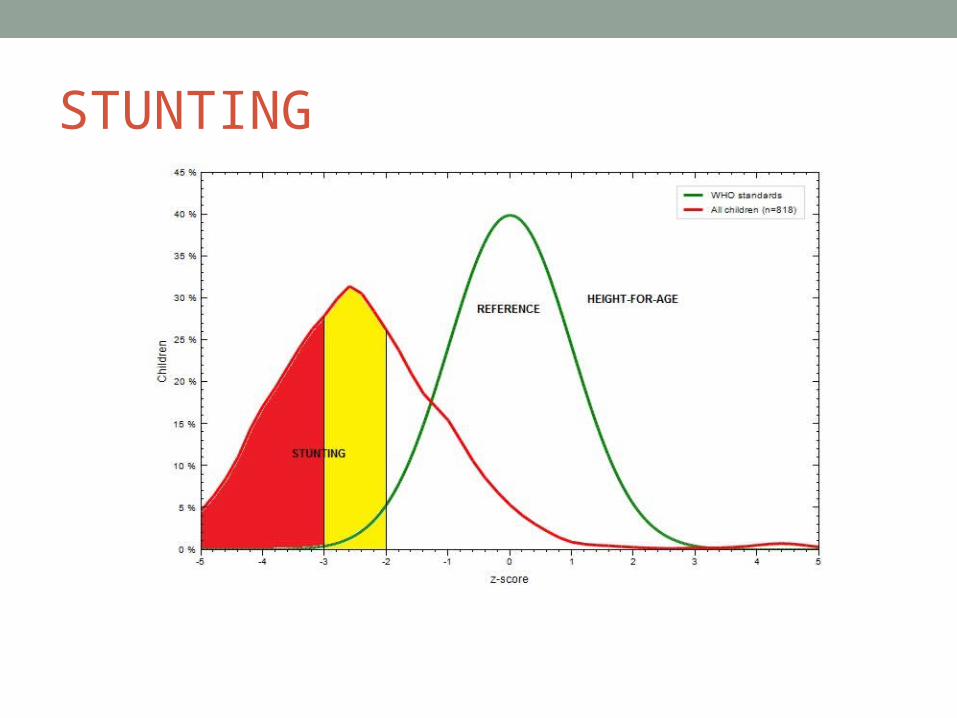
STUNTING

Severity of malnutrition by prevalence ranges (%)
Indicator LowVery high
Chinchohol Survey
Wasting < 5>=15
%27% 220
Underwt.
<10>=30
%69% 567
Stunting <20>=40
%68% 558

Who are more malnourished?

When are they more malnourished?
0-24, 24-36 and 36-60 mths 0-24, 24-36 and 36-60 mths

SOCIO-ECONOMIC STATUS
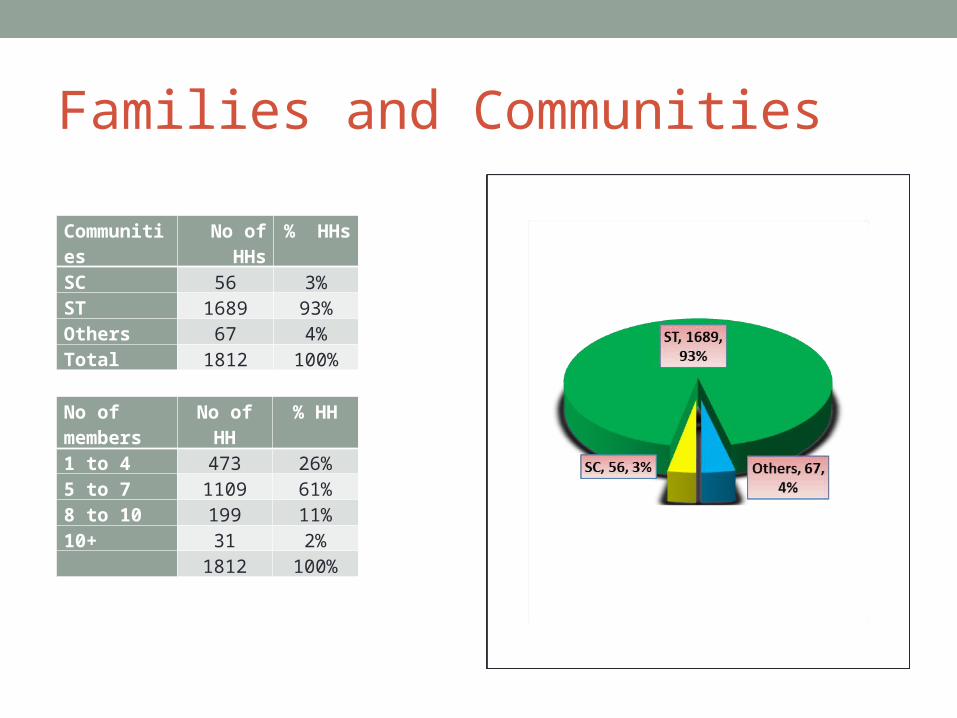
Families and Communities
No of members
No of HH % HH
1 to 4 473 26%5 to 7 1109 61%8 to 10 199 11%10+ 31 2% 1812 100%
Communities
No of HHs
% HHs
SC 56 3%ST 1689 93%Others 67 4%Total 1812 100%
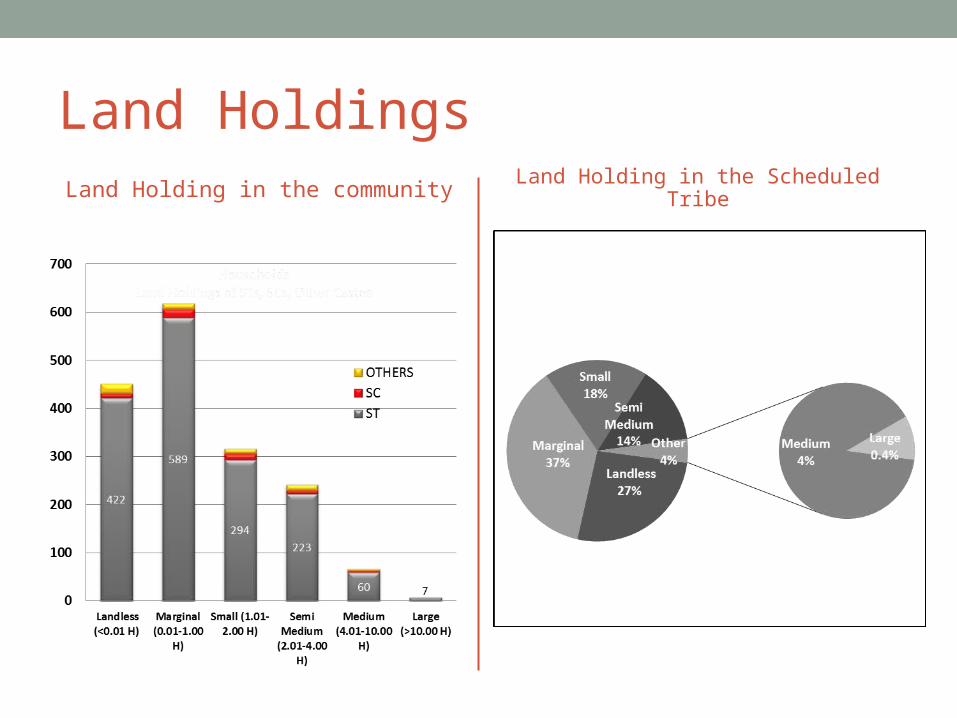
Land HoldingsLand Holding in the community Land Holding in the Scheduled Tribe

Who have irrigation facilities?
Landowners
Irrigated %
SC 42 0 0%ST 1259 27 2%OTHERS
42 6 14%
TOTAL 1343 33 2%
Village Locations Total farmers
No. with Irrigation
%
Kas Kas 58 7 12%
Dolohol Kakadpana, Kakadpanapada
52 6 12%
Devdongra
Hedpapda, Kamathpada, Loharpada
30 6 20%
Chinchohol
Bardapada, Nilumbar
12 6 50%
Hatlondhi Hatlondhi 75 3 4%
Goldari Loharpada, Kathwadpada
16 3 19%
Bafanvihir Patachamal 12 2 17%
Total 255 33 13%

How much are they educated?women and men
Women – agewise (%) Men-agewise (%)

How many families are aware and using govt. schemes?
AWARE NOT AWARE USED NOT USED
Anganwadi for Nutr. Suppl.
91% 5% 70% 26%
NREGA/EGS 63% 34% 59% 37%
KHAVATI YOJANA
82% 15% 63% 33%
NGOs 10% 82% 6% 86%
IFA for Adolescent
Girls55% 41% 39% 57%
• Most families are aware of
and accessed Anganwadi
of WCD and Khavti Yojna
of TWD
• But, 34% are not aware
about any employment
guarantee scheme!
• EGS has not reached out
to 37% of the (mostly
landless) families
• 41% of families unaware
about adol. Girls
programme
• NGOs are also not very
visible
CHILD CHARACTERISTICS
Children of 0-60 age group

Composition of 0-60 months children
No.SC 15ST 635Other 19 Total 669
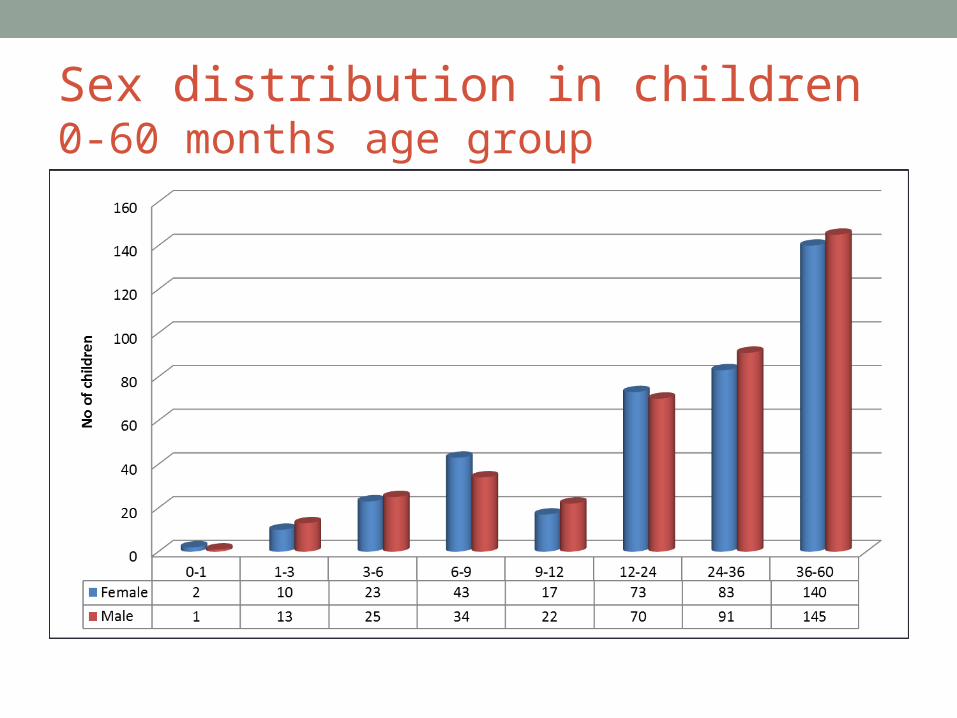
Sex distribution in children 0-60 months age group
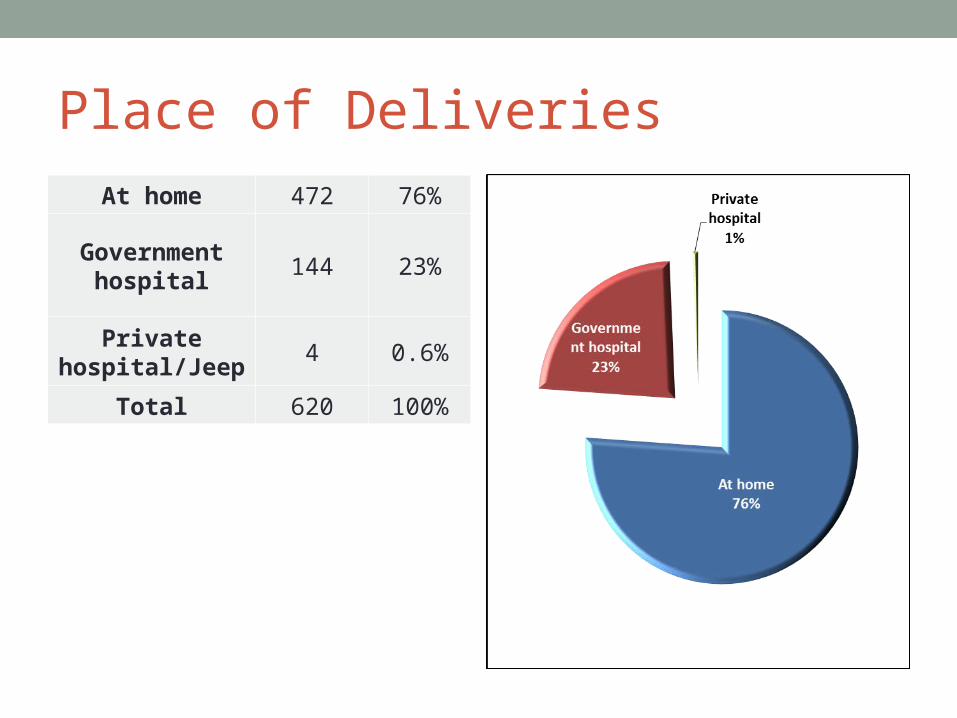
Place of Deliveries
At home 472 76%
Government hospital
144 23%
Private hospital/Jeep
4 0.6%
Total 620 100%
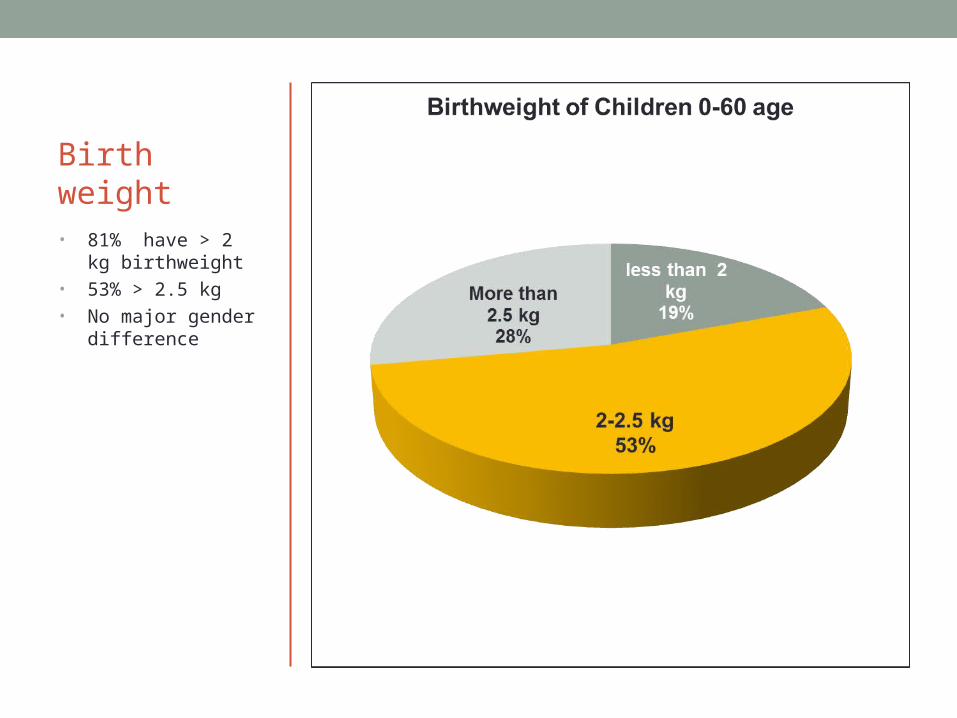
Birth weight• 81% have > 2 kg
birthweight• 53% > 2.5 kg• No major gender
difference
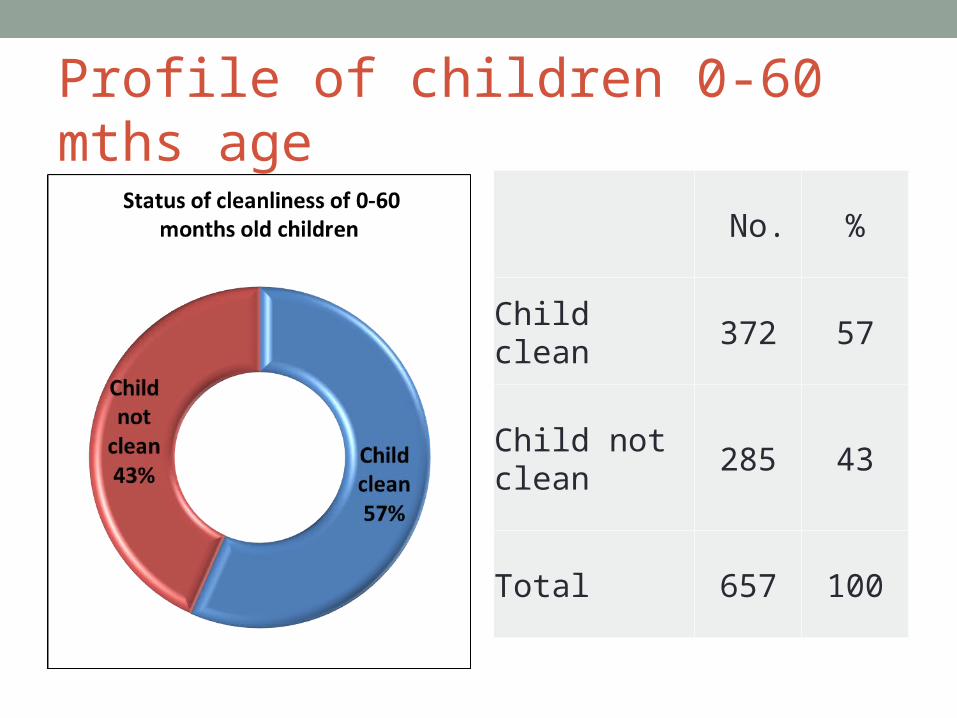
Profile of children 0-60 mths age
No. %
Child clean 372 57
Child not clean
285 43
Total 657 100
FAMILY CHARACTERISTICSHouseholds where the children of 0-60 months age group are living

Land holdings
Families of 0-60 mths
children
Landless (<0.01 H)
169
Marginal (0.01-1.00 H)
232
Small (1.01-2.00 H)
157
Semi Medium + (>2.01 H)
63
Total 621
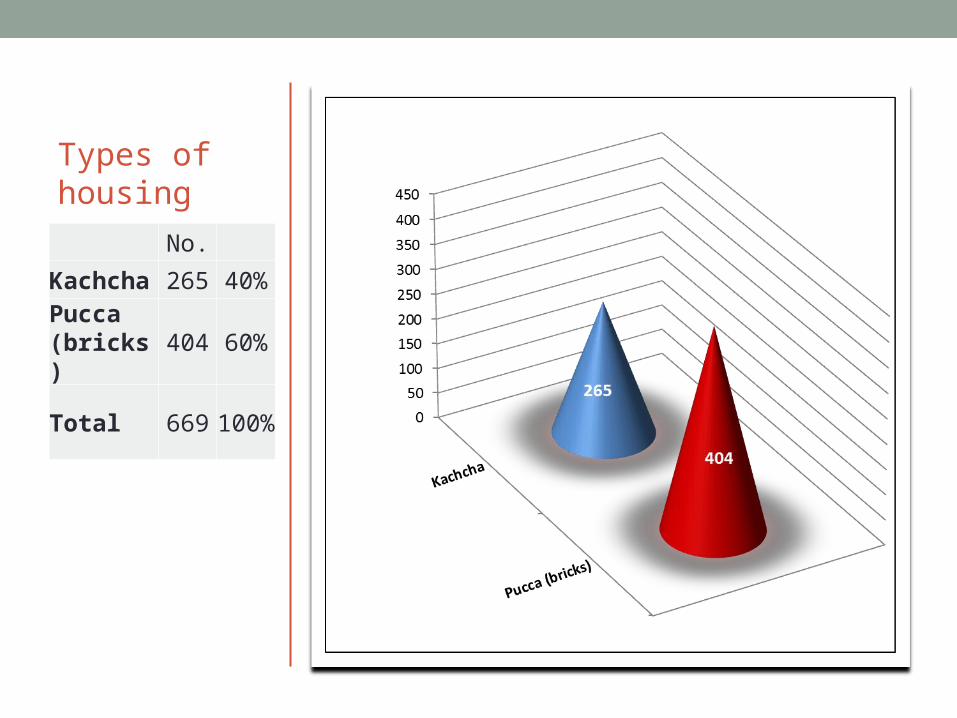
Types of housing
No.
Kachcha 265 40%
Pucca (bricks)
404 60%
Total 669100%

Cleanliness of households
• 73% of Households have toilets
• Only 31% of HHs had clean kitchen (smokeless chullah, smoke outlet, waste water disposal system and glass tile or window)
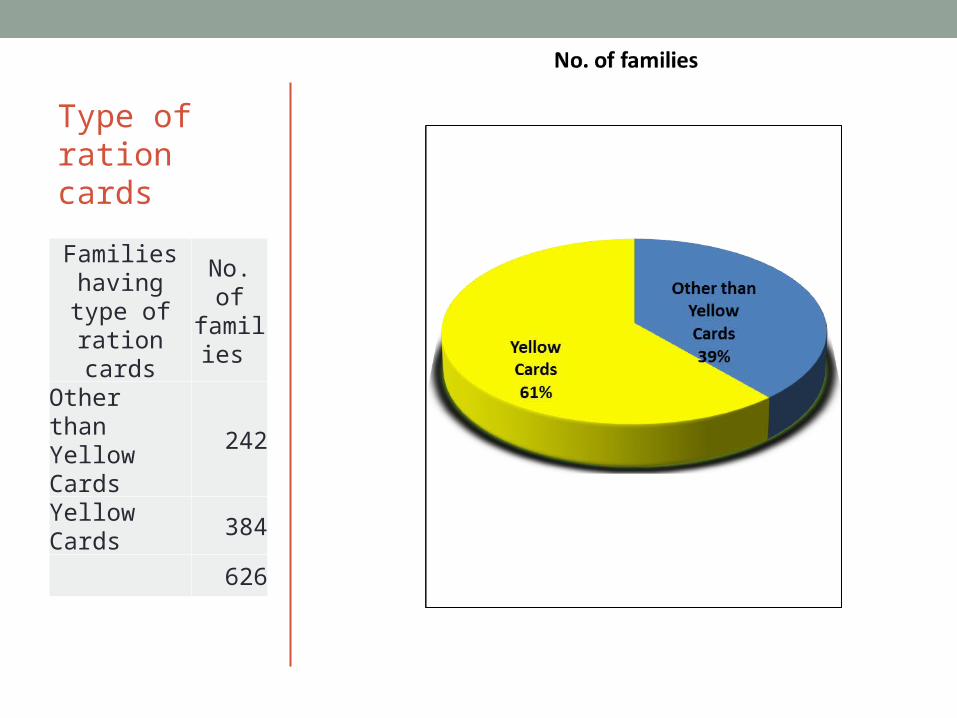
Type of ration cards
Families having type
of ration cards
No. of familie
s
Other than Yellow Cards
242
Yellow Cards 384
626
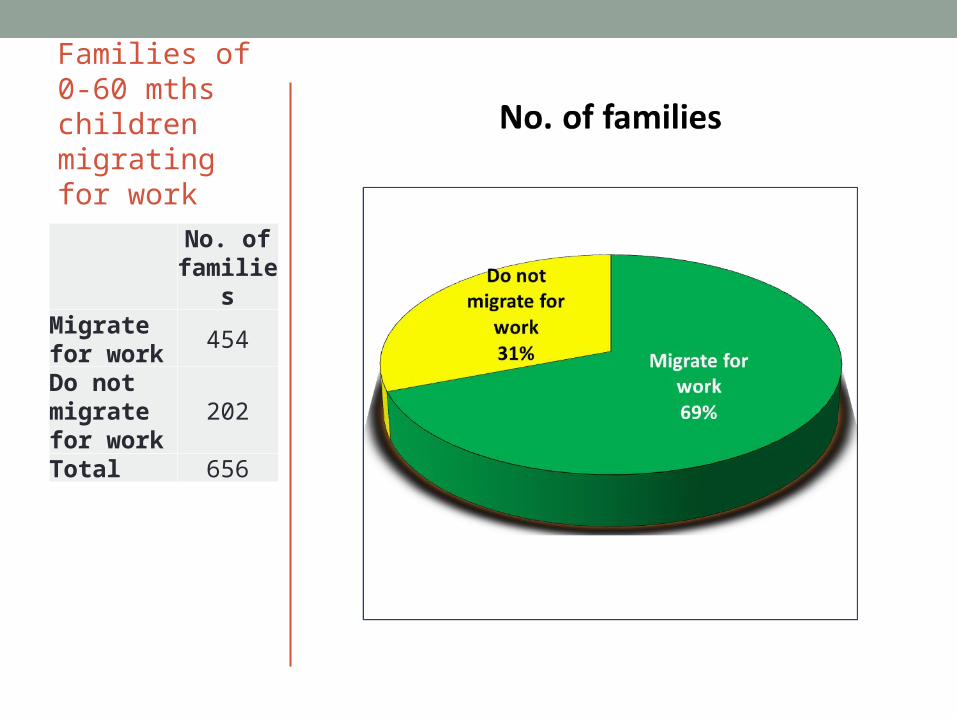
Families of 0-60 mths children migrating for work
No. of
familiesMigrate for work
454
Do not migrate for work
202
Total 656
MOTHERS’ CHARACTERISTICSMothers of children of 0-6 months age group

Types of work mothers engaged in• Most mothers
engaged in household chores (non earning work)
• 44% engaged in productive (21% earning, 23% farm based)
• 13% engaged in more than one type of work – farming+labour
• 9% engaged in other types of work (petty shops etc.)
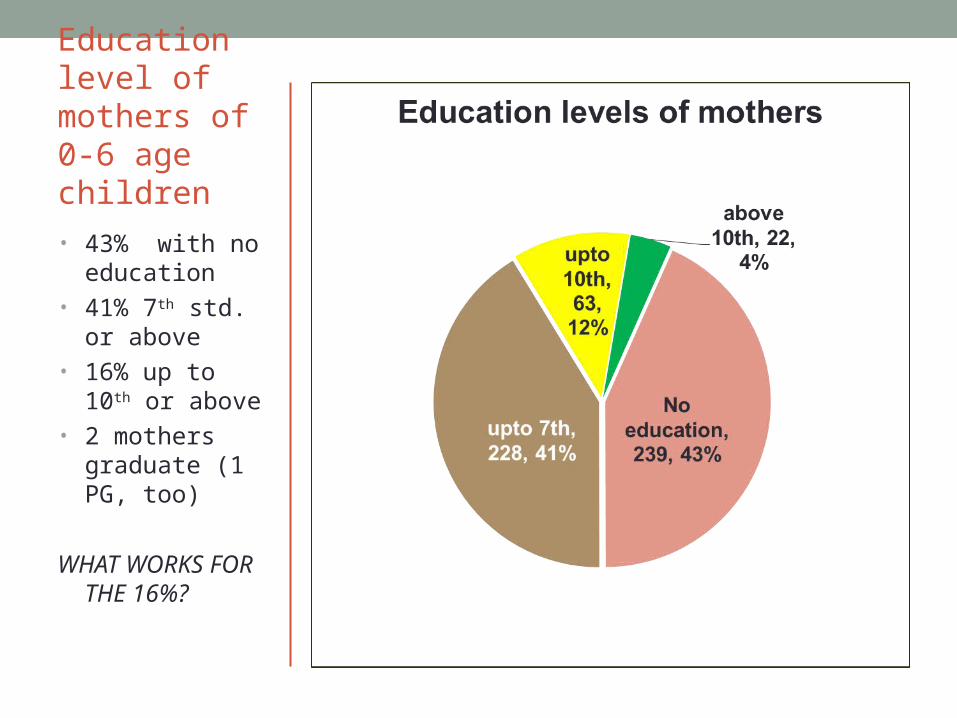
Education level of mothers of 0-6 age children
• 43% with no education
• 41% 7th std. or above
• 16% up to 10th or above
• 2 mothers graduate (1 PG, too)
WHAT WORKS FOR THE 16%?
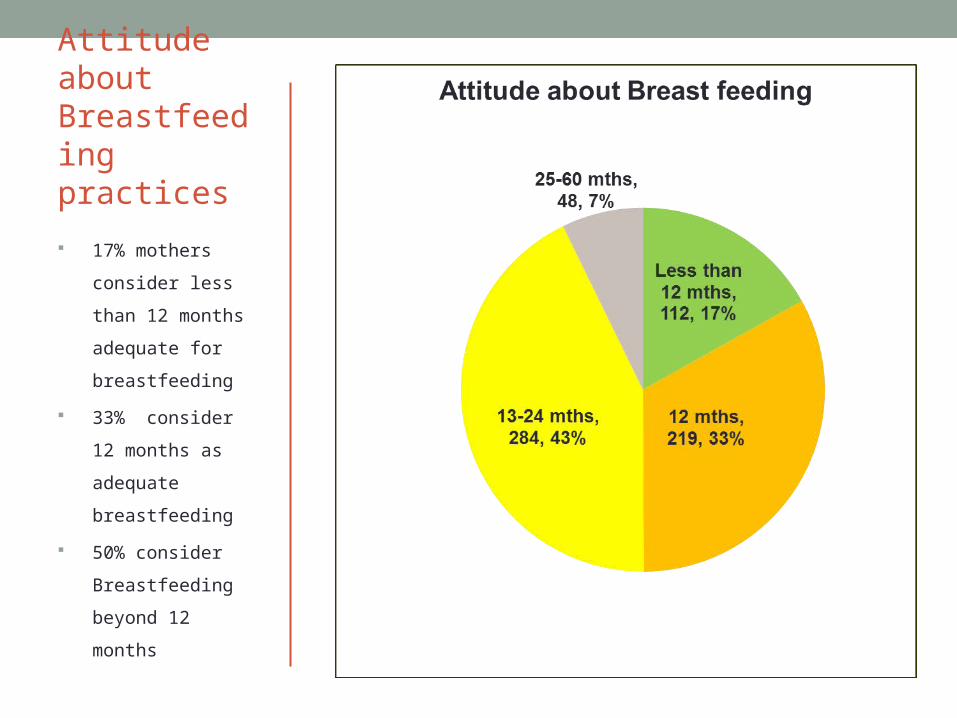
Attitude about Breastfeeding practices
17% mothers
consider less than
12 months
adequate for
breastfeeding
33% consider 12
months as
adequate
breastfeeding
50% consider
Breastfeeding
beyond 12 months
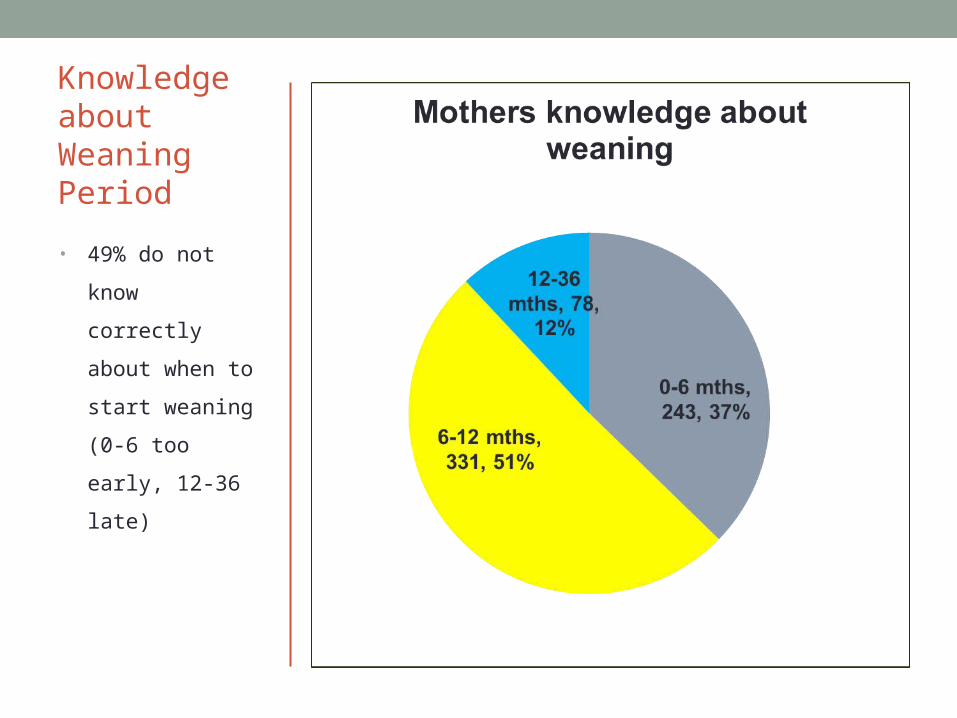
Knowledge about Weaning Period
• 49% do not know
correctly about
when to start
weaning (0-6 too
early, 12-36 late)
CAUSES OF MALNUTRITIONRegression Analysis using R Programme

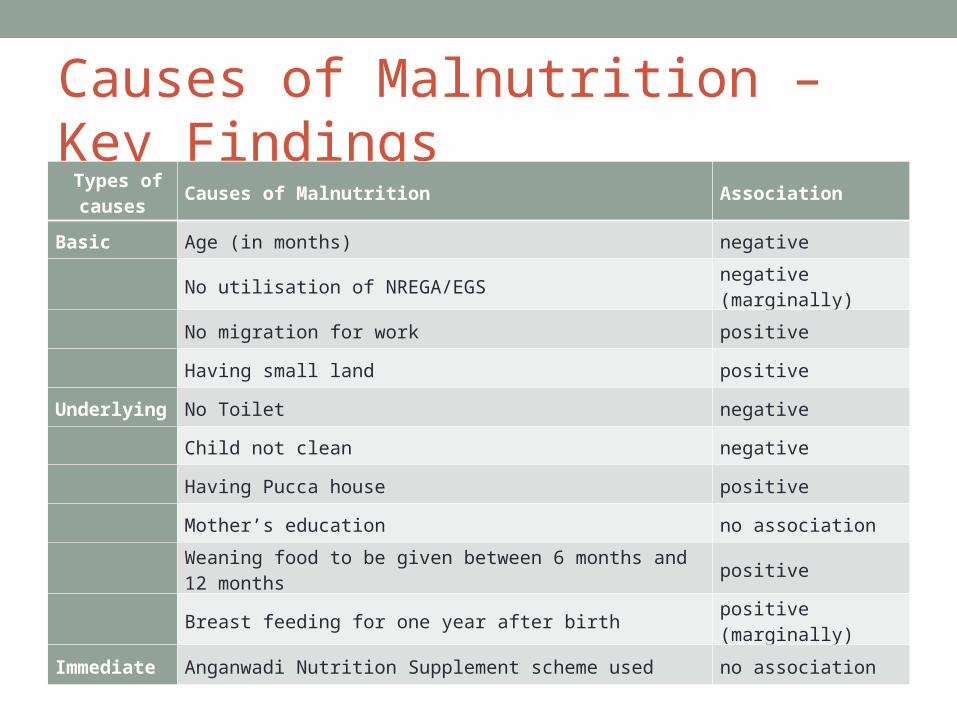
Causes of Malnutrition –Key Findings
Types of causes
Causes of Malnutrition Association
Basic Age (in months) negative
No utilisation of NREGA/EGS negative (marginally)
No migration for work positive
Having small land positive
Underlying No Toilet negative
Child not clean negative
Having Pucca house positive
Mother’s education no association
Weaning food to be given between 6 months and 12 months positive
Breast feeding for one year after birth positive (marginally)
Immediate Anganwadi Nutrition Supplement scheme used no association
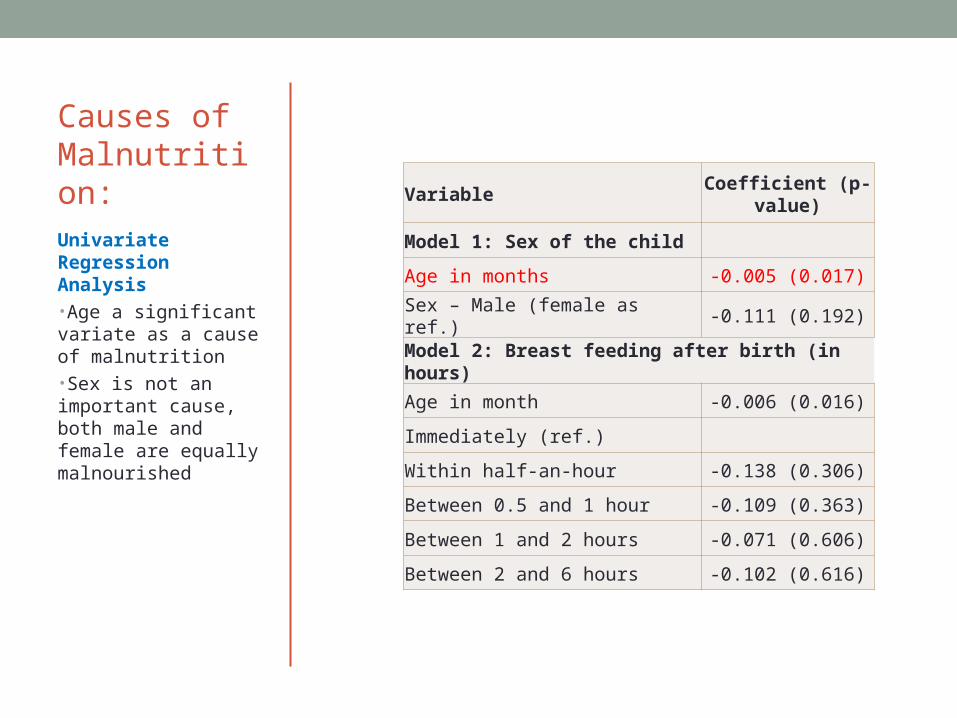
Causes of Malnutrition: Variable
Coefficient (p-value)
Model 1: Sex of the child
Age in months -0.005 (0.017)
Sex – Male (female as ref.) -0.111 (0.192)
Model 2: Breast feeding after birth (in hours)
Age in month -0.006 (0.016)
Immediately (ref.)
Within half-an-hour -0.138 (0.306)
Between 0.5 and 1 hour -0.109 (0.363)
Between 1 and 2 hours -0.071 (0.606)
Between 2 and 6 hours -0.102 (0.616)
Univariate Regression Analysis•Age a significant variate as a cause of malnutrition•Sex is not an important cause, both male and female are equally malnourished
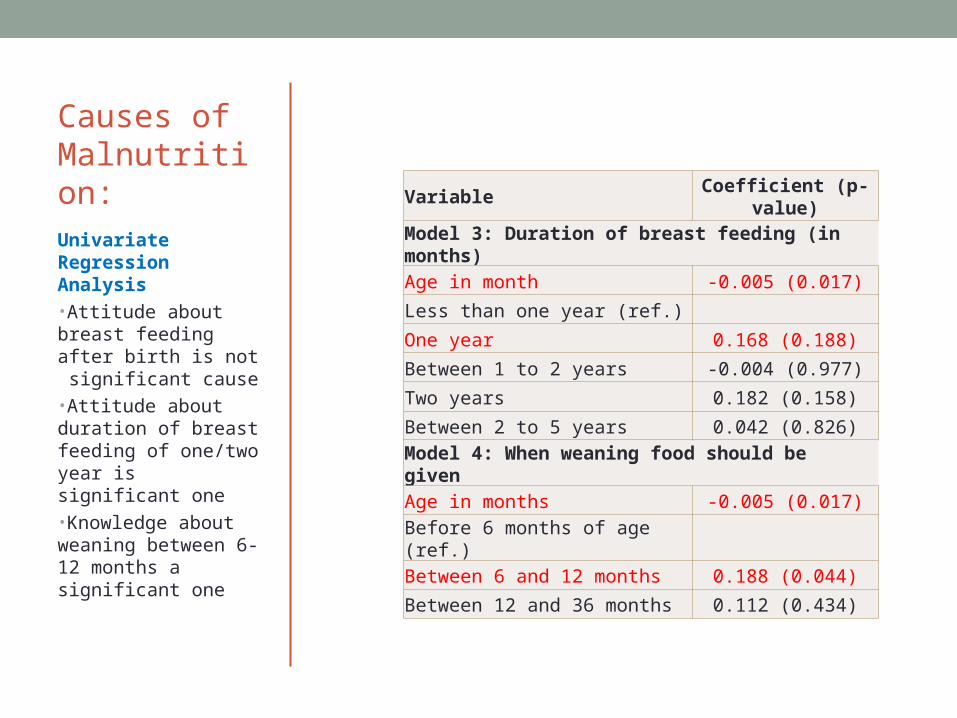
Causes of Malnutrition: Variable Coefficient (p-value)
Model 3: Duration of breast feeding (in months)
Age in month -0.005 (0.017)
Less than one year (ref.)
One year 0.168 (0.188)
Between 1 to 2 years -0.004 (0.977)
Two years 0.182 (0.158)
Between 2 to 5 years 0.042 (0.826)
Model 4: When weaning food should be given
Age in months -0.005 (0.017)
Before 6 months of age (ref.)
Between 6 and 12 months 0.188 (0.044)
Between 12 and 36 months 0.112 (0.434)
Univariate Regression Analysis•Attitude about breast feeding after birth is not significant cause•Attitude about duration of breast feeding of one/two year is significant one•Knowledge about weaning between 6-12 months a significant one
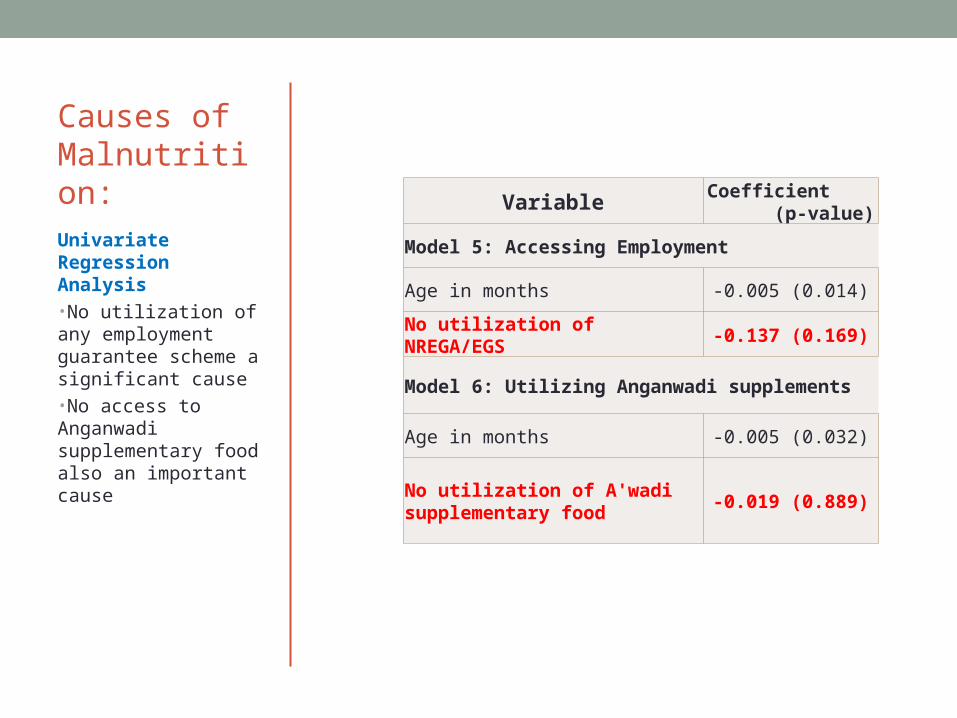
Causes of Malnutrition: Variable Coefficient
(p-value)
Model 5: Accessing Employment
Age in months -0.005 (0.014)
No utilization of NREGA/EGS -0.137 (0.169)
Model 6: Utilizing Anganwadi supplements
Age in months -0.005 (0.032)
No utilization of A'wadi supplementary food
-0.019 (0.889)
Univariate Regression Analysis•No utilization of any employment guarantee scheme a significant cause•No access to Anganwadi supplementary food also an important cause
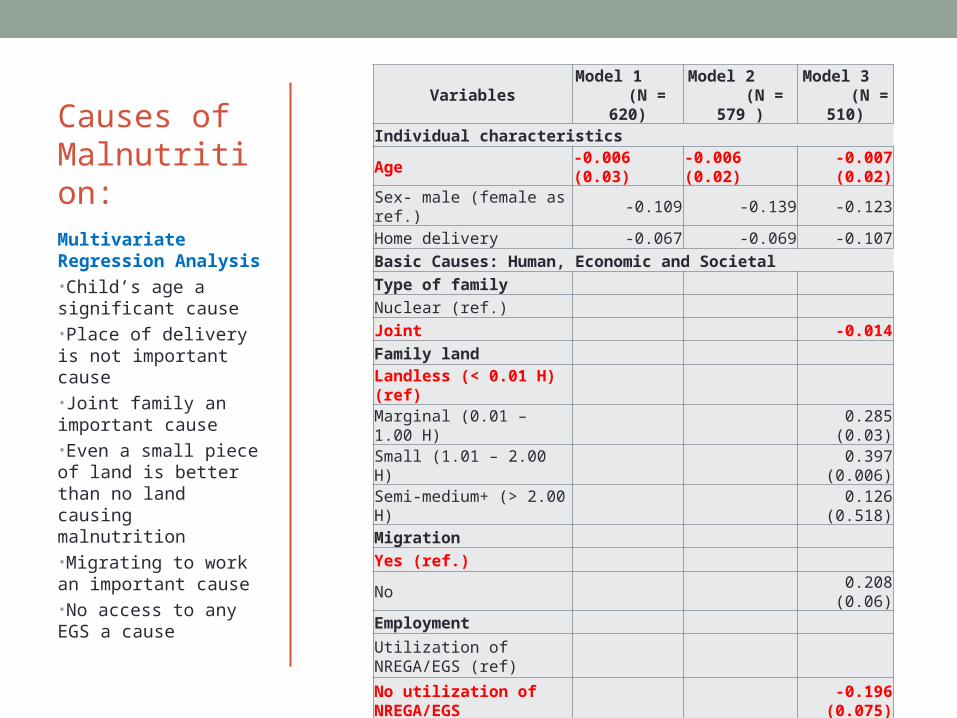
Causes of Malnutrition:
VariablesModel 1
(N = 620)Model 2
(N = 579 )Model 3
(N = 510)
Individual characteristics
Age -0.006 (0.03) -0.006 (0.02) -0.007 (0.02)
Sex- male (female as ref.) -0.109 -0.139 -0.123
Home delivery -0.067 -0.069 -0.107
Basic Causes: Human, Economic and Societal
Type of family
Nuclear (ref.)
Joint -0.014
Family land
Landless (< 0.01 H) (ref)
Marginal (0.01 – 1.00 H) 0.285 (0.03)
Small (1.01 – 2.00 H) 0.397
(0.006)
Semi-medium+ (> 2.00 H) 0.126
(0.518)Migration
Yes (ref.)
No 0.208 (0.06)
Employment
Utilization of NREGA/EGS (ref)
No utilization of NREGA/EGS
-0.196
(0.075)
Multivariate Regression Analysis•Child’s age a significant cause•Place of delivery is not important cause•Joint family an important cause•Even a small piece of land is better than no land causing malnutrition•Migrating to work an important cause•No access to any EGS a cause
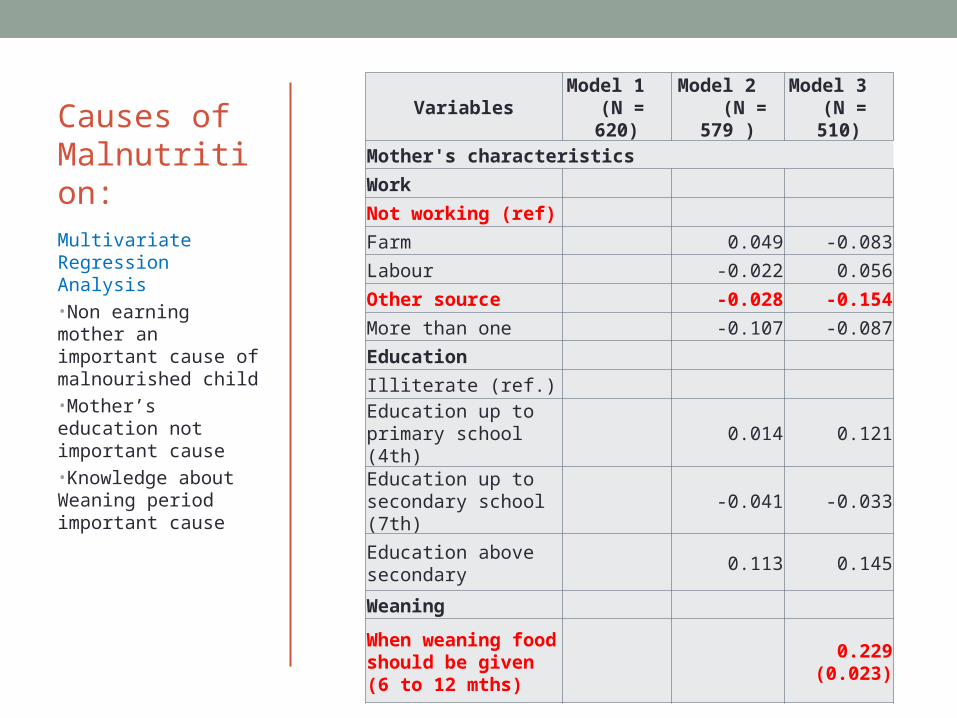
Causes of Malnutrition:
VariablesModel 1 (N = 620)
Model 2 (N = 579 )
Model 3 (N = 510)
Mother's characteristics
Work
Not working (ref)
Farm 0.049 -0.083
Labour -0.022 0.056
Other source -0.028 -0.154
More than one -0.107 -0.087
Education
Illiterate (ref.)
Education up to primary school (4th)
0.014 0.121
Education up to secondary school (7th)
-0.041 -0.033
Education above secondary
0.113 0.145
Weaning
When weaning food should be given (6 to 12 mths)
0.229
(0.023)
Multivariate Regression Analysis•Non earning mother an important cause of malnourished child•Mother’s education not important cause•Knowledge about Weaning period important cause

Causes of Malnutrition:
VariablesModel 1 (N
= 620)Model 2 (N =
579 )Model 3 (N
= 510)
Underlying Causes: Food Security, Environment, MCH and Health Care Services
Ration card
‘Yellow’ ration card (ref)
Other than ‘yellow’ ration card
-0.015
House type
Kaccha (ref)
Pucca 0.082
Toilet
Yes (ref.)
No -0.029
Clean kitchen
Yes (ref.)
No 0.048
Cleanliness of child
Yes (ref.)
No -0.209 (0.07)
Multivariate Regression Analysis•Yellow ration card holding is important cause•Kaccha household also an important factor•No cleanliness has a significant effect
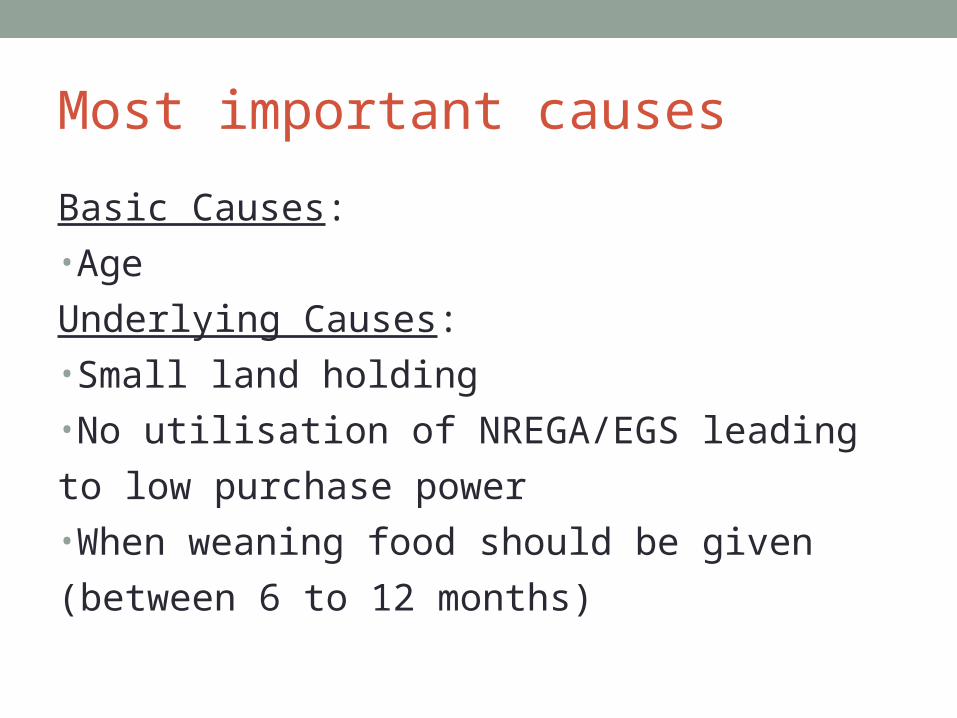
Most important causes
Basic Causes:•Age
Underlying Causes:•Small land holding•No utilisation of NREGA/EGS leading to low
purchase power•When weaning food should be given (between 6
to 12 months)

RECOMMENDED ACTION PLANSShort Term and
Long Term Action Plans

Short Term Action Plan
1. Rebuild confidence and role of Anganwadi Workers• Build up capacity of Anganwadi Workers: • Behaviour Change Communication through home visit• Make IEC material for BCC for child growth and development
2. Improve supplementary food for all AW children:• Introduce a variety of food – ground nut. Gud; egg etc.• Train AW helpers to cook such variety using local resources by
nutritionists/dieticians • Design a set of time table for day-to-day activities other than
supplementary feeding• Quality checking of any standard, FDA approved healthy food
(RUTF/RTF/THF), if it is introduced.
Family Centered, Simultaneous implementation Approach

Short Term Action Plan3. Ensure core intervention services for the vulnerable
population • Train newly wedded couples in responsible parenthood with focus on delay
parenthood, spacing – by ASHA • Train adolescent girls in life cycle and earning skills through vocational
training by NGOs• Train women for pregnancy and natal planning including for spacing and
breast feeding – by Dais, AWW helper• Continue supplementary feeding for pregnant women and breast feeding
mothers• Encourage a special services including temporary day care for 0-2 year old
children by trained dais, elderly or experienced women. • Ensure the families having underweight children have food security
through effective PDS and gainful employment to all able bodied members through employment guarantee schemes through Gram Sevaks
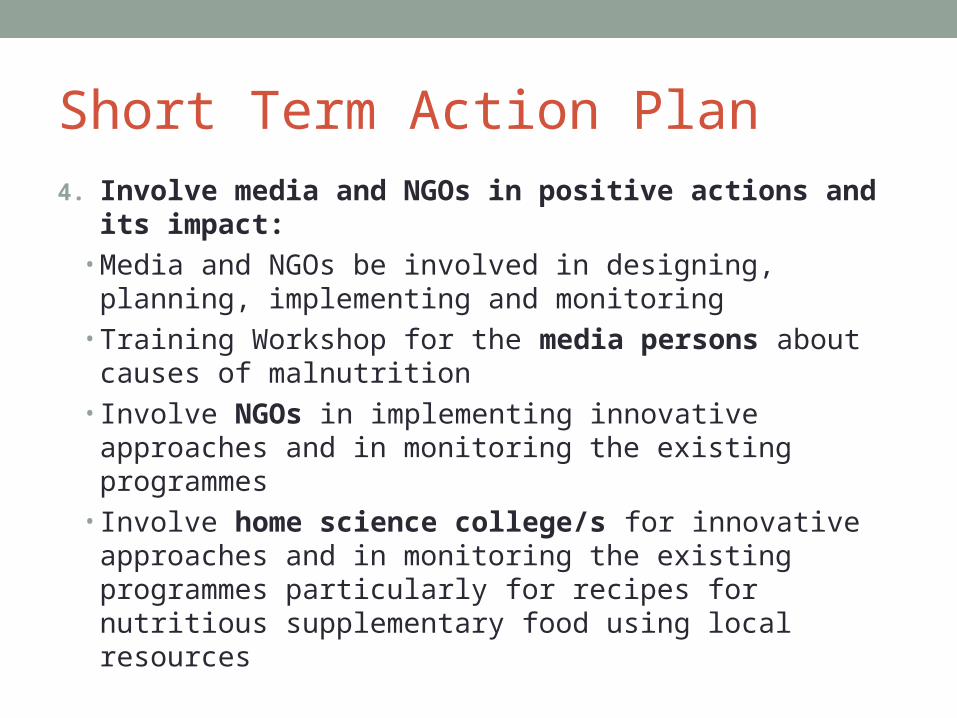
Short Term Action Plan
4. Involve media and NGOs in positive actions and its impact:
• Media and NGOs be involved in designing, planning, implementing and monitoring
• Training Workshop for the media persons about causes of malnutrition
• Involve NGOs in implementing innovative approaches and in monitoring the existing programmes
• Involve home science college/s for innovative approaches and in monitoring the existing programmes particularly for recipes for nutritious supplementary food using local resources

Short Term Action Plan5. Involve the community in positive actions and their
monitoring:• Involve VHSCs in community based monitoring of the
Anganwadis• Involve NGOs in reviving community based Child
Development Centers for MAMs
6. Enhance health care services for women and children:• Use of referral transportation for risk detection during ANC • Ensure frequent antenatal and postnatal care to eligible
women and newborn babies by mobile vans• Ensure availability of the guaranteed services at the sub
center, 24X7 PHCs and rural hospital including availability of an obstetrician and a pediatrician OR on a mobile van

Short Term Action Plan
7. Involve all the other related department, agencies to overcome other causes
• Workshop for other departments from block, district level and Nashik Municipal Corporation etc.
• Co-ordinate various services • Involve NGOs for alternative livelihood system to
discourage migration of parents of 0-6 age children • Ensure food security, women and child health care
under urban health services and at urban anganwadi through NGOs

What is to be done?
•Further studies • Tracking Children discharged from CDC• Tracking Children with migrated families• Analyzing Causes of Death of Children 0-5 using a new format (direct, indirect cause of death)
• Breast feeding practices among women ‘at home’ in rural background

IMPROVED NUTRITION
HEALTH CARE SERVICES FOR MOTHERS AND CHILDREN
SUPPLEMENTARY FOOD FOR CHILDREN
HEALTH CARE SERVICES FOR ADOLESCENT GIRLS
ENHANCED FOOD SECURITY FOR FAMILIES HAVING VULNERABLE CHILDREN AND ADULTS
EDCUATION INCL. LIFE SKILL EDUCATION ADOLESCENT GIRLS
IMPROVED NUTRITIONAL STATUS AS A GOAL OF POVERTY ALLEVIATION PROGRAMMES
VOCATIONAL TRAINING/ EMPLOYMENT ORIENTED EDUCATION TO BOYS AND GIRLS
NUTRITION DEFICIT AS A BASIS OF POVERTY LINE AND WAGES
Spider Map for Long Term Action Plan