circular 23of 2015: evaluation of cost ... june 2014 (with the bi-annual average headline inflation...
TRANSCRIPT

CIRCULAR
Chairperson: Prof. Y Veriava Chief Executive & Registrar: Dr M GantshoBlock A, Eco Glades 2 Office Park, 420 Witch-Hazel Avenue, Eco Park, Centurion, 0157
Tel: 012 431 0500 Fax: 012 430 7644 Customer Care: 0861 123 [email protected] www.medicalschemes.com
Reference: Evaluation of contribution increase assumptions for 2015Contact person: Kgotsofatso PhaswanaTel: 012 431 0407Fax: 012 431 0642E-mail: [email protected]: 25 March 2015
CIRCULAR 23 OF 2015: EVALUATION OF COST INCREASE ASSUMPTIONS BYMEDICAL SCHEMES FOR 2015 FINANCIAL YEAR
Purpose
This Circular provides an evaluation of industry assumptions submitted by medical schemes for the 2015 financial year asprovided in the benefit review submissions. The purpose of providing this information is to increase transparency of theschemes’ pricing decisions and increase the quality of provider negotiations.
Since 2010 the Council for Medical Schemes (CMS) embarked on a process of stringent review of medical schemescontribution and cost increases in order to limit the transfer of inappropriate cost increases to beneficiaries.

Page 2
Chairperson: Prof. Y Veriava Chief Executive & Registrar: Dr M GantshoBlock A, Eco Glades 2 Office Park, 420 Witch-Hazel Avenue, Eco Park, Centurion, 0157
Tel: 012 431 0500 Fax: 012 430 7644 Customer Care: 0861 123 [email protected] www.medicalschemes.com
Legislative requirement
The Medical Schemes Act outlines legislative requirements informing how the CMS conducts its work with regards tobenefit content configuration as well as pricing of options:
Regulation 8 (1) of the Medical Schemes Act regulations requires that “any benefit option that is offered by a
medical scheme must pay in full, without co-payments or use of deductibles , the diagnosis , treatment and care
costs of the prescribed minimum benefit conditions.”
Section 24 (2) (e) sates that “ … medical scheme does not or will not unfairly discriminate directly or indirectly
against any person on one or more arbitrary grounds including race, age, gender, marital status, ethnic or social
origin, sexual orientation, pregnancy, disability and the state of health.”
Section 29 (l) makes it mandatory for the scheme to communicate with their members on any change in
contributions, membership fees, or subscription, benefits or any other condition affecting their membership.
Section 29 (2) and Section 35 of the Act which seeks to encourage financial soundness of Medical Schemes.
Section 31 seeks to ensure that the scheme rules registration promotes equity in rule amendments, discourage
prejudice towards the member through unlawful exclusion/limitation of benefits also promote public accountability
and transparency.
Section 33 (2) outlines that “approval of benefit options will be subject to provision of prescribed benefits, self-
supporting in-terms of membership and financial performance, financially sound, the option should not jeopardize
the financial soundness of any existing options within the medical scheme”

Page 3
Chairperson: Prof. Y Veriava Chief Executive & Registrar: Dr M GantshoBlock A, Eco Glades 2 Office Park, 420 Witch-Hazel Avenue, Eco Park, Centurion, 0157
Tel: 012 431 0500 Fax: 012 430 7644 Customer Care: 0861 123 [email protected] www.medicalschemes.com
Overview
The analysis provided in this circular unpacks contribution increase assumptions into standard cost items and utilisationstratified by scheme size, scheme type, facility type, professional services, medicine costs, non-healthcare costs, ex gratiapayments and all other relevant cost variables.
Economic indicators trends
The CMS published Circular 34 of 2014 in July 2014 advising medical schemes that cost increase assumption for 2015should be limited to 6% for each individual cost item. The assumption was mainly based on headline inflation as measuredby the Consumer Price Index (CPI). At the time of publishing the circular, the latest available headline inflation was 6.6% asat June 2014 (with the bi-annual average headline inflation of about 6.1%). The headline inflation for December 2014 was5.3% resulting in the annual average headline inflation for 2014 being at 6.1% (Figure 1). The 2015 annual average headlineinflation is projected at 5.9% by the National Treasury (2014 Medium Term Budget Policy Statement).
Figure 1: Consumer Price Index changes for 2014

Page 4
Chairperson: Prof. Y Veriava Chief Executive & Registrar: Dr M GantshoBlock A, Eco Glades 2 Office Park, 420 Witch-Hazel Avenue, Eco Park, Centurion, 0157
Tel: 012 431 0500 Fax: 012 430 7644 Customer Care: 0861 123 [email protected] www.medicalschemes.com
Tough economic conditions since 2008 to 2009 due to the global financial crisis continue to affect most economies includingSouth Africa. South Africa’s economic performance has been deteriorating over the past several years. Slow economicgrowth therefore continues to be a worrying factor in 2014 and beyond (Budget review 2014). Whilst economic growth wasreported to be at levels below 2% with Q3:2014 recording a growth rate of 1.4%, and projected GDP growth has beenrevised down from 2.5 to 2 per cent in 2015 (Economic Outlook, 2015).
The unemployment rate in quarter 3 of 2014 was 25.4% (Quarterly Labour Force Survey, Q3: 2014). Whilst the labour forceparticipation rate and the absorption rate remained slightly unchanged during 2014. According to the Quarterly EmploymentSurvey (QES) in quarter 3 of 2014, formal sector employment increased by 1.0% on year-on-year comparisons but declinedby -1.5% on quarter-on-quarter comparisons. The average earnings paid to employees increased by 6.6% year-on-year(Quarterly Employment Survey, Q3:2014). These factors highlights the pressure on the economy to translate economicgrowth into job creation.
The current fiscal pressure might have a negative impact on the medical schemes in general. The slow economic growthand low employment levels may constrain growth in medical schemes’ membership. Medical schemes’ contributions inexcess of CPI and income growth will most likely create affordability challenges for medical scheme members. In addition,an affordability barrier due to excessive premium increase prevents low-income members to participate meaningfully in themedical scheme market and this limits opportunity for meaningful risk pooling and cross subsidisation within the industry.
Industry cost assumption data
This section provides an outline of the methodology followed in the analysis of cost assumptions data submitted by medicalschemes for 2015 benefit year. The analysis undertook a quantitative review of 2013-2014 Annual Statutory Return data,medical schemes cost assumptions data, review of actuarial reports and an analysis of medical schemes risk measurementdata triangulated with contextual analysis of the medical schemes market.
In December 2014, 85 medical schemes submitted cost assumptions data with the submission of benefit changes andcontribution increases for 2015. The data from the submissions were consolidated, verified and analysed. Data from 76medical schemes, representing about 98% of all beneficiaries in the industry, was found to be of adequate quality forinclusion in the analysis, as shown in Table 1 below. The medical schemes submissions that were found to be of adequatequality were made up of 23 open and 53 restricted medical schemes with 4 864 931 (56%) and 3 818 224 (44%)beneficiaries, respectively. About 20% of the medical schemes that submitted data of adequate quality had risk pools of atleast 65 000 (Table 1 below).

Page 5
Chairperson: Prof. Y Veriava Chief Executive & Registrar: Dr M GantshoBlock A, Eco Glades 2 Office Park, 420 Witch-Hazel Avenue, Eco Park, Centurion, 0157
Tel: 012 431 0500 Fax: 012 430 7644 Customer Care: 0861 123 [email protected] www.medicalschemes.com
Table 1: Medical Schemes size categoriesType of Size of Number of
BeneficiariesPercentage of
scheme scheme* schemes beneficiaries
Open
Small 6 68 438 1.41%
Medium 6 207 695 4.27%
Large 8 111 3971 22.90%
Very Large 3 3 474 827 71.43%
Total open 23 4 864 931 100.00%
Restricted
Small 26 217 841 5.71%
Medium 18 550 988 14.43%
Large 7 722 302 18.92%
Very large 2 2 327 093 60.95%
Total restricted 53 3 818 224 100.00%
All schemes
Small 32 286 279 3.30%
Medium 24 758 683 8.74%
Large 15 1 836 273 21.15%
Very large 5 5 801 920 66.82%
Total all schemes 76 8 683 155 100.00%*Small: < 15 000 beneficiaries; Medium: ≥ 15 000 but ≤ 65 000 beneficiaries; Large: > 65 000 but ≤ 220 000 beneficiaries; Very large > 220 000 beneficiaries
Scheme tariff increase assumptions for 2015
The average assumed increases for different tariff items i.e. excluding the effect of utilisation, demographic changes andreserve building are summarised in Table 2 and Figure 2. Having considered the year-on year CPI inflation rate and otherkey economic indicators, the CMS advised in Circular 34 of 2014 that cost increase assumptions for the 2015 benefit yearshould be limited to 6.0% for each individual cost driver in line with the prevailing consumer price index.

Page 6
Chairperson: Prof. Y Veriava Chief Executive & Registrar: Dr M GantshoBlock A, Eco Glades 2 Office Park, 420 Witch-Hazel Avenue, Eco Park, Centurion, 0157
Tel: 012 431 0500 Fax: 012 430 7644 Customer Care: 0861 123 [email protected] www.medicalschemes.com
Table 2: Summary of the most important assumptions for cost items incorporated into overall contribution increase for the2015 financial year
Cost item Weightedaverage
25th
percentile50th
percentile75th
percentileWeighted averageOpen Restricted
Private hospitalsWard fees 6.38% 6.20% 7.50% 7.88% 6.18% 6.63%Theatre fees 6.26% 6.20% 7.50% 7.88% 5.96% 6.63%Consumables 6.51% 6.00% 6.80% 7.75% 6.61% 6.38%Medicines 5.97% 6.00% 6.50% 7.50% 5.69% 6.32%Equipment 6.09% 6.00% 7.00% 7.60% 5.94% 6.29%Procedure 6.09% 6.00% 6.80% 7.75% 5.93% 6.29%Managed Care 5.87% 6.00% 6.50% 7.50% 5.56% 6.25%Other 6.06% 6.00% 6.80% 7.60% 5.83% 6.35%
Public hospitalsWard fees 6.29% 6.20% 7.13% 7.60% 6.17% 6.45%Theatre fees 6.17% 6.20% 7.10% 7.60% 5.95% 6.45%Consumables 6.42% 6.00% 6.80% 7.52% 6.60% 6.19%Medicines 5.96% 6.00% 6.50% 7.50% 5.81% 6.15%Equipment 6.01% 6.00% 6.80% 7.50% 5.93% 6.11%Procedure 6.01% 6.00% 6.80% 7.50% 5.92% 6.12%Other 6.01% 6.00% 6.70% 7.50% 5.91% 6.13%
Professional servicesGeneral practitioners 6.17% 6.00% 6.20% 6.50% 6.25% 6.07%Specialists 6.34% 6.00% 6.20% 6.70% 6.56% 6.08%Dentists 6.15% 6.00% 6.20% 6.50% 6.23% 6.05%Allied 6.63% 6.00% 6.20% 6.50% 7.09% 6.05%Other professional 6.16% 6.00% 6.20% 6.50% 6.25% 6.05%
Medicines out-of-hospital 6.16% 6.00% 6.20% 6.96% 6.17% 6.14%Ex gratia payments 5.31% 0.00% 6.00% 6.25% 5.04% 5.65%Out-of-hospital managed care 6.41% 6.00% 6.20% 6.65% 6.22% 6.64%Non-healthcare expenditure 5.87% 5.97% 6.00% 6.50% 5.42% 6.43%
Overall weighted tariff assumptionincrease 6.25% 6.03% 6.62% 7.05% 6.23% 6.28%

Page 7
Chairperson: Prof. Y Veriava Chief Executive & Registrar: Dr M GantshoBlock A, Eco Glades 2 Office Park, 420 Witch-Hazel Avenue, Eco Park, Centurion, 0157
Tel: 012 431 0500 Fax: 012 430 7644 Customer Care: 0861 123 [email protected] www.medicalschemes.com
The reported overall weighted tariff assumption increase for 2015 was 6.25%. The overall weighted tariff assumptionincrease were slightly similar between open schemes (6.23%) and restricted schemes (6.28%). The reported weightedaverage assumed tariff increase for different cost drivers ranged between 5.31% and 6.63%. The range was about 1.32%for all cost drivers. This indicates low variability in the cost increase assumptions reported by medical schemes.
The weighted average assumed tariff increase assumption for private hospitals ranged between 5.87% and 6.51%. Themedian assumed increase assumption for cost items in private hospitals was between 6.50% and 7.50%. The medianassumed increase assumption for cost items in public hospitals was almost similar to that of private hospitals and wasbetween 6.50% and 7.13%. The weighted average assumed tariff increase for public hospitals was between 5.96% and6.42%.
Private hospitals weighted tariff increase assumptions analysis by medical scheme size shows that for small medicalschemes tariff increases ranged between 6.12% and 6.82% with an average of about 6.50%. Whilst medium medicalschemes submitted tariff increase assumptions between 6.35% and 6.76% with the average of about 6.58% and largemedical schemes had the highest tariff increase assumptions ranging between 6.02% and 7.56% with an average of about6.89%. Very large medical schemes had the lowest tariff increases compared to all medical schemes implying that verylarge schemes continue to have competitive advantage on tariff negotiations even in absence of price regulation and thepresence of other challenges within the demand and supply side of the market.
The weighted average assumed tariff increase for professional services ranged between 6.15% and 6.63%. The medianassumed increase assumption for professional services cost items was 6.20%.
The average assumed tariff increase for medicines dispensed out-of-hospital was around 6.16% about 1.3 percentage pointlower than the gazetted medicines Single Exit Price (SEP) increase for 2015 (7.5%). The 2015 SEP increase was notavailable at the time when these assumptions were made by medical schemes. Fifty percent of all medical schemes thatsubmitted cost increase assumption data took a view that the tariff increase on out-of-hospital medicines will not be greaterthan 6.2%. This correlates with the view of CMS that tariff increase assumptions on medicines must not exceed 6.0%.
The percentage of medical schemes whose medicines assumed tariff increase were less than the SEP increase was about79% for medicines dispensed in a hospital setting, and 89% for out-of-hospital medicines (Figure 2).

Page 8
Chairperson: Prof. Y Veriava Chief Executive & Registrar: Dr M GantshoBlock A, Eco Glades 2 Office Park, 420 Witch-Hazel Avenue, Eco Park, Centurion, 0157
Tel: 012 431 0500 Fax: 012 430 7644 Customer Care: 0861 123 [email protected] www.medicalschemes.com
Figure 2: Percentage of schemes assumed medicines tariff increase compared to 2015 SEP increase (7.5%)
Some of the important aspects of the CMS includes monitoring costs incurred in running the medical schemes, whichincludes non-healthcare costs. The CMS is therefore responsible for ensuring that schemes attain a reasonably minimallevel of non-healthcare costs in order to cater for the necessary costs of healthcare.
The weighted average assumed tariff increase in non-healthcare expenditure was about 5.87% with the median of 6.0%.About 25% of the schemes assumed an increase of above 6.50%. The impact of non-healthcare expenditure on the tariffincrease was slightly different between open and restricted medical schemes. As shown in Table 3, the average assumedtariff increases were 5.42% and 6.43% for open and restricted medical schemes, respectively.
Page 9
Chairperson: Prof. Y Veriava Chief Executive & Registrar: Dr M GantshoBlock A, Eco Glades 2 Office Park, 420 Witch-Hazel Avenue, Eco Park, Centurion, 0157
Tel: 012 431 0500 Fax: 012 430 7644 Customer Care: 0861 123 [email protected] www.medicalschemes.com
Table 3: Non-healthcare expenditure by scheme type (%)
TypeScheme Weighted 25th 50th 75th
count average percentile percentile percentile
Open 23 5.42% 5.97% 6.00% 6.00%Restricted 53 6.43% 5.80% 6.00% 6.50%All schemes 76 5.87% 5.97% 6.00% 6.50%
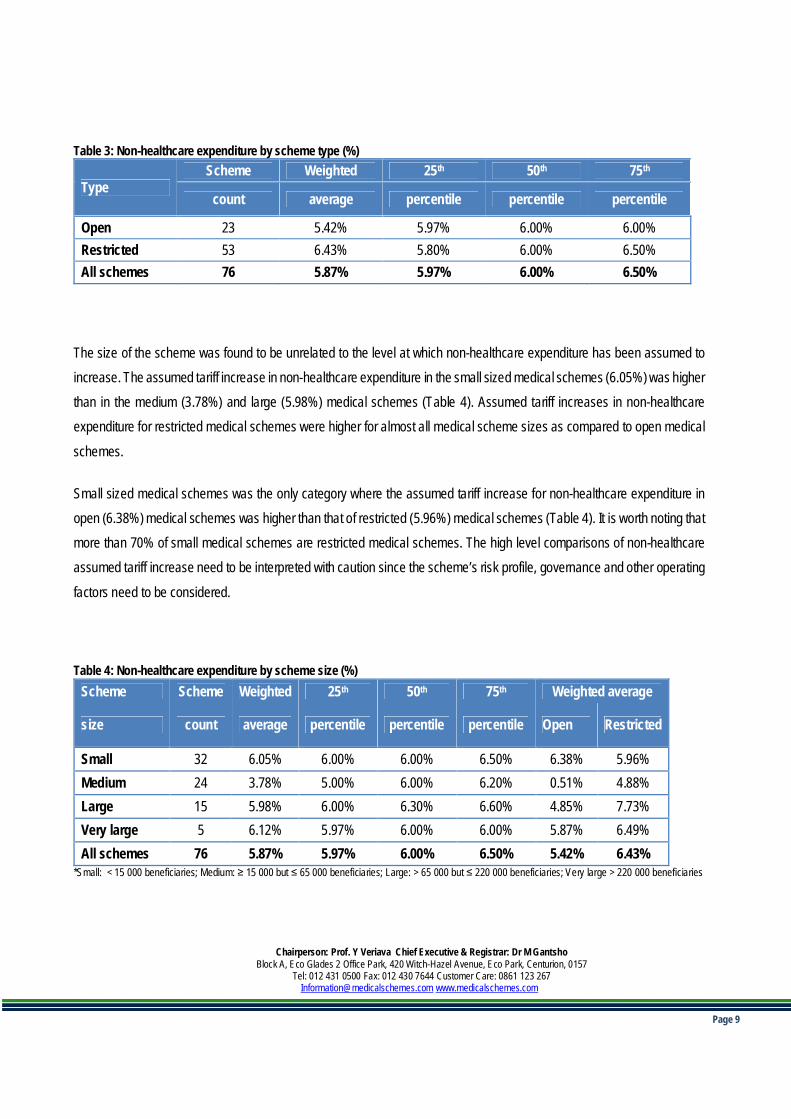
The size of the scheme was found to be unrelated to the level at which non-healthcare expenditure has been assumed toincrease. The assumed tariff increase in non-healthcare expenditure in the small sized medical schemes (6.05%) was higherthan in the medium (3.78%) and large (5.98%) medical schemes (Table 4). Assumed tariff increases in non-healthcareexpenditure for restricted medical schemes were higher for almost all medical scheme sizes as compared to open medical
schemes.
Small sized medical schemes was the only category where the assumed tariff increase for non-healthcare expenditure inopen (6.38%) medical schemes was higher than that of restricted (5.96%) medical schemes (Table 4). It is worth noting thatmore than 70% of small medical schemes are restricted medical schemes. The high level comparisons of non-healthcareassumed tariff increase need to be interpreted with caution since the scheme’s risk profile, governance and other operating
factors need to be considered.
Table 4: Non-healthcare expenditure by scheme size (%)Scheme Scheme Weighted 25th 50th 75th Weighted average
size count average percentile percentile percentile Open Restricted
Small 32 6.05% 6.00% 6.00% 6.50% 6.38% 5.96%Medium 24 3.78% 5.00% 6.00% 6.20% 0.51% 4.88%Large 15 5.98% 6.00% 6.30% 6.60% 4.85% 7.73%Very large 5 6.12% 5.97% 6.00% 6.00% 5.87% 6.49%All schemes 76 5.87% 5.97% 6.00% 6.50% 5.42% 6.43%
*Small: < 15 000 beneficiaries; Medium: ≥ 15 000 but ≤ 65 000 beneficiaries; Large: > 65 000 but ≤ 220 000 beneficiaries; Very large > 220 000 beneficiaries

Page 10
Chairperson: Prof. Y Veriava Chief Executive & Registrar: Dr M GantshoBlock A, Eco Glades 2 Office Park, 420 Witch-Hazel Avenue, Eco Park, Centurion, 0157
Tel: 012 431 0500 Fax: 012 430 7644 Customer Care: 0861 123 [email protected] www.medicalschemes.com
Scheme utilisation demographic increase assumptions for 2015
The weighted average assumed impact of utilisation and demographic changes on contribution increases across all medicalschemes was 2.94%. The assumed impact of utilisation and demographic changes on contribution increases assumptionsdid not differ significantly between open medical schemes (3.12%) and restricted medical schemes (2.72%). About 22medical schemes made assumptions of more than 3% in the impact of utilisation and demographic changes (Table 5).

Page 11
Chairperson: Prof. Y Veriava Chief Executive & Registrar: Dr M GantshoBlock A, Eco Glades 2 Office Park, 420 Witch-Hazel Avenue, Eco Park, Centurion, 0157
Tel: 012 431 0500 Fax: 012 430 7644 Customer Care: 0861 123 [email protected] www.medicalschemes.com
Table 5: Summary of the utilisation & demographic assumptions incorporated into overall contribution increase for the 2015financial year
Variable Weightedaverage**
25th
percentile50th
percentile75th
Percentile
Weighted average
Open Restricted
Private hospitalsWard fees 3.25% 1.00% 2.00% 3.00% 3.53% 2.90%Theatre fees 3.15% 1.00% 2.00% 3.00% 3.35% 2.90%Consumables 3.25% 1.00% 2.00% 3.00% 3.53% 2.90%Medicines 3.25% 1.00% 2.00% 3.00% 3.53% 2.90%Equipment 3.14% 0.60% 2.00% 2.96% 3.34% 2.89%Procedure 3.14% 0.60% 2.00% 2.96% 3.34% 2.89%Managed Care 2.86% 0.00% 1.50% 2.69% 3.18% 2.46%Other 3.14% 0.60% 2.00% 2.96% 3.34% 2.89%Public hospitalsWard fees 3.17% 0.62% 2.00% 3.00% 3.50% 2.76%Theatre fees 3.07% 0.60% 2.00% 3.00% 3.32% 2.76%Consumables 3.17% 0.62% 2.00% 3.00% 3.50% 2.76%Medicines 3.17% 0.62% 2.00% 3.00% 3.49% 2.76%Equipment 3.06% 0.00% 1.95% 2.96% 3.31% 2.75%Procedure 3.06% 0.00% 1.95% 2.96% 3.31% 2.75%Other 3.03% 0.00% 1.63% 2.96% 3.31% 2.67%Professional servicesGeneral practitioners 3.33% 0.50% 1.79% 2.96% 3.85% 2.69%Specialists 3.24% 0.74% 1.96% 3.00% 3.59% 2.81%Dentists 3.26% 0.00% 1.50% 2.96% 3.77% 2.61%Allied 3.18% 0.00% 1.63% 2.90% 3.65% 2.60%Other professional 3.44% 0.00% 1.50% 3.00% 3.60% 3.24%Medicines out-of-hospital 3.82% 0.60% 1.50% 2.96% 4.70% 2.72%Ex gratia payments 2.78% 0.00% 0.00% 1.63% 3.14% 2.34%Out-of-hospital managed care 2.45% 0.00% 0.00% 1.00% 2.78% 2.05%Non-healthcare expenditure 0.87% 0.00% 0.00% 0.00% 0.06% 1.88%
Overall weighted utilisationincrease 2.94% 0.75% 1.79% 3.05% 3.12% 2.72%
** Note the rounding off effect when calculating the total contribution assumption increase. All values are rounded to two decimals.

Page 12
Chairperson: Prof. Y Veriava Chief Executive & Registrar: Dr M GantshoBlock A, Eco Glades 2 Office Park, 420 Witch-Hazel Avenue, Eco Park, Centurion, 0157
Tel: 012 431 0500 Fax: 012 430 7644 Customer Care: 0861 123 [email protected] www.medicalschemes.com
Medical scheme total1 increase assumptions for 2015
The weighted average total assumed increase for 2015 across all medical schemes was 9.20%, which is similar to the 2014total cost assumption increase. The average total assumed increase for 75% of schemes was 9.51% or less. The summarystatistics for the overall cost assumption changes are shown in Table 6.
1 Due to rounding and weighting, tariff assumption increase and utilization tariff increase may not add up to the total cost assumption increase at level beyond onedecimal.

Page 13
Chairperson: Prof. Y Veriava Chief Executive & Registrar: Dr M GantshoBlock A, Eco Glades 2 Office Park, 420 Witch-Hazel Avenue, Eco Park, Centurion, 0157
Tel: 012 431 0500 Fax: 012 430 7644 Customer Care: 0861 123 [email protected] www.medicalschemes.com
Table 6: Summary of the most important assumptions for cost items incorporated into overall contribution increase for the2015 financial year
Variable Weightedaverage
25th
percentile50th
percentile75th
percentileWeighted average
Open RestrictedPrivate hospitalsWard fees 9.68% 8.43% 9.29% 10.50% 9.84% 9.48%Theatre fees 9.46% 8.30% 9.28% 10.50% 9.44% 9.48%Consumables 9.90% 8.30% 9.00% 10.50% 10.29% 9.42%Medicines 9.35% 7.50% 9.00% 10.00% 9.34% 9.36%Equipment 9.37% 8.00% 9.00% 10.30% 9.41% 9.31%Procedure 9.36% 8.00% 9.10% 10.31% 9.41% 9.31%Managed Care 8.80% 6.60% 8.74% 9.50% 8.87% 8.71%Other 9.28% 7.86% 9.10% 10.27% 9.31% 9.24%Public hospitalsWard fees 9.45% 7.86% 9.10% 10.50% 9.79% 9.02%Theatre fees 9.23% 7.63% 9.00% 10.30% 9.39% 9.02%Consumables 9.67% 7.50% 9.00% 10.50% 10.25% 8.96%Medicines 9.20% 7.20% 8.86% 9.91% 9.43% 8.91%Equipment 9.14% 7.20% 9.00% 10.17% 9.37% 8.86%Procedure 9.14% 7.20% 9.00% 10.03% 9.36% 8.87%Other 9.10% 7.00% 9.00% 10.00% 9.35% 8.80%Professional servicesGeneral practitioners 9.61% 7.00% 8.23% 9.53% 10.28% 8.77%Specialists 9.68% 7.34% 8.50% 9.50% 10.31% 8.89%Dentists 9.51% 6.77% 8.15% 9.14% 10.18% 8.67%Allied health professionals 9.93% 6.60% 8.15% 9.10% 10.95% 8.65%Other Professional 9.69% 6.79% 8.06% 9.34% 10.02% 9.29%Medicines out-of-hospital 10.11% 7.00% 8.50% 9.60% 11.10% 8.87%Ex gratia payments 8.19% 0.00% 6.20% 8.15% 8.35% 7.99%Out-of-hospital managed care 8.95% 6.00% 6.60% 8.50% 9.16% 8.69%Non-healthcare expenditure 6.74% 6.00% 6.00% 6.50% 5.47% 8.32%Reserve loading -0.05% 0.00% 0.00% 0.00% 0.06% -0.18%Total assumption increase 920% 6.89% 8.46% 9.51% 9.18% 9.11%
Page 14
Chairperson: Prof. Y Veriava Chief Executive & Registrar: Dr M GantshoBlock A, Eco Glades 2 Office Park, 420 Witch-Hazel Avenue, Eco Park, Centurion, 0157
Tel: 012 431 0500 Fax: 012 430 7644 Customer Care: 0861 123 [email protected] www.medicalschemes.com
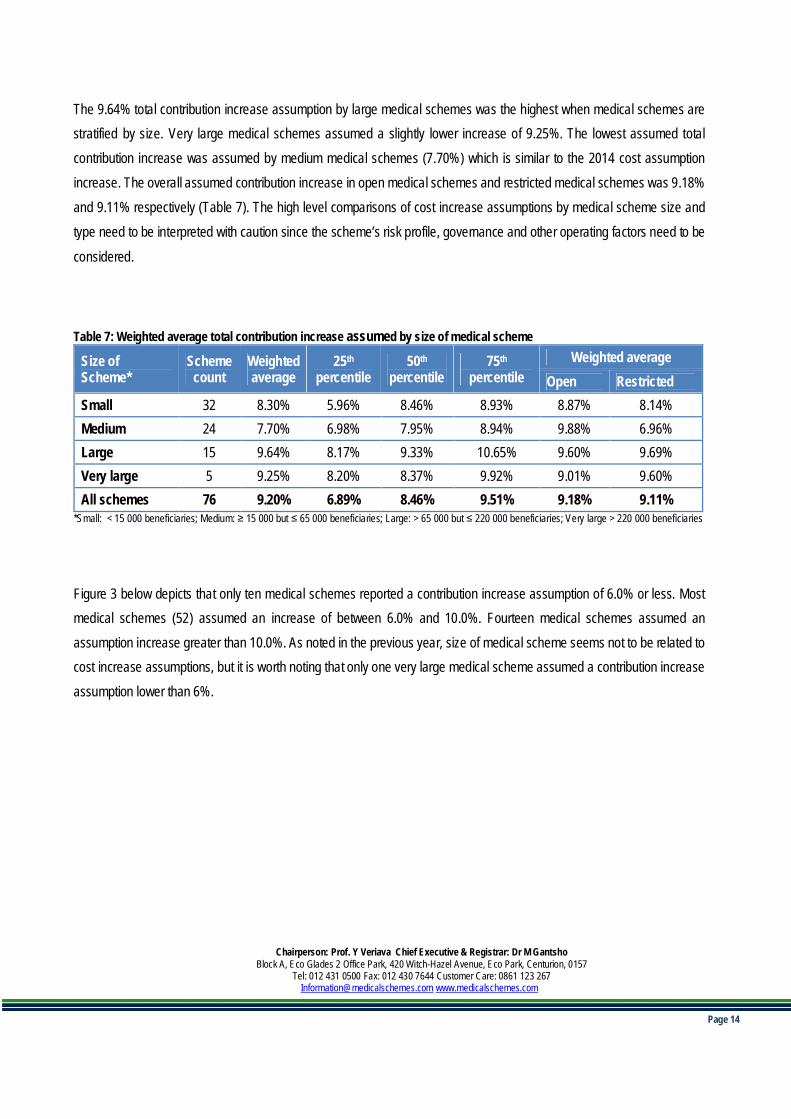
The 9.64% total contribution increase assumption by large medical schemes was the highest when medical schemes arestratified by size. Very large medical schemes assumed a slightly lower increase of 9.25%. The lowest assumed totalcontribution increase was assumed by medium medical schemes (7.70%) which is similar to the 2014 cost assumptionincrease. The overall assumed contribution increase in open medical schemes and restricted medical schemes was 9.18%and 9.11% respectively (Table 7). The high level comparisons of cost increase assumptions by medical scheme size andtype need to be interpreted with caution since the scheme’s risk profile, governance and other operating factors need to be
considered.
Table 7: Weighted average total contribution increase assumed by size of medical scheme
Size ofScheme*
Schemecount
Weightedaverage
25th
percentile50th
percentile75th
percentileWeighted average
Open RestrictedSmall 32 8.30% 5.96% 8.46% 8.93% 8.87% 8.14%Medium 24 7.70% 6.98% 7.95% 8.94% 9.88% 6.96%Large 15 9.64% 8.17% 9.33% 10.65% 9.60% 9.69%Very large 5 9.25% 8.20% 8.37% 9.92% 9.01% 9.60%All schemes 76 9.20% 6.89% 8.46% 9.51% 9.18% 9.11%
*Small: < 15 000 beneficiaries; Medium: ≥ 15 000 but ≤ 65 000 beneficiaries; Large: > 65 000 but ≤ 220 000 beneficiaries; Very large > 220 000 beneficiaries
Figure 3 below depicts that only ten medical schemes reported a contribution increase assumption of 6.0% or less. Mostmedical schemes (52) assumed an increase of between 6.0% and 10.0%. Fourteen medical schemes assumed anassumption increase greater than 10.0%. As noted in the previous year, size of medical scheme seems not to be related tocost increase assumptions, but it is worth noting that only one very large medical scheme assumed a contribution increaseassumption lower than 6%.

Page 15
Chairperson: Prof. Y Veriava Chief Executive & Registrar: Dr M GantshoBlock A, Eco Glades 2 Office Park, 420 Witch-Hazel Avenue, Eco Park, Centurion, 0157
Tel: 012 431 0500 Fax: 012 430 7644 Customer Care: 0861 123 [email protected] www.medicalschemes.com
Figure 3: Total contribution increase bands by size of medical scheme
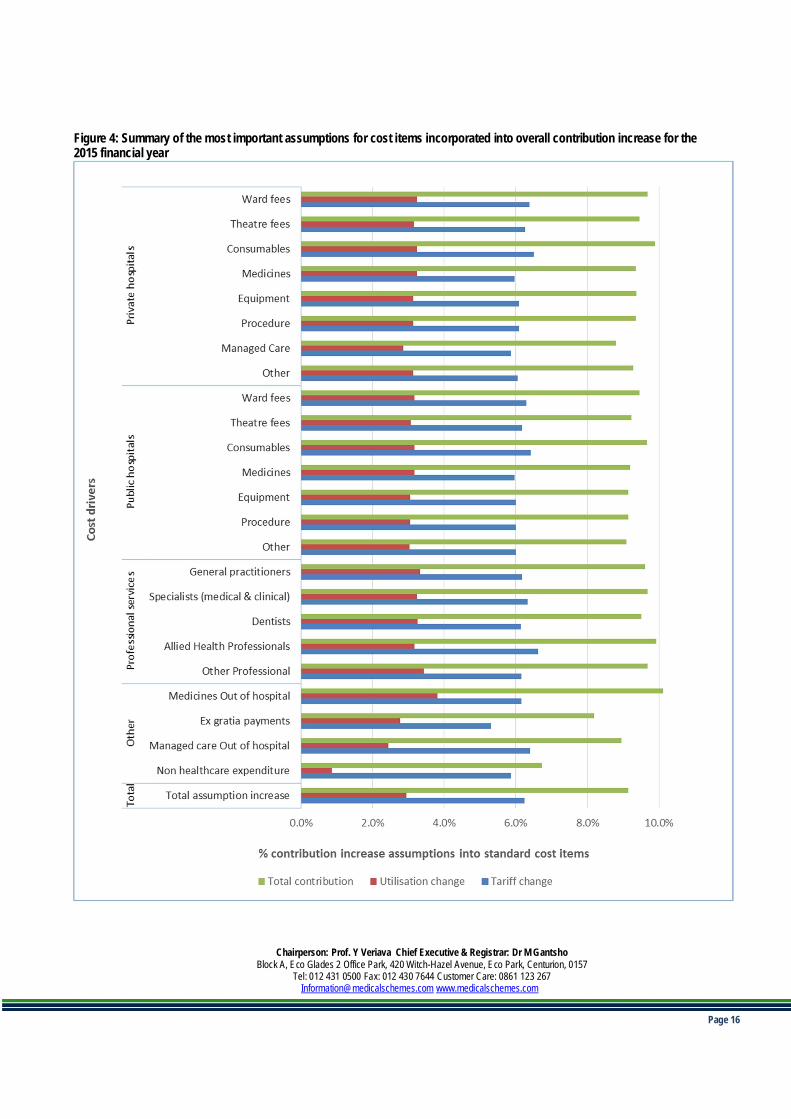
Figure 4 below displays a summary of the most important assumptions for cost items incorporated into the overallcontribution assumption increase for the 2015 financial year. The assumed tariff increase assumption for most of the costdrivers are above 6.0%. The weighted average assumed effect of utilisation and demographic changes was between 2.0%and 3.8% for most cost drivers. The effect of utilisation on out-of-hospital managed care and non-healthcare costs was2.45% and 0.87%, respectively.
Page 16
Chairperson: Prof. Y Veriava Chief Executive & Registrar: Dr M GantshoBlock A, Eco Glades 2 Office Park, 420 Witch-Hazel Avenue, Eco Park, Centurion, 0157
Tel: 012 431 0500 Fax: 012 430 7644 Customer Care: 0861 123 [email protected] www.medicalschemes.com
Figure 4: Summary of the most important assumptions for cost items incorporated into overall contribution increase for the2015 financial year

Page 17
Chairperson: Prof. Y Veriava Chief Executive & Registrar: Dr M GantshoBlock A, Eco Glades 2 Office Park, 420 Witch-Hazel Avenue, Eco Park, Centurion, 0157
Tel: 012 431 0500 Fax: 012 430 7644 Customer Care: 0861 123 [email protected] www.medicalschemes.com
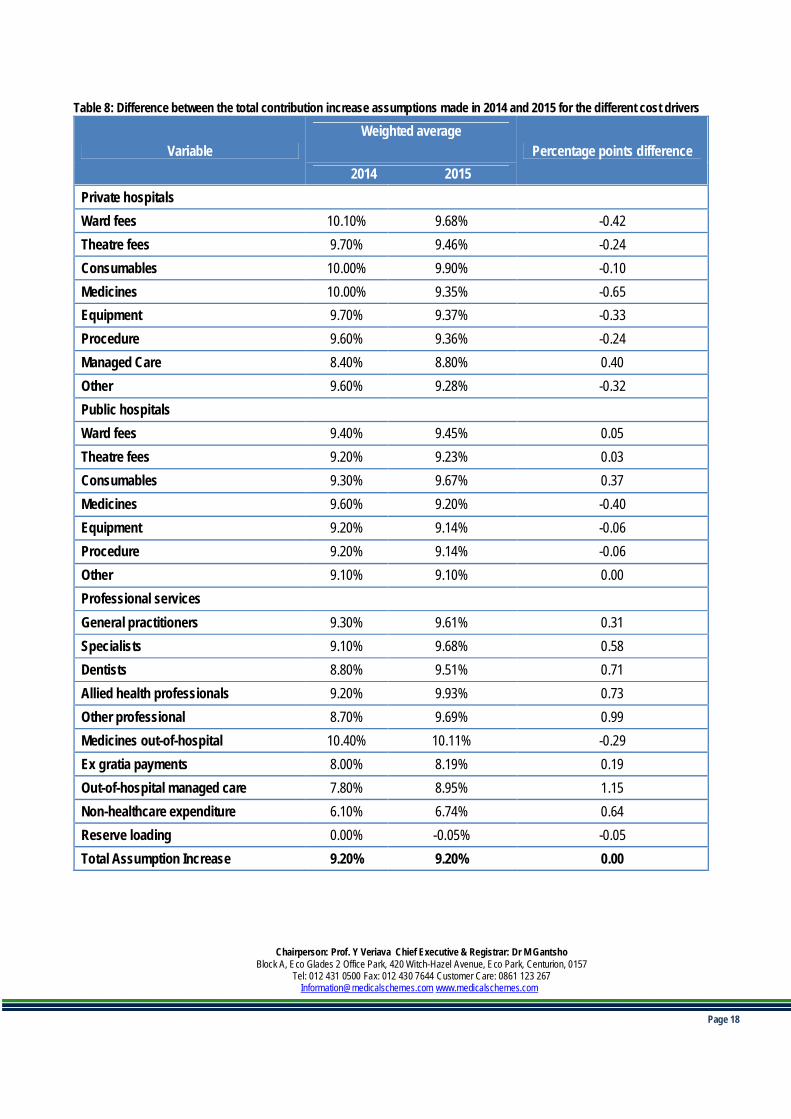
Table 8 below shows the difference between the total contribution increase assumptions made in 2014 and 2015 for thedifferent cost drivers. The total contribution increase assumption made in 2015 was similar (9.20%) to the total contribution
increase assumption made in 2014. The difference is negligible for most cost drivers.
The effect of managed care, in- and out-of-hospital, seems to be more significant in 2015 than in 2014. The assumed
increase for in- and out-of-hospital managed care as a cost driver is 1.15 and 0.4 percent points higher in 2015.
Almost all cost assumption increases for private hospital cost items for 2015 were lower than 2014 assumptions. Managedcare was the only cost item within private hospitals whose 2015 cost increase assumptions exceeds the 2014 cost increase
assumptions.
All professional services cost items in 2015 reported slightly higher cost increase assumptions. A slight decrease wasobserved in medicines, with cost assumptions for 2015 decreasing by about 0.29 percentage points as compared to 2014assumptions. This was despite the fact that the SEP was not available at the time of making these assumptions.
Page 18
Chairperson: Prof. Y Veriava Chief Executive & Registrar: Dr M GantshoBlock A, Eco Glades 2 Office Park, 420 Witch-Hazel Avenue, Eco Park, Centurion, 0157
Tel: 012 431 0500 Fax: 012 430 7644 Customer Care: 0861 123 [email protected] www.medicalschemes.com
Table 8: Difference between the total contribution increase assumptions made in 2014 and 2015 for the different cost drivers
VariableWeighted average
Percentage points difference2014 2015
Private hospitalsWard fees 10.10% 9.68% -0.42Theatre fees 9.70% 9.46% -0.24Consumables 10.00% 9.90% -0.10Medicines 10.00% 9.35% -0.65Equipment 9.70% 9.37% -0.33Procedure 9.60% 9.36% -0.24Managed Care 8.40% 8.80% 0.40Other 9.60% 9.28% -0.32Public hospitalsWard fees 9.40% 9.45% 0.05Theatre fees 9.20% 9.23% 0.03Consumables 9.30% 9.67% 0.37Medicines 9.60% 9.20% -0.40Equipment 9.20% 9.14% -0.06Procedure 9.20% 9.14% -0.06Other 9.10% 9.10% 0.00Professional servicesGeneral practitioners 9.30% 9.61% 0.31Specialists 9.10% 9.68% 0.58Dentists 8.80% 9.51% 0.71Allied health professionals 9.20% 9.93% 0.73Other professional 8.70% 9.69% 0.99Medicines out-of-hospital 10.40% 10.11% -0.29Ex gratia payments 8.00% 8.19% 0.19Out-of-hospital managed care 7.80% 8.95% 1.15Non-healthcare expenditure 6.10% 6.74% 0.64Reserve loading 0.00% -0.05% -0.05Total Assumption Increase 9.20% 9.20% 0.00

Page 19
Chairperson: Prof. Y Veriava Chief Executive & Registrar: Dr M GantshoBlock A, Eco Glades 2 Office Park, 420 Witch-Hazel Avenue, Eco Park, Centurion, 0157
Tel: 012 431 0500 Fax: 012 430 7644 Customer Care: 0861 123 [email protected] www.medicalschemes.com
The CMS continues to have the following concerns with regards to cost assumptions as submitted by the medical schemes:-
The private hospitals total cost increase assumptions is on average about 3 percentage points higher than the maximumcost increase assumption as per the Circular 34 guidance. The private hospital’s average utilisation assumption of around3% remain a concern as private hospital costs make up a significant portion of medical schemes’ expenditure. The impactof utilisation on the total cost of providing cost effective medical scheme benefits cannot be ignored as it has a materialimpact on the key drivers of costs in the industry.
Furthermore, limited competition within the hospital market continues whilst there are significant barriers of entry for newhospitals. Some medical schemes highlighted that amongst other factors, high tariff increases are also caused by privateprovider market structure factors such as the fee-for service (FFS) reimbursement environment, and issues related toprovider-induced demand, member moral hazard and poor coordination of care between different levels of care. This trendtherefore implies that whilst very large medical schemes might be benefiting from economies of scale and their dominancewithin the medical schemes market other medical schemes are still price takers who are largely reimburse private providersthrough a fee-for-service method. However as noted earlier, the high level comparisons of hospitals cost increaseassumptions by medical scheme size and type need to be interpreted with caution since the scheme’s risk profile,
governance and other operating factors need to be considered.
Furthermore, within a FFS system environment there is no constructive link between cost-effectiveness, quality healthoutcomes, in tariff negotiation and determination. Private hospital groups have become more powerful as they haveconsolidated, leading to diminished bargaining power for some schemes. Medical schemes are therefore encouraged tocontinue to undertake active steps to influence member health-seeking behaviour, cost effective management of clinicalconditions and to constantly review the role of managed care organisations in managing health care costs whilstdemonstrating quality health outcomes
Pharmaceutical costs assumptions within the hospitals decreased when compared to 2014 cost assumptions. Medicinepricing is assumed to increase by about 6.0% on average which is lower than the approved SEP increase of 7.5% for 2015.The effect of utilisation caused an increase of about 9.35% on the average cost of medicines in private hospitals. Whilstacknowledging the impact of the push factors (such as new drugs, currency depreciation and utilisation) and pull factors(such as managed care, generic market and voluntary SEP reduction), which influence medicine expenditure, privatehospitals should also continue to manage medicine utilisation within their facilities including encouraging the use of genericsubstitution and better coordination of care.
Expenditure on specialists continues to be one of the key cost drivers for healthcare costs. The weighted average costincrease assumption of 9.6% (tariff increase of 6.34%; utilisation component of 3.24%) for specialists is partly responsiblefor the larger than CPI increase in medical scheme contributions. In addition, specialist driven care with a limited role for

Page 20
Chairperson: Prof. Y Veriava Chief Executive & Registrar: Dr M GantshoBlock A, Eco Glades 2 Office Park, 420 Witch-Hazel Avenue, Eco Park, Centurion, 0157
Tel: 012 431 0500 Fax: 012 430 7644 Customer Care: 0861 123 [email protected] www.medicalschemes.com
GP’s is not cost effective and contributes greatly to private healthcare costs. Also, specialists continue to have a specificrelationship with private hospitals in a fee-for-service market; where they remain a significant driver of healthcareexpenditure within hospitals. Whilst acknowledging the challenges encountered by medical schemes in influencing the entirecontinuum of care, it is recommended that medical schemes should continue applying managed care principles inchannelling patients to the appropriate level of care including influencing cost effective delivery of healthcare. Furthermore,medical schemes should strengthen care coordination within their preferred providers.
The out-of-hospital managed care assumed average cost increase of 7.80% in 2014 increased to 8.95% in 2015. Whilstacknowledging that there are several factors influencing managed healthcare expenditure within the medical schemesindustry, medical schemes are encouraged to continue to undertake active steps to influence member health-seekingbehaviour and the care-providing behaviour of doctors and other health professionals. Whilst managing access, utilisation,costs, and health quality outcomes.
Non-healthcare costs continue to vary considerably within the medical schemes industry with an average cost assumptionincrease of 6.74% compared to the average cost assumption increase of 6.10% in 2014. This increase represents about0.64 percentage points increase from the previous year’s assumed cost increase. With regards to administration fees, it isrecommended that medical schemes continue to undertake an efficiency analysis so as to identify any suboptimaladministrative operations and processes. Improved administrative efficiency has a potential to free resources within theschemes which could be transferred to medical schemes members in terms of affordable contribution increases or othermember benefits. Also, oversight by medical schemes is encouraged to ensure that the scheme funds are not spent ongoods and services not involving medical services.

Page 21
Chairperson: Prof. Y Veriava Chief Executive & Registrar: Dr M GantshoBlock A, Eco Glades 2 Office Park, 420 Witch-Hazel Avenue, Eco Park, Centurion, 0157
Tel: 012 431 0500 Fax: 012 430 7644 Customer Care: 0861 123 [email protected] www.medicalschemes.com
Conclusion
It is encouraging to see that the assumed tariff increase assumption for many schemes is now closer to the advised tariffincrease assumption of 6% provided in Circular 34 of 2014. The reported weighted average assumed tariff increase fordifferent cost drivers ranged between 5.31% and 6.63% with the overall weighted average assumed tariff increase being6.25%.
However cost increase assumption for hospitals and specialists remain on average 3% higher than the maximum guidelineprovided by CMS. Cognisant of the demand side factors, the oligopolistic nature of the private hospital market, the specialistand hospital relationship in a fee for service market and information asymmetry is amongst factors responsible for the higherthan CPI cost increase assumption. While very few large medical schemes might be benefiting marginally from economiesof scale, medical schemes remain largely price takers in this market.
The impact of assumed utilisation changes, which was 2.94% remain a concern. The CMS has noted that utilisationestimates submitted as part of cost increase assumptions by some medical schemes do not correlate with worsening orimproving demographic and disease profile of medical schemes for both open and restricted schemes. Combining these,the assumed tariff and utilisation change assumptions have pushed the industry average cost assumption increase to 9.2%for 2015. This is similar to the 2014 figure of 9.2%.
Managed care cost increase assumptions continue to outpace inflation year-on-year. Medical schemes must continue toseek and demonstrate value for managed care expenditure in the form of quality healthcare outcomes and cost containment.Furthermore, as recommended earlier, medical schemes should attempt to address cost factors to the best of their ability,because failure to do this will lead to a continued affordability challenge in accessing healthcare, thereby threatening thelong term sustainability of the industry since members are price sensitive. High input costs continue to be one of the barriersto entry for new members and will cause further challenges to growth in the industry.
MR DANIEL LEHUTJOACTING CHIEF EXECUTIVE AND REGISTRAR
COUNCIL FOR MEDICAL SCHEMES