city council meeting august 2, 2011. part i – regulations and terminology may 17, 2011 part ii...
Post on 21-Dec-2015
213 views
TRANSCRIPT
City Budget and Finances
City Council MeetingAugust 2, 2011
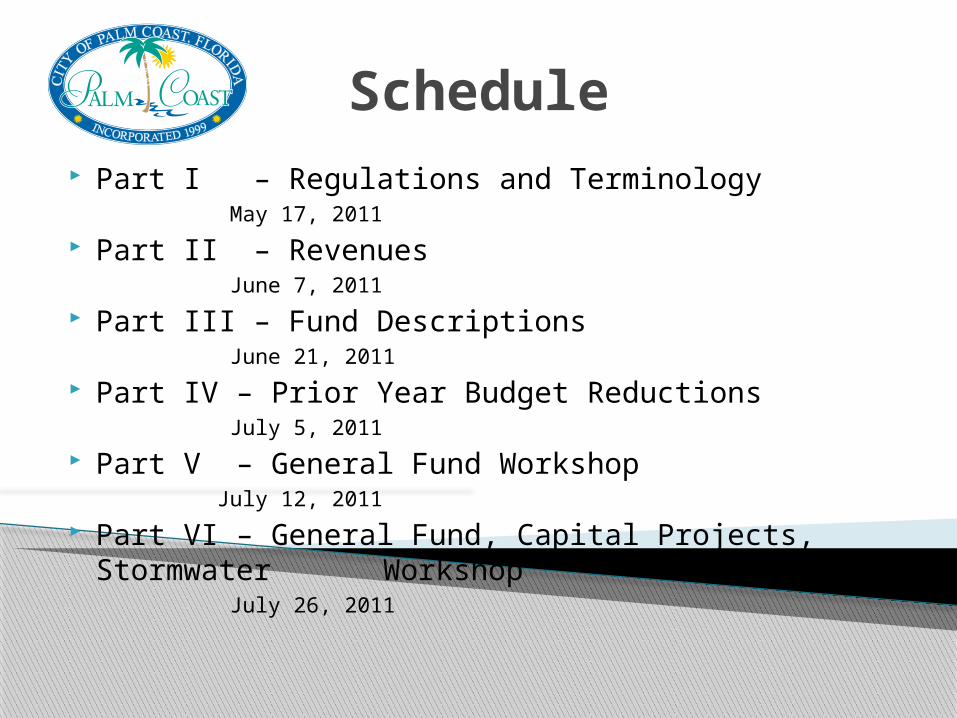
Part I – Regulations and Terminology May 17, 2011
Part II – Revenues June 7, 2011
Part III – Fund Descriptions June 21, 2011
Part IV – Prior Year Budget Reductions July 5, 2011
Part V – General Fund Workshop July 12, 2011
Part VI – General Fund, Capital Projects, Stormwater Workshop July 26, 2011
Schedule
Property Tax Impacts
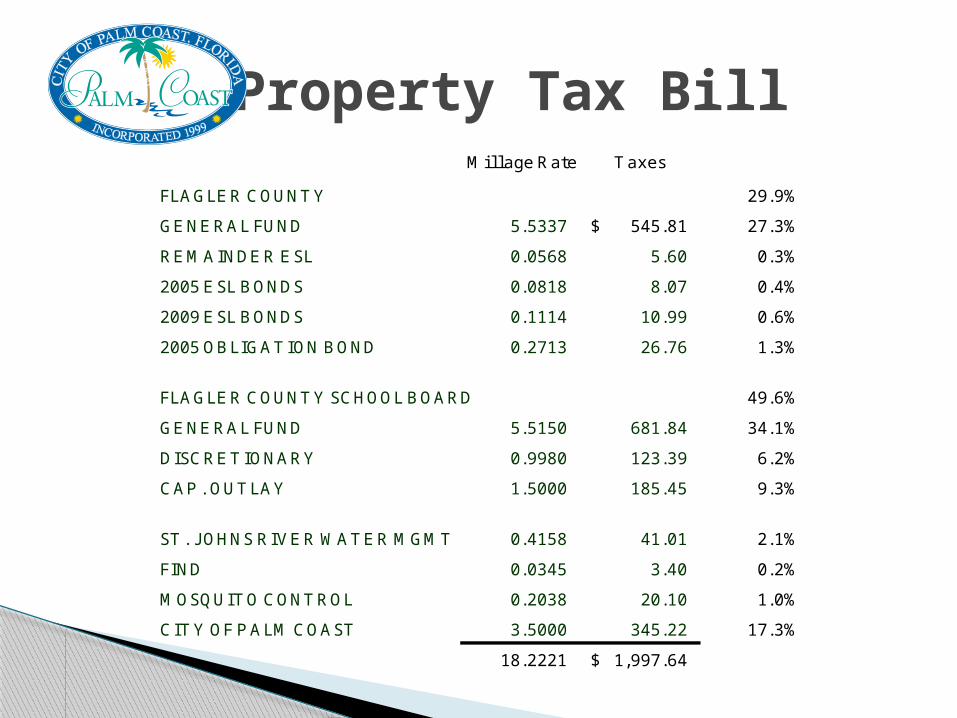
Property Tax BillMil lage Rate T axes
FLAGLE R COUNT Y 29.9%
GE NE RAL FUND 5.5337 545.81$ 27.3%
RE MAINDE R E SL 0.0568 5.60 0.3%
2005 E SL BONDS 0.0818 8.07 0.4%
2009 E SL BONDS 0.1114 10.99 0.6%
2005 OBLIGAT ION BOND 0.2713 26.76 1.3%
FLAGLE R COUNT Y SCHOOL BOARD 49.6%
GE NE RAL FUND 5.5150 681.84 34.1%
DISCRE T IONARY 0.9980 123.39 6.2%
CAP . OUT LAY 1.5000 185.45 9.3%
ST . J OHNS RIVE R WAT E R MGMT 0.4158 41.01 2.1%
FIND 0.0345 3.40 0.2%
MOSQUIT O CONT ROL 0.2038 20.10 1.0%
CIT Y OF P ALM COAST 3.5000 345.22 17.3%
18.2221 1,997.64$
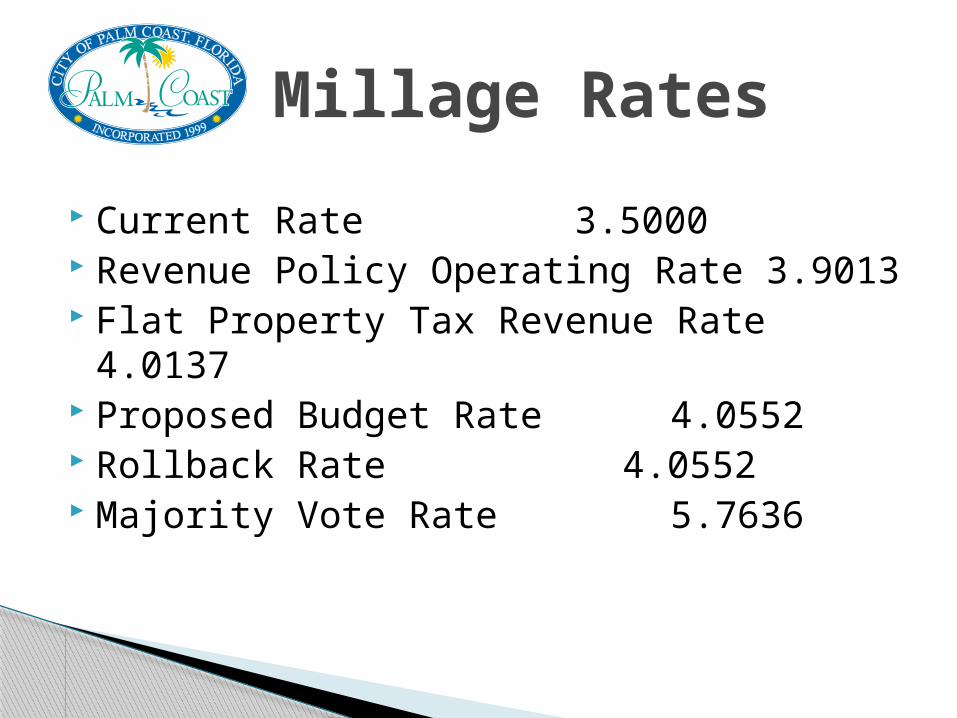
Current Rate 3.5000 Revenue Policy Operating Rate 3.9013 Flat Property Tax Revenue Rate 4.0137 Proposed Budget Rate 4.0552 Rollback Rate 4.0552 Majority Vote Rate 5.7636
Millage Rates
Taxes are hurting a lot of people and they will no longer be able to live here especially the retired. I have been in Palm Coast for nearly 10 years and have to maintain my home by myself and if everything keeps going up pretty soon you will have more people moving out of this city because we can't afford to live here anymore.
Property Taxes - Perception
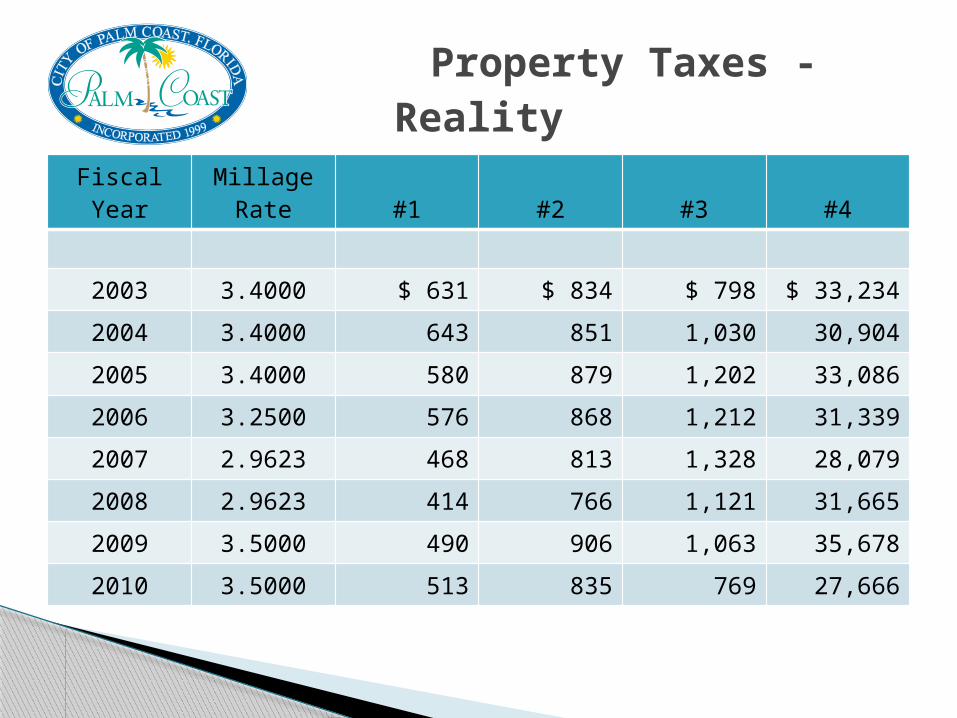
FiscalYear
MillageRate #1 #2 #3 #4
2003 3.4000 $ 631 $ 834 $ 798 $ 33,234
2004 3.4000 643 851 1,030 30,904
2005 3.4000 580 879 1,202 33,086
2006 3.2500 576 868 1,212 31,339
2007 2.9623 468 813 1,328 28,079
2008 2.9623 414 766 1,121 31,665
2009 3.5000 490 906 1,063 35,678
2010 3.5000 513 835 769 27,666
Property Taxes - Reality
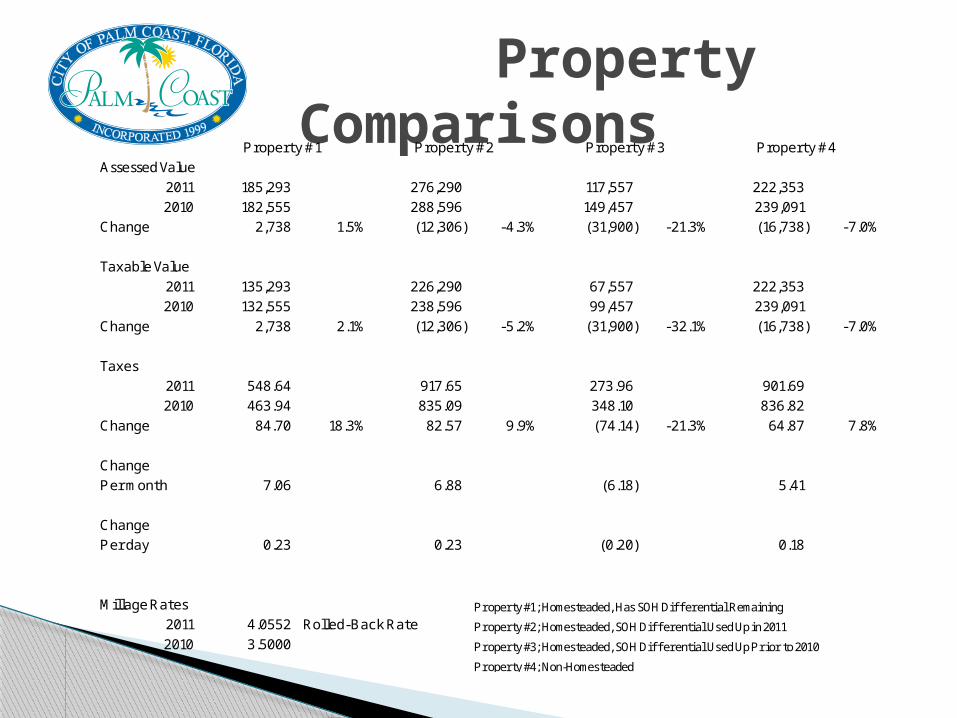
Property ComparisonsProperty #1 Property #2 Property #3 Property #4
Assessed Value2011 185,293 276,290 117,557 222,353 2010 182,555 288,596 149,457 239,091
Change 2,738 1.5% (12,306) -4.3% (31,900) -21.3% (16,738) -7.0%
Taxable Value2011 135,293 226,290 67,557 222,353 2010 132,555 238,596 99,457 239,091
Change 2,738 2.1% (12,306) -5.2% (31,900) -32.1% (16,738) -7.0%
Taxes2011 548.64 917.65 273.96 901.69 2010 463.94 835.09 348.10 836.82
Change 84.70 18.3% 82.57 9.9% (74.14) -21.3% 64.87 7.8%
ChangePer month 7.06 6.88 (6.18) 5.41
ChangePer day 0.23 0.23 (0.20) 0.18
Millage Rates Property #1; Homesteaded, Has SOH Diff erential Remaining
2011 4.0552 Rolled-Back Rate Property #2; Homesteaded, SOH Diff erential Used Up in 2011
2010 3.5000 Property #3; Homesteaded, SOH Diff erential Used Up Prior to 2010
Property #4; Non-Homesteaded
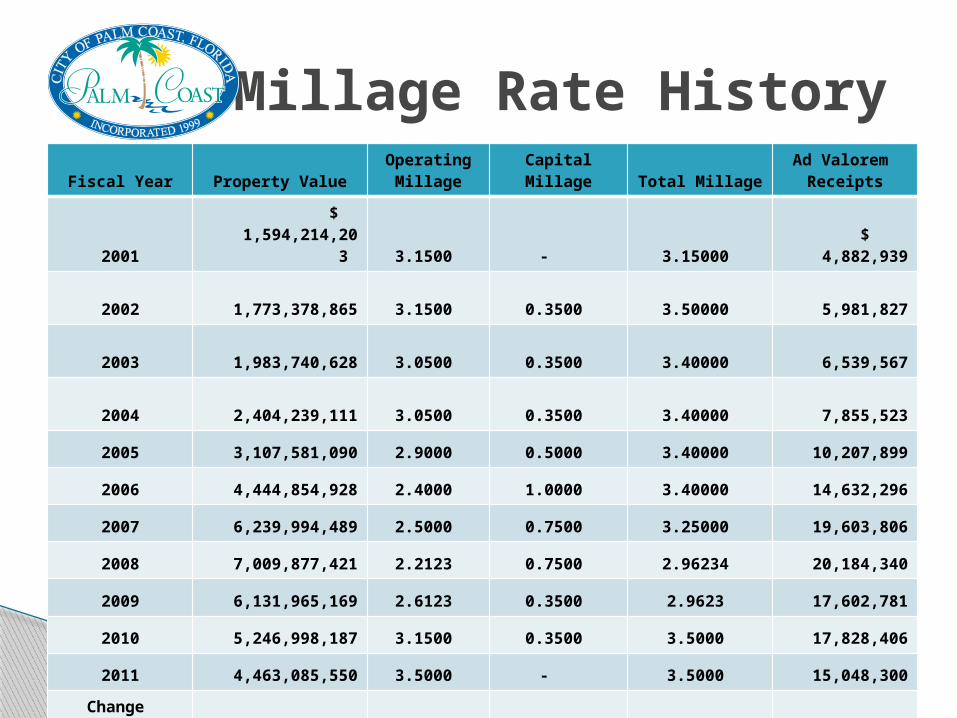
Fiscal Year Property ValueOperating
Millage Capital Millage Total MillageAd Valorem
Receipts
2001 $ 1,594,214,203 3.1500 - 3.15000 $ 4,882,939
2002 1,773,378,865 3.1500 0.3500 3.50000 5,981,827
2003 1,983,740,628 3.0500 0.3500 3.40000 6,539,567
2004 2,404,239,111 3.0500 0.3500 3.40000 7,855,523
2005 3,107,581,090 2.9000 0.5000 3.40000 10,207,899
2006 4,444,854,928 2.4000 1.0000 3.40000 14,632,296
2007 6,239,994,489 2.5000 0.7500 3.25000 19,603,806
2008 7,009,877,421 2.2123 0.7500 2.96234 20,184,340
2009 6,131,965,169 2.6123 0.3500 2.9623 17,602,781
2010 5,246,998,187 3.1500 0.3500 3.5000 17,828,406
2011 4,463,085,550 3.5000 - 3.5000 15,048,300
Change 2007-2011 (1,776,908,939) 1.0000 (0.7500) 0.2500 (4,555,506)
Percentage Change -28.5% 40.0% -100.0% 7.7% -23.2%
Millage Rate History
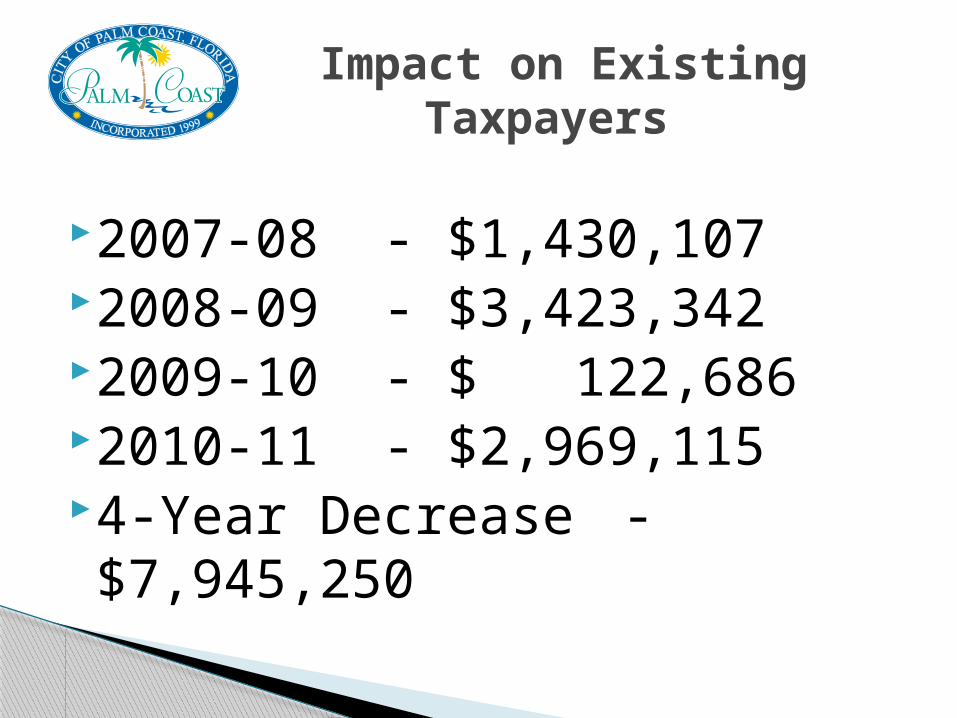
2007-08 - $1,430,1072008-09 - $3,423,3422009-10 - $ 122,6862010-11 - $2,969,1154-Year Decrease - $7,945,250
Impact on Existing Taxpayers
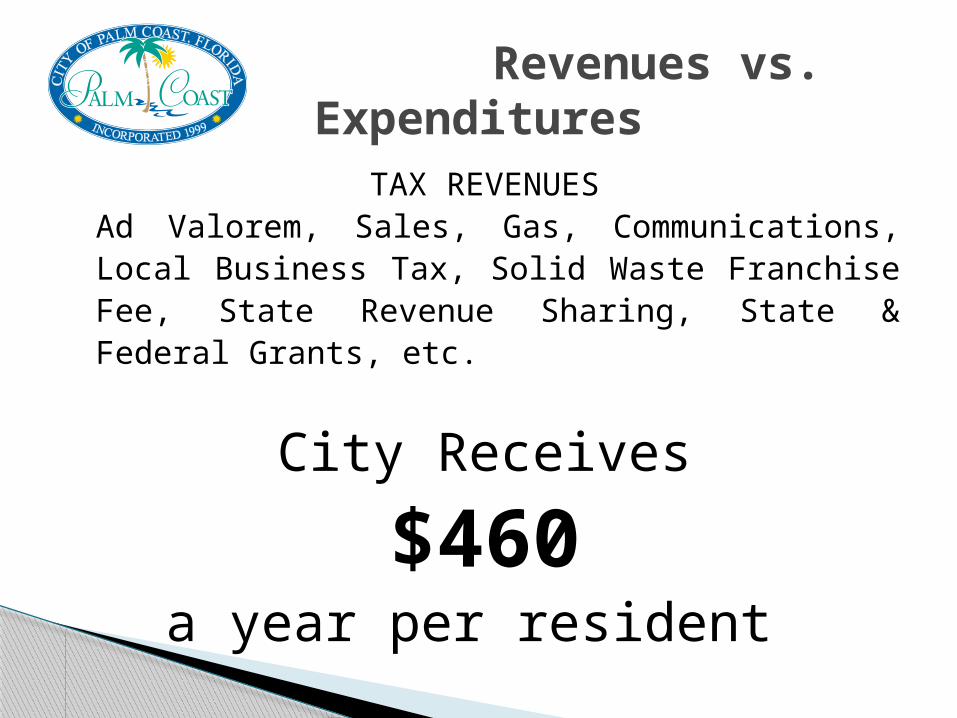
TAX REVENUESAd Valorem, Sales, Gas, Communications, Local Business Tax, Solid Waste Franchise Fee, State Revenue Sharing, State & Federal Grants, etc.
City Receives
$460a year per resident
Revenues vs. Expenditures
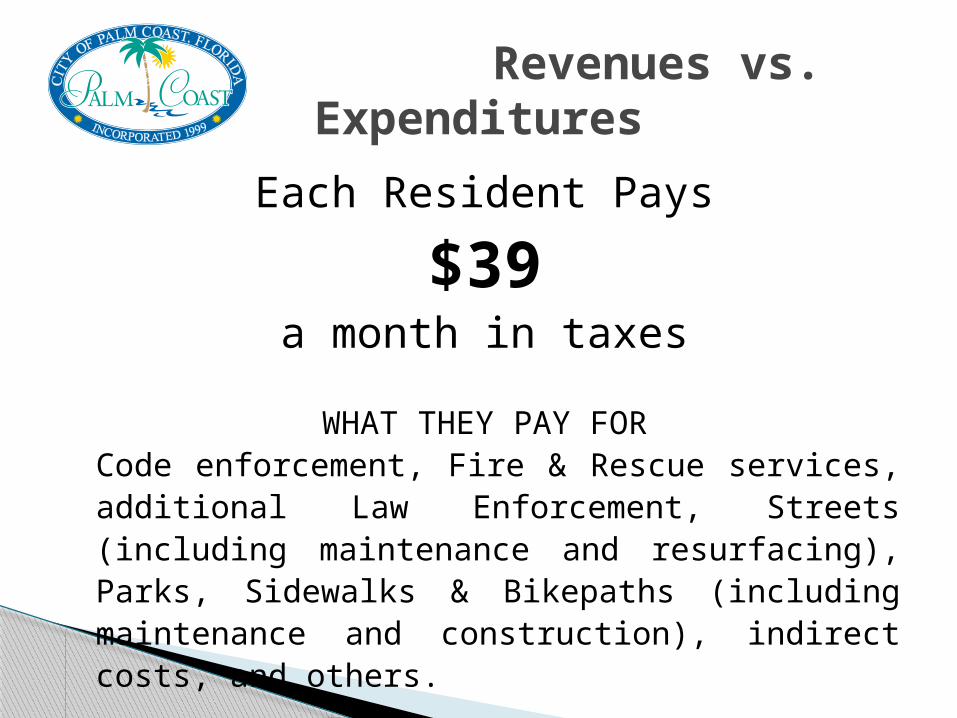
Each Resident Pays
$39a month in taxes
WHAT THEY PAY FORCode enforcement, Fire & Rescue services, additional Law Enforcement, Streets (including maintenance and resurfacing), Parks, Sidewalks & Bikepaths (including maintenance and construction), indirect costs, and others.
Revenues vs. Expenditures
General Fund
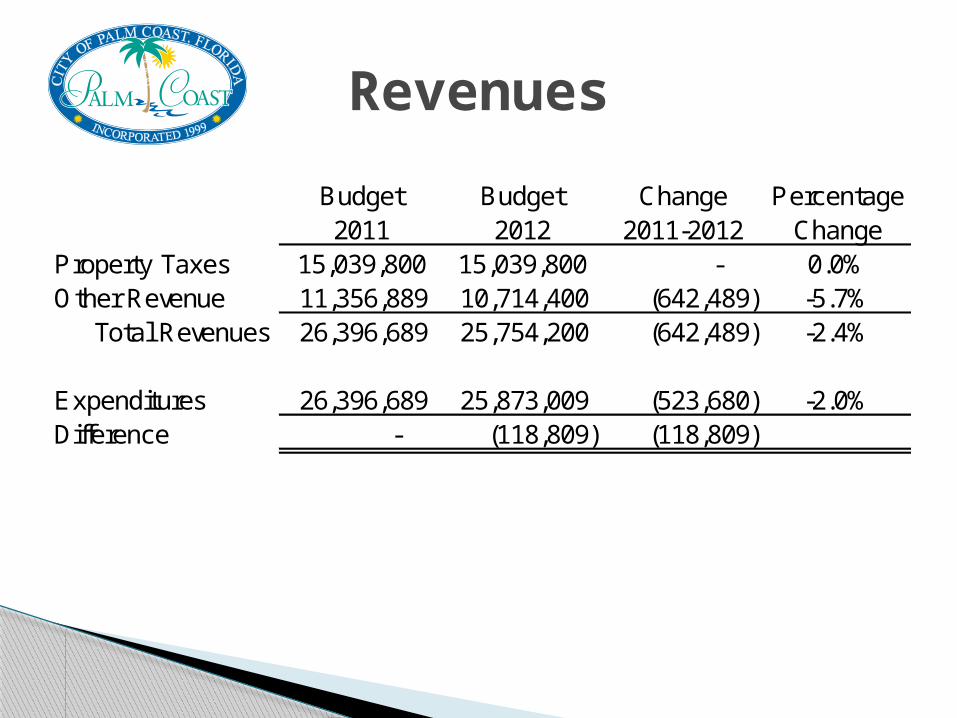
Revenues
Budget Budget Change Percentage2011 2012 2011-2012 Change
Property Taxes 15,039,800 15,039,800 - 0.0%Other Revenue 11,356,889 10,714,400 (642,489) -5.7% Total Revenues 26,396,689 25,754,200 (642,489) -2.4%
Expenditures 26,396,689 25,873,009 (523,680) -2.0%Difference - (118,809) (118,809)

Expenditures
Budget Budget Change Percentage2011 2012 2011-2012 Change
Expenditures 26,396,689 25,873,009 (523,680) -2.0%
Personnel (FTE) 216.48 210.98 (5.50) -2.5%
Actual Estimated Change Percentage2007 2011 2007-2011 Change
Expenditures 25,433,849 26,074,506 640,657 2.5%
Personnel (FTE) 228.40 216.48 (11.92) -5.2%Per 1,000 Population 3.23 2.89 (0.34) -10.5%
General FundOptions
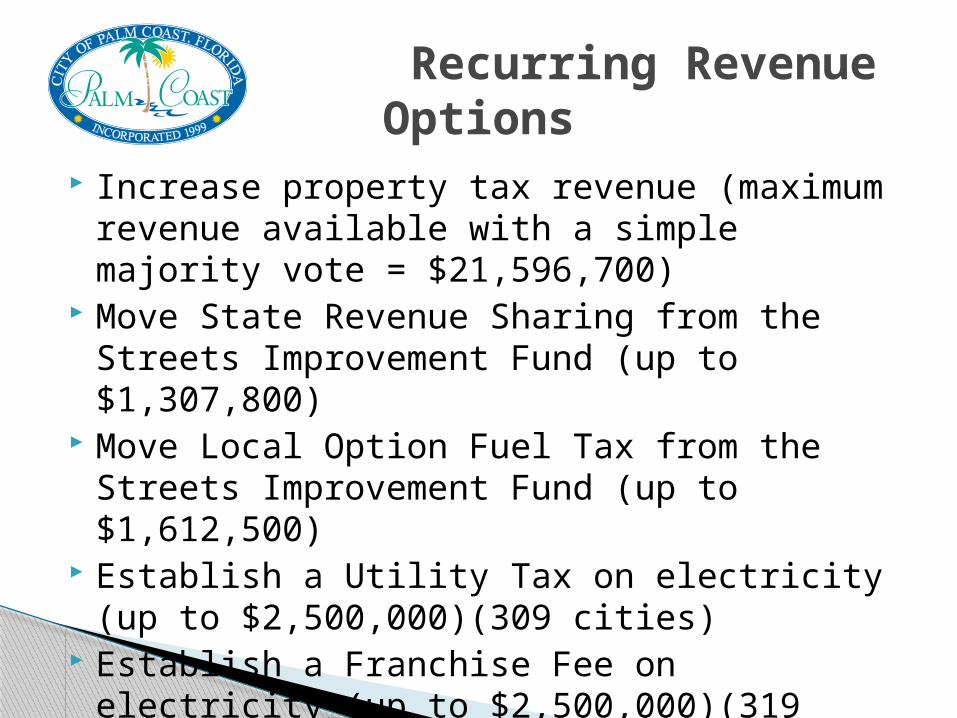
Increase property tax revenue (maximum revenue available with a simple majority vote = $21,596,700)
Move State Revenue Sharing from the Streets Improvement Fund (up to $1,307,800)
Move Local Option Fuel Tax from the Streets Improvement Fund (up to $1,612,500)
Establish a Utility Tax on electricity (up to $2,500,000)(309 cities)
Establish a Franchise Fee on electricity (up to $2,500,000)(319 cities)
Recurring Revenue Options
FUTURE • Sustainable operating budget if revenue levels out, but capital infrastructure
will have to be addressed in the future• Future cuts, if any, must come from “boots on the streets”
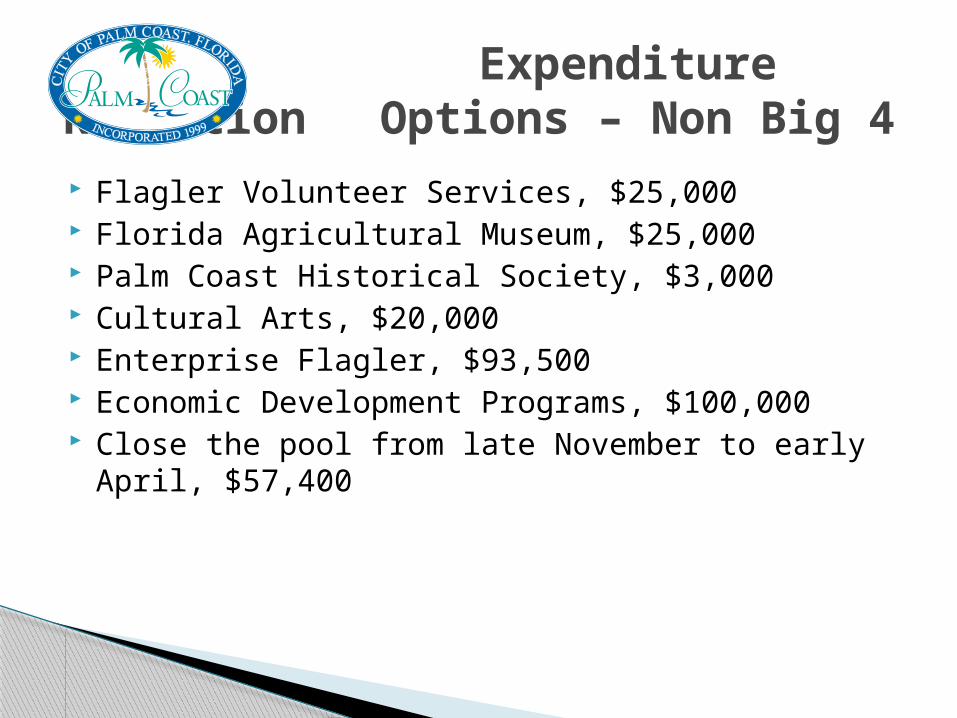
Flagler Volunteer Services, $25,000 Florida Agricultural Museum, $25,000 Palm Coast Historical Society, $3,000 Cultural Arts, $20,000 Enterprise Flagler, $93,500 Economic Development Programs, $100,000 Close the pool from late November to early April,
$57,400
Expenditure Reduction Options – Non Big 4
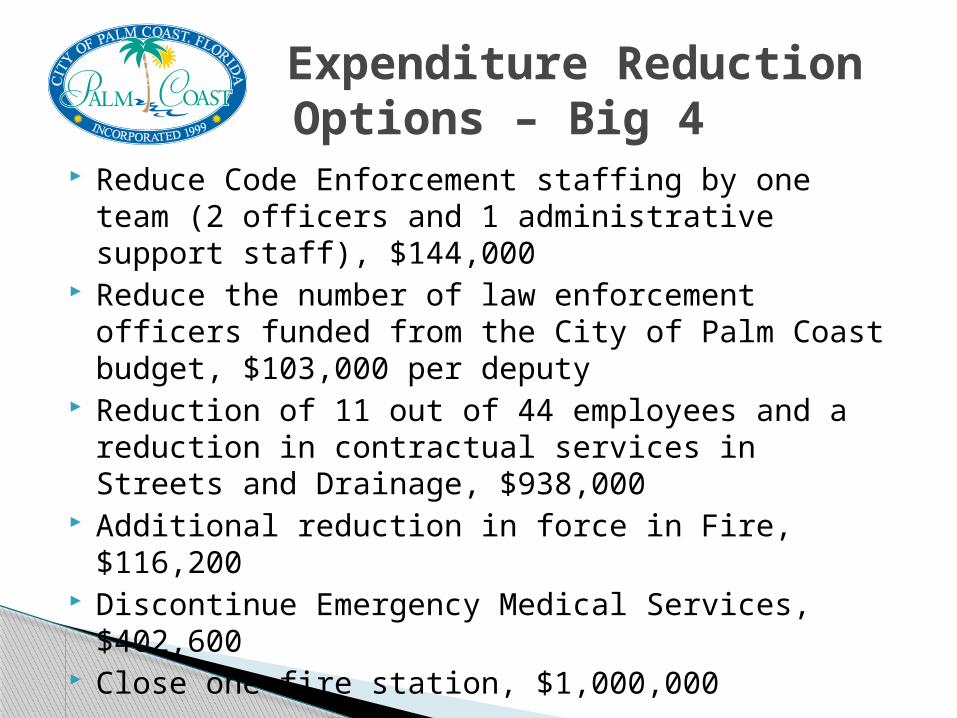
Reduce Code Enforcement staffing by one team (2 officers and 1 administrative support staff), $144,000
Reduce the number of law enforcement officers funded from the City of Palm Coast budget, $103,000 per deputy
Reduction of 11 out of 44 employees and a reduction in contractual services in Streets and Drainage, $938,000
Additional reduction in force in Fire, $116,200 Discontinue Emergency Medical Services, $402,600 Close one fire station, $1,000,000
Expenditure Reduction Options – Big 4
Additional Considerations
Capital funding allocation◦Reestablish millage for capital projects
Stormwater maintenance support◦Increase in stormwater fee◦Establish millage for stormwater capital◦Use ½ cent sales tax for pipe
replacement
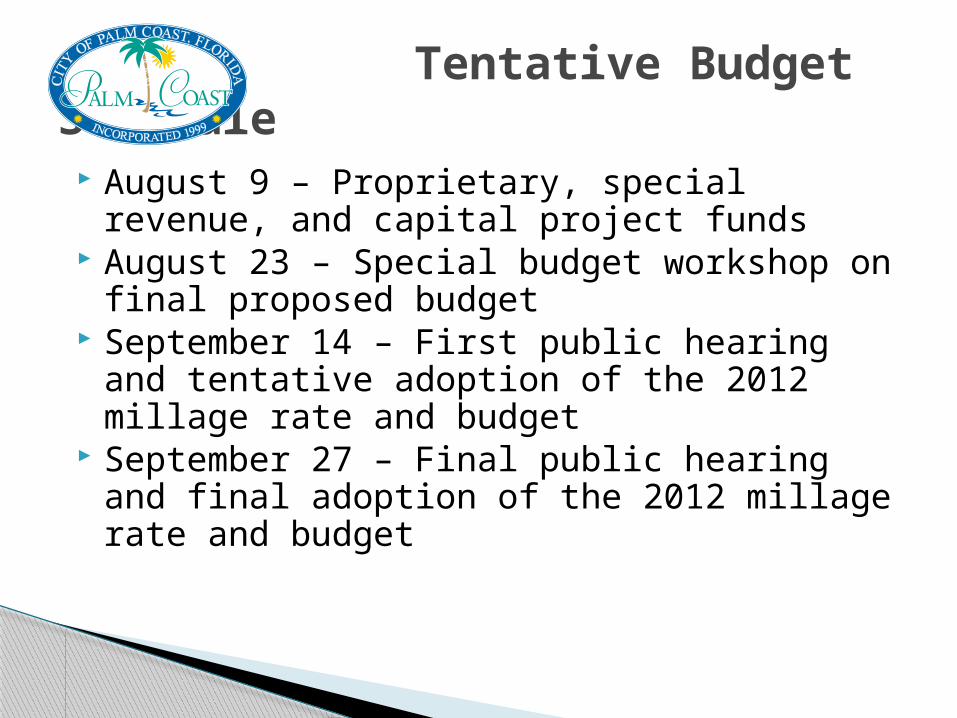
Tentative Budget Schedule
August 9 – Proprietary, special revenue, and capital project funds
August 23 – Special budget workshop on final proposed budget
September 14 – First public hearing and tentative adoption of the 2012 millage rate and budget
September 27 – Final public hearing and final adoption of the 2012 millage rate and budget
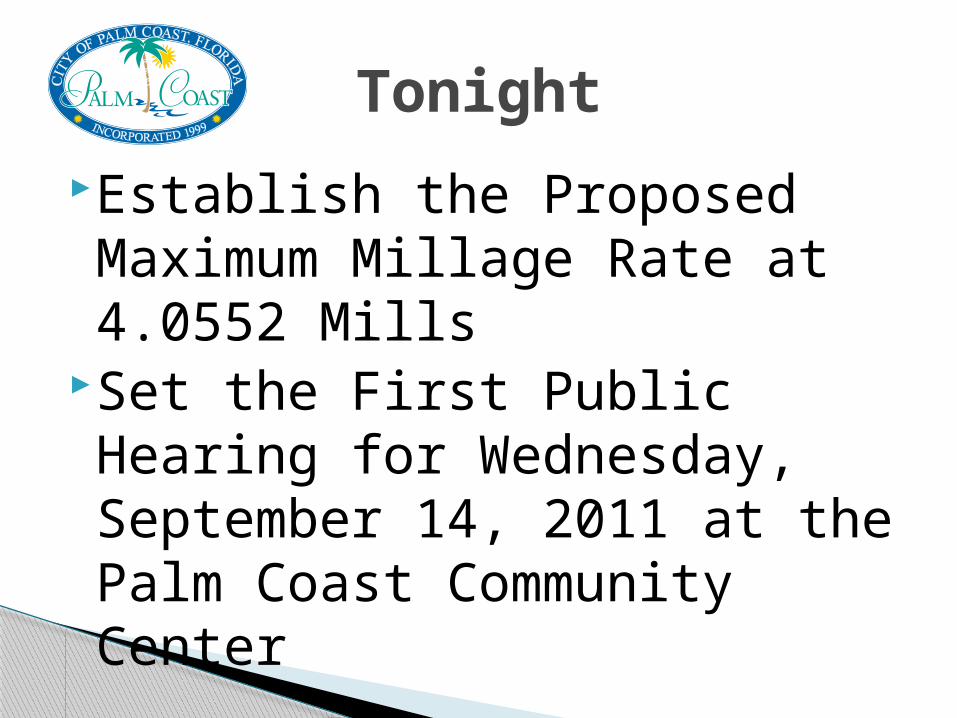
Establish the Proposed Maximum Millage Rate at 4.0552 Mills
Set the First Public Hearing for Wednesday, September 14, 2011 at the Palm Coast Community Center
Tonight