city of phoenix civic improvement corporation junior … wastewater... · city of phoenix civic...
TRANSCRIPT
City of Phoenix Civic Improvement Corporation
Junior Lien Wastewater System Revenue Refunding Bonds, Series 2016
Presented by the City of Phoenix October 25, 2016
Investor Presentation
1
Disclaimer
This electronic Investor Presentation you are about to view is provided as of October 25, 2016 for a proposed offering by the City of Phoenix, Arizona (the “City”), through the City of Phoenix Civic Improvement Corporation, of the Junior Lien Wastewater System Revenue Refunding Bonds, Series 2016 (the “Bonds”). Market prices, financial data, and other information provided herein are not warranted as to completeness or accuracy and are subject to change without notice. If you are viewing this presentation after October 25, 2016, there may have been events that occurred subsequent to such date that would have a material adverse effect on the financial information that is presented herein, and neither the City, nor Morgan Stanley & Co. LLC, as representative of the Underwriters, have undertaken any obligation to update this electronic presentation.
This Investor Presentation is provided for your information and convenience only. By accessing this presentation, you agree not to duplicate, copy, download, screen capture, electronically store or record this Investor Presentation, or to produce, publish or distribute this Investor Presentation in any form whatsoever. This Investor Presentation does not constitute an offer to sell or the solicitation of an offer to buy any security or other financial instrument, including the Bonds, or to adopt any investment strategy. Any offer or solicitation with respect to the Bonds will be made solely by means of the Preliminary Official Statement or Official Statement, which describe the actual terms of such Bonds. The Underwriters make no representations as to the legal, tax, credit or accounting treatment of any transactions mentioned herein, or any other effects such transactions may have on you and your affiliates or any other parties to such transactions and their respective affiliates. In no event shall the Underwriters or the Issuer be liable for any use by any party of, for any decision made or action taken by any party in reliance upon, or for any inaccuracies or errors in, or omissions from, the information contained herein and such information may not be relied upon by you in evaluating the merits of participating in any transaction mentioned herein. Nothing in these materials constitutes a commitment by the Underwriters or any of their affiliates to enter into any transaction. No assurance can be given that any transaction mentioned herein could in fact be executed. Any investment decision regarding the Bonds should only be made after a careful review of the complete Preliminary Official Statement. You will be responsible for consulting with your own advisors and making your own independent investigation and appraisal of the risks, benefits, appropriateness and suitability of the proposed transaction and any other transactions contemplated by this presentation, and the Issuer and the Underwriters are not making any recommendations (personal or otherwise) or giving any investment advice and will have no liability with respect thereto. Transactions involving the Bonds may not be suitable for all investors. You should consult with your own advisors as to the suitability of the Bonds for your particular circumstances. Past performance is not indicative of future returns, which will vary. This Investor Presentation may contain “forward‐looking” statements that involve risks, uncertainties and assumptions. If the risks or uncertainties ever materialize or the assumptions prove incorrect, the results may differ materially from those expressed or implied by such forward‐looking statements. We caution you not to place undue reliance on these statements. All statements other than the statements of historical fact could be deemed forward‐looking. All opinions, estimates, projections, forecasts and valuations are preliminary, indicative and are subject to change without notice. Prospective investors should contact their salesperson at, and execute transactions through the Underwriters for the Bonds qualified in their home jurisdiction unless governing law permits otherwise.
2
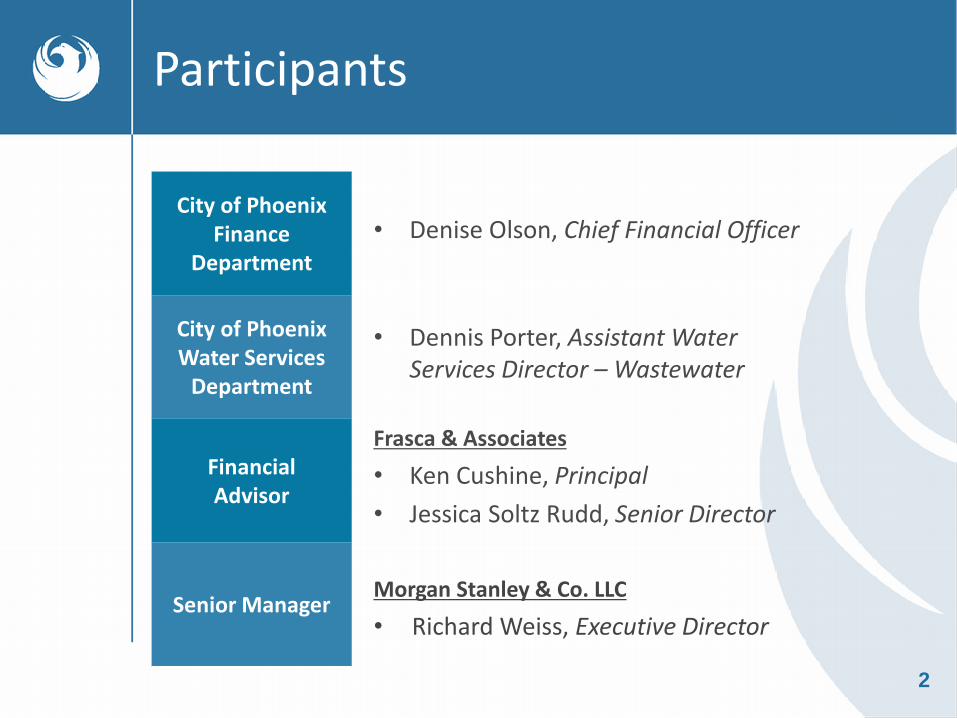
Participants
City of Phoenix Finance
Department
City of Phoenix Water Services
Department
Financial Advisor
Senior Manager
• Denise Olson, Chief Financial Officer
• Dennis Porter, Assistant Water Services Director – Wastewater
Frasca & Associates
• Ken Cushine, Principal
• Jessica Soltz Rudd, Senior Director
Morgan Stanley & Co. LLC
• Richard Weiss, Executive Director
3
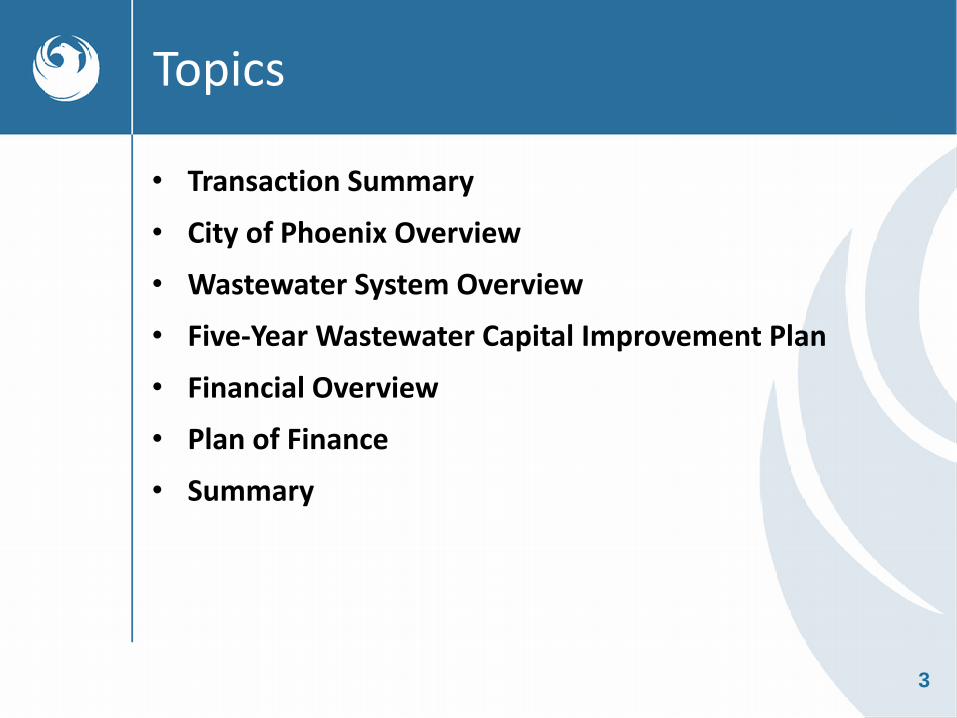
Topics
• Transaction Summary
• City of Phoenix Overview
• Wastewater System Overview
• Five-Year Wastewater Capital Improvement Plan
• Financial Overview
• Plan of Finance
• Summary
4
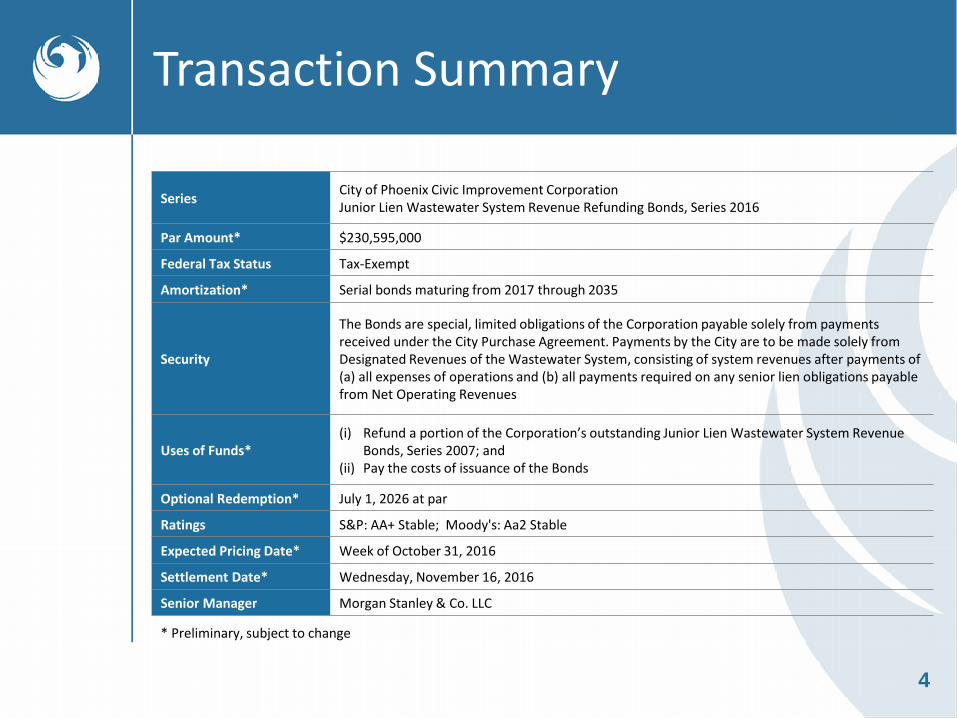
Transaction Summary
Series City of Phoenix Civic Improvement Corporation Junior Lien Wastewater System Revenue Refunding Bonds, Series 2016
Par Amount* $230,595,000
Federal Tax Status Tax-Exempt
Amortization* Serial bonds maturing from 2017 through 2035
Security
The Bonds are special, limited obligations of the Corporation payable solely from payments received under the City Purchase Agreement. Payments by the City are to be made solely from Designated Revenues of the Wastewater System, consisting of system revenues after payments of (a) all expenses of operations and (b) all payments required on any senior lien obligations payable from Net Operating Revenues
Uses of Funds* (i) Refund a portion of the Corporation’s outstanding Junior Lien Wastewater System Revenue
Bonds, Series 2007; and (ii) Pay the costs of issuance of the Bonds
Optional Redemption* July 1, 2026 at par
Ratings S&P: AA+ Stable; Moody's: Aa2 Stable
Expected Pricing Date* Week of October 31, 2016
Settlement Date* Wednesday, November 16, 2016
Senior Manager Morgan Stanley & Co. LLC
* Preliminary, subject to change

City of Phoenix Overview

6
City of Phoenix Overview
• The City of Phoenix operates under a Council-Manager form of government
– The Phoenix City Council consists of a Mayor and eight Council members and is responsible for setting policy
– The City Manager is responsible for executing Council policies and administering City operations
• 6th largest city in the U.S. based upon population – 1.53 million as of July 2015 – population has grown 55% since 1990
• Greater Phoenix accounts for approximately 72.6% of Arizona’s employment
• Phoenix unemployment rate of 4.8% is at its lowest since 2008, and is below the U.S. rate of 4.9%
Sources: U.S. Census Bureau, Arizona Department of Administration, U.S. Department of Labor

7
Employment Mix: Phoenix MSA and U.S.
• The Phoenix MSA is the largest economic center in the State with a healthy mix of employment across industry sectors and mirrors that of the U.S.
• Since the end of the recession, Phoenix MSA employment has increased 13.6% compared with 9.3% nationally (June 2009 to July 2016)
• Phoenix MSA employment was up 3.4% year-to-date through July 2016, compared to an increase of 1.8% nationally
Services 44.1%
Government 15.5%
Manufacturing 8.7%
Construction 4.4%
Trade 15.3%
Financial Activities 5.8%
Other 6.2%
Services 46.1%
Government 11.9% Manufacturing
6.2%
Construction 5.1%
Trade 16.1%
Financial Activities 8.8% Other
5.8%
2016 Phoenix MSA Non-Farm Wage & Employment by Sector 2016 U.S. Non-Farm Wage & Employment by Sector
Sources: Arizona Department of Administration, U.S. Department of Labor, U.S. Bureau of Labor Statistics

8
Phoenix MSA Real Estate Market
• As of July 2016, median housing prices for new homes increased 2.5% compared to July 2015 and the median price for resale homes increased 7.5% over the same period
• As of the second quarter of 2016, the U.S. median sales price for an existing (resale) single-family home was $240,700 and the median sales price for a similar home in Greater Phoenix was $234,700
• The median housing price in Greater Phoenix continues to remain low relative to most major western cities such as Salt Lake City, Los Angeles, San Diego, Denver, Seattle and Austin
Sources: R.L. Brown, National Association of Realtors
Wastewater System Overview
10
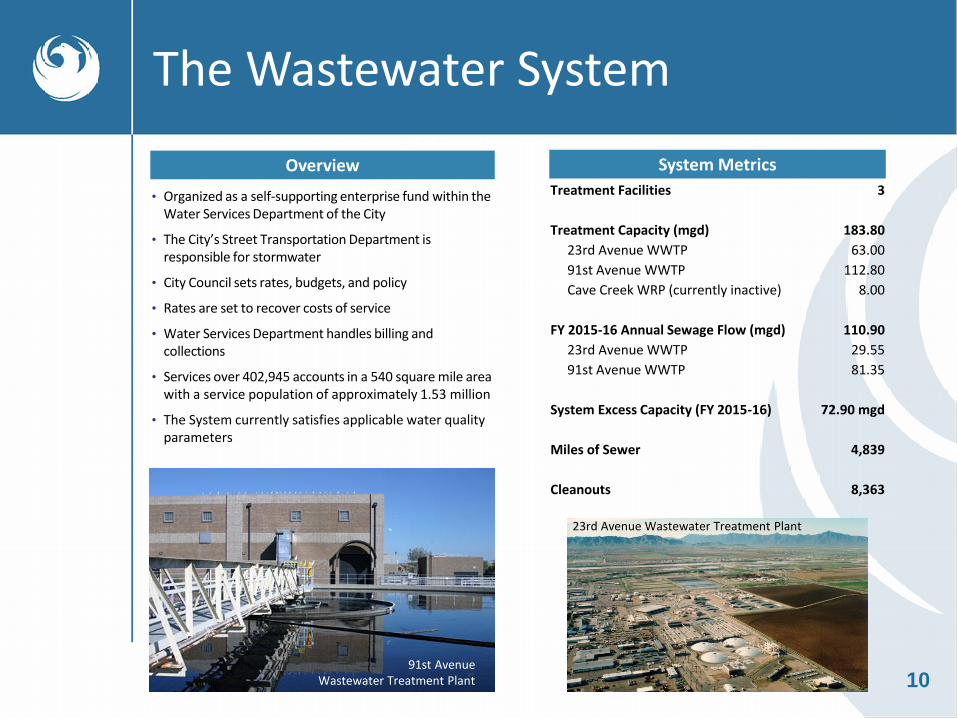
The Wastewater System
Overview
• Organized as a self-supporting enterprise fund within the Water Services Department of the City
• The City’s Street Transportation Department is responsible for stormwater
• City Council sets rates, budgets, and policy
• Rates are set to recover costs of service
• Water Services Department handles billing and collections
• Services over 402,945 accounts in a 540 square mile area with a service population of approximately 1.53 million
• The System currently satisfies applicable water quality parameters
System Metrics
91st Avenue Wastewater Treatment Plant
Treatment Facilities 3
Treatment Capacity (mgd) 183.80
23rd Avenue WWTP 63.00
91st Avenue WWTP 112.80
Cave Creek WRP (currently inactive) 8.00
FY 2015-16 Annual Sewage Flow (mgd) 110.90
23rd Avenue WWTP 29.55
91st Avenue WWTP 81.35
System Excess Capacity (FY 2015-16) 72.90 mgd
Miles of Sewer 4,839
Cleanouts 8,363
23rd Avenue Wastewater Treatment Plant
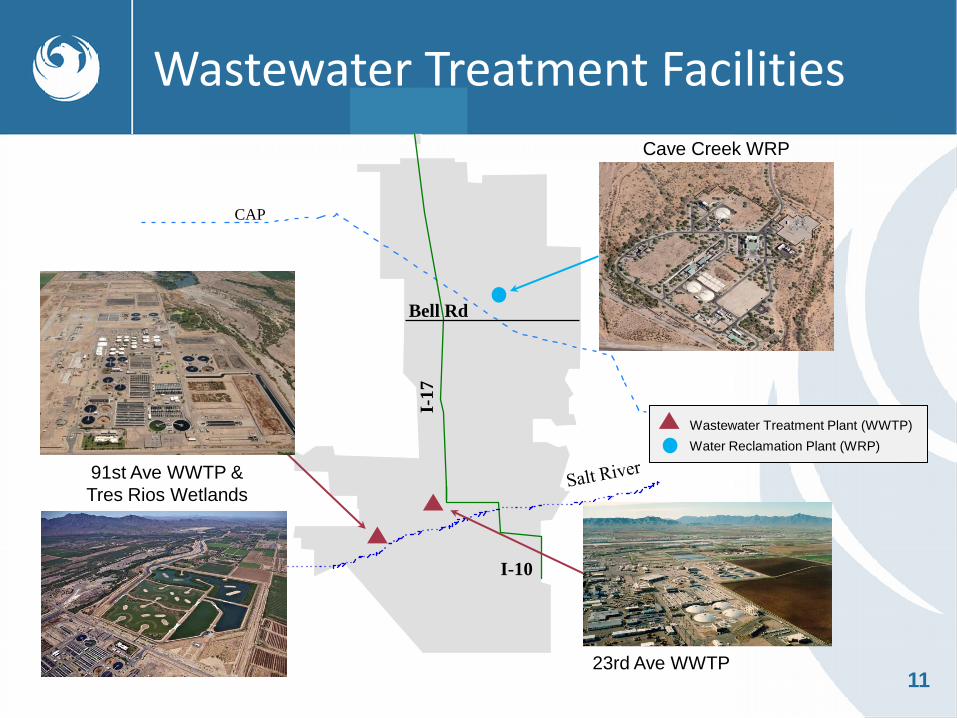
11
I-1
7
91st Ave WWTP &
Tres Rios Wetlands
23rd Ave WWTP
Cave Creek WRP
CAP
I-10
Wastewater Treatment Facilities
Bell Rd
Wastewater Treatment Plant (WWTP)
Water Reclamation Plant (WRP)
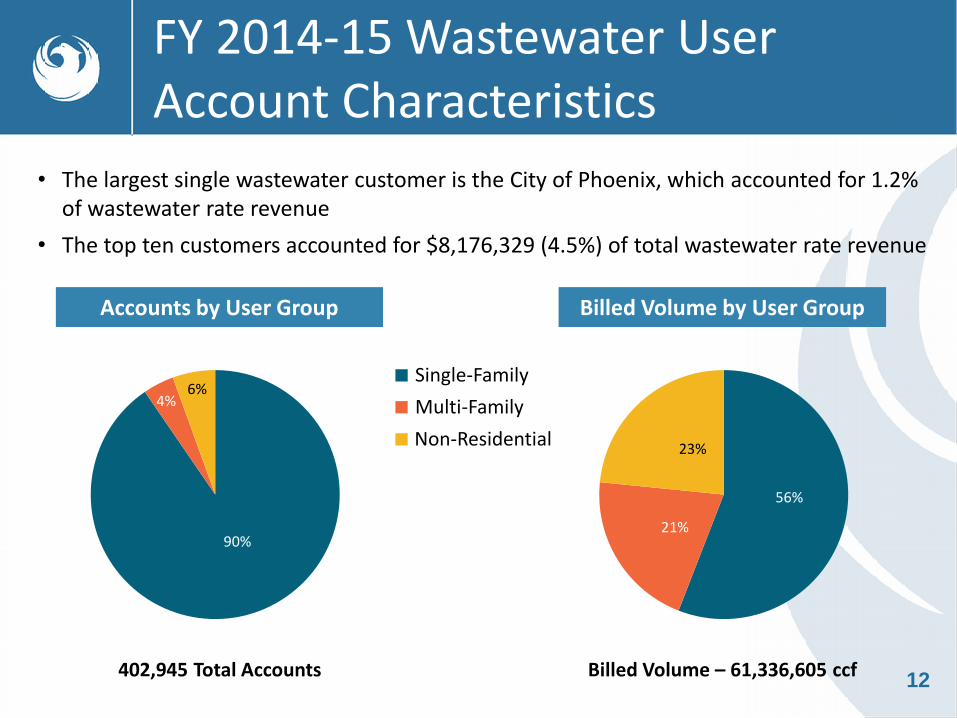
12 402,945 Total Accounts Billed Volume – 61,336,605 ccf
FY 2014-15 Wastewater User Account Characteristics
Accounts by User Group Billed Volume by User Group
■ Single-Family
■ Multi-Family
■ Non-Residential
• The largest single wastewater customer is the City of Phoenix, which accounted for 1.2% of wastewater rate revenue
• The top ten customers accounted for $8,176,329 (4.5%) of total wastewater rate revenue
90%
4% 6%
56%
21%
23%
13
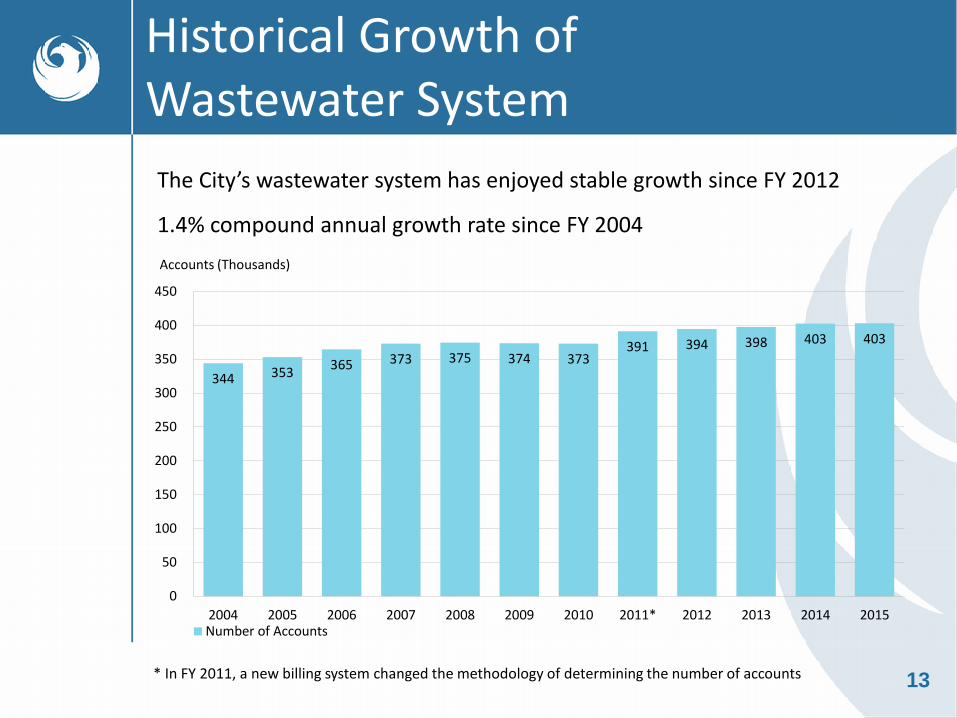
Historical Growth of Wastewater System
* In FY 2011, a new billing system changed the methodology of determining the number of accounts
The City’s wastewater system has enjoyed stable growth since FY 2012
1.4% compound annual growth rate since FY 2004
Accounts (Thousands)
344 353 365 373 375 374 373
391 394 398 403 403
0
50
100
150
200
250
300
350
400
450
2004 2005 2006 2007 2008 2009 2010 2011* 2012 2013 2014 2015
Tho
usa
nd
s
Number of Accounts
14
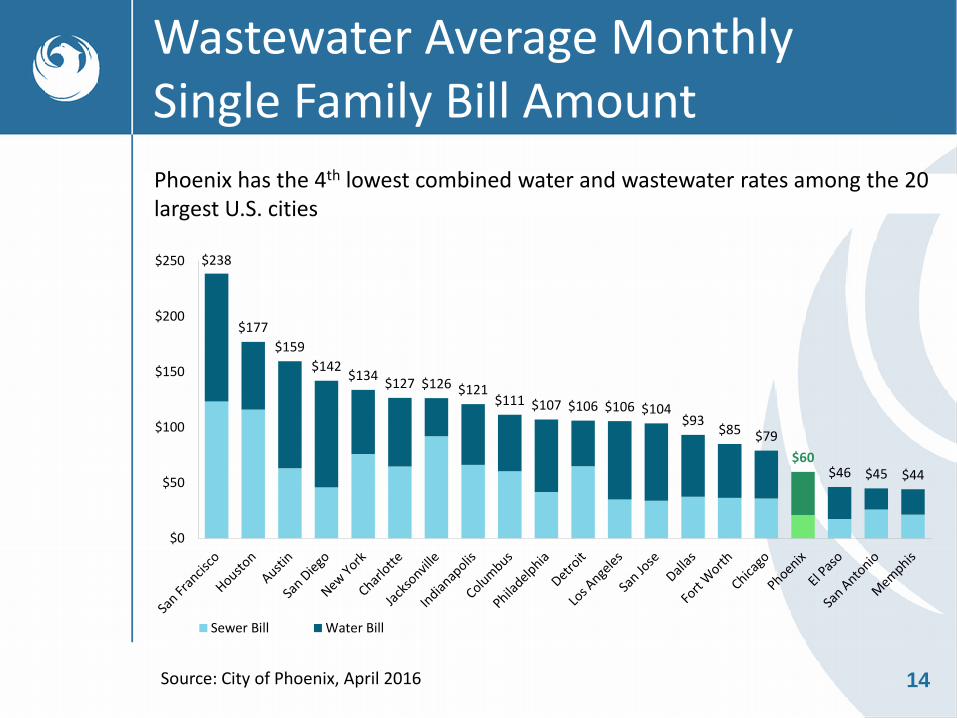
Wastewater Average Monthly Single Family Bill Amount
Source: City of Phoenix, April 2016
Phoenix has the 4th lowest combined water and wastewater rates among the 20 largest U.S. cities
$238
$177
$159
$142 $134
$127 $126 $121 $111 $107 $106 $106 $104
$93 $85 $79
$60 $46 $45 $44
$0
$50
$100
$150
$200
$250
Sewer Bill Water Bill
Five-Year Wastewater Capital Improvement Plan

16
The Wastewater CIP includes:
1) Projects for System studies
2) Modifications at the 91st Avenue and 23rd Avenue Wastewater Treatment Plants
3) Improvements to odor control facilities and transmission mains
4) Rehabilitation and replacement of sewer mains throughout the System
FY 2016 – FY 2021 CIP by Category
100% Pay-As-You-Go (“PAYGO”) funded Wastewater CIP
(Dollars in Thousands) FY 2016 FY 2017 FY 2018 FY 2019 FY 2020 FY 2021 6-Year Total % of Total
Treatment Related $22,266 $21,037 $15,713 $16,241 $18,339 $12,431 $106,028 19.0%
Collections Related 56,117 91,493 82,918 64,579 98,426 44,233 437,766 78.3%
Other 5,558 3,553 2,138 1,070 1,890 1,130 15,339 2.7%
Total $83,941 $116,084 $100,770 $81,890 $118,655 $57,793 $559,133 100.0%

Financial Overview
18
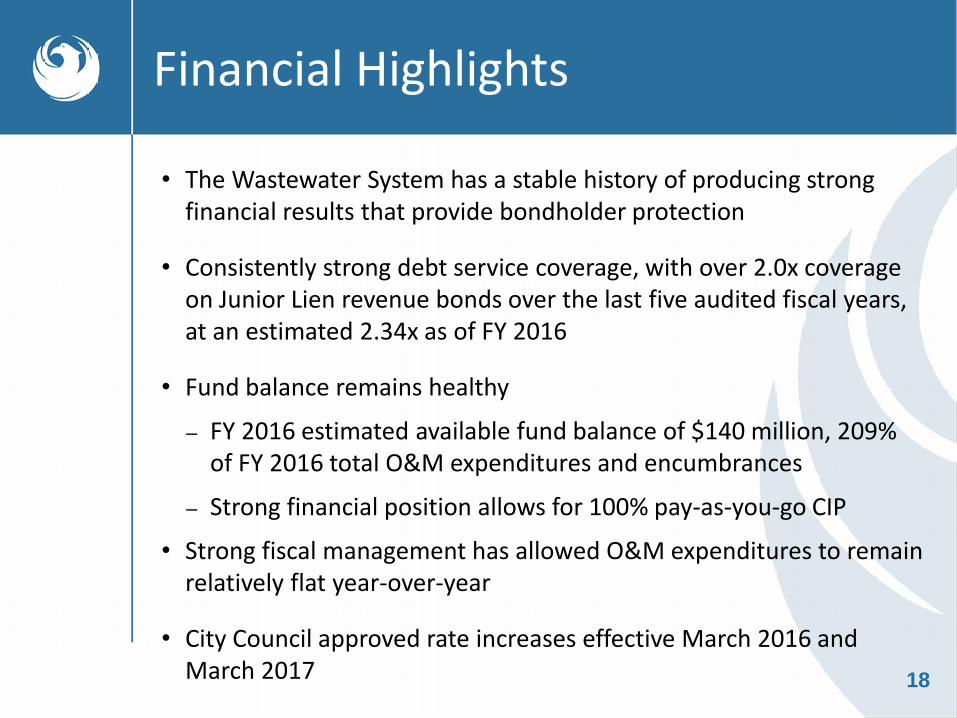
Financial Highlights
• The Wastewater System has a stable history of producing strong financial results that provide bondholder protection
• Consistently strong debt service coverage, with over 2.0x coverage on Junior Lien revenue bonds over the last five audited fiscal years, at an estimated 2.34x as of FY 2016
• Fund balance remains healthy
– FY 2016 estimated available fund balance of $140 million, 209% of FY 2016 total O&M expenditures and encumbrances
– Strong financial position allows for 100% pay-as-you-go CIP
• Strong fiscal management has allowed O&M expenditures to remain relatively flat year-over-year
• City Council approved rate increases effective March 2016 and March 2017
19
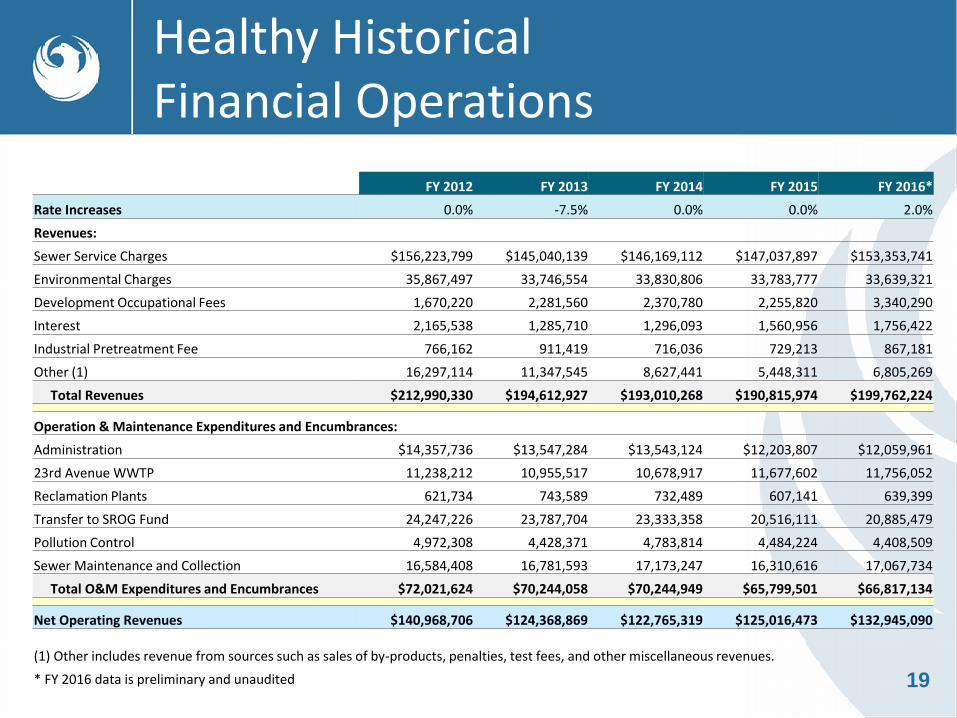
Healthy Historical Financial Operations
FY 2012 FY 2013 FY 2014 FY 2015 FY 2016*
Rate Increases 0.0% -7.5% 0.0% 0.0% 2.0%
Revenues:
Sewer Service Charges $156,223,799 $145,040,139 $146,169,112 $147,037,897 $153,353,741
Environmental Charges 35,867,497 33,746,554 33,830,806 33,783,777 33,639,321
Development Occupational Fees 1,670,220 2,281,560 2,370,780 2,255,820 3,340,290
Interest 2,165,538 1,285,710 1,296,093 1,560,956 1,756,422
Industrial Pretreatment Fee 766,162 911,419 716,036 729,213 867,181
Other (1) 16,297,114 11,347,545 8,627,441 5,448,311 6,805,269
Total Revenues $212,990,330 $194,612,927 $193,010,268 $190,815,974 $199,762,224
Operation & Maintenance Expenditures and Encumbrances:
Administration $14,357,736 $13,547,284 $13,543,124 $12,203,807 $12,059,961
23rd Avenue WWTP 11,238,212 10,955,517 10,678,917 11,677,602 11,756,052
Reclamation Plants 621,734 743,589 732,489 607,141 639,399
Transfer to SROG Fund 24,247,226 23,787,704 23,333,358 20,516,111 20,885,479
Pollution Control 4,972,308 4,428,371 4,783,814 4,484,224 4,408,509
Sewer Maintenance and Collection 16,584,408 16,781,593 17,173,247 16,310,616 17,067,734
Total O&M Expenditures and Encumbrances $72,021,624 $70,244,058 $70,244,949 $65,799,501 $66,817,134
Net Operating Revenues $140,968,706 $124,368,869 $122,765,319 $125,016,473 $132,945,090
(1) Other includes revenue from sources such as sales of by-products, penalties, test fees, and other miscellaneous revenues.
* FY 2016 data is preliminary and unaudited
20
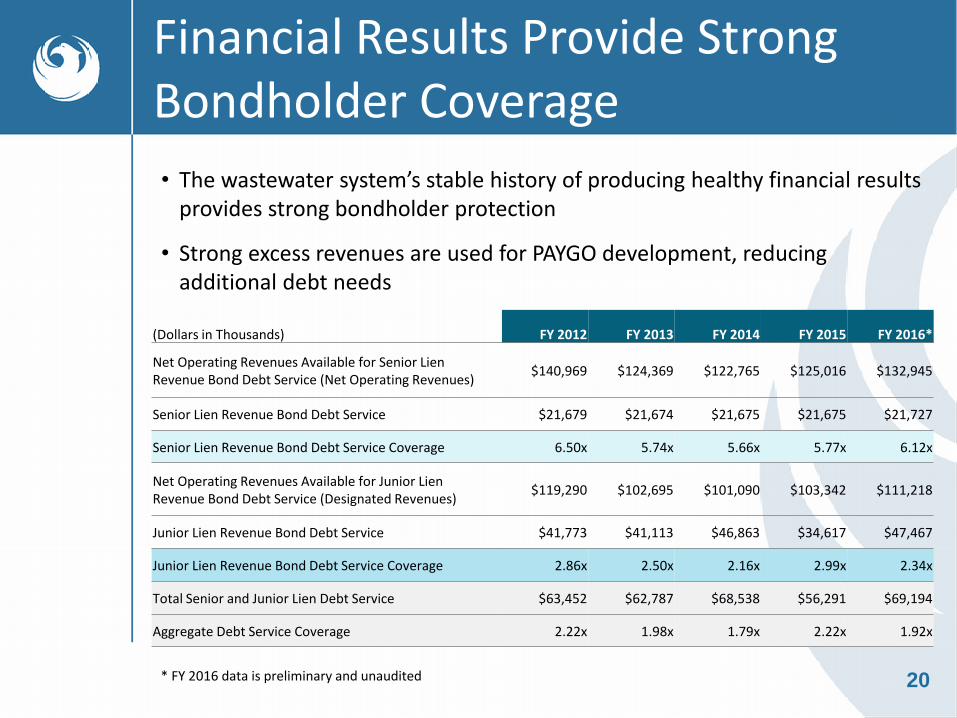
Financial Results Provide Strong Bondholder Coverage
• The wastewater system’s stable history of producing healthy financial results provides strong bondholder protection
• Strong excess revenues are used for PAYGO development, reducing additional debt needs
(Dollars in Thousands) FY 2012 FY 2013 FY 2014 FY 2015 FY 2016*
Net Operating Revenues Available for Senior Lien Revenue Bond Debt Service (Net Operating Revenues)
$140,969 $124,369 $122,765 $125,016 $132,945
Senior Lien Revenue Bond Debt Service $21,679 $21,674 $21,675 $21,675 $21,727
Senior Lien Revenue Bond Debt Service Coverage 6.50x 5.74x 5.66x 5.77x 6.12x
Net Operating Revenues Available for Junior Lien Revenue Bond Debt Service (Designated Revenues)
$119,290 $102,695 $101,090 $103,342 $111,218
Junior Lien Revenue Bond Debt Service $41,773 $41,113 $46,863 $34,617 $47,467
Junior Lien Revenue Bond Debt Service Coverage 2.86x 2.50x 2.16x 2.99x 2.34x
Total Senior and Junior Lien Debt Service $63,452 $62,787 $68,538 $56,291 $69,194
Aggregate Debt Service Coverage 2.22x 1.98x 1.79x 2.22x 1.92x
* FY 2016 data is preliminary and unaudited
21
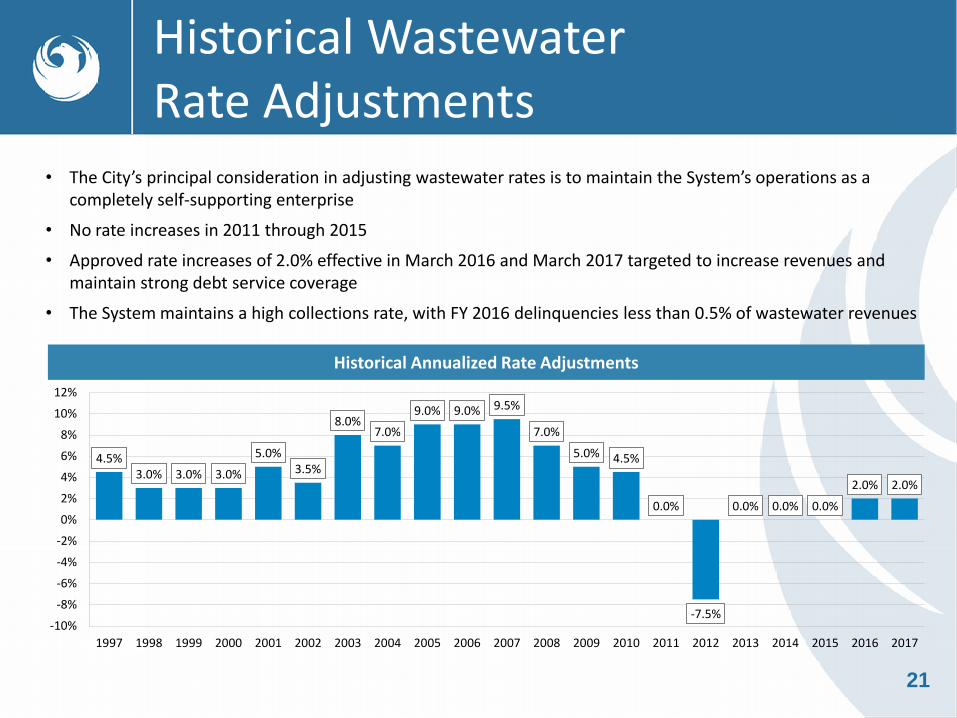
Historical Wastewater Rate Adjustments
Historical Annualized Rate Adjustments
• The City’s principal consideration in adjusting wastewater rates is to maintain the System’s operations as a completely self-supporting enterprise
• No rate increases in 2011 through 2015
• Approved rate increases of 2.0% effective in March 2016 and March 2017 targeted to increase revenues and maintain strong debt service coverage
• The System maintains a high collections rate, with FY 2016 delinquencies less than 0.5% of wastewater revenues
4.5% 3.0% 3.0% 3.0%
5.0% 3.5%
8.0% 7.0%
9.0% 9.0% 9.5%
7.0%
5.0% 4.5%
0.0%
-7.5%
0.0% 0.0% 0.0%
2.0% 2.0%
-10%
-8%
-6%
-4%
-2%
0%
2%
4%
6%
8%
10%
12%
1997 1998 1999 2000 2001 2002 2003 2004 2005 2006 2007 2008 2009 2010 2011 2012 2013 2014 2015 2016 2017
Plan of Finance
23
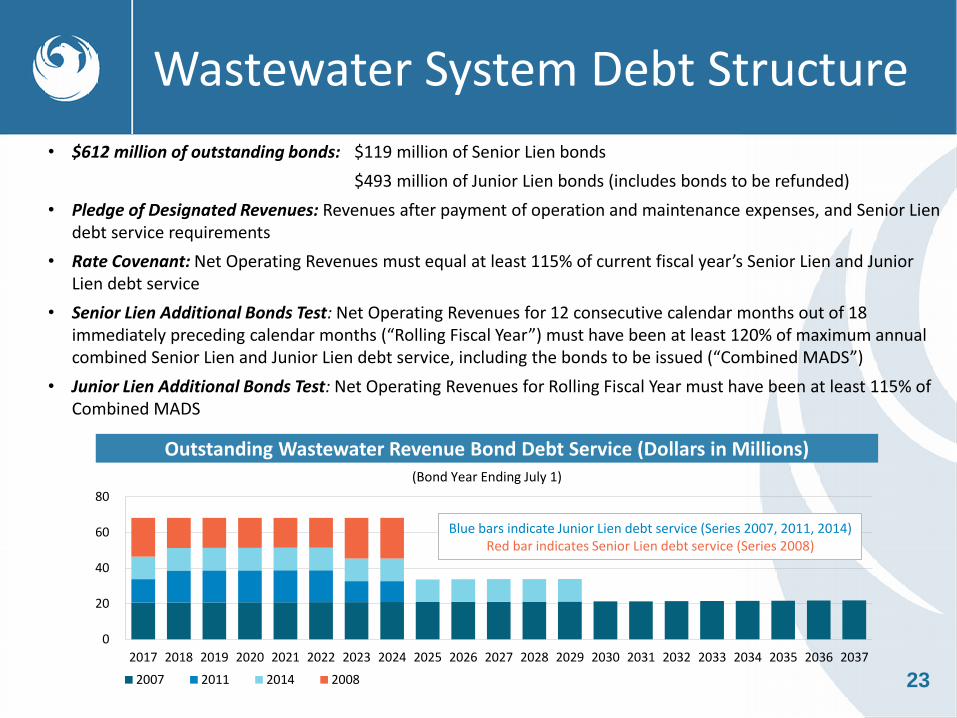
Wastewater System Debt Structure
• $612 million of outstanding bonds: $119 million of Senior Lien bonds
$493 million of Junior Lien bonds (includes bonds to be refunded)
• Pledge of Designated Revenues: Revenues after payment of operation and maintenance expenses, and Senior Lien debt service requirements
• Rate Covenant: Net Operating Revenues must equal at least 115% of current fiscal year’s Senior Lien and Junior Lien debt service
• Senior Lien Additional Bonds Test: Net Operating Revenues for 12 consecutive calendar months out of 18 immediately preceding calendar months (“Rolling Fiscal Year”) must have been at least 120% of maximum annual combined Senior Lien and Junior Lien debt service, including the bonds to be issued (“Combined MADS”)
• Junior Lien Additional Bonds Test: Net Operating Revenues for Rolling Fiscal Year must have been at least 115% of Combined MADS
Outstanding Wastewater Revenue Bond Debt Service (Dollars in Millions)
(Bond Year Ending July 1)
0
20
40
60
80
2017 2018 2019 2020 2021 2022 2023 2024 2025 2026 2027 2028 2029 2030 2031 2032 2033 2034 2035 2036 2037
Mill
ion
s
2007 2011 2014 2008
Blue bars indicate Junior Lien debt service (Series 2007, 2011, 2014) Red bar indicates Senior Lien debt service (Series 2008)
24
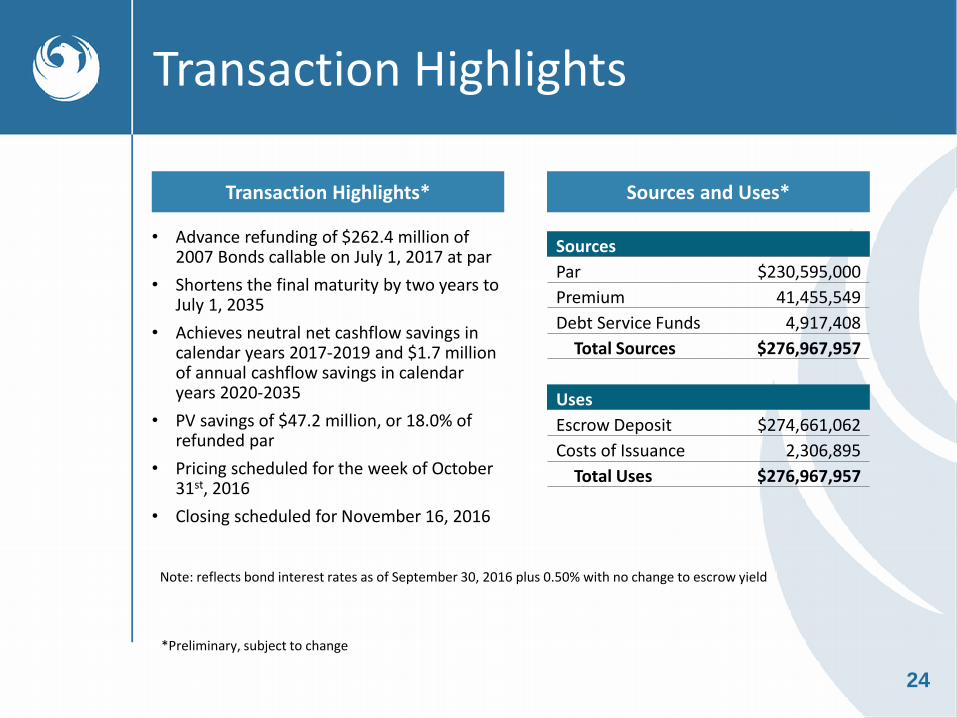
Transaction Highlights
Transaction Highlights* Sources and Uses*
*Preliminary, subject to change
• Advance refunding of $262.4 million of 2007 Bonds callable on July 1, 2017 at par
• Shortens the final maturity by two years to July 1, 2035
• Achieves neutral net cashflow savings in calendar years 2017-2019 and $1.7 million of annual cashflow savings in calendar years 2020-2035
• PV savings of $47.2 million, or 18.0% of refunded par
• Pricing scheduled for the week of October 31st, 2016
• Closing scheduled for November 16, 2016
Note: reflects bond interest rates as of September 30, 2016 plus 0.50% with no change to escrow yield
Sources
Par $230,595,000
Premium 41,455,549
Debt Service Funds 4,917,408
Total Sources $276,967,957
Uses
Escrow Deposit $274,661,062
Costs of Issuance 2,306,895
Total Uses $276,967,957
25
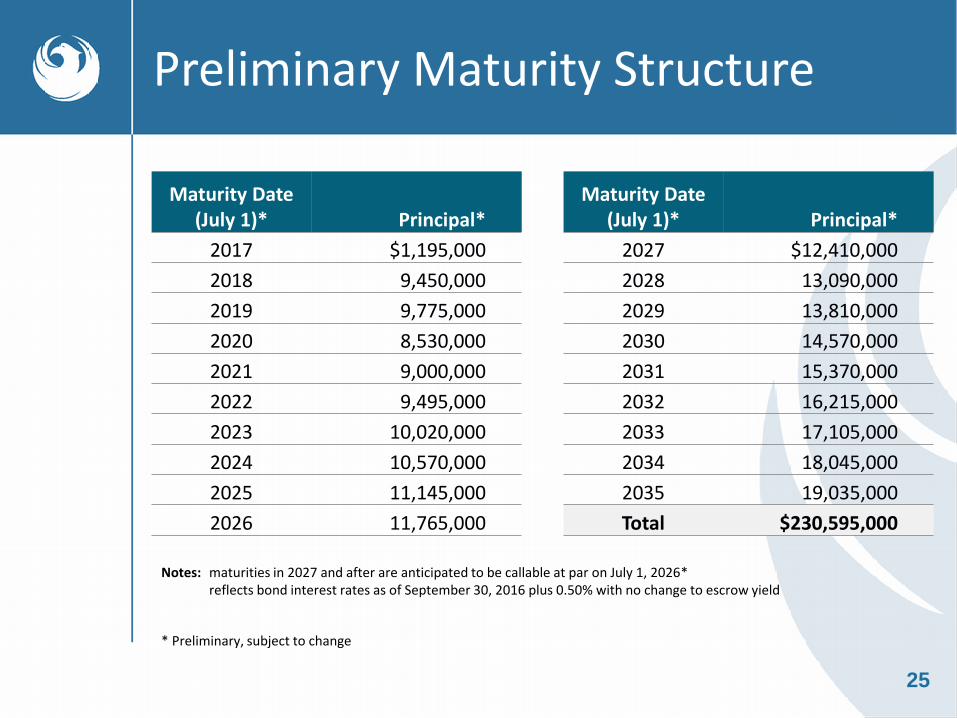
Preliminary Maturity Structure
* Preliminary, subject to change
Maturity Date (July 1)* Principal*
Maturity Date (July 1)* Principal*
2017 $1,195,000 2027 $12,410,000
2018 9,450,000 2028 13,090,000
2019 9,775,000 2029 13,810,000
2020 8,530,000 2030 14,570,000
2021 9,000,000 2031 15,370,000
2022 9,495,000 2032 16,215,000
2023 10,020,000 2033 17,105,000
2024 10,570,000 2034 18,045,000
2025 11,145,000 2035 19,035,000
2026 11,765,000 Total $230,595,000
Notes: maturities in 2027 and after are anticipated to be callable at par on July 1, 2026* reflects bond interest rates as of September 30, 2016 plus 0.50% with no change to escrow yield
Summary
27
Credit Strengths
• Broad and diverse economic base
• Strong and conservative fiscal management with solid liquidity
• City Council annually approves updated CIP and financial plan, and considers appropriate rate adjustments
• 4th lowest average single family water and wastewater bill out of the 20 largest cities in the U.S.
• Strong projected MADS coverage on Senior and Junior Lien debt of 5.82x and 2.54x, respectively
• Remaining average life on all outstanding debt is only 8.6 years with 50% of outstanding principal being retired in the next seven years
• 100% fixed-rate debt profile, with aggregate debt service level at $68.1 million through 2024, $33.7 million through 2029, and $21.5 million through the final maturity in 2037
• Low leverage levels with a healthy PAYGO CIP (no future new money issues planned)
• Proposed refunding will generate substantial savings and improve debt service coverage
• Strong Junior Lien ratings of AA+ and Aa2 from S&P and Moody’s, respectively
28
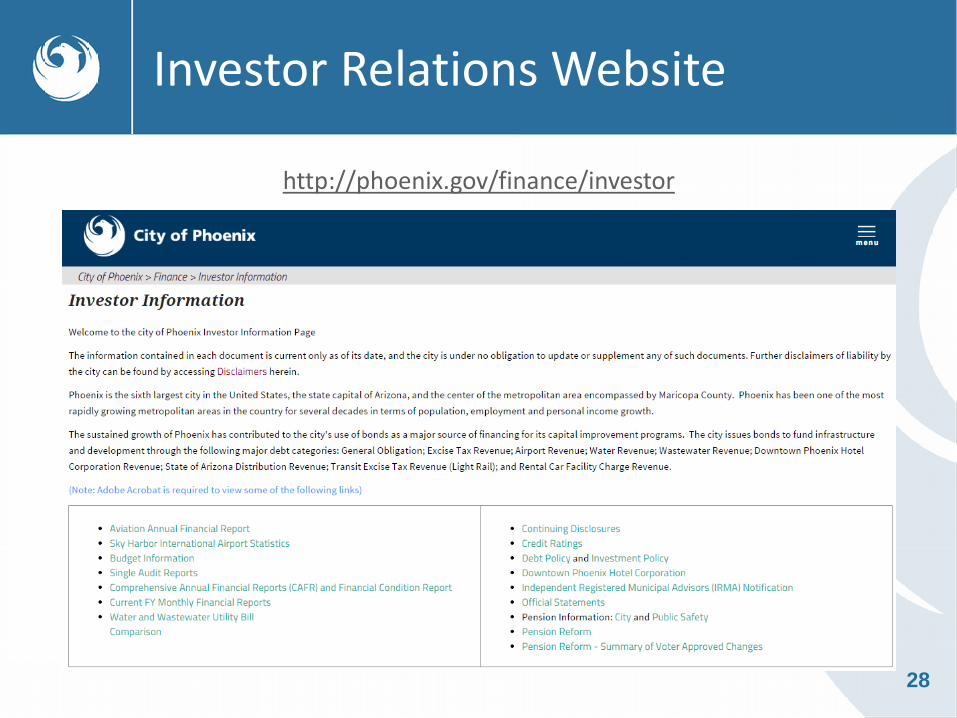
Investor Relations Website
http://phoenix.gov/finance/investor

29
Financing Schedule
All dates preliminary, subject to change
Event Date
Release POS Tuesday, October 25, 2016
Pricing Week of October 31, 2016
Closing Wednesday, November 16, 2016
2007 Bonds Redeemed July 1, 2017

30
Contact Information
City of Phoenix – Finance Department
Denise Olson Chief Financial Officer
(602) 262-7166 Kathleen Gitkin City Treasurer
Scot Obal Investment & Debt Manager
Financial Advisor – Frasca & Associates, L.L.C.
Ken Cushine Principal
[email protected] (212) 355-4050
Senior Manager – Morgan Stanley & Co. LLC
Richard Weiss Executive Director
[email protected] (212) 761-9060
Chuck Peck Executive Director
[email protected] (303) 825-3089