clean coal technology selection study - canadian clean power coalitio
TRANSCRIPT
u
Clean Coal Technology Selection Study
Final Report
January 2007
Florida Power & Light Clean Coal Technology Selection Study Table of Contents
Contents
1.0 Executive Summary ............................................................................................. 1-1
1.1 Introduction..............................................................................................1-1 1.2 Plant Descriptions ....................................................................................1-1 1.3 Overall Assumptions................................................................................1-2 1.4 Performance Estimates.............................................................................1-3
1.4.1 PC and CFB Cases.....................................................................1-3 1.4.2 IGCC Cases ...............................................................................1-5
1.5 Cost Estimates..........................................................................................1-6 1.5.1 Capital Costs..............................................................................1-6 1.5.2 Nonfuel O&M Costs..................................................................1-6
1.6 Busbar Cost Analysis...............................................................................1-7 1.7 Conclusions............................................................................................1-15
2.0 Introduction.......................................................................................................... 2-1 3.0 PC and CFB Technologies................................................................................... 3-1
3.1 Pulverized Coal........................................................................................3-1 3.2 PC Vendors ..............................................................................................3-4
3.2.1 Boiler Tube Construction ..........................................................3-4 3.2.2 Commercially Available Alloys ................................................3-6 3.2.3 Burner Arrangement ................................................................3-10
3.3 Fluidized Bed.........................................................................................3-10 3.4 Technical Characteristics of PC Versus CFB ........................................3-15
3.4.1 Environmental .........................................................................3-15 3.4.2 Operational ..............................................................................3-17 3.4.3 Availability and Reliability .....................................................3-18 3.4.4 Technology Maturity ...............................................................3-18
3.5 FBC Experience in the United States.....................................................3-19 3.6 Current PC and CFB Project Development ...........................................3-19 3.7 Post Combustion Carbon Capture..........................................................3-22
4.0 IGCC Technologies and Industry Activity .......................................................... 4-1 4.1 Gasification Technologies and Suppliers.................................................4-1 4.2 Entrained Flow Gasification Process Description ...................................4-4 4.3 Gasification Technology Suppliers..........................................................4-7 4.4 Gasifier Technology Selection.................................................................4-8 4.5 Commercial IGCC Experience ..............................................................4-10 4.6 Fuel Characteristics Impact on Gasifier Selection.................................4-15 4.7 IGCC Performance and Emissions Considerations ...............................4-16
January 2007 TC-1 © Black & Veatch 2007 Final Report All Rights Reserved

Florida Power & Light Clean Coal Technology Selection Study Table of Contents
4.8 Gasification Wastewater Treatment.......................................................4-16 4.9 Acid Gas Removal Technology.............................................................4-17 4.10 Pre-combustion Carbon Capture............................................................4-18 4.11 Equivalent Availability ..........................................................................4-22
4.11.1 First Generation IGCC Plants..................................................4-22 4.11.2 Next (Second) Generation IGCC Plants..................................4-23
4.12 Other Commercial Entrained Bed Gasification Experience ..................4-23 4.13 Current Announced Electric Generation Industry Activity ...................4-25
4.13.1 Summary of Proposed Projects ...............................................4-26 4.13.2 Gasification Market Opportunities ..........................................4-27
5.0 Performance and Emissions Estimates ................................................................ 5-1 5.1 Assumptions.............................................................................................5-1
5.1.1 Overall Assumptions .................................................................5-1 5.1.2 Degradation of Performance......................................................5-2 5.1.3 PC and CFB Coal Cycle Arrangement Assumptions ................5-3 5.1.4 IGCC Cycle Arrangement Assumptions ...................................5-5
5.2 Performance Estimates.............................................................................5-7 5.2.1 PC and CFB Cases.....................................................................5-7 5.2.2 IGCC Cases ...............................................................................5-7
5.3 Emissions Estimates.................................................................................5-7 6.0 Cost Estimates...................................................................................................... 6-1
6.1 Capital Costs ............................................................................................6-1 6.2 Owner’s Costs..........................................................................................6-2 6.3 Nonfuel O&M Costs ................................................................................6-4 6.4 Economies of Scale..................................................................................6-5
6.4.1 Multiple Unit Sites ....................................................................6-5 6.4.2 Economies of Scale Based on Unit Size....................................6-5
6.5 Recent Experience ...................................................................................6-5 6.6 Preliminary Cost Estimates......................................................................6-6
7.0 Economic Analysis .............................................................................................. 7-1 7.1 Economic Criteria ....................................................................................7-1 7.2 Busbar Analysis .......................................................................................7-4
8.0 Conclusions.......................................................................................................... 8-1 9.0 Contributors ......................................................................................................... 9-1
January 2007 TC-2 © Black & Veatch 2007 Final Report All Rights Reserved
Florida Power & Light Clean Coal Technology Selection Study Table of Contents
List of Tables
Table 1-1. Summary of Power Generation Technologies............................................... 1-2 Table 1-2. Ultimate Fuel Analysis .................................................................................. 1-3 Table 1-3. PC and CFB Coal Performance Estimates, per Unit ..................................... 1-4 Table 1-4. GE Radiant IGCC Performance Estimates, per Unit..................................... 1-5 Table 1-5. EPC Capital Cost Estimates .......................................................................... 1-6 Table 1-6. O&M Cost Estimates..................................................................................... 1-7 Table 1-7. Busbar Cost Analysis Results, ¢/kWh........................................................... 1-8 Table 1-8. Probable Carbon Capture Costs, $/Avoided Ton CO2. ............................... 1-11 Table 1-9. Probable Busbar Percentage Cost Increase with Carbon Capture and
Emissions Allowances. .......................................................................... 1-11 Table 2-1. Summary of Power Generation Technologies............................................... 2-2 Table 3-1. Notable Worldwide Ultrasupercritical Projects............................................. 3-1 Table 3-2. PC Boiler Vendors......................................................................................... 3-4 Table 3-3. Vertical Rifled Tubes vs. Spiral Wound Tubes............................................. 3-6 Table 3-4. Common Alloying Elements ......................................................................... 3-7 Table 3-5. Coal-Fired Power Generation Boiler Temperature and Material
Development ............................................................................................ 3-8 Table 3-6. PC Versus CFB Boiler Comparison ............................................................ 3-16 Table 3-7. Currently Announced PC and CFB Project Developments......................... 3-20 Table 4-1. Comparison of Key Gasifier Design Parameters........................................... 4-9 Table 4-2. IGCC Projects – All Fuels........................................................................... 4-11 Table 4-3. Coal-Based IGCC Demonstration Plants 1 .................................................. 4-12 Table 4-4. As-Received Coal Properties of Typical IGCC Coals ................................ 4-15 Table 4-5. Coal/Coke-Fueled IGCC Plant Equivalent Availabilities ........................... 4-25 Table 4-6. Announced IGCC Projects Currently In Development. .............................. 4-26 Table 5-1. Ultimate Fuel Analysis .................................................................................. 5-2 Table 5-2. PC and CFB Coal Performance Estimates, per Unit ..................................... 5-8 Table 5-3. GE Radiant IGCC Performance Estimates, per Unit..................................... 5-9 Table 5-4. Probable Air Emissions Limits.................................................................... 5-10 Table 5-5. Probable Air Emissions Limits.................................................................... 5-10 Table 6-1. Potential Owner’s Costs ................................................................................ 6-3 Table 6-2. O&M Consumable Assumptions, $2006....................................................... 6-4 Table 6-3. Capital Cost Estimates................................................................................... 6-6 Table 6-4. O&M Cost Estimates..................................................................................... 6-7 Table 7-1. Economic Criteria.......................................................................................... 7-1 Table 7-2. Fuel Forecasts ($/MBtu, delivered)............................................................... 7-2 Table 7-3. Summary of Busbar Model Inputs ................................................................ 7-5
January 2007 TC-3 © Black & Veatch 2007 Final Report All Rights Reserved
Florida Power & Light Clean Coal Technology Selection Study Table of Contents
Table 7-4. Busbar Cost Analysis Results, ¢/kWh........................................................... 7-6 Table 7-5. Probable Carbon Capture Costs, 2006$/Avoided Ton CO2. ......................... 7-7 Table 7-6. Probable Busbar Percentage Cost Increase with Carbon Capture and
Emissions Allowances. ............................................................................ 7-7
List of Figures
Figure 1-1. Busbar Cost Component Analysis without Emissions................................. 1-9 Figure 1-2. Busbar Cost Component Analysis with Emissions.................................... 1-10 Figure 1-3. Busbar Cost Component Analysis with CO2 ............................................. 1-10 Figure 1-4. Busbar Cost Variation with Capacity Factor ............................................. 1-13 Figure 1-5. Net Levelized Annual Cost Variation with Capacity Factor ..................... 1-14 Figure 3-1. Trends in Steam Conditions of Coal-Fired Power Plants ............................ 3-3 Figure 3-2. Vertical Rifled and Smooth Spiral Wound Tube Design (MHI). ................ 3-5 Figure 3-3. Alstom Boiler Alloys and Steam Conditions ............................................... 3-9 Figure 3-4. Fluidized Bed Technologies....................................................................... 3-11 Figure 3-5. Environmental Benefits of CFB Technology............................................. 3-13 Figure 3-6. Typical CFB Unit ....................................................................................... 3-14 Figure 3-7. Schematic of Ammonia-Based CO2 Capture System. ............................... 3-24 Figure 4-1. IGCC Process Flow Diagram....................................................................... 4-4 Figure 4-2. Potential Areas for Integration ................................................................... 4-14 Figure 4-3. IGCC with Pre-Combustion CO2 Capture. ................................................ 4-21 Figure 7-1. Busbar Cost Component Analysis without Emissions................................. 7-8 Figure 7-2. Busbar Cost Component Analysis with Emissions...................................... 7-8 Figure 7-3. Busbar Cost Component Analysis with CO2 ............................................... 7-9 Figure 7-4. Busbar Cost Variation with Capacity Factor ............................................. 7-10 Figure 7-5. Net Levelized Annual Cost Variation with Capacity Factor ..................... 7-11
January 2007 TC-4 © Black & Veatch 2007 Final Report All Rights Reserved
Florida Power & Light Clean Coal Technology Selection Study Acronyms
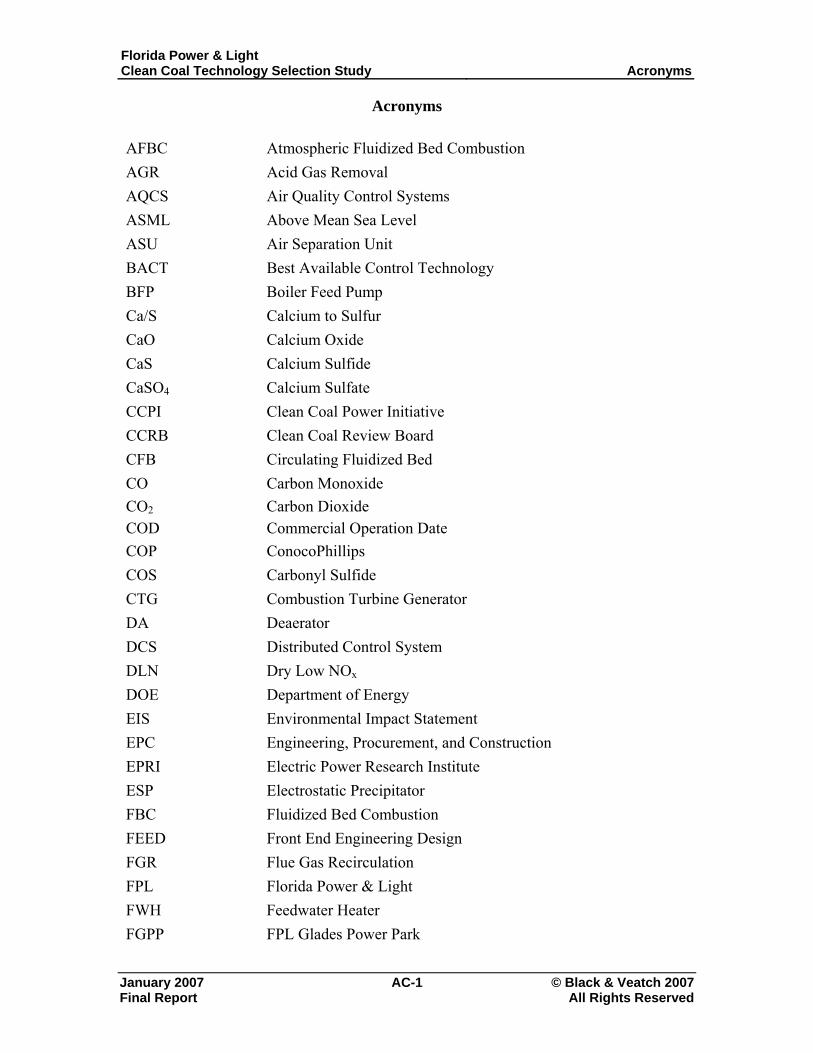
Acronyms
AFBC Atmospheric Fluidized Bed Combustion AGR Acid Gas Removal AQCS Air Quality Control Systems ASML Above Mean Sea Level ASU Air Separation Unit BACT Best Available Control Technology BFP Boiler Feed Pump Ca/S Calcium to Sulfur CaO Calcium Oxide CaS Calcium Sulfide CaSO4 Calcium Sulfate CCPI Clean Coal Power Initiative CCRB Clean Coal Review Board CFB Circulating Fluidized Bed CO Carbon Monoxide CO2 Carbon Dioxide COD Commercial Operation Date COP ConocoPhillips COS Carbonyl Sulfide CTG Combustion Turbine Generator DA Deaerator DCS Distributed Control System DLN Dry Low NOx DOE Department of Energy EIS Environmental Impact Statement EPC Engineering, Procurement, and Construction EPRI Electric Power Research Institute ESP Electrostatic Precipitator FBC Fluidized Bed Combustion FEED Front End Engineering Design FGR Flue Gas Recirculation FPL Florida Power & Light FWH Feedwater Heater FGPP FPL Glades Power Park
January 2007 AC-1 © Black & Veatch 2007 Final Report All Rights Reserved
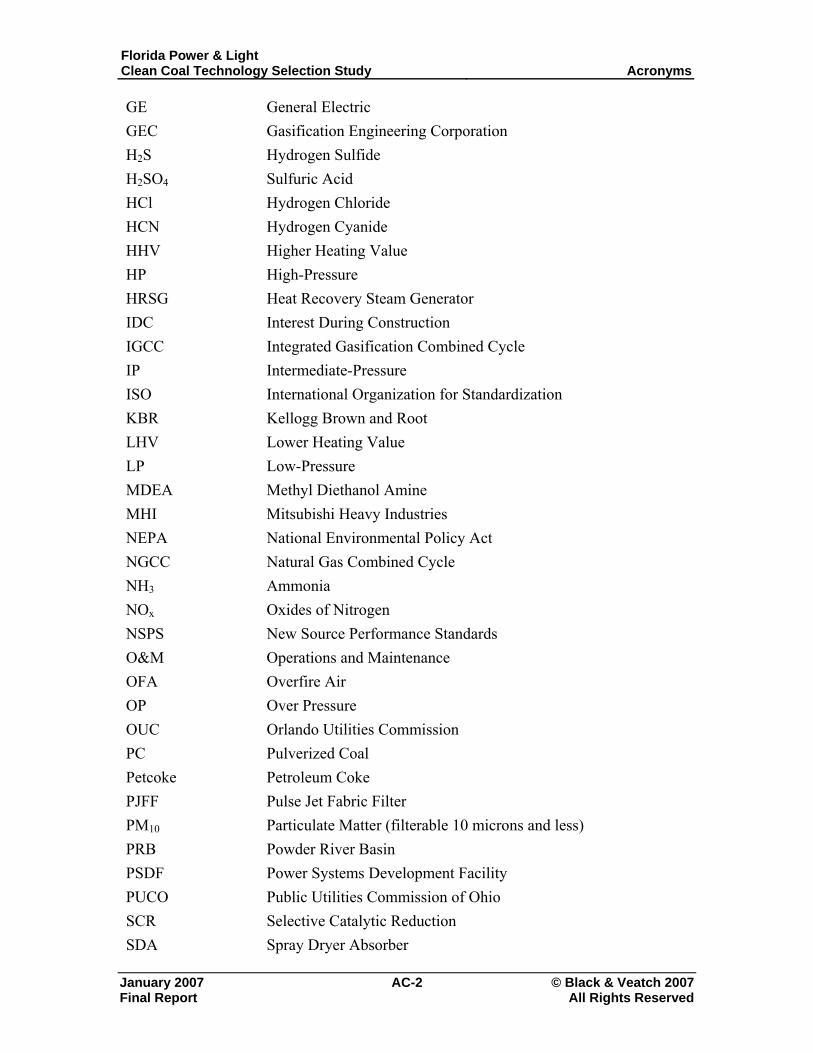
Florida Power & Light Clean Coal Technology Selection Study Acronyms
GE General Electric GEC Gasification Engineering Corporation H2S Hydrogen Sulfide H2SO4 Sulfuric Acid HCl Hydrogen Chloride HCN Hydrogen Cyanide HHV Higher Heating Value HP High-Pressure HRSG Heat Recovery Steam Generator IDC Interest During Construction IGCC Integrated Gasification Combined Cycle IP Intermediate-Pressure ISO International Organization for Standardization KBR Kellogg Brown and Root LHV Lower Heating Value LP Low-Pressure MDEA Methyl Diethanol Amine MHI Mitsubishi Heavy Industries NEPA National Environmental Policy Act NGCC Natural Gas Combined Cycle NH3 Ammonia NOx Oxides of Nitrogen NSPS New Source Performance Standards O&M Operations and Maintenance OFA Overfire Air OP Over Pressure OUC Orlando Utilities Commission PC Pulverized Coal Petcoke Petroleum Coke PJFF Pulse Jet Fabric Filter PM10 Particulate Matter (filterable 10 microns and less) PRB Powder River Basin PSDF Power Systems Development Facility PUCO Public Utilities Commission of Ohio SCR Selective Catalytic Reduction SDA Spray Dryer Absorber
January 2007 AC-2 © Black & Veatch 2007 Final Report All Rights Reserved
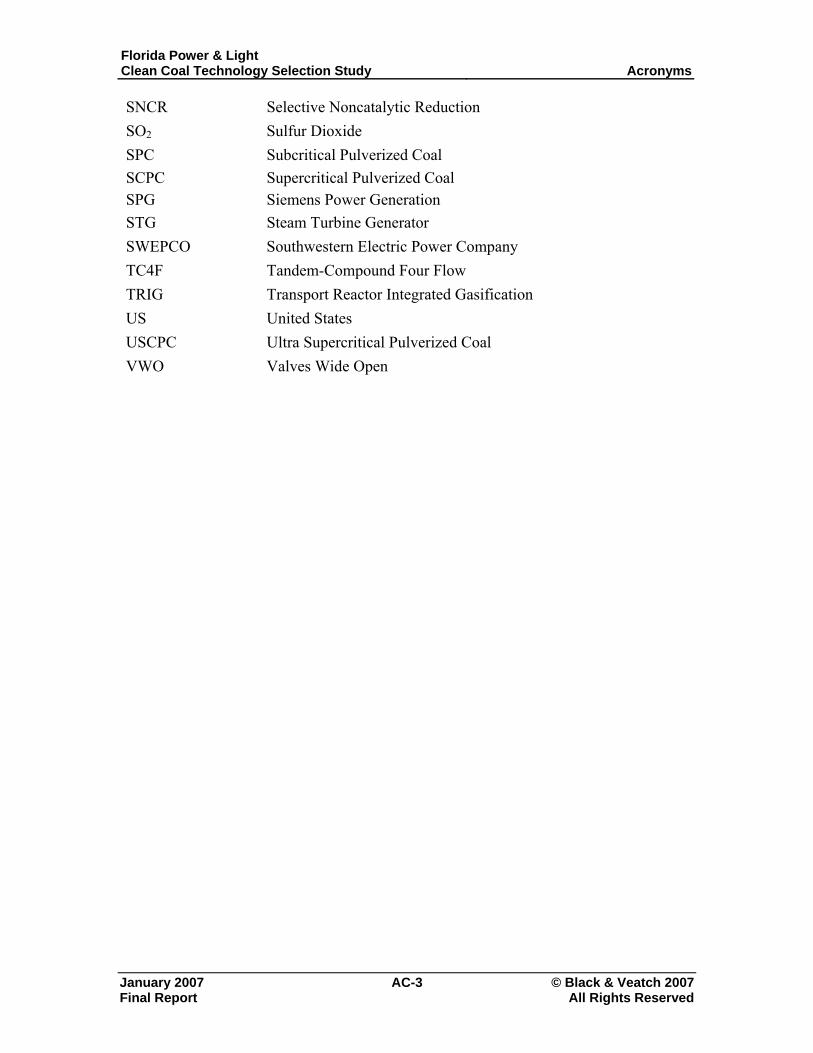
Florida Power & Light Clean Coal Technology Selection Study Acronyms
SNCR Selective Noncatalytic Reduction SO2 Sulfur Dioxide SPC Subcritical Pulverized Coal SCPC Supercritical Pulverized Coal SPG Siemens Power Generation STG Steam Turbine Generator SWEPCO Southwestern Electric Power Company TC4F Tandem-Compound Four Flow TRIG Transport Reactor Integrated Gasification US United States USCPC Ultra Supercritical Pulverized Coal VWO Valves Wide Open
January 2007 AC-3 © Black & Veatch 2007 Final Report All Rights Reserved
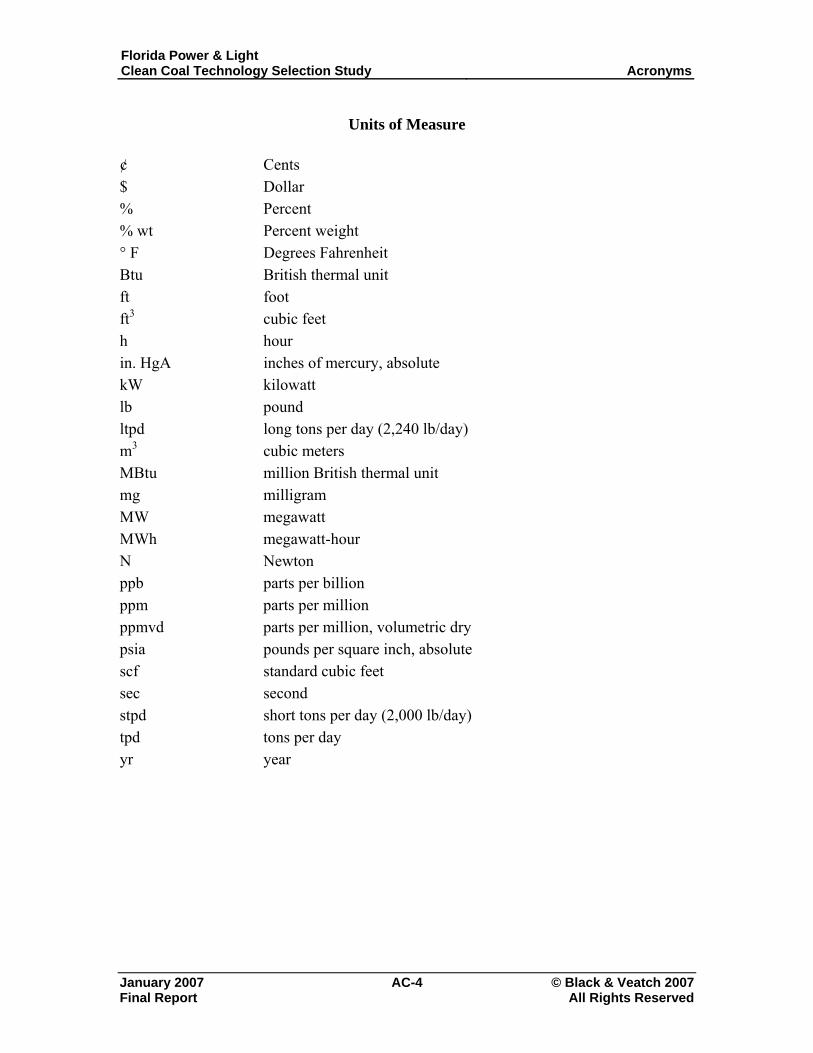
Florida Power & Light Clean Coal Technology Selection Study Acronyms
Units of Measure ¢ Cents $ Dollar % Percent % wt Percent weight ° F Degrees Fahrenheit Btu British thermal unit ft foot ft3 cubic feet h hour in. HgA inches of mercury, absolute kW kilowatt lb pound ltpd long tons per day (2,240 lb/day) m3 cubic meters MBtu million British thermal unit mg milligram MW megawatt MWh megawatt-hour N Newton ppb parts per billion ppm parts per million ppmvd parts per million, volumetric dry psia pounds per square inch, absolute scf standard cubic feet sec second stpd short tons per day (2,000 lb/day) tpd tons per day yr year
January 2007 AC-4 © Black & Veatch 2007 Final Report All Rights Reserved
Florida Power & Light Clean Coal Technology Selection Study 1.0 Executive Summary
January 2007 1-1 © Black & Veatch 2007 Final Report All Rights Reserved
1.0 Executive Summary
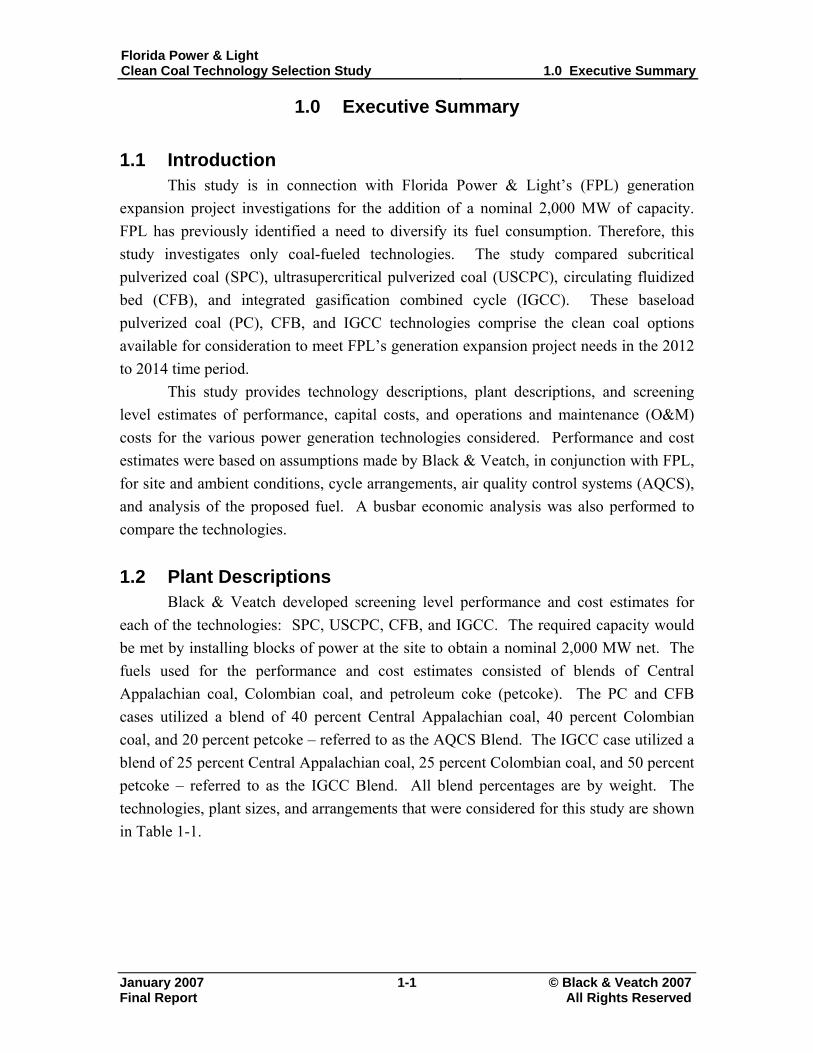
1.1 Introduction This study is in connection with Florida Power & Light’s (FPL) generation
expansion project investigations for the addition of a nominal 2,000 MW of capacity. FPL has previously identified a need to diversify its fuel consumption. Therefore, this study investigates only coal-fueled technologies. The study compared subcritical pulverized coal (SPC), ultrasupercritical pulverized coal (USCPC), circulating fluidized bed (CFB), and integrated gasification combined cycle (IGCC). These baseload pulverized coal (PC), CFB, and IGCC technologies comprise the clean coal options available for consideration to meet FPL’s generation expansion project needs in the 2012 to 2014 time period.
This study provides technology descriptions, plant descriptions, and screening level estimates of performance, capital costs, and operations and maintenance (O&M) costs for the various power generation technologies considered. Performance and cost estimates were based on assumptions made by Black & Veatch, in conjunction with FPL, for site and ambient conditions, cycle arrangements, air quality control systems (AQCS), and analysis of the proposed fuel. A busbar economic analysis was also performed to compare the technologies.
1.2 Plant Descriptions
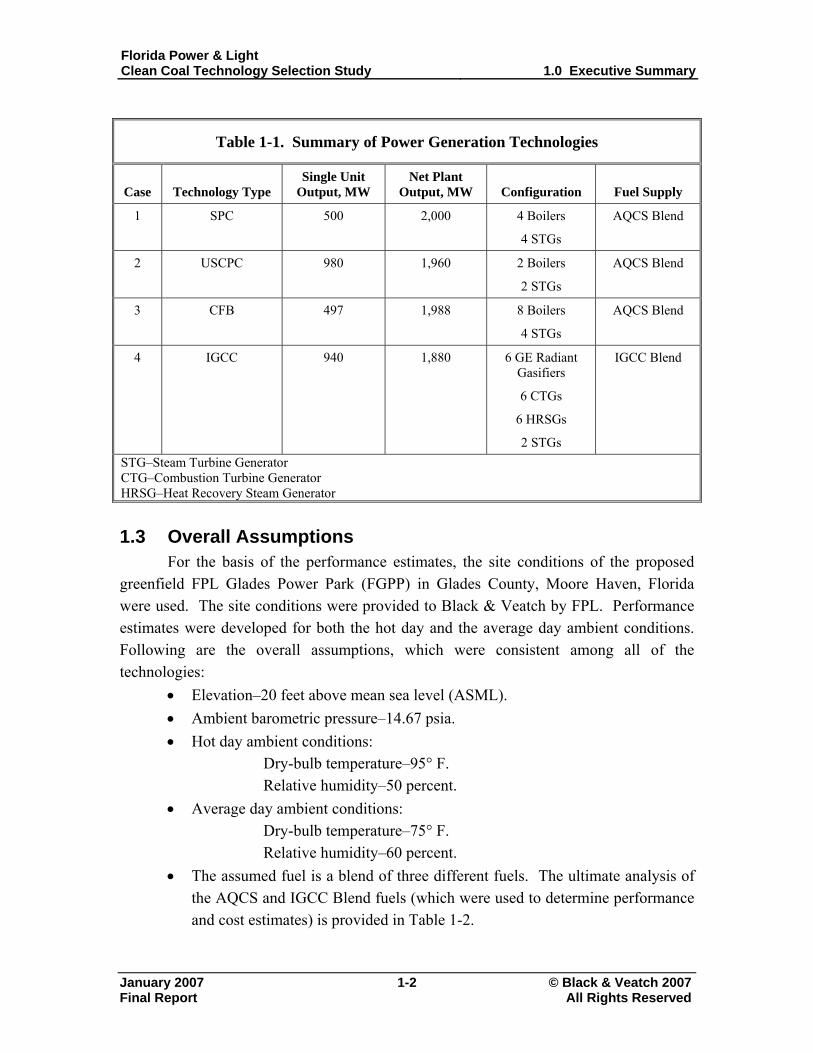
Black & Veatch developed screening level performance and cost estimates for each of the technologies: SPC, USCPC, CFB, and IGCC. The required capacity would be met by installing blocks of power at the site to obtain a nominal 2,000 MW net. The fuels used for the performance and cost estimates consisted of blends of Central Appalachian coal, Colombian coal, and petroleum coke (petcoke). The PC and CFB cases utilized a blend of 40 percent Central Appalachian coal, 40 percent Colombian coal, and 20 percent petcoke – referred to as the AQCS Blend. The IGCC case utilized a blend of 25 percent Central Appalachian coal, 25 percent Colombian coal, and 50 percent petcoke – referred to as the IGCC Blend. All blend percentages are by weight. The technologies, plant sizes, and arrangements that were considered for this study are shown in Table 1-1.
Florida Power & Light Clean Coal Technology Selection Study 1.0 Executive Summary
January 2007 1-2 © Black & Veatch 2007 Final Report All Rights Reserved
Table 1-1. Summary of Power Generation Technologies
Case Technology Type Single Unit
Output, MW Net Plant
Output, MW Configuration Fuel Supply
1 SPC 500 2,000 4 Boilers
4 STGs
AQCS Blend
2 USCPC 980 1,960 2 Boilers
2 STGs
AQCS Blend
3 CFB 497 1,988 8 Boilers
4 STGs
AQCS Blend
4 IGCC 940 1,880 6 GE Radiant Gasifiers
6 CTGs
6 HRSGs
2 STGs
IGCC Blend
STG–Steam Turbine Generator CTG–Combustion Turbine Generator HRSG–Heat Recovery Steam Generator 1.3 Overall Assumptions
For the basis of the performance estimates, the site conditions of the proposed greenfield FPL Glades Power Park (FGPP) in Glades County, Moore Haven, Florida were used. The site conditions were provided to Black & Veatch by FPL. Performance estimates were developed for both the hot day and the average day ambient conditions. Following are the overall assumptions, which were consistent among all of the technologies:
• Elevation–20 feet above mean sea level (ASML). • Ambient barometric pressure–14.67 psia. • Hot day ambient conditions:
Dry-bulb temperature–95° F. Relative humidity–50 percent.
• Average day ambient conditions: Dry-bulb temperature–75° F. Relative humidity–60 percent.
• The assumed fuel is a blend of three different fuels. The ultimate analysis of the AQCS and IGCC Blend fuels (which were used to determine performance and cost estimates) is provided in Table 1-2.
Florida Power & Light Clean Coal Technology Selection Study 1.0 Executive Summary
January 2007 1-3 © Black & Veatch 2007 Final Report All Rights Reserved
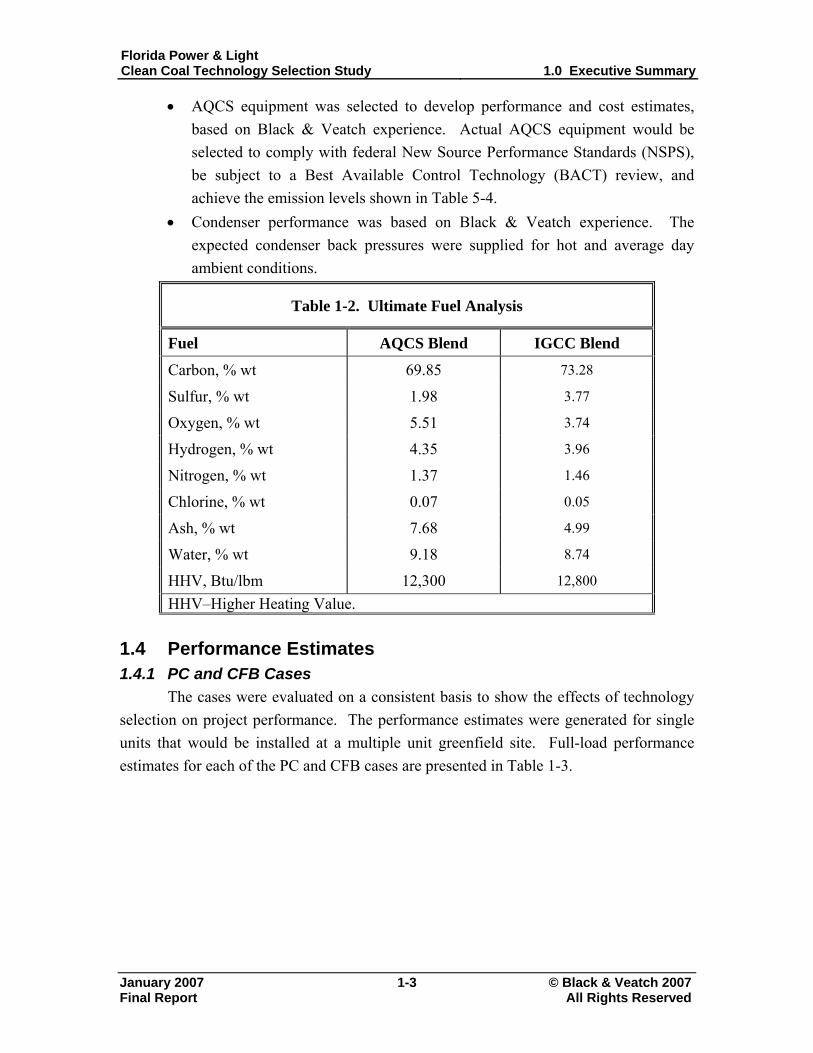
• AQCS equipment was selected to develop performance and cost estimates, based on Black & Veatch experience. Actual AQCS equipment would be selected to comply with federal New Source Performance Standards (NSPS), be subject to a Best Available Control Technology (BACT) review, and achieve the emission levels shown in Table 5-4.
• Condenser performance was based on Black & Veatch experience. The expected condenser back pressures were supplied for hot and average day ambient conditions.
Table 1-2. Ultimate Fuel Analysis
Fuel AQCS Blend IGCC Blend
Carbon, % wt 69.85 73.28
Sulfur, % wt 1.98 3.77
Oxygen, % wt 5.51 3.74
Hydrogen, % wt 4.35 3.96
Nitrogen, % wt 1.37 1.46
Chlorine, % wt 0.07 0.05
Ash, % wt 7.68 4.99
Water, % wt 9.18 8.74
HHV, Btu/lbm 12,300 12,800 HHV–Higher Heating Value.
1.4 Performance Estimates 1.4.1 PC and CFB Cases
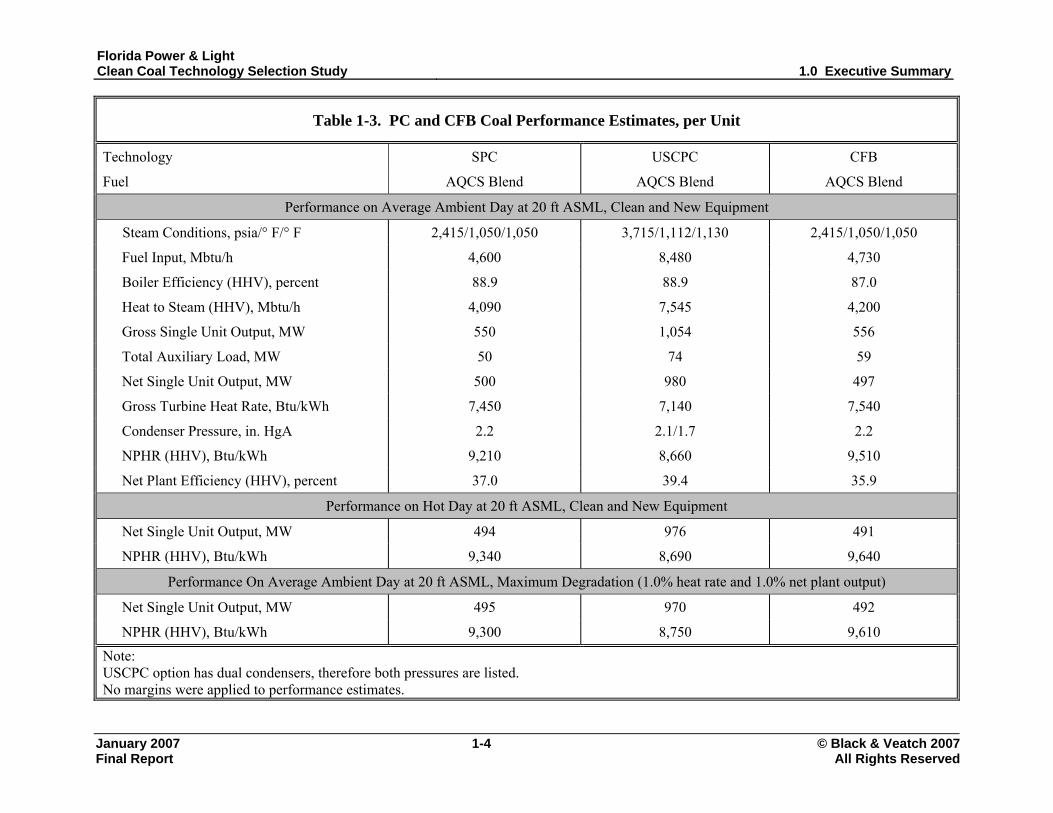
The cases were evaluated on a consistent basis to show the effects of technology selection on project performance. The performance estimates were generated for single units that would be installed at a multiple unit greenfield site. Full-load performance estimates for each of the PC and CFB cases are presented in Table 1-3.
Florida Power & Light Clean Coal Technology Selection Study 1.0 Executive Summary
January 2007 1-4 © Black & Veatch 2007 Final Report All Rights Reserved
Table 1-3. PC and CFB Coal Performance Estimates, per Unit
Technology SPC USCPC CFB
Fuel AQCS Blend AQCS Blend AQCS Blend
Performance on Average Ambient Day at 20 ft ASML, Clean and New Equipment
Steam Conditions, psia/° F/° F 2,415/1,050/1,050 3,715/1,112/1,130 2,415/1,050/1,050
Fuel Input, Mbtu/h 4,600 8,480 4,730
Boiler Efficiency (HHV), percent 88.9 88.9 87.0
Heat to Steam (HHV), Mbtu/h 4,090 7,545 4,200
Gross Single Unit Output, MW 550 1,054 556
Total Auxiliary Load, MW 50 74 59
Net Single Unit Output, MW 500 980 497
Gross Turbine Heat Rate, Btu/kWh 7,450 7,140 7,540
Condenser Pressure, in. HgA 2.2 2.1/1.7 2.2
NPHR (HHV), Btu/kWh 9,210 8,660 9,510
Net Plant Efficiency (HHV), percent 37.0 39.4 35.9
Performance on Hot Day at 20 ft ASML, Clean and New Equipment
Net Single Unit Output, MW 494 976 491
NPHR (HHV), Btu/kWh 9,340 8,690 9,640
Performance On Average Ambient Day at 20 ft ASML, Maximum Degradation (1.0% heat rate and 1.0% net plant output)
Net Single Unit Output, MW 495 970 492
NPHR (HHV), Btu/kWh 9,300 8,750 9,610 Note: USCPC option has dual condensers, therefore both pressures are listed. No margins were applied to performance estimates.
Florida Power & Light Clean Coal Technology Selection Study 1.0 Executive Summary
January 2007 1-5 © Black & Veatch 2007 Final Report All Rights Reserved
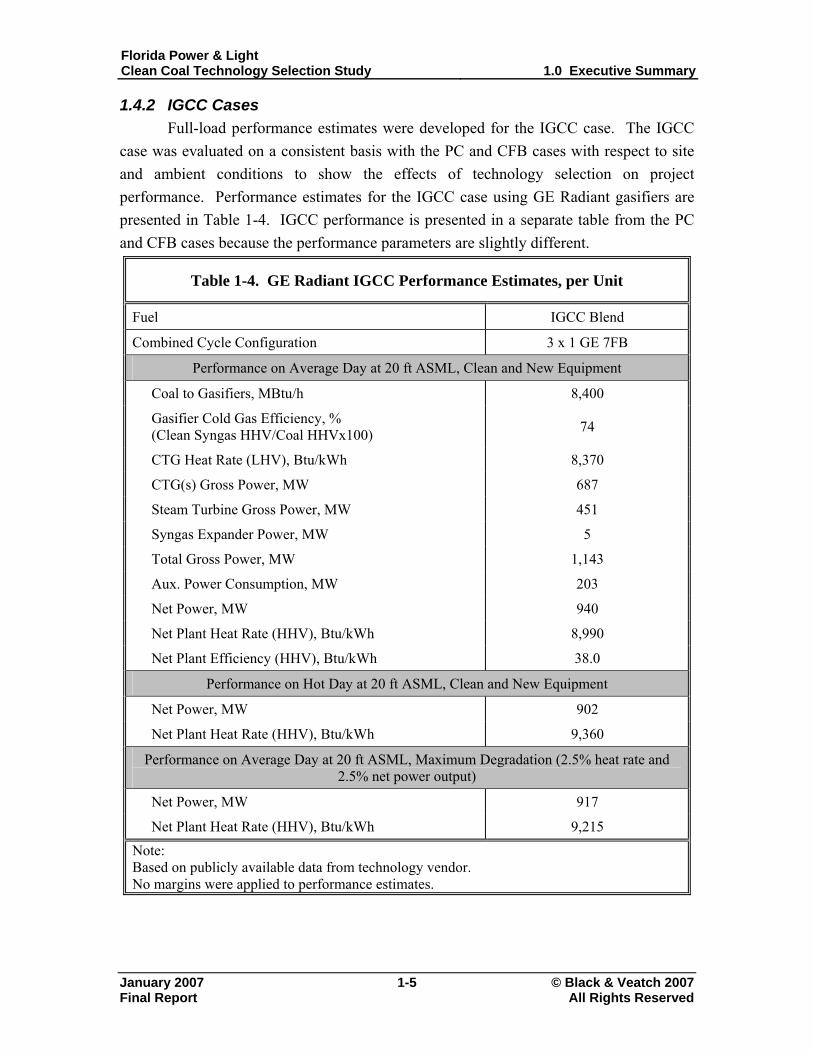
1.4.2 IGCC Cases Full-load performance estimates were developed for the IGCC case. The IGCC
case was evaluated on a consistent basis with the PC and CFB cases with respect to site and ambient conditions to show the effects of technology selection on project performance. Performance estimates for the IGCC case using GE Radiant gasifiers are presented in Table 1-4. IGCC performance is presented in a separate table from the PC and CFB cases because the performance parameters are slightly different.
Table 1-4. GE Radiant IGCC Performance Estimates, per Unit
Fuel IGCC Blend
Combined Cycle Configuration 3 x 1 GE 7FB
Performance on Average Day at 20 ft ASML, Clean and New Equipment
Coal to Gasifiers, MBtu/h 8,400
Gasifier Cold Gas Efficiency, % (Clean Syngas HHV/Coal HHVx100) 74
CTG Heat Rate (LHV), Btu/kWh 8,370
CTG(s) Gross Power, MW 687
Steam Turbine Gross Power, MW 451
Syngas Expander Power, MW 5
Total Gross Power, MW 1,143
Aux. Power Consumption, MW 203
Net Power, MW 940
Net Plant Heat Rate (HHV), Btu/kWh 8,990
Net Plant Efficiency (HHV), Btu/kWh 38.0
Performance on Hot Day at 20 ft ASML, Clean and New Equipment
Net Power, MW 902
Net Plant Heat Rate (HHV), Btu/kWh 9,360
Performance on Average Day at 20 ft ASML, Maximum Degradation (2.5% heat rate and 2.5% net power output)
Net Power, MW 917
Net Plant Heat Rate (HHV), Btu/kWh 9,215 Note: Based on publicly available data from technology vendor. No margins were applied to performance estimates.
Florida Power & Light Clean Coal Technology Selection Study 1.0 Executive Summary
January 2007 1-6 © Black & Veatch 2007 Final Report All Rights Reserved
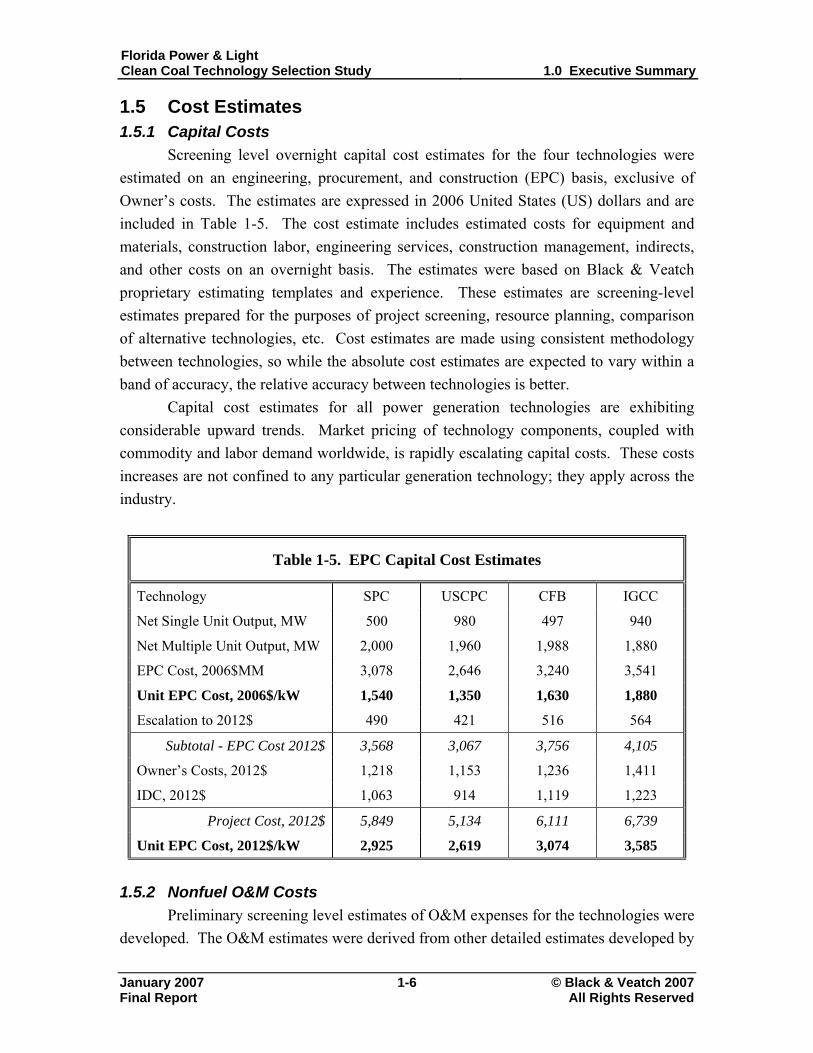
1.5 Cost Estimates 1.5.1 Capital Costs
Screening level overnight capital cost estimates for the four technologies were estimated on an engineering, procurement, and construction (EPC) basis, exclusive of Owner’s costs. The estimates are expressed in 2006 United States (US) dollars and are included in Table 1-5. The cost estimate includes estimated costs for equipment and materials, construction labor, engineering services, construction management, indirects, and other costs on an overnight basis. The estimates were based on Black & Veatch proprietary estimating templates and experience. These estimates are screening-level estimates prepared for the purposes of project screening, resource planning, comparison of alternative technologies, etc. Cost estimates are made using consistent methodology between technologies, so while the absolute cost estimates are expected to vary within a band of accuracy, the relative accuracy between technologies is better.
Capital cost estimates for all power generation technologies are exhibiting considerable upward trends. Market pricing of technology components, coupled with commodity and labor demand worldwide, is rapidly escalating capital costs. These costs increases are not confined to any particular generation technology; they apply across the industry.
Table 1-5. EPC Capital Cost Estimates
Technology SPC USCPC CFB IGCC
Net Single Unit Output, MW 500 980 497 940
Net Multiple Unit Output, MW 2,000 1,960 1,988 1,880
EPC Cost, 2006$MM 3,078 2,646 3,240 3,541
Unit EPC Cost, 2006$/kW 1,540 1,350 1,630 1,880
Escalation to 2012$ 490 421 516 564
Subtotal - EPC Cost 2012$ 3,568 3,067 3,756 4,105
Owner’s Costs, 2012$ 1,218 1,153 1,236 1,411
IDC, 2012$ 1,063 914 1,119 1,223
Project Cost, 2012$ 5,849 5,134 6,111 6,739
Unit EPC Cost, 2012$/kW 2,925 2,619 3,074 3,585
1.5.2 Nonfuel O&M Costs
Preliminary screening level estimates of O&M expenses for the technologies were developed. The O&M estimates were derived from other detailed estimates developed by
Florida Power & Light Clean Coal Technology Selection Study 1.0 Executive Summary
January 2007 1-7 © Black & Veatch 2007 Final Report All Rights Reserved
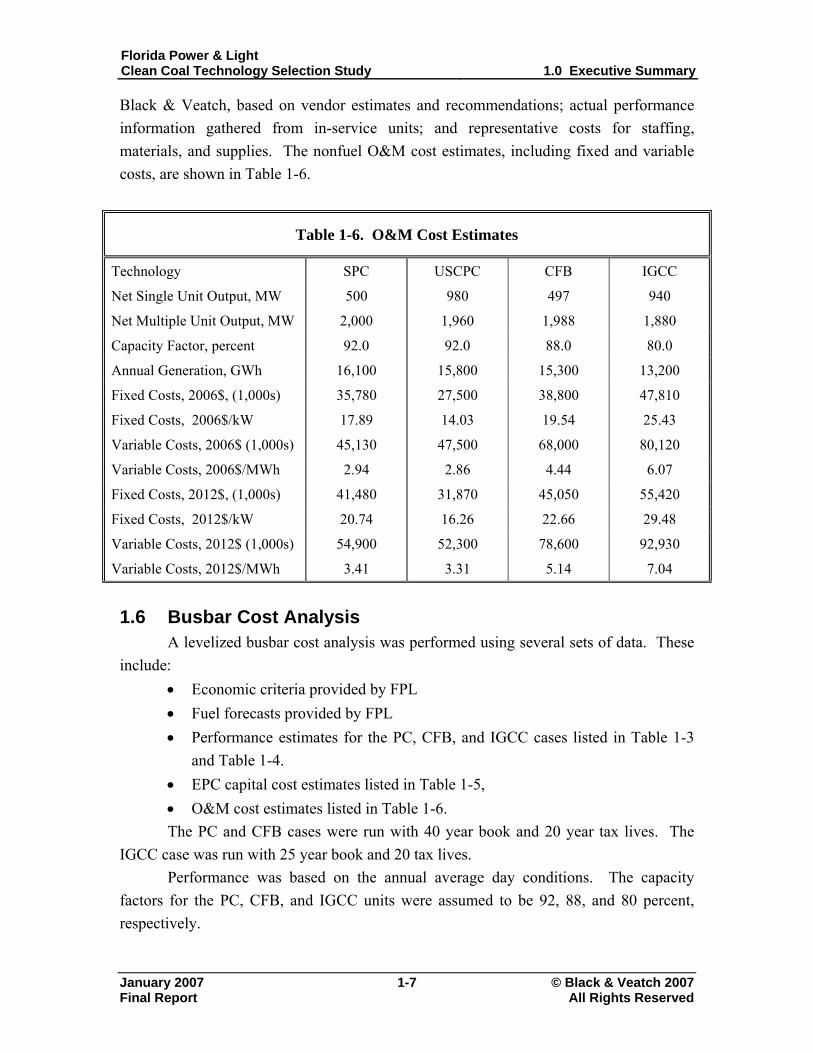
Black & Veatch, based on vendor estimates and recommendations; actual performance information gathered from in-service units; and representative costs for staffing, materials, and supplies. The nonfuel O&M cost estimates, including fixed and variable costs, are shown in Table 1-6.
Table 1-6. O&M Cost Estimates
Technology SPC USCPC CFB IGCC
Net Single Unit Output, MW 500 980 497 940
Net Multiple Unit Output, MW 2,000 1,960 1,988 1,880
Capacity Factor, percent 92.0 92.0 88.0 80.0
Annual Generation, GWh 16,100 15,800 15,300 13,200
Fixed Costs, 2006$, (1,000s) 35,780 27,500 38,800 47,810
Fixed Costs, 2006$/kW 17.89 14.03 19.54 25.43
Variable Costs, 2006$ (1,000s) 45,130 47,500 68,000 80,120
Variable Costs, 2006$/MWh 2.94 2.86 4.44 6.07
Fixed Costs, 2012$, (1,000s) 41,480 31,870 45,050 55,420
Fixed Costs, 2012$/kW 20.74 16.26 22.66 29.48
Variable Costs, 2012$ (1,000s) 54,900 52,300 78,600 92,930
Variable Costs, 2012$/MWh 3.41 3.31 5.14 7.04
1.6 Busbar Cost Analysis
A levelized busbar cost analysis was performed using several sets of data. These include:
• Economic criteria provided by FPL • Fuel forecasts provided by FPL • Performance estimates for the PC, CFB, and IGCC cases listed in Table 1-3
and Table 1-4. • EPC capital cost estimates listed in Table 1-5, • O&M cost estimates listed in Table 1-6. The PC and CFB cases were run with 40 year book and 20 year tax lives. The
IGCC case was run with 25 year book and 20 tax lives. Performance was based on the annual average day conditions. The capacity
factors for the PC, CFB, and IGCC units were assumed to be 92, 88, and 80 percent, respectively.

Florida Power & Light Clean Coal Technology Selection Study 1.0 Executive Summary
January 2007 1-8 © Black & Veatch 2007 Final Report All Rights Reserved
The results of the busbar analysis are provided in Table 1-7. Results are provided in 2012$. Several cases were run:
• Degraded performance at average ambient conditions with no emissions allowance cost included.
• New and clean performance at average ambient conditions with no emissions allowance cost included.
• Degraded performance at average ambient conditions with emissions allowance cost included for oxides of nitrogen (NOx), sulfur dioxide (SO2), and mercury (Hg). Emission allowance costs were estimated by multiplying a forecasted allowance cost by the total annual emissions of each pollutant based on the assumed control limits minus annual emission allocations for FGPP.
• New and clean performance at average ambient conditions with emissions allowance cost included for NOx, SO2, and Hg.
• Degraded performance at average ambient conditions with emissions allowance cost included for NOx, SO2, Hg, and carbon dioxide (CO2) using the 2005 Bingaman carbon tax proposal. No carbon capture was included.
From the analysis, the USCPC unit is the most cost effective technology.
Table 1-7. Busbar Cost Analysis Results, ¢/kWh
Case SPC USCPC CFB IGCC Degraded performance, w/o emissions 9.56 8.63 10.54 12.69
New and clean performance, w/o emissions 9.47 8.54 10.43 12.38
Degraded performance, w/ emissions 9.68 8.74 10.66 12.81
New and clean performance, w/ emissions 9.58 8.65 10.56 12.50
Degraded performance, w/ emissions including CO2
10.96 9.94 11.99 14.00
Note: Results were based on economic criteria from Table 7-1, fuel forecasts from Table 7-2, and the inputs from Table 7-3. These results are based on the maximum assumed capacity factors at average ambient conditions. Results are based on 2012 cost estimates.
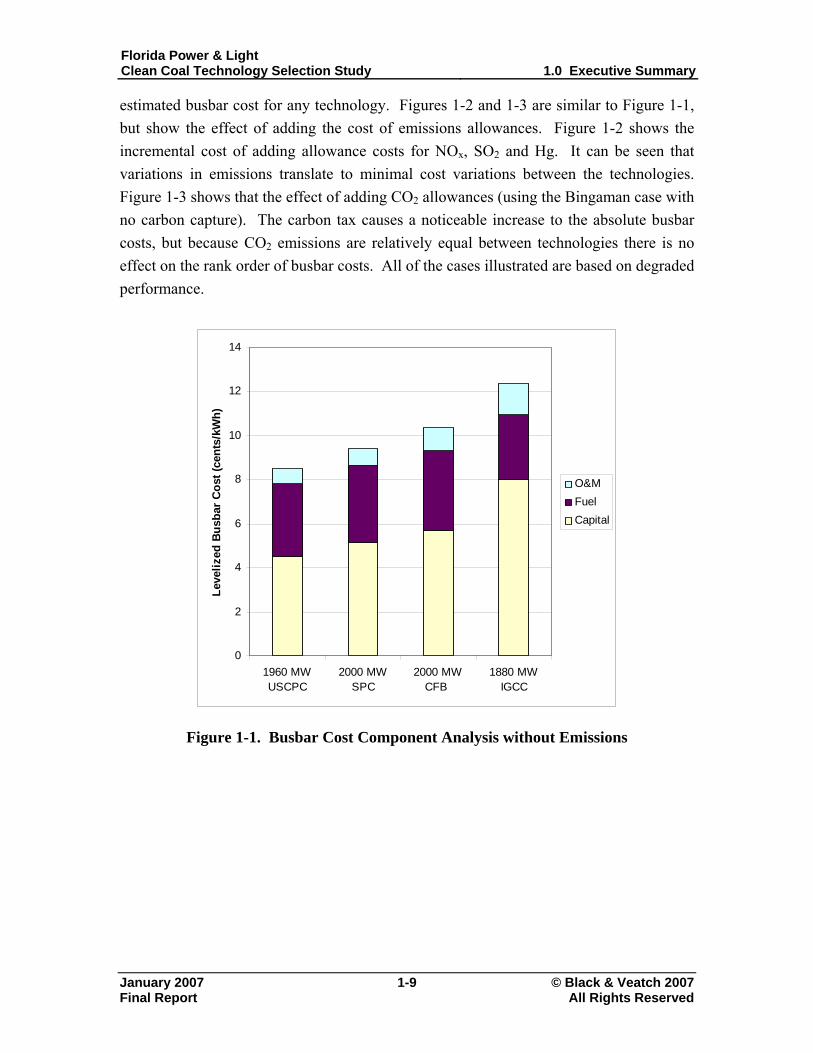
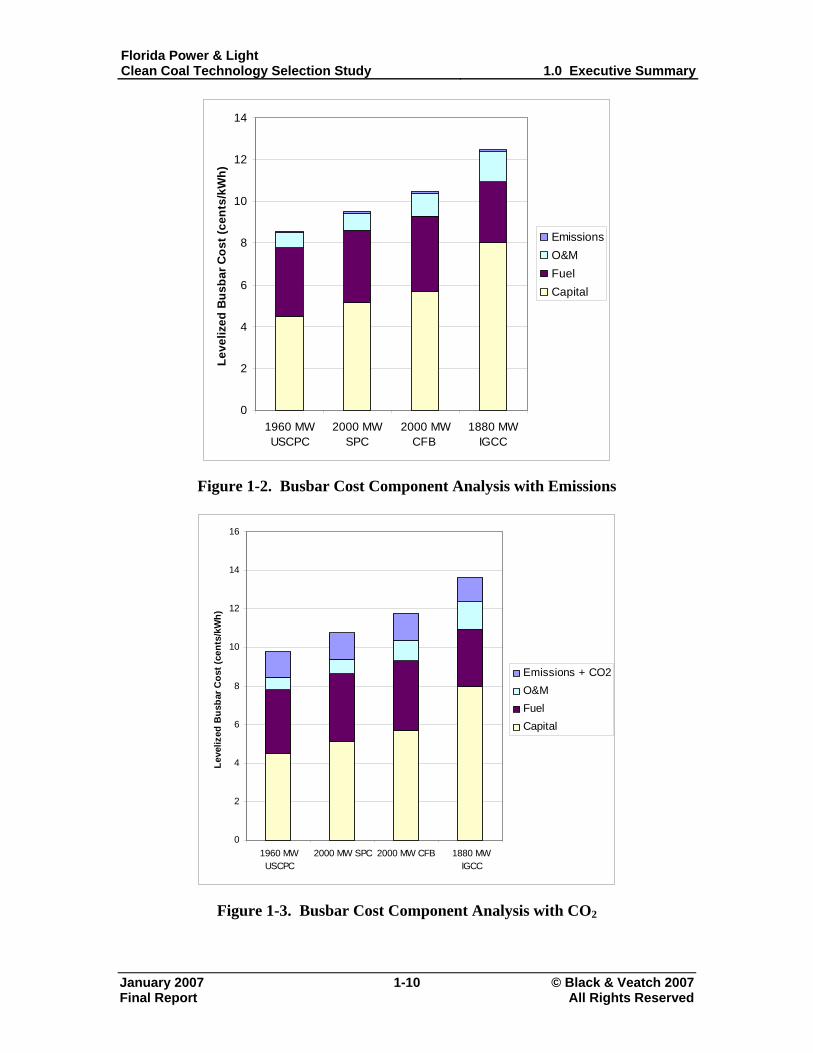
Three charts are provided to illustrate sensitivities of the busbar cost analysis.
Figure 1-1 shows a breakdown of the components of the base case busbar cost without emissions allowances. Fuel and capital requirements make up the majority of the total busbar costs. Variations in these two cost categories will have the largest effect on the
Florida Power & Light Clean Coal Technology Selection Study 1.0 Executive Summary
January 2007 1-9 © Black & Veatch 2007
estimated busbar cost for any technology. Figures 1-2 and 1-3 are similar to Figure 1-1, but show the effect of adding the cost of emissions allowances. Figure 1-2 shows the incremental cost of adding allowance costs for NOx, SO2 and Hg. It can be seen that variations in emissions translate to minimal cost variations between the technologies. Figure 1-3 shows that the effect of adding CO2 allowances (using the Bingaman case with no carbon capture). The carbon tax causes a noticeable increase to the absolute busbar costs, but because CO2 emissions are relatively equal between technologies there is no effect on the rank order of busbar costs. All of the cases illustrated are based on degraded performance.
0
2
4
6
8
10
12
14
1960 MWUSCPC
2000 MWSPC
2000 MWCFB
1880 MWIGCC
Leve
lized
Bus
bar C
ost (
cent
s/kW
h)
O&MFuelCapital
Figure 1-1. Busbar Cost Component Analysis without Emissions
Final Report All Rights Reserved
Florida Power & Light Clean Coal Technology Selection Study 1.0 Executive Summary
January 2007 1-10 © Black & Veatch 2007
0
2
4
6
8
10
12
14
1960 MWUSCPC
2000 MWSPC
2000 MWCFB
1880 MWIGCC
Leve
lized
Bus
bar C
ost (
cent
s/kW
h)EmissionsO&MFuelCapital
Figure 1-2. Busbar Cost Component Analysis with Emissions
0
2
4
6
8
10
12
14
16
1960 MWUSCPC
2000 MW SPC 2000 MW CFB 1880 MWIGCC
Leve
lized
Bus
bar C
ost (
cent
s/kW
h)
Emissions + CO2O&MFuelCapital
Figure 1-3. Busbar Cost Component Analysis with CO2
Final Report All Rights Reserved
Florida Power & Light Clean Coal Technology Selection Study 1.0 Executive Summary
January 2007 1-11 © Black & Veatch 2007 Final Report All Rights Reserved
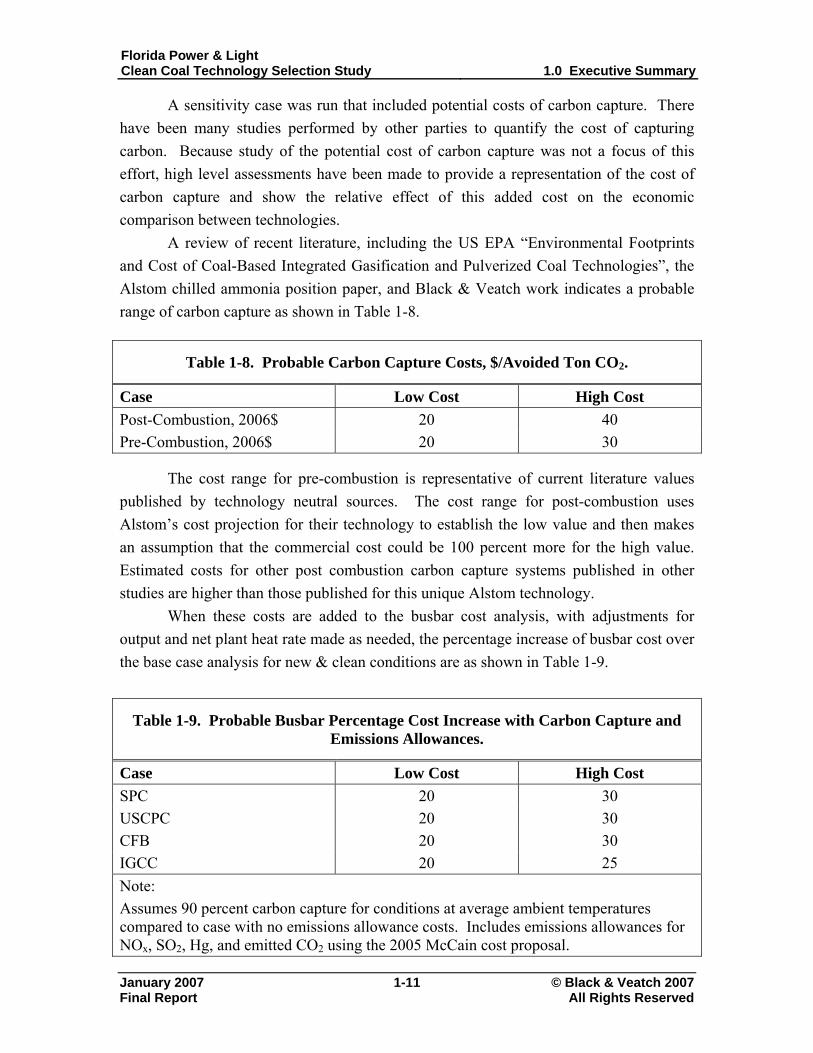
A sensitivity case was run that included potential costs of carbon capture. There have been many studies performed by other parties to quantify the cost of capturing carbon. Because study of the potential cost of carbon capture was not a focus of this effort, high level assessments have been made to provide a representation of the cost of carbon capture and show the relative effect of this added cost on the economic comparison between technologies.
A review of recent literature, including the US EPA “Environmental Footprints and Cost of Coal-Based Integrated Gasification and Pulverized Coal Technologies”, the Alstom chilled ammonia position paper, and Black & Veatch work indicates a probable range of carbon capture as shown in Table 1-8.
Table 1-8. Probable Carbon Capture Costs, $/Avoided Ton CO2.
Case Low Cost High Cost Post-Combustion, 2006$ 20 40 Pre-Combustion, 2006$ 20 30
The cost range for pre-combustion is representative of current literature values published by technology neutral sources. The cost range for post-combustion uses Alstom’s cost projection for their technology to establish the low value and then makes an assumption that the commercial cost could be 100 percent more for the high value. Estimated costs for other post combustion carbon capture systems published in other studies are higher than those published for this unique Alstom technology.
When these costs are added to the busbar cost analysis, with adjustments for output and net plant heat rate made as needed, the percentage increase of busbar cost over the base case analysis for new & clean conditions are as shown in Table 1-9.
Table 1-9. Probable Busbar Percentage Cost Increase with Carbon Capture and Emissions Allowances.
Case Low Cost High Cost SPC 20 30 USCPC 20 30 CFB 20 30 IGCC 20 25 Note: Assumes 90 percent carbon capture for conditions at average ambient temperatures compared to case with no emissions allowance costs. Includes emissions allowances for NOx, SO2, Hg, and emitted CO2 using the 2005 McCain cost proposal.

Florida Power & Light Clean Coal Technology Selection Study 1.0 Executive Summary
January 2007 1-12 © Black & Veatch 2007 Final Report All Rights Reserved
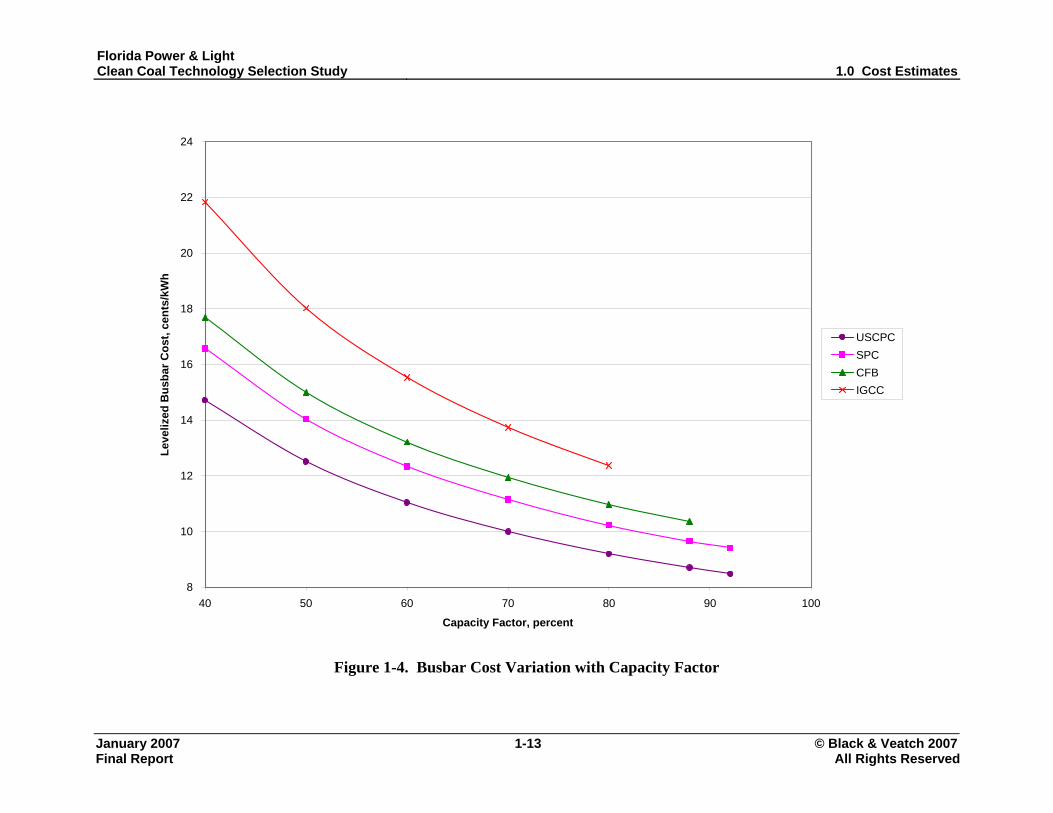
A sensitivity analysis was run to show the effect variations in capacity factor have on economic analysis outputs. Figures 1-4 and 1-5 show the variations in busbar cost in cents per unit of generation (¢/kWh) and net levelized annual cost in dollars per unit of net plant output ($/kW) versus annual capacity factor. The sensitivity analysis was run over a range of capacity factors, from 40 percent to the maximum for each technology. The net plant heat rate was kept constant for all capacity factors, assuming full load operation. While all of the technologies have dramatic changes in busbar and net levelized annual cost across the range of capacity factors, the rank order of costs does not vary with capacity factor.
Florida Power & Light Clean Coal Technology Selection Study 1.0 Cost Estimates
January 2007 1-13 © Black & Veatch 2007
8
10
12
14
16
18
20
22
24
40 50 60 70 80 90 100
Capacity Factor, percent
Leve
lized
Bus
bar C
ost,
cent
s/kW
h
USCPCSPCCFBIGCC
Figure 1-4. Busbar Cost Variation with Capacity Factor
Final Report All Rights Reserved

Florida Power & Light Clean Coal Technology Selection Study 1.0 Cost Estimates
January 2007 1-14 © Black & Veatch 2007 Final Report All Rights Reserved
400
450
500
550
600
650
700
750
800
850
900
40 50 60 70 80 90 100
Capacity Factor, percent
Net
Lev
eliz
ed A
nnua
l Cos
t, $/
kW
USCPCSPCCFBIGCC
Figure 1-5. Net Levelized Annual Cost Variation with Capacity Factor
Florida Power & Light Clean Coal Technology Selection Study 1.0 Executive Summary
January 2007 1-15 © Black & Veatch 2007 Final Report All Rights Reserved
1.7 Conclusions This study made a comparison of performance and cost of four commercially
available coal-fired power generation technologies. These were USCPC, SPC, CFB and IGCC. The estimates for performance were made using publicly available data and engineering data that has been collected by Black & Veatch and FPL. The results of the study are not intended to be absolute for any given technology but rather are intended to be accurate relative from one technology to another.
This study addresses technology risks known or assumed for each type of plant. Clearly PC plants are commercial and have been a dependable generation technology for years. The advancement of operation at ultrasupercritical steam conditions is somewhat new, but has been commercially demonstrated and proven around the world. CFB has also proven its dependability over the past two decades and is considered a mature technology. IGCC has been demonstrated on a commercial scale for over ten years. A second round of commercial scale IGCC plants is being planned currently. Many utilities will reserve decisions on making future IGCC installations until they have observed the installation and operation of these new plants.
Capital cost estimates for all power generation technologies are exhibiting considerable upward trends. Market pricing of technology components, coupled with commodity and labor demand worldwide, is rapidly escalating capital costs. These costs increases are not confined to any particular generation technology; they apply across the industry.
Based on the assumptions, conditions, and engineering estimates made in this study, the USCPC option is the preferred technology selection for the addition of a nominal 2,000 MW net output at the Glades site. The busbar cost of the SPC case, which is the second lowest busbar cost case, is nearly 10 percent more than USCPC. USCPC will have good environmental performance because of its high efficiency. Emissions of NOx and PM will be very similar across all technologies. Sulfur emissions would be slightly lower for IGCC than the PC and CFB options, although start-up and shutdown flaring will reduce the potential benefit of IGCC. The lower expected reliability of IGCC, particularly in the first years of operation, could compromise FPL’s ability to meet the baseload generation requirement and require FPL to run existing units at higher capacity factors.
For the 2012 to 2014 planning time period, USCPC will be the best technical and economic choice for installation of 2,000 MW of capacity at the Glades site.
Florida Power & Light Clean Coal Technology Selection Study 2.0 Introduction
January 2007 2-1 © Black & Veatch 2007 Final Report All Rights Reserved
2.0 Introduction
This study is in connection with Florida Power & Light’s (FPL) generation expansion project investigations for the addition of a nominal 2,000 MW of capacity. The objective of this technology assessment is to characterize the commercially available coal fired electric power generation technologies. The baseload coal technologies considered were SPC, USCPC, CFB, and IGCC. These options were selected as representative of the options that could meet FPL’s clean coal capacity planning needs.
This study provides technology descriptions, plant descriptions and assumptions, and screening level estimates of performance, capital costs, and O&M costs for four coal power generation technologies. Full-load performance estimates were developed at both the hot day and average day ambient conditions.
Each of the cases considered would be located on a greenfield site at the proposed Florida Glades Power Park (FGPP) in Moore Haven, Florida. The required net capacity would be met by installing blocks of power to obtain a nominal 2,000 MW net at the plant boundary. The SPC unit would have a net capacity of 500 MW. The SPC units would be arranged in a four boiler-by-four steam turbine (4x4) configuration. This configuration would produce the required net capacity of 2,000 MW. Each SPC unit would have a net capacity of 980 MW; a 2x2 configuration would be used. Each CFB unit would have a 500 MW net capacity and would comprise two 250 MW CFB boilers and one 500 MW steam turbine. An 8x4 configuration would be required for the CFB case.
For the IGCC case, the nominal 2,000 MW project net capacity could be met by two 940 MW IGCC units. To obtain the 1,880 MW net capacity at the site boundary, six GE Radiant gasifiers would be used in two 3x3x3x1 configurations. The combined cycle configuration of the FGPP plant would consist of six combustion turbine generators (CTGs) whose exhaust heat would generate steam in six heat recovery steam generators (HRSGs). Steam produced in the HRSGs would then be expanded through two steam turbine generators (STGs).
Florida Power & Light Clean Coal Technology Selection Study 2.0 Introduction
January 2007 2-2 © Black & Veatch 2007 Final Report All Rights Reserved
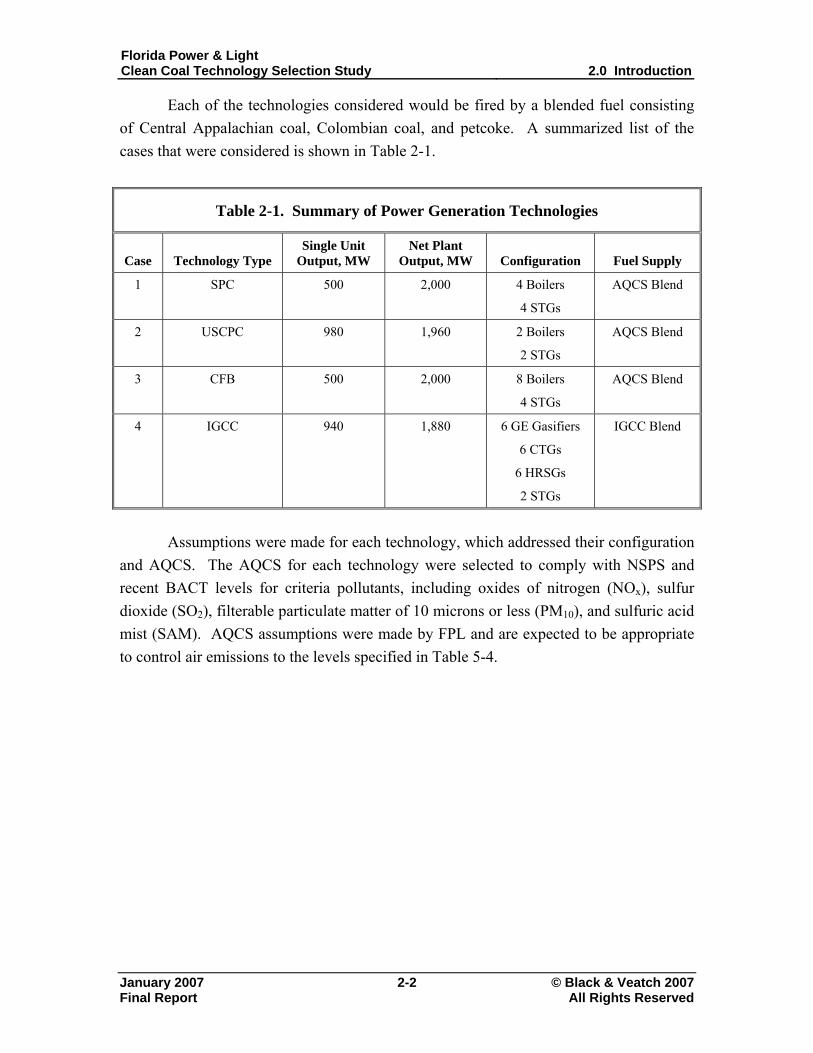
Each of the technologies considered would be fired by a blended fuel consisting of Central Appalachian coal, Colombian coal, and petcoke. A summarized list of the cases that were considered is shown in Table 2-1.
Table 2-1. Summary of Power Generation Technologies
Case Technology Type Single Unit
Output, MW Net Plant
Output, MW Configuration Fuel Supply
1 SPC 500 2,000 4 Boilers
4 STGs
AQCS Blend
2 USCPC 980 1,960 2 Boilers
2 STGs
AQCS Blend
3 CFB 500 2,000 8 Boilers
4 STGs
AQCS Blend
4 IGCC 940 1,880 6 GE Gasifiers
6 CTGs
6 HRSGs
2 STGs
IGCC Blend
Assumptions were made for each technology, which addressed their configuration
and AQCS. The AQCS for each technology were selected to comply with NSPS and recent BACT levels for criteria pollutants, including oxides of nitrogen (NOx), sulfur dioxide (SO2), filterable particulate matter of 10 microns or less (PM10), and sulfuric acid mist (SAM). AQCS assumptions were made by FPL and are expected to be appropriate to control air emissions to the levels specified in Table 5-4.
Florida Power & Light Clean Coal Technology Selection Study 3.0 PC and CFB Technologies
January 2007 3-1 © Black & Veatch 2007
3.0 PC and CFB Technologies
This section contains a summary-level comparison of PC and CFB technologies, including review of technology experience in the United States and discussions of advanced PC steam conditions and issues related to scaling-up CFB unit sizes.
The function of a steam generator is to provide controlled release of heat from the fuel and efficient transfer of heat to the feedwater and steam. The transfer of heat produces main steam at the pressure and temperature required by the high-pressure (HP) turbine. Coal fired steam generator design has evolved into two basic combustion and heat transfer technologies. Suspension firing of coal in a PC unit and the combustion of crushed coal in a CFB unit are the predominant coal fired technologies in operation today.
3.1 Pulverized Coal
Coal is the most widely used fuel for the production of power, and most coal-burning power plants use PC boilers. PC units utilize a proven technology with a very high reliability level. These units have the advantage of being able to accommodate up to 1,300 MW, and the economies of scale can result in low busbar costs. PC units are relatively easy to operate and maintain.
New-generation PC boilers can be designed for supercritical steam pressures of 3,500 to 4,500 psia, compared to the steam pressure of 2,400 psia for conventional subcritical boilers. The increase in pressure from subcritical (2,400 psia) to supercritical (3,500 psia) generally improves the net plant heat rate by about 200 Btu/kWh (HHV), assuming the same main and reheat steam temperatures and the same cycle configuration. This increase in efficiency comes at a cost, however, and the economics of the decision between subcritical and supercritical design depend on the cost of fuel, expected capacity factor of the unit, environmental factors, and the cost of capital.
Newly constructed supercritical PC boilers are currently being designed to provide main and reheat steam at 1,050° F or higher. Advancements in metal alloys now allow main steam temperatures of 1,112° F and reheat temperatures of 1,148° F. The US DOE has defined ultra-supercritical steam cycles as operating pressures exceeding 3,600 psia and main superheat steam temperatures approaching 1,100° F1.
1 “Materials Development for Ultra-supercritical Boilers”, US Department of Energy, Clean Coal Today, Fall 2005
Final Report All Rights Reserved
Florida Power & Light Clean Coal Technology Selection Study 3.0 PC and CFB Technologies
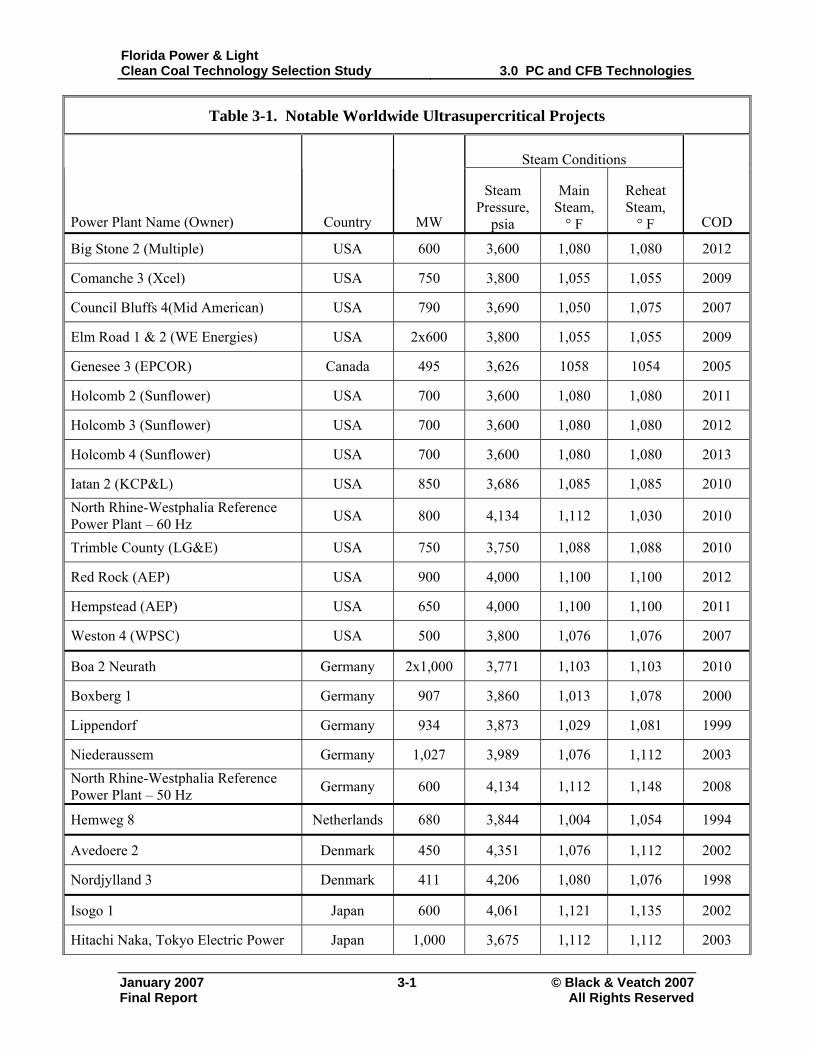
January 2007 3-2 © Black & Veatch 2007
To date, several ultrasupercritical projects in the US, Europe and Japan have been completed or are soon to be completed. Table 3-1 lists some of the more notable projects that have pushed supercritical PC technology to higher throttle pressures and temperatures.
For this study, FPL is investigating USCPC as a potential candidate for electric power generation capacity at FGPP. Although use of USCPC will be a technology advancement in the US, based on documented success of this technology in Europe and Japan shows that USCPC is not a significant technology risk for FPL.
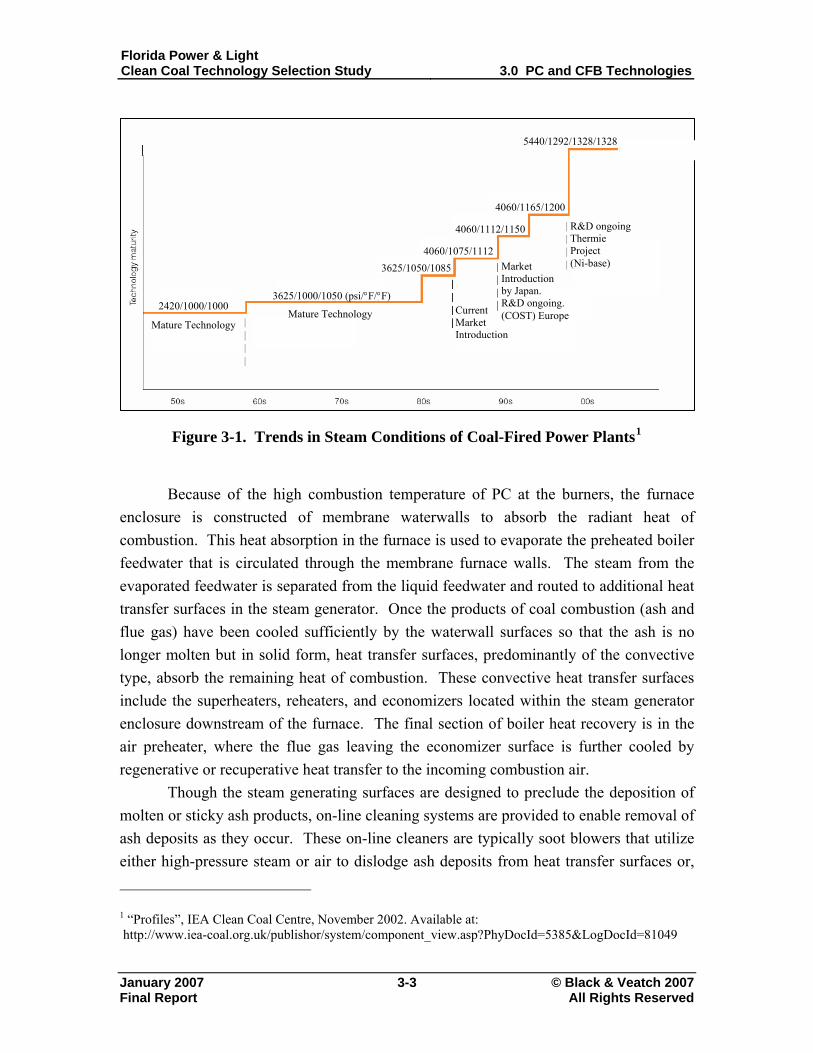
Beyond what is feasible with current technology, future advancements in the use of high-nickel alloys could allow main steam temperatures to reach 1,292° F with a reheat temperature of 1,328° F; however this technology has not yet been fully developed or tested. The THERMIE 700 project in Europe is the first attempt at these higher steam temperatures. Construction of this plant was originally planned for 2008 with a commercial operation being achieved in 2012; however the progress of this project has appeared to stall. The newer alloyed materials necessary to build a plant of this type would not be commercially available until sometime after the successful operation of the THERMIE 700 or a similar demonstration project. In addition to the boiler improvements that would be necessary to increase steam temperatures, advancements in the steam turbine sector would have to be made in order to reliably sustain higher temperatures. The International Energy Agency’s Clean Coal Centre published the history and the possible future of steam temperatures and pressures as shown on Figure 3-1.
Similar to increasing the steam temperature, an increase in steam pressure will also increase efficiency and capital cost. However, the efficiency gain for increased steam pressure is not as great as that for increased temperature. The economics of each situation would have to be examined to optimize the design temperatures and pressure.
With PC technology, coal that is sized to roughly ¾-in. top size is fed to the pulverizers which finely grind the coal to a size of no less than 70 percent (of the coal) through a 200 mesh screen (70 microns). This pulverized coal, suspended in the primary air stream, is conveyed to coal burners. At the burner, this mixture of primary air and coal is further mixed with secondary air and, with the presence of sufficient heat for ignition, the coal burns in suspension with the expectation that combustion will be complete before the burner flame contacts the back wall or sidewalls of the furnace. Current pulverized fuel combustion technology also includes features to minimize unwanted products of combustion. Low NOx burners or air and fuel staging can be used to reduce NOx and carefully controlling air-fuel ratios can reduce CO emissions.
Final Report All Rights Reserved
Florida Power & Light Clean Coal Technology Selection Study 3.0 PC and CFB Technologies
January 2007 3-1 © Black & Veatch 2007
Table 3-1. Notable Worldwide Ultrasupercritical Projects
Steam Conditions
Power Plant Name (Owner) Country MW
Steam Pressure,
psia
Main Steam,
° F
Reheat Steam,
° F COD
Big Stone 2 (Multiple) USA 600 3,600 1,080 1,080 2012
Comanche 3 (Xcel) USA 750 3,800 1,055 1,055 2009
Council Bluffs 4(Mid American) USA 790 3,690 1,050 1,075 2007
Elm Road 1 & 2 (WE Energies) USA 2x600 3,800 1,055 1,055 2009
Genesee 3 (EPCOR) Canada 495 3,626 1058 1054 2005
Holcomb 2 (Sunflower) USA 700 3,600 1,080 1,080 2011
Holcomb 3 (Sunflower) USA 700 3,600 1,080 1,080 2012
Holcomb 4 (Sunflower) USA 700 3,600 1,080 1,080 2013
Iatan 2 (KCP&L) USA 850 3,686 1,085 1,085 2010 North Rhine-Westphalia Reference Power Plant – 60 Hz USA 800 4,134 1,112 1,030 2010
Trimble County (LG&E) USA 750 3,750 1,088 1,088 2010
Red Rock (AEP) USA 900 4,000 1,100 1,100 2012
Hempstead (AEP) USA 650 4,000 1,100 1,100 2011
Weston 4 (WPSC) USA 500 3,800 1,076 1,076 2007
Boa 2 Neurath Germany 2x1,000 3,771 1,103 1,103 2010
Boxberg 1 Germany 907 3,860 1,013 1,078 2000
Lippendorf Germany 934 3,873 1,029 1,081 1999
Niederaussem Germany 1,027 3,989 1,076 1,112 2003 North Rhine-Westphalia Reference Power Plant – 50 Hz Germany 600 4,134 1,112 1,148 2008
Hemweg 8 Netherlands 680 3,844 1,004 1,054 1994
Avedoere 2 Denmark 450 4,351 1,076 1,112 2002
Nordjylland 3 Denmark 411 4,206 1,080 1,076 1998
Isogo 1 Japan 600 4,061 1,121 1,135 2002
Hitachi Naka, Tokyo Electric Power Japan 1,000 3,675 1,112 1,112 2003
Final Report All Rights Reserved
Florida Power & Light Clean Coal Technology Selection Study 3.0 PC and CFB Technologies
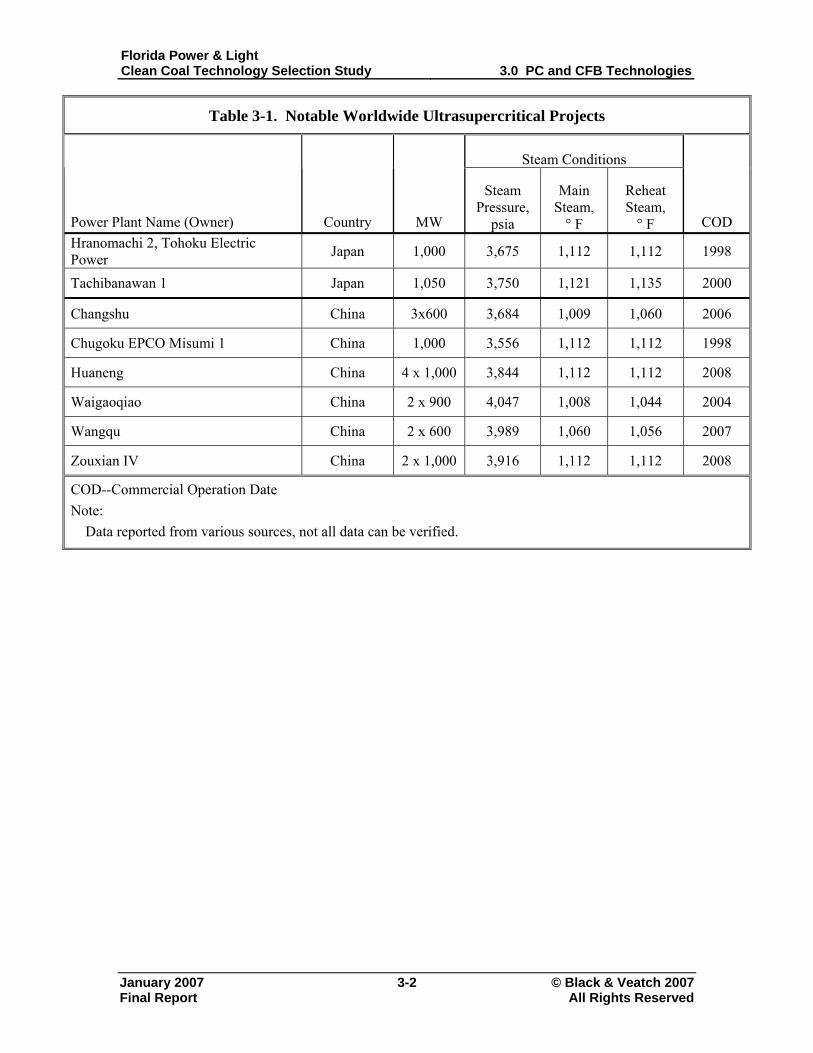
January 2007 3-2 © Black & Veatch 2007
Table 3-1. Notable Worldwide Ultrasupercritical Projects
Steam Conditions
Power Plant Name (Owner) Country MW
Steam Pressure,
psia
Main Steam,
° F
Reheat Steam,
° F COD Hranomachi 2, Tohoku Electric Power Japan 1,000 3,675 1,112 1,112 1998
Tachibanawan 1 Japan 1,050 3,750 1,121 1,135 2000
Changshu China 3x600 3,684 1,009 1,060 2006
Chugoku EPCO Misumi 1 China 1,000 3,556 1,112 1,112 1998
Huaneng China 4 x 1,000 3,844 1,112 1,112 2008
Waigaoqiao China 2 x 900 4,047 1,008 1,044 2004
Wangqu China 2 x 600 3,989 1,060 1,056 2007
Zouxian IV China 2 x 1,000 3,916 1,112 1,112 2008
COD--Commercial Operation Date Note: Data reported from various sources, not all data can be verified.
Final Report All Rights Reserved
Florida Power & Light Clean Coal Technology Selection Study 3.0 PC and CFB Technologies
January 2007 3-3 © Black & Veatch 2007
2420/1000/1000
3625/1050/1085 4060/1075/1112
4060/1165/1200
4060/1112/1150
3625/1000/1050 (psi/°F/°F)
Mature Technology
Mature Technology
R&D ongoing Thermie Project (Ni-base)
Market Introduction by Japan. R&D ongoing. (COST) Europe
Current Market Introduction
5440/1292/1328/1328
Figure 3-1. Trends in Steam Conditions of Coal-Fired Power Plants1
Because of the high combustion temperature of PC at the burners, the furnace
enclosure is constructed of membrane waterwalls to absorb the radiant heat of combustion. This heat absorption in the furnace is used to evaporate the preheated boiler feedwater that is circulated through the membrane furnace walls. The steam from the evaporated feedwater is separated from the liquid feedwater and routed to additional heat transfer surfaces in the steam generator. Once the products of coal combustion (ash and flue gas) have been cooled sufficiently by the waterwall surfaces so that the ash is no longer molten but in solid form, heat transfer surfaces, predominantly of the convective type, absorb the remaining heat of combustion. These convective heat transfer surfaces include the superheaters, reheaters, and economizers located within the steam generator enclosure downstream of the furnace. The final section of boiler heat recovery is in the air preheater, where the flue gas leaving the economizer surface is further cooled by regenerative or recuperative heat transfer to the incoming combustion air.
Though the steam generating surfaces are designed to preclude the deposition of molten or sticky ash products, on-line cleaning systems are provided to enable removal of ash deposits as they occur. These on-line cleaners are typically soot blowers that utilize either high-pressure steam or air to dislodge ash deposits from heat transfer surfaces or,
1 “Profiles”, IEA Clean Coal Centre, November 2002. Available at: http://www.iea-coal.org.uk/publishor/system/component_view.asp?PhyDocId=5385&LogDocId=81049
Final Report All Rights Reserved
Florida Power & Light Clean Coal Technology Selection Study 3.0 PC and CFB Technologies
January 2007 3-4 © Black & Veatch 2007
in cases with extreme ash deposition, utilize high-pressure water cannons to remove molten ash deposits from evaporative steam generator surfaces. The characteristics of the coal, such as ash content and ash chemical composition, dictate the type, quantity, and frequency of use of these on-line ash cleaning systems. Ash characteristics also dictate steam generator design regarding the maximum flue gas temperatures that can be tolerated entering convective heat transfer surfaces. The design must ensure that ash in the flue gas stream has been sufficiently cooled so it will not rapidly agglomerate or bond to convective heat transfer surfaces. In the case of very hard and erosive ash components, the flue gas velocities must be sufficiently slow so that the ash will not rapidly erode heat transfer surfaces.
With PC combustion technology, the majority of the solid ash components in the coal will be carried in the flue gas stream all the way through the furnace and convective heat transfer components to enable collection with particulate removal equipment downstream of the air preheaters. Typically, no less than 80 percent of the total ash will be carried out of the steam generator for collection downstream. Roughly 15 percent of the total fuel ash is collected wet from the furnace as bottom ash, and 5 percent is collected dry in hoppers located below the steam generator economizer and regenerative air heaters.
3.2 PC Vendors
There are currently eight major manufacturers of PC steam generators. These manufacturers are listed in Table 3-2.
Table 3-2. PC Boiler Vendors
• Alstom • Foster Wheeler (FW) • Babcock Power (BP) • Ishikawajima Harima Heavy Industries (IHI)• Babcock & Wilcox (B&W) • Mitsubishi Heavy Industries (MHI) • Babcock-Hitachi (B-H) • Mitsui Babcock (MB)
The current utility steam generator technology offered by the major vendors is
similar, with the exception of boiler tube construction, commercially available alloys, and burner arrangement and technology.
3.2.1 Boiler Tube Construction All subcritical boilers use vertical tubes; nearly all of the vendors use smooth
tubes except Babcock & Wilcox which uses a slightly rifled tube. There are two main
Final Report All Rights Reserved
Florida Power & Light Clean Coal Technology Selection Study 3.0 PC and CFB Technologies
January 2007 3-5 © Black & Veatch 2007
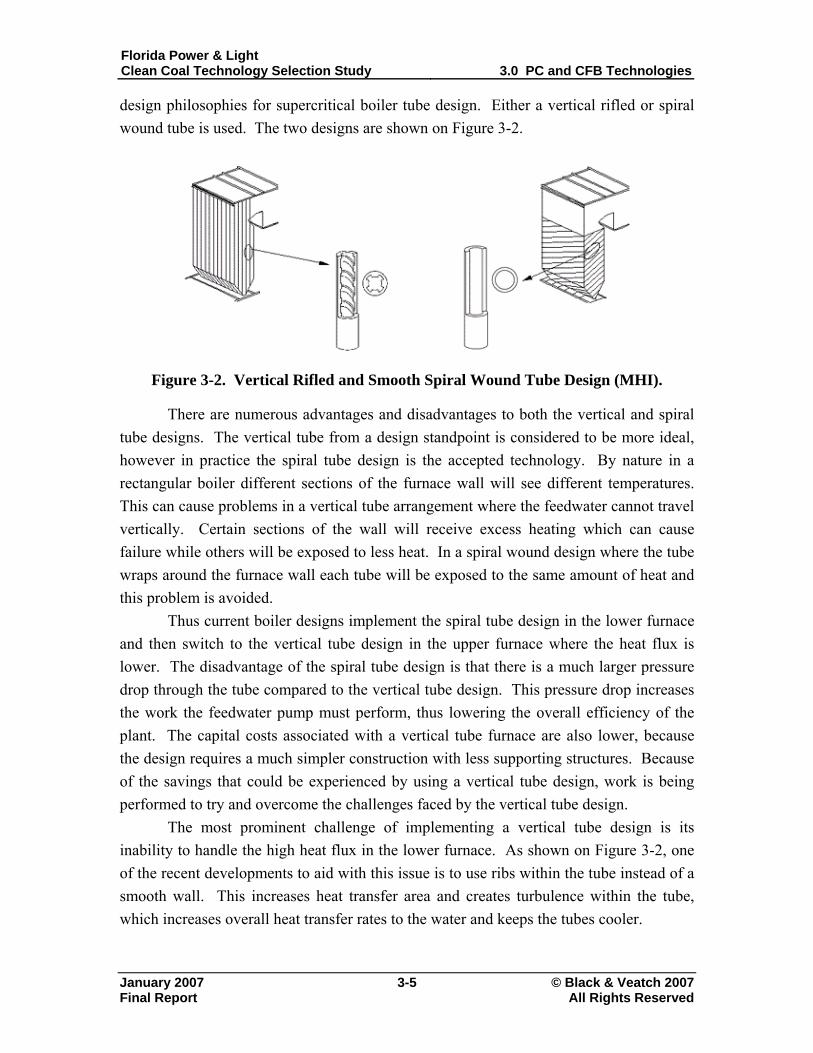
design philosophies for supercritical boiler tube design. Either a vertical rifled or spiral wound tube is used. The two designs are shown on Figure 3-2.
Figure 3-2. Vertical Rifled and Smooth Spiral Wound Tube Design (MHI).
There are numerous advantages and disadvantages to both the vertical and spiral tube designs. The vertical tube from a design standpoint is considered to be more ideal, however in practice the spiral tube design is the accepted technology. By nature in a rectangular boiler different sections of the furnace wall will see different temperatures. This can cause problems in a vertical tube arrangement where the feedwater cannot travel vertically. Certain sections of the wall will receive excess heating which can cause failure while others will be exposed to less heat. In a spiral wound design where the tube wraps around the furnace wall each tube will be exposed to the same amount of heat and this problem is avoided.
Thus current boiler designs implement the spiral tube design in the lower furnace and then switch to the vertical tube design in the upper furnace where the heat flux is lower. The disadvantage of the spiral tube design is that there is a much larger pressure drop through the tube compared to the vertical tube design. This pressure drop increases the work the feedwater pump must perform, thus lowering the overall efficiency of the plant. The capital costs associated with a vertical tube furnace are also lower, because the design requires a much simpler construction with less supporting structures. Because of the savings that could be experienced by using a vertical tube design, work is being performed to try and overcome the challenges faced by the vertical tube design.
The most prominent challenge of implementing a vertical tube design is its inability to handle the high heat flux in the lower furnace. As shown on Figure 3-2, one of the recent developments to aid with this issue is to use ribs within the tube instead of a smooth wall. This increases heat transfer area and creates turbulence within the tube, which increases overall heat transfer rates to the water and keeps the tubes cooler.
Final Report All Rights Reserved
Florida Power & Light Clean Coal Technology Selection Study 3.0 PC and CFB Technologies
January 2007 3-6 © Black & Veatch 2007
A possible advantage of a vertical tube design is its ability to operate in natural circulation. Current supercritical boiler tube designs rely on forced circulation systems. New vertical tube designs are currently being developed to operate in natural circulation. A characteristic of natural circulation subcritical boilers is that when the water within the tube heats up the mass flow rate will also increase, thus drawing in more cooler water to maintain a safe tube temperature. In a supercritical application this characteristic would automatically control problems associated with boiler tubes overheating. However this characteristic has only been shown to occur in laboratory tests and there is no actual experience with a supercritical power plant using this technology.
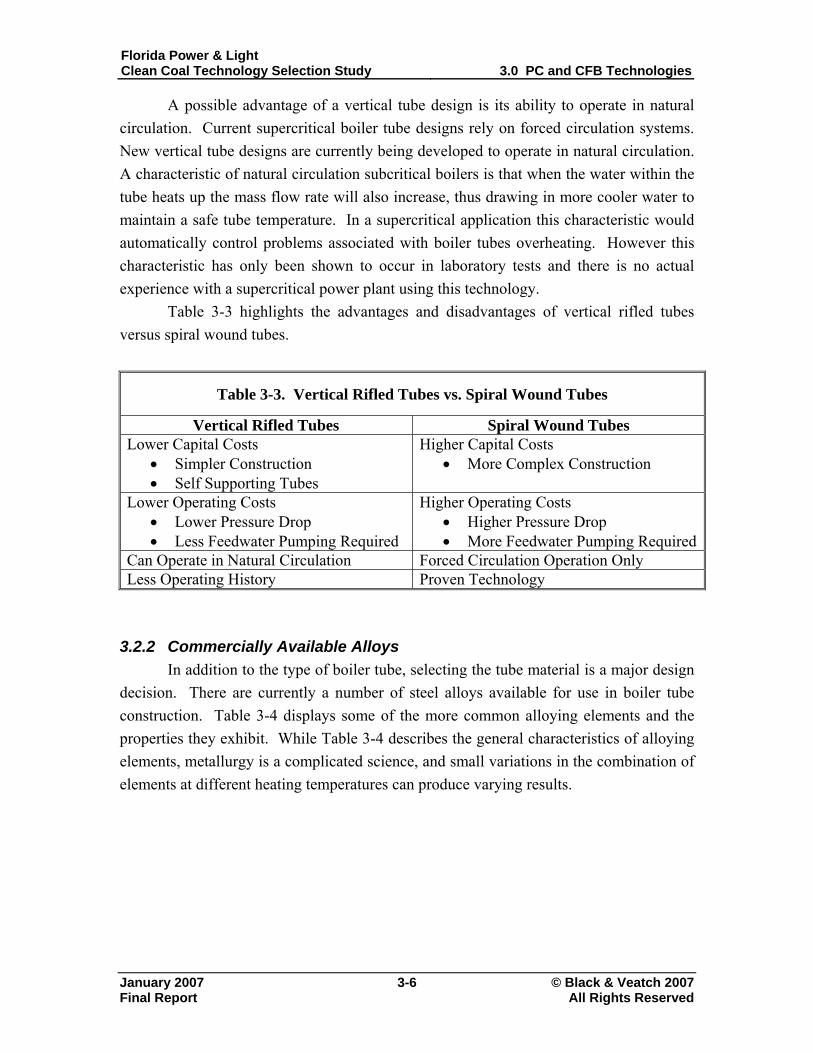
Table 3-3 highlights the advantages and disadvantages of vertical rifled tubes versus spiral wound tubes.
Table 3-3. Vertical Rifled Tubes vs. Spiral Wound Tubes
Vertical Rifled Tubes Spiral Wound Tubes Lower Capital Costs
• Simpler Construction • Self Supporting Tubes
Higher Capital Costs • More Complex Construction
Lower Operating Costs • Lower Pressure Drop • Less Feedwater Pumping Required
Higher Operating Costs • Higher Pressure Drop • More Feedwater Pumping Required
Can Operate in Natural Circulation Forced Circulation Operation Only Less Operating History Proven Technology
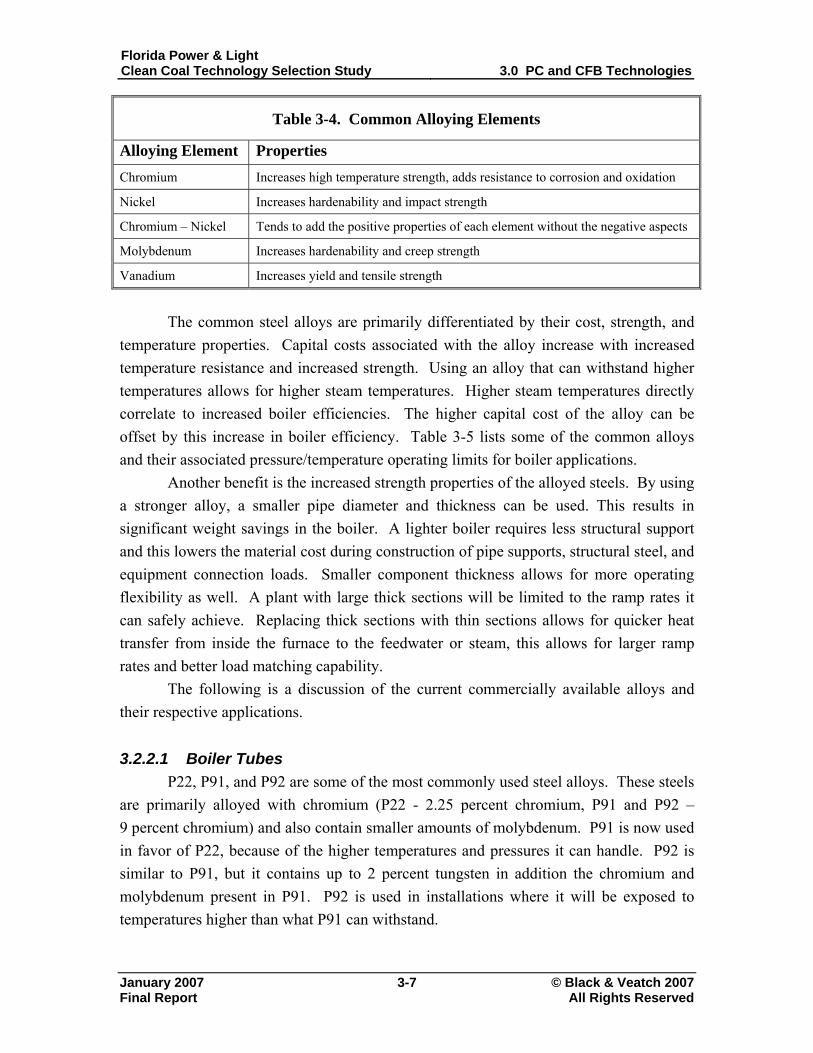
3.2.2 Commercially Available Alloys In addition to the type of boiler tube, selecting the tube material is a major design
decision. There are currently a number of steel alloys available for use in boiler tube construction. Table 3-4 displays some of the more common alloying elements and the properties they exhibit. While Table 3-4 describes the general characteristics of alloying elements, metallurgy is a complicated science, and small variations in the combination of elements at different heating temperatures can produce varying results.
Final Report All Rights Reserved
Florida Power & Light Clean Coal Technology Selection Study 3.0 PC and CFB Technologies
January 2007 3-7 © Black & Veatch 2007
Table 3-4. Common Alloying Elements
Alloying Element Properties Chromium Increases high temperature strength, adds resistance to corrosion and oxidation
Nickel Increases hardenability and impact strength
Chromium – Nickel Tends to add the positive properties of each element without the negative aspects
Molybdenum Increases hardenability and creep strength
Vanadium Increases yield and tensile strength
The common steel alloys are primarily differentiated by their cost, strength, and
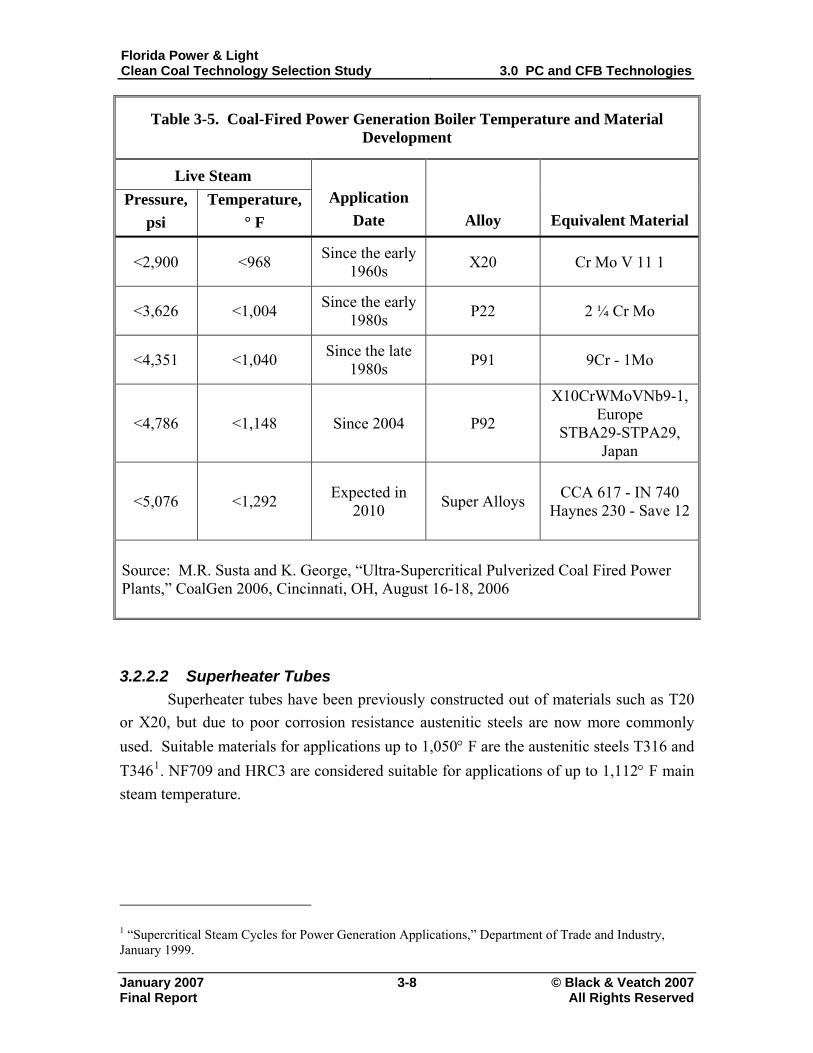
temperature properties. Capital costs associated with the alloy increase with increased temperature resistance and increased strength. Using an alloy that can withstand higher temperatures allows for higher steam temperatures. Higher steam temperatures directly correlate to increased boiler efficiencies. The higher capital cost of the alloy can be offset by this increase in boiler efficiency. Table 3-5 lists some of the common alloys and their associated pressure/temperature operating limits for boiler applications.
Another benefit is the increased strength properties of the alloyed steels. By using a stronger alloy, a smaller pipe diameter and thickness can be used. This results in significant weight savings in the boiler. A lighter boiler requires less structural support and this lowers the material cost during construction of pipe supports, structural steel, and equipment connection loads. Smaller component thickness allows for more operating flexibility as well. A plant with large thick sections will be limited to the ramp rates it can safely achieve. Replacing thick sections with thin sections allows for quicker heat transfer from inside the furnace to the feedwater or steam, this allows for larger ramp rates and better load matching capability.
The following is a discussion of the current commercially available alloys and their respective applications.
3.2.2.1 Boiler Tubes P22, P91, and P92 are some of the most commonly used steel alloys. These steels
are primarily alloyed with chromium (P22 - 2.25 percent chromium, P91 and P92 – 9 percent chromium) and also contain smaller amounts of molybdenum. P91 is now used in favor of P22, because of the higher temperatures and pressures it can handle. P92 is similar to P91, but it contains up to 2 percent tungsten in addition the chromium and molybdenum present in P91. P92 is used in installations where it will be exposed to temperatures higher than what P91 can withstand.
Final Report All Rights Reserved
Florida Power & Light Clean Coal Technology Selection Study 3.0 PC and CFB Technologies
January 2007 3-8 © Black & Veatch 2007
Table 3-5. Coal-Fired Power Generation Boiler Temperature and Material Development
Live Steam Pressure,
psi Temperature,
° F Application
Date Alloy Equivalent Material
<2,900 <968 Since the early 1960s X20 Cr Mo V 11 1
<3,626 <1,004 Since the early 1980s P22 2 ¼ Cr Mo
<4,351 <1,040 Since the late 1980s P91 9Cr - 1Mo
<4,786 <1,148 Since 2004 P92
X10CrWMoVNb9-1, Europe
STBA29-STPA29, Japan
<5,076 <1,292 Expected in 2010 Super Alloys CCA 617 - IN 740
Haynes 230 - Save 12
Source: M.R. Susta and K. George, “Ultra-Supercritical Pulverized Coal Fired Power Plants,” CoalGen 2006, Cincinnati, OH, August 16-18, 2006
3.2.2.2 Superheater Tubes Superheater tubes have been previously constructed out of materials such as T20
or X20, but due to poor corrosion resistance austenitic steels are now more commonly used. Suitable materials for applications up to 1,050° F are the austenitic steels T316 and T3461. NF709 and HRC3 are considered suitable for applications of up to 1,112° F main steam temperature.
1 “Supercritical Steam Cycles for Power Generation Applications,” Department of Trade and Industry, January 1999.
Final Report All Rights Reserved
Florida Power & Light Clean Coal Technology Selection Study 3.0 PC and CFB Technologies
January 2007 3-9 © Black & Veatch 2007
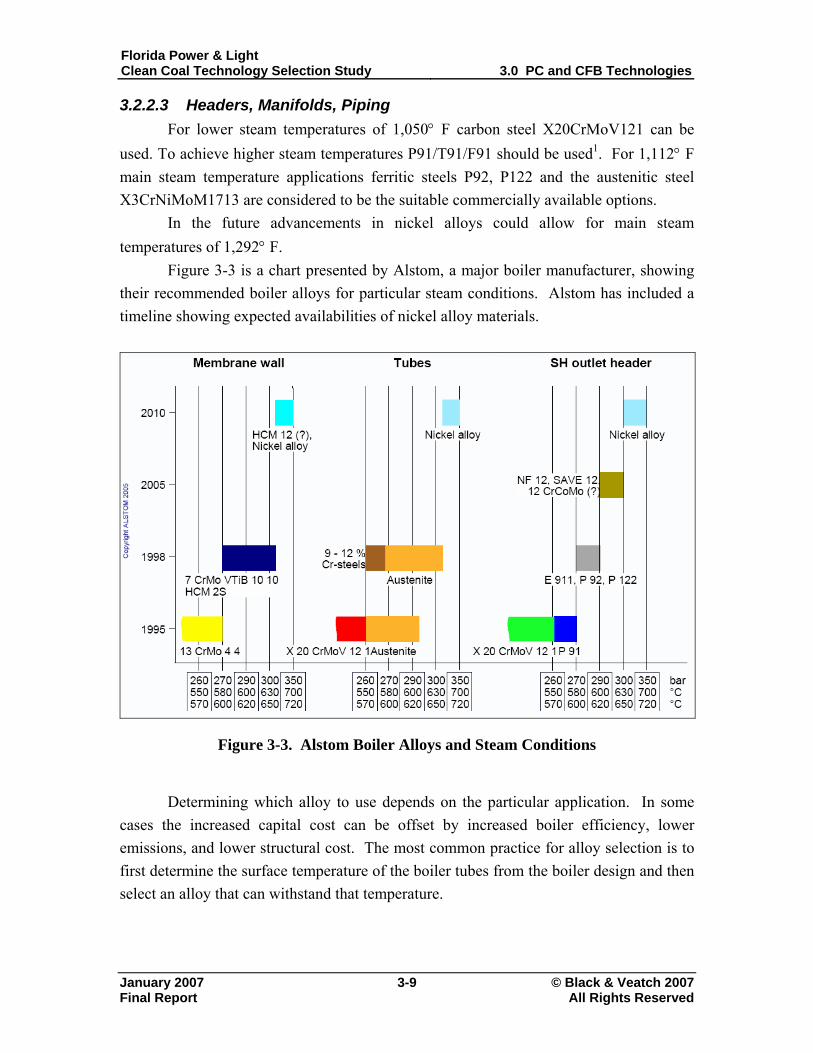
3.2.2.3 Headers, Manifolds, Piping For lower steam temperatures of 1,050° F carbon steel X20CrMoV121 can be
used. To achieve higher steam temperatures P91/T91/F91 should be used1. For 1,112° F main steam temperature applications ferritic steels P92, P122 and the austenitic steel X3CrNiMoM1713 are considered to be the suitable commercially available options.
In the future advancements in nickel alloys could allow for main steam temperatures of 1,292° F.
Figure 3-3 is a chart presented by Alstom, a major boiler manufacturer, showing their recommended boiler alloys for particular steam conditions. Alstom has included a timeline showing expected availabilities of nickel alloy materials.
Figure 3-3. Alstom Boiler Alloys and Steam Conditions
Determining which alloy to use depends on the particular application. In some
cases the increased capital cost can be offset by increased boiler efficiency, lower emissions, and lower structural cost. The most common practice for alloy selection is to first determine the surface temperature of the boiler tubes from the boiler design and then select an alloy that can withstand that temperature.
Final Report All Rights Reserved
Florida Power & Light Clean Coal Technology Selection Study 3.0 PC and CFB Technologies
January 2007 3-10 © Black & Veatch 2007
3.2.3 Burner Arrangement PC boiler burners can be arranged in either a wall-fired or a corner or tangentially
fired set-up. The wall-fired burners are either rear or front wall firing or they can be set up as front and rear-wall opposed. Corner or tangential fired set-ups typically have the burners firing from each of the four corners of the furnace.
3.3 Fluidized Bed
During the 1980s, fluidized bed combustion (FBC) rapidly emerged as a viable alternative to PC-fueled units for the combustion of solid fuels. Initially used in the chemical and process industries, FBC was applied to the electric utility industry because of its perceived advantages over competing combustion technologies. SO2 emissions could be controlled from FBC units without the use of external scrubbers, and NOx emissions from FBC units are inherently low. Furthermore, FBC units are “fuel flexible,” with the capability to fire a wide range of solid fuels with varying heating values, ash contents, and moisture contents. Additionally, slagging and fouling tendencies were minimized in FBC units because of the low combustion temperatures.
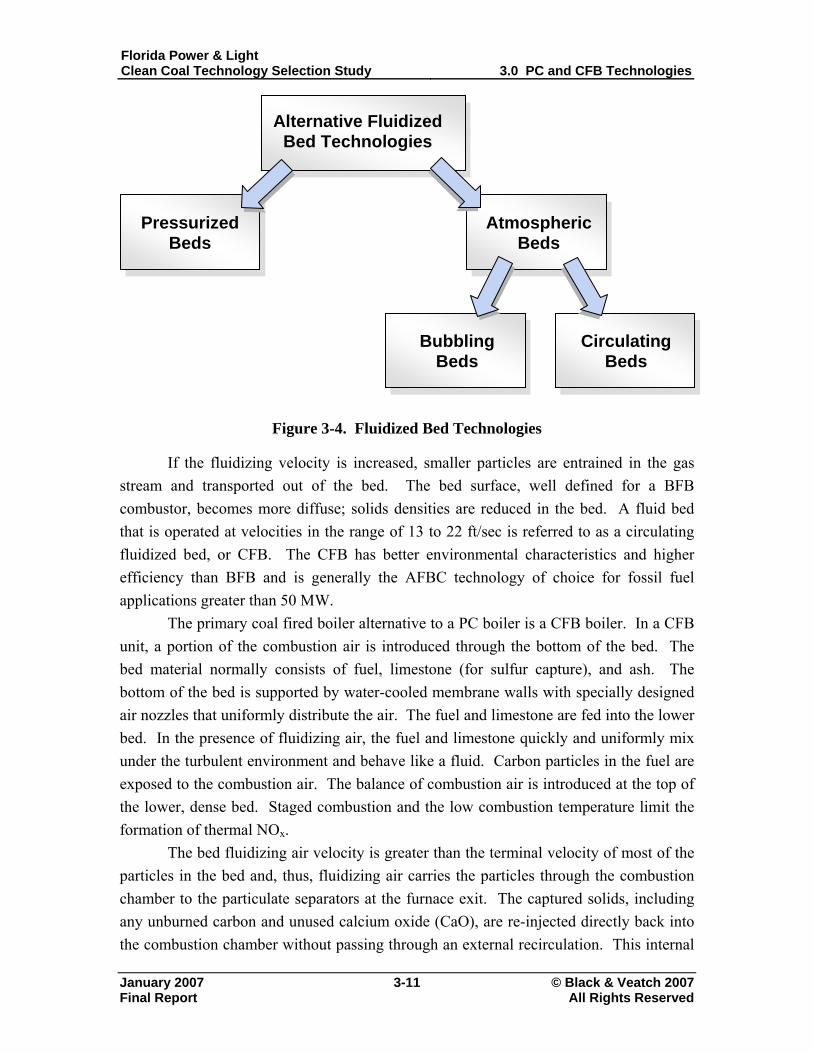
There are several types of fluidized bed technologies, as illustrated on Figure 3-4. Pressurized FBC is currently a demonstration technology and will not be discussed here. Atmospheric FBC (AFBC) is generally divided into two categories: bubbling and circulating. A typical AFBC is composed of fuel and bed material contained within a refractory-lined, heat absorbing vessel. The composition of the bed during full-load operation is typically in the range of 98 percent bed material and only 2 percent fuel. The bed becomes fluidized when air or other gas flows upward at a velocity sufficient to expand the bed. At low fluidizing velocities (3 to 10 ft/sec), relatively high solid densities are maintained in the bed and only a small fraction of the solids are entrained from the bed. A fluid bed that is operated in this velocity range is referred to as a bubbling fluidized bed (BFB).
Final Report All Rights Reserved
Florida Power & Light Clean Coal Technology Selection Study 3.0 PC and CFB Technologies
January 2007 3-11 © Black & Veatch 2007
Alternative Fluidized Bed Technologies
Pressurized Beds
Atmospheric Beds
BubblingBeds
CirculatingBeds
Figure 3-4. Fluidized Bed Technologies
If the fluidizing velocity is increased, smaller particles are entrained in the gas stream and transported out of the bed. The bed surface, well defined for a BFB combustor, becomes more diffuse; solids densities are reduced in the bed. A fluid bed that is operated at velocities in the range of 13 to 22 ft/sec is referred to as a circulating fluidized bed, or CFB. The CFB has better environmental characteristics and higher efficiency than BFB and is generally the AFBC technology of choice for fossil fuel applications greater than 50 MW.
The primary coal fired boiler alternative to a PC boiler is a CFB boiler. In a CFB unit, a portion of the combustion air is introduced through the bottom of the bed. The bed material normally consists of fuel, limestone (for sulfur capture), and ash. The bottom of the bed is supported by water-cooled membrane walls with specially designed air nozzles that uniformly distribute the air. The fuel and limestone are fed into the lower bed. In the presence of fluidizing air, the fuel and limestone quickly and uniformly mix under the turbulent environment and behave like a fluid. Carbon particles in the fuel are exposed to the combustion air. The balance of combustion air is introduced at the top of the lower, dense bed. Staged combustion and the low combustion temperature limit the formation of thermal NOx. The bed fluidizing air velocity is greater than the terminal velocity of most of the particles in the bed and, thus, fluidizing air carries the particles through the combustion chamber to the particulate separators at the furnace exit. The captured solids, including any unburned carbon and unused calcium oxide (CaO), are re-injected directly back into the combustion chamber without passing through an external recirculation. This internal
Final Report All Rights Reserved
Florida Power & Light Clean Coal Technology Selection Study 3.0 PC and CFB Technologies
January 2007 3-12 © Black & Veatch 2007
solids circulation provides longer residence time for the fuel and limestone, resulting in good combustion and improved sulfur capture.
Commercial CFB units offer greater fuel diversity than PC units, operate at competitive efficiencies, and, when coupled with a polishing SO2 scrubber, operate with emissions below the current levels mandated by federal standards. Compared to conventional PC technology, which was first utilized in the 1920s, CFB is a commercially proven technology that has been in reliable electric utility service in the United States for only the past 20 years.
By the late 1980s, the transition had been made from small industrial-sized CFB boilers to several operating electrical utility reheat boilers, ranging in size from 75 to 165 MW. Several reheat boilers of over 300 MW are currently in service, and boiler suppliers are offering boiler designs to provide steam generation sufficient to support up to 600 MW, but none has been built larger than 340 MW. Fuels for these applications range from petcoke and bituminous coal to high ash refuse from bituminous coal preparation and cleaning plants, and high moisture fuels such as lignite.
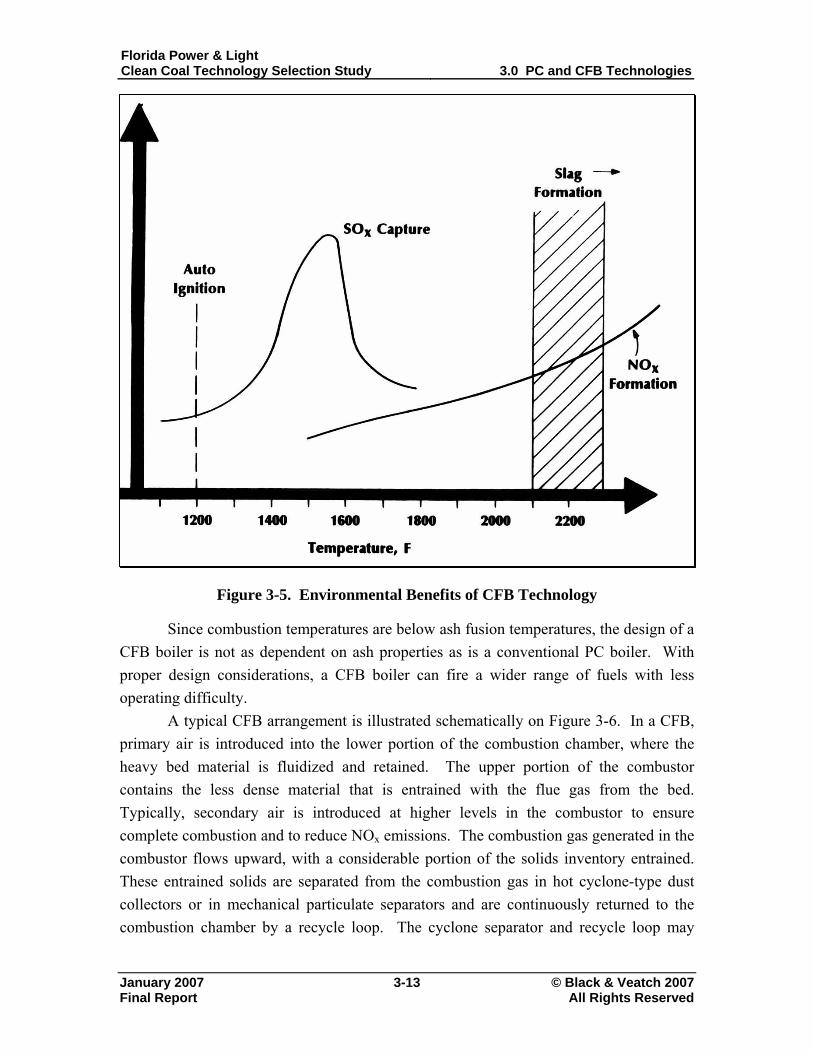
An environmentally attractive feature of CFB is that SO2 can be removed during the combustion process by adding limestone to the fluid bed. The CaO formed from the calcination of limestone reacts with SO2 to form calcium sulfate, which is removed from the flue gas with a conventional particulate removal device. The CFB combustion temperature is controlled at approximately 1,600º F, compared to approximately 2,500 to 3,000º F for conventional PC boilers. Combustion at the lower temperature has several benefits. First, the lower temperature minimizes the sorbent (typically limestone) requirement, because the required calcium to sulfur (Ca/S) molar ratio for a given SO2 removal efficiency is minimized in this temperature range. Second, 1,550 to 1,600º F is well below the ash fusion temperatures of most fuels, so the fuel ash never reaches its softening or melting points. The slagging and fouling problems that are characteristic of PC units are significantly reduced, if not eliminated. Finally, the lower temperature reduces NOx emissions by nearly eliminating thermal NOx. Figure 3-5 illustrates the benefits of the lower combustion temperature for CFBs.
Final Report All Rights Reserved
Florida Power & Light Clean Coal Technology Selection Study 3.0 PC and CFB Technologies
January 2007 3-13 © Black & Veatch 2007
Figure 3-5. Environmental Benefits of CFB Technology
Since combustion temperatures are below ash fusion temperatures, the design of a CFB boiler is not as dependent on ash properties as is a conventional PC boiler. With proper design considerations, a CFB boiler can fire a wider range of fuels with less operating difficulty.
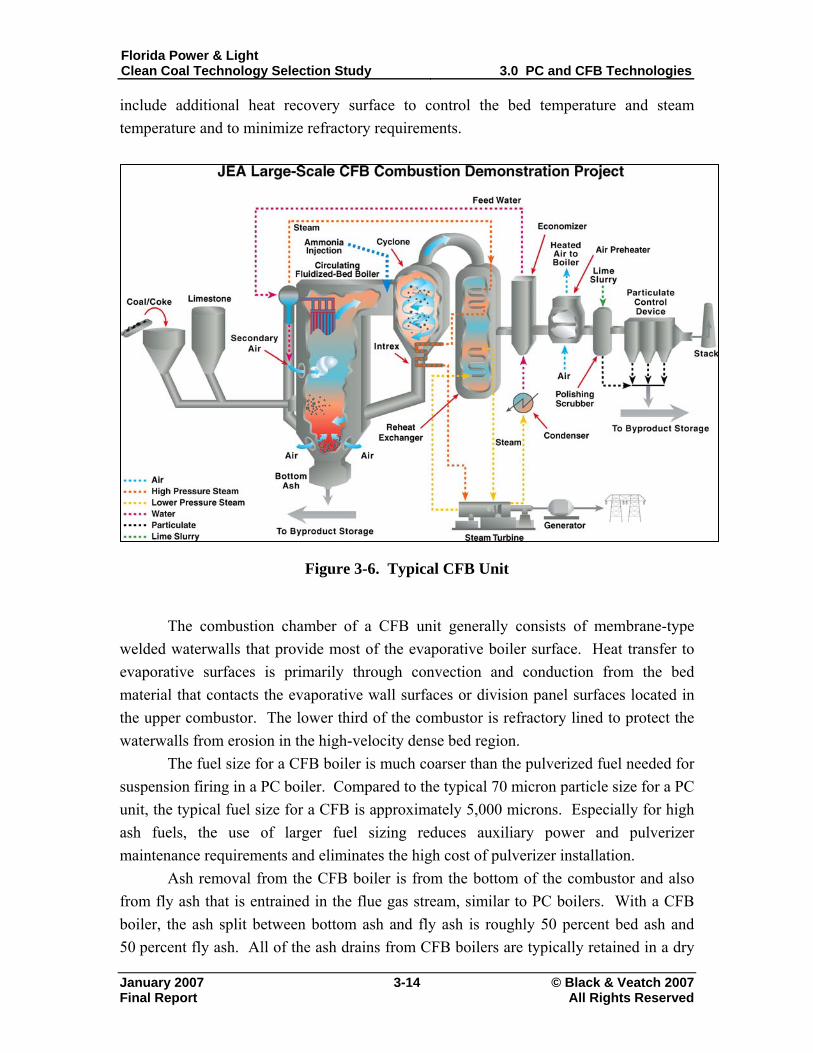
A typical CFB arrangement is illustrated schematically on Figure 3-6. In a CFB, primary air is introduced into the lower portion of the combustion chamber, where the heavy bed material is fluidized and retained. The upper portion of the combustor contains the less dense material that is entrained with the flue gas from the bed. Typically, secondary air is introduced at higher levels in the combustor to ensure complete combustion and to reduce NOx emissions. The combustion gas generated in the combustor flows upward, with a considerable portion of the solids inventory entrained. These entrained solids are separated from the combustion gas in hot cyclone-type dust collectors or in mechanical particulate separators and are continuously returned to the combustion chamber by a recycle loop. The cyclone separator and recycle loop may
Final Report All Rights Reserved
Florida Power & Light Clean Coal Technology Selection Study 3.0 PC and CFB Technologies
January 2007 3-14 © Black & Veatch 2007
include additional heat recovery surface to control the bed temperature and steam temperature and to minimize refractory requirements.
Figure 3-6. Typical CFB Unit
The combustion chamber of a CFB unit generally consists of membrane-type
welded waterwalls that provide most of the evaporative boiler surface. Heat transfer to evaporative surfaces is primarily through convection and conduction from the bed material that contacts the evaporative wall surfaces or division panel surfaces located in the upper combustor. The lower third of the combustor is refractory lined to protect the waterwalls from erosion in the high-velocity dense bed region.
The fuel size for a CFB boiler is much coarser than the pulverized fuel needed for suspension firing in a PC boiler. Compared to the typical 70 micron particle size for a PC unit, the typical fuel size for a CFB is approximately 5,000 microns. Especially for high ash fuels, the use of larger fuel sizing reduces auxiliary power and pulverizer maintenance requirements and eliminates the high cost of pulverizer installation.
Ash removal from the CFB boiler is from the bottom of the combustor and also from fly ash that is entrained in the flue gas stream, similar to PC boilers. With a CFB boiler, the ash split between bottom ash and fly ash is roughly 50 percent bed ash and 50 percent fly ash. All of the ash drains from CFB boilers are typically retained in a dry
Final Report All Rights Reserved
Florida Power & Light Clean Coal Technology Selection Study 3.0 PC and CFB Technologies
January 2007 3-15 © Black & Veatch 2007
condition without the need for water impounded hoppers or water submerged conveyors, typically utilized for PC boiler bottom ash collection and conveying.
3.4 Technical Characteristics of PC Versus CFB
The technical characteristics of the two competing boiler technologies were addressed in the previous section. Table 3-6 compares PC and CFB across several different parameters; these are summarized in the following subsections.
3.4.1 Environmental
Environmental impacts are categorized as flue gas emissions, solid waste production, and water consumption:
• Flue Gas Emissions--In the US, PC and CFB technologies will be required to meet similar emissions levels.
• Solid Waste Production--Solid waste production for the two technologies would be similar, except that the bottom ash from the PC boiler would be transported in a wetted condition because of the bottom ash collection technology, which includes either water impounded bottom ash hoppers or submerged conveyors below the furnace bottom. Bed ash extraction from a CFB is a dry process, where the ash is collected in a granular form and cooled with a combination of fluidizing cooling air and water jacketed screw coolers. The quantity of sorbent required for sulfur removal will affect the relative volume of solid waste.
• Water Consumption--Water consumption for the two technologies would be essentially identical for the boiler drum blowdown to maintain boiler water quality; however, when steam is used for soot blowing, the boiler water makeup requirements may be slightly higher because of the higher soot blowing steam demand of PC boiler technology.
Final Report All Rights Reserved
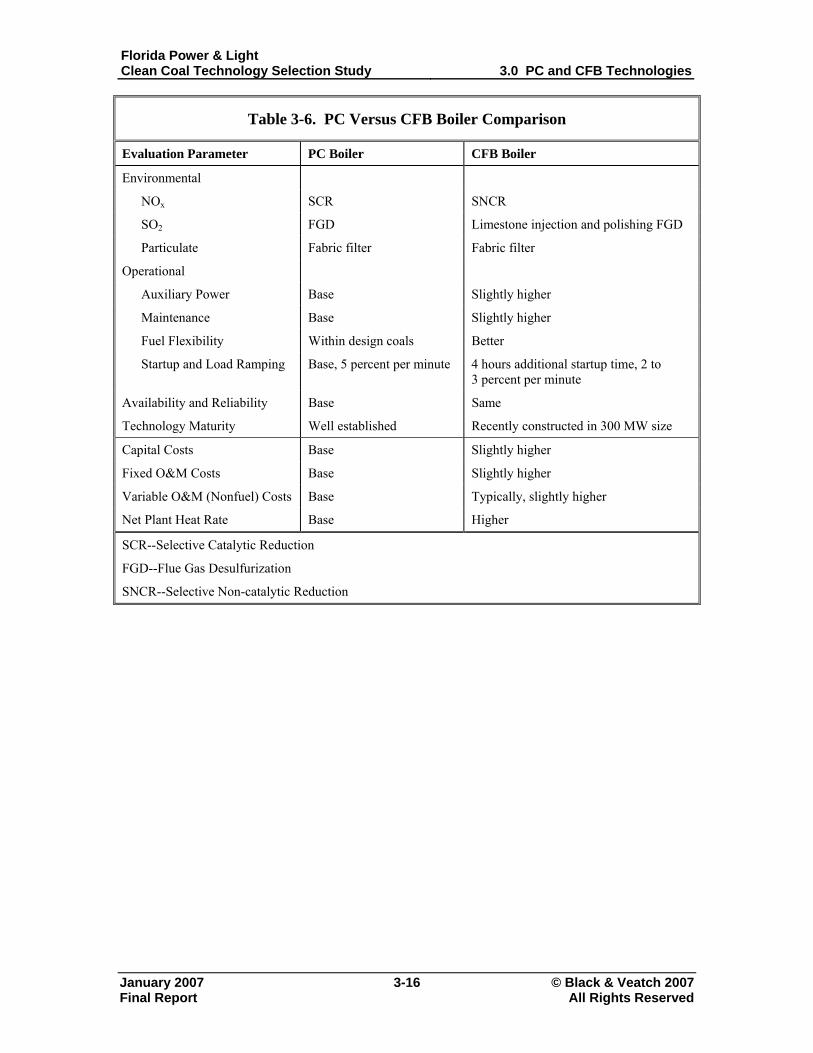
Florida Power & Light Clean Coal Technology Selection Study 3.0 PC and CFB Technologies
January 2007 3-16 © Black & Veatch 2007
Table 3-6. PC Versus CFB Boiler Comparison
Evaluation Parameter PC Boiler CFB Boiler
Environmental
NOx SCR SNCR
SO2 FGD Limestone injection and polishing FGD
Particulate Fabric filter Fabric filter
Operational
Auxiliary Power Base Slightly higher
Maintenance Base Slightly higher
Fuel Flexibility Within design coals Better
Startup and Load Ramping Base, 5 percent per minute 4 hours additional startup time, 2 to 3 percent per minute
Availability and Reliability Base Same
Technology Maturity Well established Recently constructed in 300 MW size
Capital Costs Base Slightly higher
Fixed O&M Costs Base Slightly higher
Variable O&M (Nonfuel) Costs Base Typically, slightly higher
Net Plant Heat Rate Base Higher
SCR--Selective Catalytic Reduction
FGD--Flue Gas Desulfurization
SNCR--Selective Non-catalytic Reduction
Final Report All Rights Reserved

Florida Power & Light Clean Coal Technology Selection Study 3.0 PC and CFB Technologies
January 2007 3-17 © Black & Veatch 2007
3.4.2 Operational Operational impacts are categorized as auxiliary power, maintenance, fuel
flexibility, startup, and load ramping: • Auxiliary Power--The power requirements of the primary air fans for the
CFB boiler provide the motive power to fluidize and circulate the bed material. This is a higher power requirement than that of the primary air fans for a PC boiler application. Since CFB boilers do not need pulverizers, the power savings from this normally results in the auxiliary power requirements for the two boiler technologies being relatively similar, with CFB requirements being slightly higher.
• Maintenance--The major maintenance requirements of CFB boilers involve the refractory repairs caused by the erosive effects of the bed materials circulating through the boiler components. Initial CFB boiler applications experienced significant refractory maintenance requirements. Subsequent refractory system improvements, materials, and installation techniques have provided significant reductions in these maintenance requirements. The major maintenance requirements of PC boilers and their auxiliaries are often associated with pulverizers, soot blowers, and associated heat transfer surface damage caused by soot blower erosion in areas where excessive soot blowing is needed to prevent the accumulation of agglomerating ash deposits. Unlike PC boilers, CFB boilers do not require pulverizers. In addition, CFB boilers require fewer soot blowers because the coal ash temperature is not elevated to the point where it becomes molten or agglomerating. The O&M cost of PC is slightly less than that of CFB.
• Fuel Flexibility--CFB boilers have the capability of superior fuel flexibility compared to PC boilers. Since the combustion temperature of CFB boilers is below the ash initial deformation temperature, the slagging and fouling characteristics of alternative fuels are not of concern. As long as the CFB boiler auxiliaries, such as fuel feed equipment and ash removal equipment, are provided with sufficient capacity, a wide range of fuel heating values and ash content can be utilized. The capacity of the sorbent feed equipment also needs to be designed for the range of fuel sulfur content that is expected to occur. Because of the long fuel residence time in the CFB boiler combustion loop, a very wide range of fuel volatile matter content can also be utilized. A CFB boiler can efficiently burn fuels in ranges of volatility well below those required in a PC boiler.
Final Report All Rights Reserved
Florida Power & Light Clean Coal Technology Selection Study 3.0 PC and CFB Technologies
January 2007 3-18 © Black & Veatch 2007
• Startup--Because of the large mass of bed material and larger quantity of refractory in a CFB boiler compared to a PC boiler, CFB boilers are somewhat less suited for numerous startups and cycling service than are PC boilers. The large mass of bed material results in significantly higher thermal inertia for a CFB boiler compared to a PC boiler. Startup from cold conditions can be extended for several hours. This higher thermal inertia can also result in unstable bed performance during periods of rapid load changes. Optimal sorbent feed for FGD is achieved during baseload operation, which enables consistent bed inventory, desulfurization, and sorbent utilization. CFB boilers have some advantages during hot and warm restarts, because the refractory and bed hold a significant amount of heat.
• Load Ramping--CFB boilers are generally capable of ramp rates of 2 to 3 percent per minute, but may be restricted to 1 to 2 percent per minute to control steam conditions, SO2 emissions, and limestone stoichiometry fluctuations. PC boilers are generally capable of ramp rates of 5 percent per minute.
3.4.3 Availability and Reliability
Over the past 20 years that CFB boilers have been utilized for steam production for electric power generation, the availability and reliability have improved and are considered to be generally equivalent to PC boilers. Several improvements in refractory system designs, fuel and sorbent feed system designs, and ash extraction equipment design have been made that adequately address the initial problems encountered with these system components. These systems are high maintenance and can cause lower overall availability of CFB compared to PC. Since CFB boiler systems do not have pulverizers, do not have multiple burner systems with a large number of moving or controlled components, and have significantly fewer soot blowers, many of the high maintenance components of PC boilers are avoided.
3.4.4 Technology Maturity
Though CFB boilers have been used to provide steam for reheat turbine electric power generation for more than 20 years, the steaming capacities have been limited to less than 150 MW in most cases. In recent years, manufacturers have increased unit size to the point where there are more reheat boilers in service supporting electrical generation up to 300 MW gross output, with the largest being 320 MW net. These units are currently in service or under construction and are designed to burn the full range of solid fuels including low volatile anthracite, petcoke, subbituminous coal, high volatile
Final Report All Rights Reserved
Florida Power & Light Clean Coal Technology Selection Study 3.0 PC and CFB Technologies
January 2007 3-19 © Black & Veatch 2007
bituminous coal, and high moisture lignite. CFB boiler manufacturers are currently proposing to supply units with capacities in excess of 400 MW electrical output. PC boilers have been installed and are operating with steaming capacities sufficient to support up to 1,300 MW of electrical generation. Because of the economies of scale for PC boiler and their auxiliaries, recent PC boiler installations have been predominantly larger than 250 MW. Many of the newer units have been designed to operate with supercritical steam pressure conditions.
3.5 FBC Experience in the United States
The first utility-grade AFBC unit was constructed in Rivesville, West Virginia, in 1976, a 30 MW (electric) Foster Wheeler BFB unit. One of the first utility-grade CFB units was the Tri-State Nucla project, completed in 1987. This 110 MW unit from Foster Wheeler was a Department of Energy (DOE) Clean Coal Demonstration Project. In the late 1980s and early to mid-1990s, a significant number of CFB units came online. In the early 1990s, the industry began to view CFB as a mature technology. The initial US CFB units were predominantly fired on bituminous coals. Around 1995, the trend reversed and almost all CFB units since that time have fired waste coals, lignites, or opportunity fuels such as petcoke and biomass. The field of international CFB vendors has consolidated to four dominating players: Alstom, Foster Wheeler, Lurgi, and Kvaerner Pulping. Alstom and Foster Wheeler have dominated the US and international markets for units above 150 MW. Lurgi does not actively market in the US.
CFB units have been increasing in size over the last 15 years, with the largest US operating CFB units at 300 MW (JEA Northside). The largest unit in operation is the ENEL Sulcis Unit in Sardinia, Italy. This Alstom unit is the equivalent of 340 MW, comprised of a 220 MW repowering unit along with additional process steam requirements.
Alstom, Foster Wheeler, and Lurgi have developed designs for single units in the 500 to 600 MW range. Alstom and Foster Wheeler have 600 MW designs, while Lurgi’s largest design is 500 MW.
3.6 Current PC and CFB Project Development
There are numerous PC and CFB project currently being developed in the United States. Most of these will employ subcritical and supercritical steam conditions. These projects have been identified by the National Energy Technology Laboratory and are also
Final Report All Rights Reserved
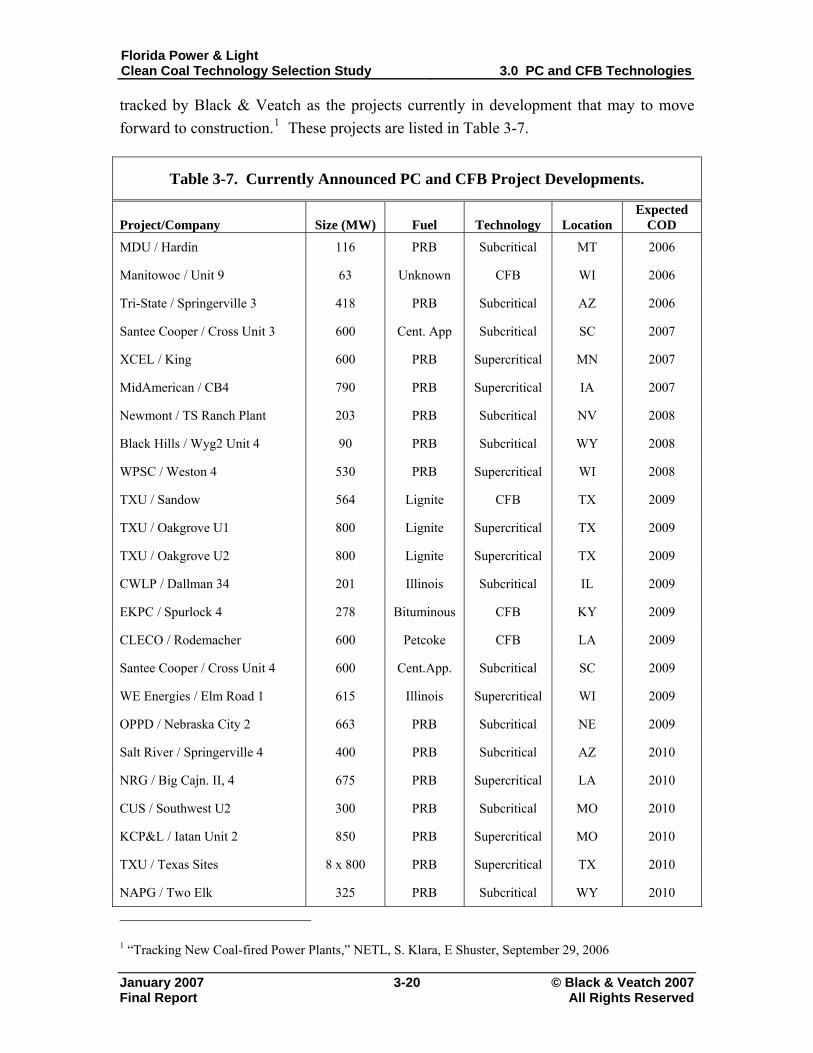
Florida Power & Light Clean Coal Technology Selection Study 3.0 PC and CFB Technologies
January 2007 3-20 © Black & Veatch 2007
tracked by Black & Veatch as the projects currently in development that may to move forward to construction.1 These projects are listed in Table 3-7.
Table 3-7. Currently Announced PC and CFB Project Developments.
Project/Company Size (MW) Fuel Technology Location Expected
COD
MDU / Hardin 116 PRB Subcritical MT 2006
Manitowoc / Unit 9 63 Unknown CFB WI 2006
Tri-State / Springerville 3 418 PRB Subcritical AZ 2006
Santee Cooper / Cross Unit 3 600 Cent. App Subcritical SC 2007
XCEL / King 600 PRB Supercritical MN 2007
MidAmerican / CB4 790 PRB Supercritical IA 2007
Newmont / TS Ranch Plant 203 PRB Subcritical NV 2008
Black Hills / Wyg2 Unit 4 90 PRB Subcritical WY 2008
WPSC / Weston 4 530 PRB Supercritical WI 2008
TXU / Sandow 564 Lignite CFB TX 2009
TXU / Oakgrove U1 800 Lignite Supercritical TX 2009
TXU / Oakgrove U2 800 Lignite Supercritical TX 2009
CWLP / Dallman 34 201 Illinois Subcritical IL 2009
EKPC / Spurlock 4 278 Bituminous CFB KY 2009
CLECO / Rodemacher 600 Petcoke CFB LA 2009
Santee Cooper / Cross Unit 4 600 Cent.App. Subcritical SC 2009
WE Energies / Elm Road 1 615 Illinois Supercritical WI 2009
OPPD / Nebraska City 2 663 PRB Subcritical NE 2009
Salt River / Springerville 4 400 PRB Subcritical AZ 2010
NRG / Big Cajn. II, 4 675 PRB Supercritical LA 2010
CUS / Southwest U2 300 PRB Subcritical MO 2010
KCP&L / Iatan Unit 2 850 PRB Supercritical MO 2010
TXU / Texas Sites 8 x 800 PRB Supercritical TX 2010
NAPG / Two Elk 325 PRB Subcritical WY 2010
1 “Tracking New Coal-fired Power Plants,” NETL, S. Klara, E Shuster, September 29, 2006
Final Report All Rights Reserved
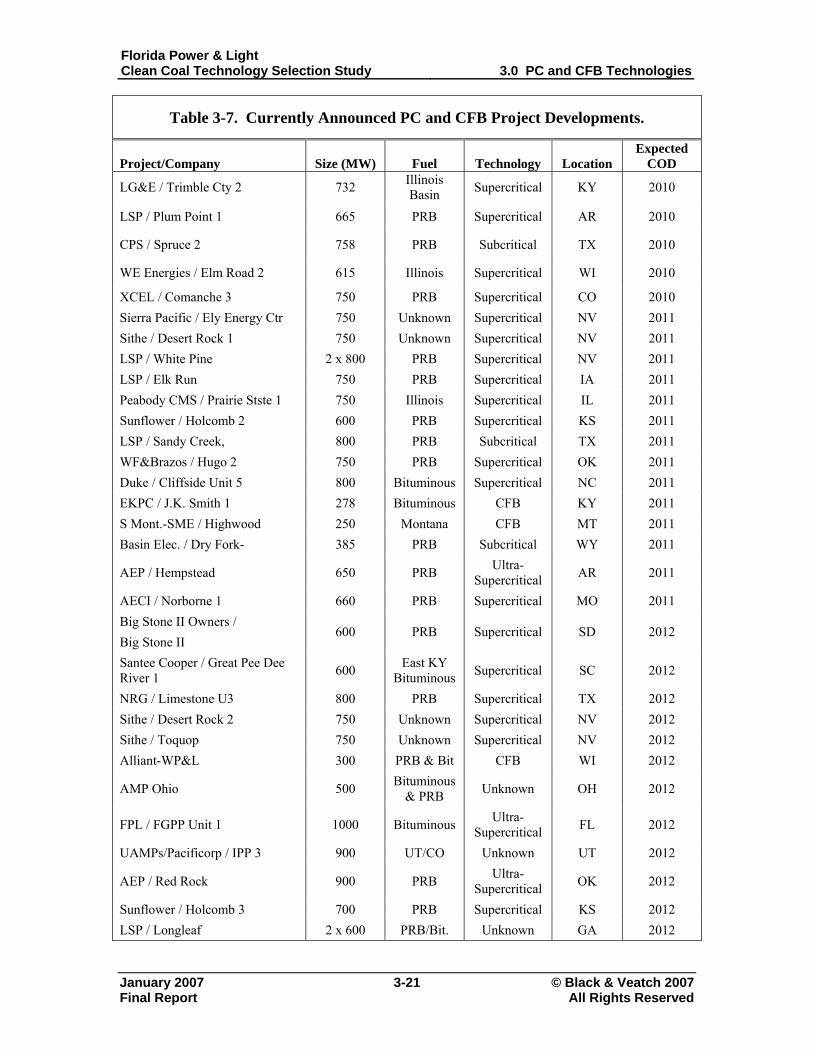
Florida Power & Light Clean Coal Technology Selection Study 3.0 PC and CFB Technologies
January 2007 3-21 © Black & Veatch 2007
Table 3-7. Currently Announced PC and CFB Project Developments.
Project/Company Size (MW) Fuel Technology Location Expected
COD
LG&E / Trimble Cty 2 732 Illinois Basin Supercritical KY 2010
LSP / Plum Point 1 665 PRB Supercritical AR 2010
CPS / Spruce 2 758 PRB Subcritical TX 2010
WE Energies / Elm Road 2 615 Illinois Supercritical WI 2010
XCEL / Comanche 3 750 PRB Supercritical CO 2010 Sierra Pacific / Ely Energy Ctr 750 Unknown Supercritical NV 2011 Sithe / Desert Rock 1 750 Unknown Supercritical NV 2011 LSP / White Pine 2 x 800 PRB Supercritical NV 2011 LSP / Elk Run 750 PRB Supercritical IA 2011 Peabody CMS / Prairie Stste 1 750 Illinois Supercritical IL 2011 Sunflower / Holcomb 2 600 PRB Supercritical KS 2011 LSP / Sandy Creek, 800 PRB Subcritical TX 2011 WF&Brazos / Hugo 2 750 PRB Supercritical OK 2011 Duke / Cliffside Unit 5 800 Bituminous Supercritical NC 2011 EKPC / J.K. Smith 1 278 Bituminous CFB KY 2011 S Mont.-SME / Highwood 250 Montana CFB MT 2011 Basin Elec. / Dry Fork- 385 PRB Subcritical WY 2011
AEP / Hempstead 650 PRB Ultra- Supercritical AR 2011
AECI / Norborne 1 660 PRB Supercritical MO 2011 Big Stone II Owners / Big Stone II
600 PRB Supercritical SD 2012
Santee Cooper / Great Pee Dee River 1 600 East KY
Bituminous Supercritical SC 2012
NRG / Limestone U3 800 PRB Supercritical TX 2012 Sithe / Desert Rock 2 750 Unknown Supercritical NV 2012 Sithe / Toquop 750 Unknown Supercritical NV 2012 Alliant-WP&L 300 PRB & Bit CFB WI 2012
AMP Ohio 500 Bituminous & PRB Unknown OH 2012
FPL / FGPP Unit 1 1000 Bituminous Ultra- Supercritical FL 2012
UAMPs/Pacificorp / IPP 3 900 UT/CO Unknown UT 2012
AEP / Red Rock 900 PRB Ultra- Supercritical OK 2012
Sunflower / Holcomb 3 700 PRB Supercritical KS 2012 LSP / Longleaf 2 x 600 PRB/Bit. Unknown GA 2012
Final Report All Rights Reserved
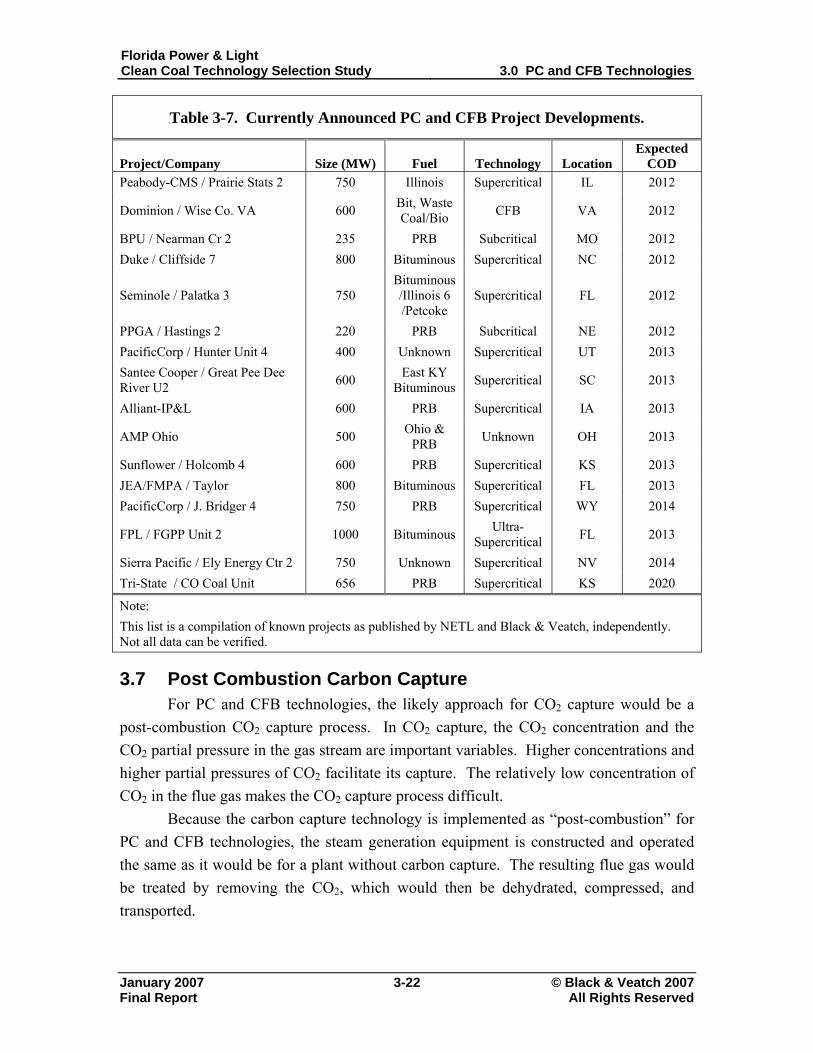
Florida Power & Light Clean Coal Technology Selection Study 3.0 PC and CFB Technologies
January 2007 3-22 © Black & Veatch 2007
Table 3-7. Currently Announced PC and CFB Project Developments.
Project/Company Size (MW) Fuel Technology Location Expected
COD Peabody-CMS / Prairie Stats 2 750 Illinois Supercritical IL 2012
Dominion / Wise Co. VA 600 Bit, Waste Coal/Bio CFB VA 2012
BPU / Nearman Cr 2 235 PRB Subcritical MO 2012 Duke / Cliffside 7 800 Bituminous Supercritical NC 2012
Seminole / Palatka 3 750 Bituminous/Illinois 6 /Petcoke
Supercritical FL 2012
PPGA / Hastings 2 220 PRB Subcritical NE 2012 PacificCorp / Hunter Unit 4 400 Unknown Supercritical UT 2013 Santee Cooper / Great Pee Dee River U2 600 East KY
Bituminous Supercritical SC 2013
Alliant-IP&L 600 PRB Supercritical IA 2013
AMP Ohio 500 Ohio & PRB Unknown OH 2013
Sunflower / Holcomb 4 600 PRB Supercritical KS 2013 JEA/FMPA / Taylor 800 Bituminous Supercritical FL 2013 PacificCorp / J. Bridger 4 750 PRB Supercritical WY 2014
FPL / FGPP Unit 2 1000 Bituminous Ultra-Supercritical FL 2013
Sierra Pacific / Ely Energy Ctr 2 750 Unknown Supercritical NV 2014 Tri-State / CO Coal Unit 656 PRB Supercritical KS 2020
Note: This list is a compilation of known projects as published by NETL and Black & Veatch, independently. Not all data can be verified. 3.7 Post Combustion Carbon Capture
For PC and CFB technologies, the likely approach for CO2 capture would be a post-combustion CO2 capture process. In CO2 capture, the CO2 concentration and the CO2 partial pressure in the gas stream are important variables. Higher concentrations and higher partial pressures of CO2 facilitate its capture. The relatively low concentration of CO2 in the flue gas makes the CO2 capture process difficult.
Because the carbon capture technology is implemented as “post-combustion” for PC and CFB technologies, the steam generation equipment is constructed and operated the same as it would be for a plant without carbon capture. The resulting flue gas would be treated by removing the CO2, which would then be dehydrated, compressed, and transported.
Final Report All Rights Reserved
Florida Power & Light Clean Coal Technology Selection Study 3.0 PC and CFB Technologies
January 2007 3-23 © Black & Veatch 2007
The addition of a carbon capture process would have a significant impact on the output and heat rate of a PC or CFB facility. Significantly higher auxiliary loads are required for additional pumps, fans, and miscellaneous loads in the capture process, and thermal energy in the form of process steam is required to separate the CO2 from the absorption solvent. Energy would also be required for captured CO2 compression. These energy requirements would have an impact on the net plant output and net plant heat rate of the facility. In order to maintain project required net plant output, additional generation capacity would need to be installed to compensate for the increased auxiliary loads of the carbon capture process. The increase in gross plant generation would meet the carbon capture process energy requirements.
Typically, CO2 capture from the flue gas of a post-combustion process for a conventional coal technology plant has been thought to employ absorption using mono-ethanol amine (MEA), a chemical solvent that is commercially available and widely used. The CO2 capture plant would consist of flue gas preparation, CO2 absorption, CO2 stripping, and CO2 compression.
For an MEA CO2 capture process, an auxiliary load in the range of 20 to 30 percent of gross plant output can be expected which would require additional capacity of 30 to 40 of gross plant output in order to maintain project required net capacity. The capital requirements for CO2 capture addition would need to include both the CO2 capture equipment and the capital required for additional capacity.
A new and developing alternative to the MEA CO2 capture process is a chilled ammonia CO2 absorption process, currently under development by Alstom. Compared to the MEA absorption process, the chilled ammonia absorption process appears to have the potential to significantly reduce the energy and capital requirements to achieve post-combustion CO2 capture. A schematic of this process is shown in Figure 3-7. The description provided here is based on data presented in a position paper published by Alstom.1
For a CO2 capture process employing Alstom’s chilled ammonia absorption, the flow would begin at the flue gas discharge from the plant FGD. First, the flue gas would be cooled from a typical FGD exit temperature of 120 to 140° F to approximately 35° F. Flue gas cooling can be achieved by cooling towers and mechanical chillers. The power consumed by the cooling process is estimated by Alstom to consume one to two percent of the gross plant output. Reducing the temperature of the flue gas would have the effect of condensing out saturated water in the flue gas introduced by the FGD and any residual contaminants remaining in the flue gas. In addition, cooling the flue gas to a lower
1 “Chilled Ammonia Process for CO2 Capture,” Alstom, November 2006.
Final Report All Rights Reserved
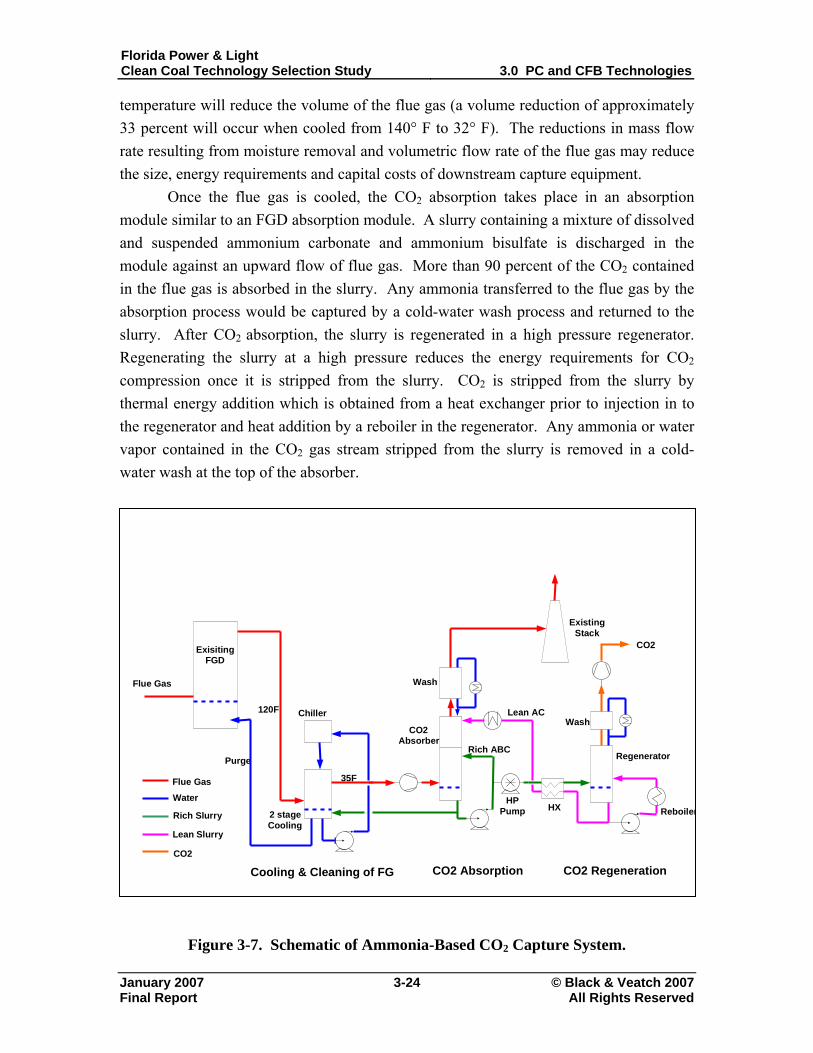
Florida Power & Light Clean Coal Technology Selection Study 3.0 PC and CFB Technologies
January 2007 3-24 © Black & Veatch 2007
temperature will reduce the volume of the flue gas (a volume reduction of approximately 33 percent will occur when cooled from 140° F to 32° F). The reductions in mass flow rate resulting from moisture removal and volumetric flow rate of the flue gas may reduce the size, energy requirements and capital costs of downstream capture equipment.
Once the flue gas is cooled, the CO2 absorption takes place in an absorption module similar to an FGD absorption module. A slurry containing a mixture of dissolved and suspended ammonium carbonate and ammonium bisulfate is discharged in the module against an upward flow of flue gas. More than 90 percent of the CO2 contained in the flue gas is absorbed in the slurry. Any ammonia transferred to the flue gas by the absorption process would be captured by a cold-water wash process and returned to the slurry. After CO2 absorption, the slurry is regenerated in a high pressure regenerator. Regenerating the slurry at a high pressure reduces the energy requirements for CO2 compression once it is stripped from the slurry. CO2 is stripped from the slurry by thermal energy addition which is obtained from a heat exchanger prior to injection in to the regenerator and heat addition by a reboiler in the regenerator. Any ammonia or water vapor contained in the CO2 gas stream stripped from the slurry is removed in a cold-water wash at the top of the absorber.
Exisiting FGD
Existing Stack
2 stage Cooling
Chiller CO2
AbsorberRegenerator
HX
CO2
HPPump
Wash
Wash
Reboiler
Flue Gas Water Rich Slurry Lean Slurry CO2
Flue Gas
Purge
Lean AC
Rich ABC
120F
35F
Cooling & Cleaning of FG CO2 Absorption CO2 Regeneration
Figure 3-7. Schematic of Ammonia-Based CO2 Capture System.
Final Report All Rights Reserved
Florida Power & Light Clean Coal Technology Selection Study 3.0 PC and CFB Technologies
January 2007 3-25 © Black & Veatch 2007
The primary advantage of the Alstom chilled ammonia CO2 absorption process
compared to MEA is the reduced operating energy requirements and capture costs. In a reference study prepared by Alstom comparing their ammonia absorption process to an MEA absorption process, the ammonia absorption process had a significantly reduced affect on net plant output and net plant heat rate. In addition, the cost of capture in dollar per avoided ton of CO2 was less than half that expected with MEA.
Alstom’s chilled ammonia CO2 absorption process is still in development. Alstom projects the offering of a commercial product before the end of 2011. An Alstom press release dated October 2, 2006, announced a collaborative project between Alstom, the Electric Power Research Institute (EPRI) and We Energies to build a 5 MW pilot plant that will demonstrate the CO2 capture process. The facility will be constructed at a power plant owned by We Energies in Pleasant Prairie, Wisconsin and is expected to be commissioned in mid-2007. The demonstration facility will give Alstom and EPRI the opportunity to evaluate the process on a larger commercial scale moving from bench scale testing.
Final Report All Rights Reserved
Florida Power & Light Clean Coal Technology Selection Study
4.0 IGCC Technologies and Industry Activity
January 2007 4-1 © Black & Veatch 2007
4.0 IGCC Technologies and Industry Activity
This section contains a summary-level description of IGCC technologies, including a review of IGCC experience and a discussion of the issues related to commercializing the technology.
Reliability is expected to be lower for an IGCC plant than for a PC or CFB plant with respect to producing electricity from coal. IGCC plants without spare gasifiers are expected to achieve long-term annual availabilities in the 80 to 85 percent range on coal versus approximately 90 percent for PC and CFB. IGCC availability on coal during initial startup and the first several years of operation is expected to be significantly lower. A generation plant that uses IGCC technology could increase the availability by firing the combined cycle portion of the plant on a backup fuel such as natural gas when syngas is not available from coal gasification. The cost, availability, and air emissions of backup fuel firing may limit or prevent its use. Currently, natural gas is not available at FGPP. The installation of a relatively long natural gas pipeline would be required if natural gas were to be used as a backup fuel. Large capital cost would be required for the installation of a natural gas pipeline to FGPP. Additional capital would also be required for the installation all associated equipment required to operate the combined cycle on natural gas. These large capital requirements would not be justified by the incremental benefit of increased plant availability with higher cost natural gas as a backup fuel. Because of this, the use of natural gas as a backup fuel for an IGCC plant at FGPP would not be economically feasible. Likewise, using fuel oil as a backup fuel to enhance syngas production reliability would also be prohibitively expensive and logistically cumbersome.
Cost, schedule, and plant availability issues cause IGCC projects to have higher financial risk than conventional PC or CFB power generation projects. Details regarding the guarantee levels for cost, schedule, and performance; the associated liquidated damages clauses and risk premium; and availability assurances are not well defined at this time. It is expected that the standards for contractual arrangements between owners and constructors will evolve based on the experiences of the next generation of IGCC project development.
4.1 Gasification Technologies and Suppliers Gasification is a mature technology with a history that dates back to the 1800s. The first patent was granted to Lurgi GmbH in Germany in 1887. By 1930, coal gasification had become widespread and in the 1940s, commercial coal gasification was used to provide “town” gas for streetlights in both Europe and the United States. Currently, there are four main types of gasifiers:
Final Report All Rights Reserved
Florida Power & Light Clean Coal Technology Selection Study
4.0 IGCC Technologies and Industry Activity
January 2007 4-2 © Black & Veatch 2007
• Entrained flow • Fixed bed • Fluidized bed • Transport bed
The following listing includes the most notable technology suppliers by type: • Entrained Flow Gasifiers:
– ConocoPhillips (COP) (E-Gas, formerly Global Energy, originally Dow-Destec).
– General Electric (GE) (formerly ChevronTexaco, originally Texaco).
– Mitsubishi Heavy Industries (MHI). – Shell. – Siemens GSP (formerly Noell).
• Fixed Bed (or Moving Bed) Gasifiers: – BGL (slagging, Global Energy, formerly British Gas Lurgi). – Lurgi (dry bottom).
• Fluidized Bed Gasifiers: – Carbona (formerly Tampella). – HTW (formerly High Temperature Winkler). – KRW. – Lurgi.
• Transport Bed Gasifiers: – KBR.
Entrained flow gasifiers have been operating on oil feedstock since the 1950s and on coal and petcoke feedstock since the 1980s. Entrained flow gasifiers operate at high pressure and temperature, have very low fuel residence times, and have high feedstock capacity throughputs. Fixed bed gasifiers have operated on coal feedstock since the 1940s. Compared to entrained flow gasifiers, fixed bed gasifiers operate at lower pressure and temperature, have much longer fuel residence times, and have lower capacity throughputs. Fluidized bed gasifiers have operated on coal since the 1920s. Compared to entrained flow gasifiers, fluidized bed gasifiers operate at lower pressure and temperature, use air instead of oxygen, have longer fuel residence times, and have lower capacity throughput. Transport bed gasifiers have only recently been tested on a small scale. Compared to entrained flow gasifiers, transport gasifiers operate at lower pressure and temperature, use air instead of oxygen, have longer fuel residence times, and have lower capacity throughput.
Final Report All Rights Reserved

Florida Power & Light Clean Coal Technology Selection Study
4.0 IGCC Technologies and Industry Activity
January 2007 4-3 © Black & Veatch 2007
Limestone is fed with coal to fluidized bed and transport bed gasifiers for capturing sulfur as calcium sulfide (CaS), which is typically oxidized to CaSO4 for landfill disposal. Entrained flow and fixed bed gasifiers treat the syngas from gasification to remove the sulfur-containing constituents as elemental sulfur or sulfuric acid (H2SO4), which can be sold. The ash from fluidized bed, transport bed, and dry bottom fixed bed gasifiers is leachable and is typically landfilled. Entrained flow and slagging fixed bed gasifiers operate above the ash fusion temperature and produce a nonleachable slag that can be sold. Entrained flow and fixed bed gasifiers generally use high purity oxygen as the oxidant. Fluidized bed and transport gasifiers use air instead of oxygen. Since high purity oxygen does not contain the large concentration of nitrogen present in air, equipment size can be reduced commensurately. Higher gasifier operating pressures are also more economical for the smaller gas flow rates and equipment size associated with high purity oxygen use. Entrained flow gasifiers have higher operating temperatures and lower residence times than fluidized and transport bed gasifiers. These conditions typically require the use of high purity oxygen for entrained flow gasifiers. An oxygen purity of 95 percent by volume is the optimum for entrained flow gasifiers producing syngas for combustion turbine fuel. Oxygen purities of 98 percent or higher are required when the syngas is used to produce chemicals and liquid fuels. Entrained flow gasifiers are relatively new technologies compared to fluidized bed and fixed bed gasifiers. Entrained flow gasifiers have been operating successfully on solid fuels since the mid-1980s to produce chemicals and since the mid-1990s to produce electricity in four commercial-scale IGCC demonstration plants, located in Europe (two units) and the US (two units).
Transport bed gasification technology is a recent development that has not yet been demonstrated on a commercial scale. The Southern Company and KBR have been testing a 30 tpd air-blown transport reactor integrated gasification (TRIG) system at the US DOE-funded Power Systems Development Facility (PSDF) at Wilsonville, Alabama. TRIG employs KBR catalytic cracking technology, which has been used successfully for more than 50 years in the petroleum refining industry. In 2004, the US DOE awarded $235 million to the Southern Company and the Orlando Utilities Commission (OUC) to build a 285 MW IGCC Plant at the Stanton Energy Center in Florida to demonstrate TRIG combined cycle technology under the Clean Coal Power Initiative (CCPI) program. The total cost of this plant is estimated to be $792 million. The proposed plant will gasify subbituminous coal. Southern Company estimates that the plant heat rate will be
Final Report All Rights Reserved
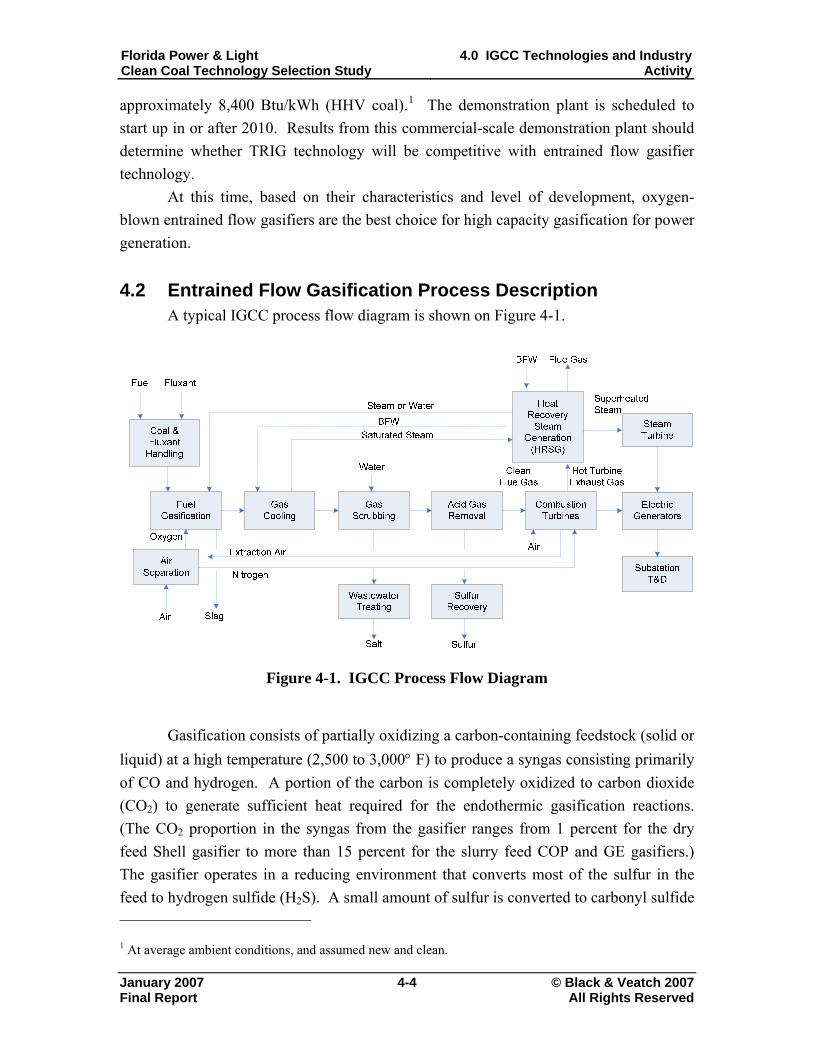
Florida Power & Light Clean Coal Technology Selection Study
4.0 IGCC Technologies and Industry Activity
January 2007 4-4 © Black & Veatch 2007
approximately 8,400 Btu/kWh (HHV coal).1 The demonstration plant is scheduled to start up in or after 2010. Results from this commercial-scale demonstration plant should determine whether TRIG technology will be competitive with entrained flow gasifier technology.
At this time, based on their characteristics and level of development, oxygen-blown entrained flow gasifiers are the best choice for high capacity gasification for power generation.
4.2 Entrained Flow Gasification Process Description A typical IGCC process flow diagram is shown on Figure 4-1.
Figure 4-1. IGCC Process Flow Diagram
Gasification consists of partially oxidizing a carbon-containing feedstock (solid or
liquid) at a high temperature (2,500 to 3,000° F) to produce a syngas consisting primarily of CO and hydrogen. A portion of the carbon is completely oxidized to carbon dioxide (CO2) to generate sufficient heat required for the endothermic gasification reactions. (The CO2 proportion in the syngas from the gasifier ranges from 1 percent for the dry feed Shell gasifier to more than 15 percent for the slurry feed COP and GE gasifiers.) The gasifier operates in a reducing environment that converts most of the sulfur in the feed to hydrogen sulfide (H2S). A small amount of sulfur is converted to carbonyl sulfide 1 At average ambient conditions, and assumed new and clean.
Final Report All Rights Reserved
Florida Power & Light Clean Coal Technology Selection Study
4.0 IGCC Technologies and Industry Activity
January 2007 4-5 © Black & Veatch 2007
(COS). Some sulfur remains in the ash, which is melted and then quenched to produce slag. Other minor syngas constituents include ammonia (NH3), hydrogen cyanide (HCN), hydrogen chloride (HCl), and entrained ash, which contains unconverted carbon. In IGCC applications, the minimum gasifier pressure is typically 450 to 550 psia. This pressure is determined by the combustion turbine syngas supply pressure requirements. GE gasifiers operate at higher pressures, up to 1,000 psia, and the excess syngas pressure is let down in an expander to produce additional power.
A fluxant may need to be fed with the coal to control the slag viscosity so that it will flow out of the gasifier. Fluxant addition is less than 2 percent of the coal feed. The fluxant can be limestone, PC boiler ash, or, in some cases, dirt. The required fluxant composition and proportion will vary with the coal feed composition. The gasification process operators must know the feed coal composition and make fluxant adjustments when the coal composition changes. Too little fluxant can allow excessive slag to accumulate in the gasifier, which could damage the refractory and eventually choke the gasifier. Too much fluxant can produce long cylindrical slag particles instead of small slag granules when the slag is quenched in the lockhopper. These long thin slag particles will plug up the slag lockhopper. Solid fuel feeds to the gasifier can be dry or slurried. Solid fuels slurried in water do not require the addition of steam for temperature moderation. While slurries typically use water, oil can also be used. Steam is added to the oxygen as a temperature moderator for dry solid feed gasifiers, solid feeds slurried in oil, and oil feed gasifiers.
Entrained flow gasifiers use oxygen to produce syngas heating values in the range of 250 to 300 Btu/scf on an HHV basis1. Oxygen is produced cryogenically by compressing air, cooling and drying the air, removing CO2 from the air, chilling the feed air with product oxygen and nitrogen, reducing the air pressure to provide autorefrigeration and liquefy the air at -300° F, and separating the liquid oxygen and liquid nitrogen by distillation. Air compression consumes a significant amount of power, between 13 and 17 percent of the IGCC gross power output. Hydrogen in syngas prevents the use of dry low NOx (DLN) combustors in the combustion turbines. The dilution of the syngas to reduce flame temperature is required for NOx control. Syngas is typically diluted by adding water vapor and/or nitrogen. Water vapor can be added to the syngas by evaporating water using low level heat. Nitrogen can be added by compressing excess nitrogen from the air separation unit (ASU) and adding it to the syngas either upstream of the combustion turbine or by injection into the combustion turbine. Syngas dilution for NOx control increases the mass
1 Comparatively, pipeline quality natural gas has a heating content of about 950 to 1,000 Btu/scf (HHV).
Final Report All Rights Reserved
Florida Power & Light Clean Coal Technology Selection Study
4.0 IGCC Technologies and Industry Activity
January 2007 4-6 © Black & Veatch 2007
flow through the combustion turbine, which also increases power output. GE combustion turbines inject this diluent nitrogen separately from the syngas into the same ports used for steam or water injection. For MHI and Siemens Power Generation (SPG – formerly known as Siemens Westinghouse or SW) combustion turbines, diluent nitrogen is premixed with the syngas. The nitrogen supply pressure required for injection into a GE 7FB is 405 psia versus 450 to 500 psia for mixing with the syngas for the MHI 501F and the SPG SGT6-5000F (previously referred to as the SW 501FD). The diluted syngas has a heat content of 140 to 150 Btu/scf. However, the mass flow of the diluted syngas is eight times that of natural gas, which increases the combustion turbine power output by up to 16 percent, when no air is extracted for the ASU. A portion of the combustion turbine compressed air may be extracted for feed to the ASU. The ASU and combined cycle are integrated by the nitrogen and air exchanges. Extracting compressed air from the combustion turbine improves overall efficiency, but it adds complexity to the process, including longer startup periods, if there is no separate source of startup compressed air. The prevailing thought is to minimize or avoid compressed air integration. The raw hot syngas is cooled by the boiler feedwater from the HRSG to a temperature suitable for cleaning. The syngas cooling process generates steam. The steam quantities and pressures vary with the gasification process design. Gasification steam is subsequently integrated into the steam cycle. Before the raw syngas enters the combustion turbine combustor, the H2S, COS, NH3, HCN, and particulates must be removed. Cooled syngas is scrubbed to remove NH3, water soluble salts, and particulates. Syngas may also be filtered to remove additional particulates. COS in the syngas is hydrolyzed by a catalyst to H2S, which is removed from the syngas by absorption in a solvent. This absorption process is called acid gas removal (AGR).
Syngas is filtered in ceramic candle filters at the Buggenum and Puertollano IGCC plants. At the Wabash IGCC plant, syngas was initially filtered in ceramic candle filters; later, the filter elements (candles) were changed to sintered metal. The syngas filters at the Buggenum, Puertollano, and Wabash plants are located upstream of the AGR. At the Polk County IGCC plant, syngas is filtered in cartridge filters downstream from the AGR. The H2S that is removed from the syngas by absorption in a solvent is desorbed as a concentrated acid gas when the solvent is regenerated, by lowering its pressure and increasing its temperature. Descriptions of commercial AGR systems are provided in Section 4.9. The acid gas stream is typically converted to elemental sulfur in the Claus sulfur recovery process, although it is also possible to produce sulfuric acid.. The primary chemical reaction in the Claus process is the reaction of H2S and SO2 to produce
Final Report All Rights Reserved
Florida Power & Light Clean Coal Technology Selection Study
4.0 IGCC Technologies and Industry Activity
January 2007 4-7 © Black & Veatch 2007
elemental sulfur and water. This reaction requires a catalyst and is performed in two stages. The SO2 is produced by oxidizing (burning) one third of the H2S in the feed gas. External fuel is only needed to initially heat up the Claus thermal reactor and initiate combustion of the acid gas. Under normal operation, the oxidation of H2S provides sufficient heat to maintain the reaction. The sulfur is formed as a vapor; the S2 form of sulfur reacts with itself to produce S6 and S8, which are subsequently condensed. This condensed liquid sulfur is separated from the residual gas and stored in a pit at 275° to 300° F. As required, the liquid sulfur is pumped from the pit to railcars for shipment. Solid sulfur can be produced in blocks or pellets by cooling the liquid sulfur to ambient temperature. The residual (tail gas) is primarily CO2 and nitrogen, which are compressed and reinjected into the syngas upstream of the AGR. 4.3 Gasification Technology Suppliers Today, there are three major entrained flow coal gasification technology suppliers:
• COP, which licenses E-Gas technology that was developed by Dow. COP purchased this technology from Global Energy in August 2003.
• GE, which purchased Texaco gasification technology from ChevronTexaco in June 2004. GE offers both Quench and Radiant (high temperature heat recovery [HTHR]) cooler gasifiers.
• Shell, which developed its gasification technology in conjunction with Prenflo. Prenflo technology is no longer licensed.
The other entrained flow gasifiers listed in Section 4.1 are not currently strong
competitors in the utility-scale IGCC market because of the relative maturity of the technology. MHI is developing an air-blown, two-stage entrained flow gasifier with dry feed. MHI intends to demonstrate this technology at a 250 MW project in Japan. Siemens (formerly Sustec GSP, FutureEnergy, and Noell) has one small gasification plant (Schwarze Pumpe, 200 MWth methanol and power cogeneration). Its technology has been geared toward biomass and industrial processing on a smaller scale, but it seems to be making an entry into the utility-scale power generation market. According to a May 2006 press release, Siemens plans to build a 1,000 MW coal IGCC in Germany as a first step to commercializing its newly acquired IGCC technology. Multiple other GSP coal gasification projects are currently being implemented, including three in China that wil produce ammonia and methanol. The COP and GE gasifiers are refractory lined with coal-water slurry feed. In the late 1970s, Shell and Krupp-Koppers jointly developed a waterwall type gasifier with
Final Report All Rights Reserved

Florida Power & Light Clean Coal Technology Selection Study
4.0 IGCC Technologies and Industry Activity
January 2007 4-8 © Black & Veatch 2007
dry, pulverized coal feed specifically for IGCC power generation for a 150 ltpd demonstration plant near Hamburg, West Germany. During the 1990s, Shell and Krupp-Koppers licensed their gasification technology separately. The Puertollano, Spain IGCC plant, which was built in the mid-1990s, uses Krupp-Kopper’s Prenflo gasification technology. In the late 1990s, Krupp-Koppers merged with Uhde, and Uhde reached an agreement with Shell to license Shell gasification technology and no longer market the Prenflo gasification process. Uhde has incorporated its Prenflo experience into Shell’s coal gasification process technology. Each of the three commercial, entrained flow coal gasification technologies generates similar syngas products. All three gasifiers react the coal with oxygen at high pressure and temperature to produce a syngas consisting primarily of hydrogen and CO. The raw syngas from the gasifier also contains CO2, water, H2S, COS, NH3, HCN, and other trace impurities. The syngas exits the gasifier reactor at approximately 2,500 to 2,900° F. Each of the COP, GE, and Shell gasification processes cools the hot syngas from the gasifier reactor differently. In the COP process, the hot syngas is partially quenched with coal slurry, resulting in a second stage of coal gasification. The raw syngas from the COP gasifier may also contain methane and products of coal devolatilization and pyrolysis because of its two-stage gasification process. The partially quenched syngas is cooled with recycled syngas to solidify the molten fly slag and then further cooled to produce HP steam in a vertical shell and tube heat exchanger. (Syngas flow is down through the tubes. Boiler water and steam flow is up through the shell side.) Unconverted coal is filtered from the cooled syngas and recycled to the gasifier first stage. GE has two methods for cooling the hot syngas from the gasifier: radiant cooling to produce HP steam via HTHR and water quench with low-pressure (LP) steam generation. In the Shell process, hot syngas is cooled with recycled syngas to solidify the molten fly slag and then further cooled in a convective cooler to produce high-temperature steam. The cooled, raw syngas is cleaned by various treatments, including filtration, scrubbing with water, catalytic conversion, and scrubbing with solvents, as discussed in Section 4.9. The clean syngas that is used as combustion turbine fuel contains hydrogen, CO, CO2, water, and parts per million (ppm) concentrations of H2S and COS. 4.4 Gasifier Technology Selection Table 4-1 provides process design characteristic data for the COP, GE, and Shell gasification technologies for systems that would generally be considered for a facility of this size and type. The Shell gasification technology has the highest cold gas efficiency,
Final Report All Rights Reserved
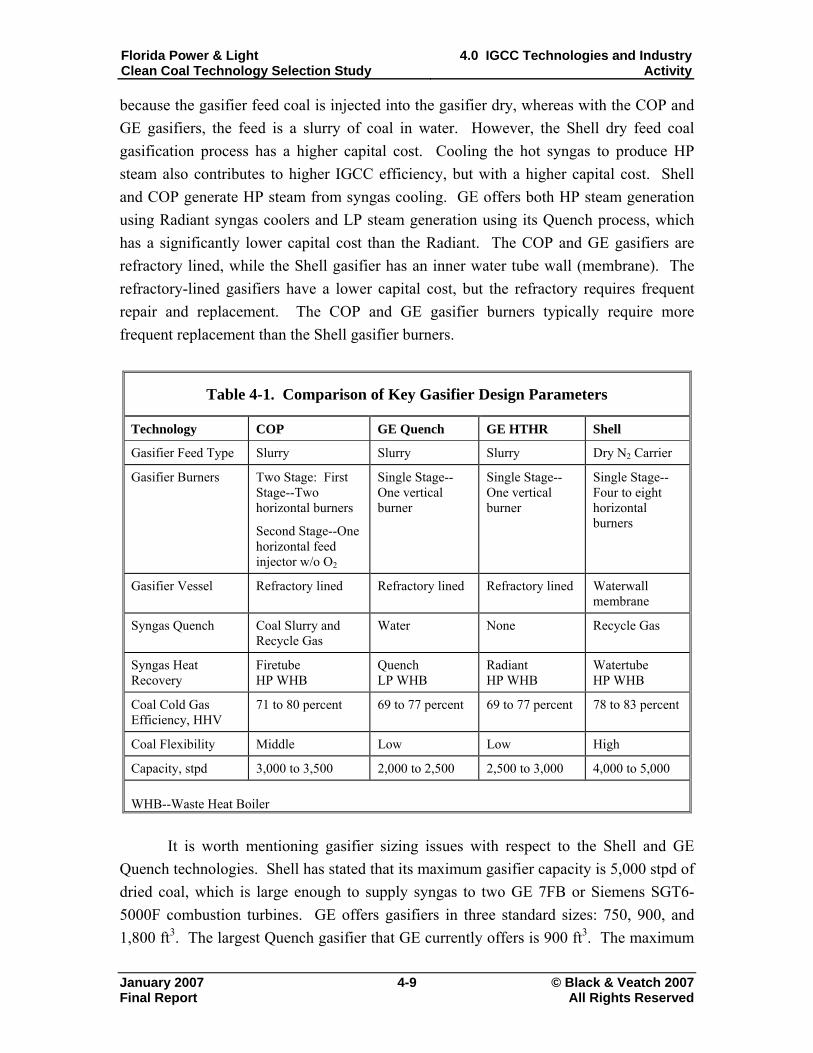
Florida Power & Light Clean Coal Technology Selection Study
4.0 IGCC Technologies and Industry Activity
January 2007 4-9 © Black & Veatch 2007
because the gasifier feed coal is injected into the gasifier dry, whereas with the COP and GE gasifiers, the feed is a slurry of coal in water. However, the Shell dry feed coal gasification process has a higher capital cost. Cooling the hot syngas to produce HP steam also contributes to higher IGCC efficiency, but with a higher capital cost. Shell and COP generate HP steam from syngas cooling. GE offers both HP steam generation using Radiant syngas coolers and LP steam generation using its Quench process, which has a significantly lower capital cost than the Radiant. The COP and GE gasifiers are refractory lined, while the Shell gasifier has an inner water tube wall (membrane). The refractory-lined gasifiers have a lower capital cost, but the refractory requires frequent repair and replacement. The COP and GE gasifier burners typically require more frequent replacement than the Shell gasifier burners.
Table 4-1. Comparison of Key Gasifier Design Parameters
Technology COP GE Quench GE HTHR Shell
Gasifier Feed Type Slurry Slurry Slurry Dry N2 Carrier
Gasifier Burners Two Stage: First Stage--Two horizontal burners
Second Stage--One horizontal feed injector w/o O2
Single Stage--One vertical burner
Single Stage--One vertical burner
Single Stage--Four to eight horizontal burners
Gasifier Vessel Refractory lined Refractory lined Refractory lined Waterwall membrane
Syngas Quench Coal Slurry and Recycle Gas
Water None Recycle Gas
Syngas Heat Recovery
Firetube HP WHB
Quench LP WHB
Radiant HP WHB
Watertube HP WHB
Coal Cold Gas Efficiency, HHV
71 to 80 percent 69 to 77 percent 69 to 77 percent 78 to 83 percent
Coal Flexibility Middle Low Low High
Capacity, stpd 3,000 to 3,500 2,000 to 2,500 2,500 to 3,000 4,000 to 5,000 WHB--Waste Heat Boiler
It is worth mentioning gasifier sizing issues with respect to the Shell and GE
Quench technologies. Shell has stated that its maximum gasifier capacity is 5,000 stpd of dried coal, which is large enough to supply syngas to two GE 7FB or Siemens SGT6-5000F combustion turbines. GE offers gasifiers in three standard sizes: 750, 900, and 1,800 ft3. The largest Quench gasifier that GE currently offers is 900 ft3. The maximum
Final Report All Rights Reserved
Florida Power & Light Clean Coal Technology Selection Study
4.0 IGCC Technologies and Industry Activity
January 2007 4-10 © Black & Veatch 2007
capacity of this gasifier is approximately 2,500 tpd of as-received coal and does not produce enough syngas for a GE 7FB or Siemens SGT6-5000F combustion turbine. The largest Radiant gasifier that GE currently offers is 1,800 ft3, which will supply sufficient syngas for a GE 7FB or Siemens SGT6-5000F combustion turbine. COP currently offers a gasifier that will supply sufficient syngas for a GE 7FB or Siemens SGT6-5000F combustion turbine.
Overall, energy conversion efficiencies for IGCC plants vary with the gasification technology type, system design, level of integration, and coal composition. The gasifier efficiency of converting the coal fuel value to the syngas fuel value (after sulfur removal) is known as the cold gas efficiency, which is generally expressed in HHV. The values for cold gas efficiency in Table 4-1 are indicative of the range of achievable performance for coal and petcoke. Cold gas efficiency for the Shell dry coal feed process is about 3 percent higher than the coal-water slurry feed gasification processes for low moisture coal. This difference increases with coal moisture content. HP steam generation from syngas cooling increases IGCC efficiency by about 2 percent over that of water quench. 4.5 Commercial IGCC Experience There have been approximately 18 IGCC projects throughout the world, as listed in Table 4-2. Of these, fifteen were based on entrained flow gasification technology. Nine of the projects were coal based, two are petcoke based, one is sludge based, and the other six are oil based. Two of the coal-based IGCC plants, Cool Water in California and the Dow Chemical Plaquemine Plant in Louisiana, were small demonstration projects and have been decommissioned. Another small coal IGCC demonstration project was Sierra Pacific’s Piñon Pine Project in Nevada. This project, based on KRW fluidized bed technology, was not successful.
Of the six operating coal IGCC plants, one is a 40 MW plant that coproduces methanol using a Noell gasifier, one is a 350 MW lignite cogeneration plant that has 26 Lurgi fixed bed gasifiers, and four are commercial-scale, entrained flow gasification demonstration projects (ranging in capacity from 250 to 300 MW) that are located in Florida, Indiana, The Netherlands, and Spain. The Wabash Indiana IGCC plant did not operate for an extended period in 2004 and 2005 because of contractual problems, but is currently back in operation. Design data for these four demonstration plants are listed in Table 4-3. None of these demonstration units is of the same capacity scale as that required for the FGPP units.
Final Report All Rights Reserved
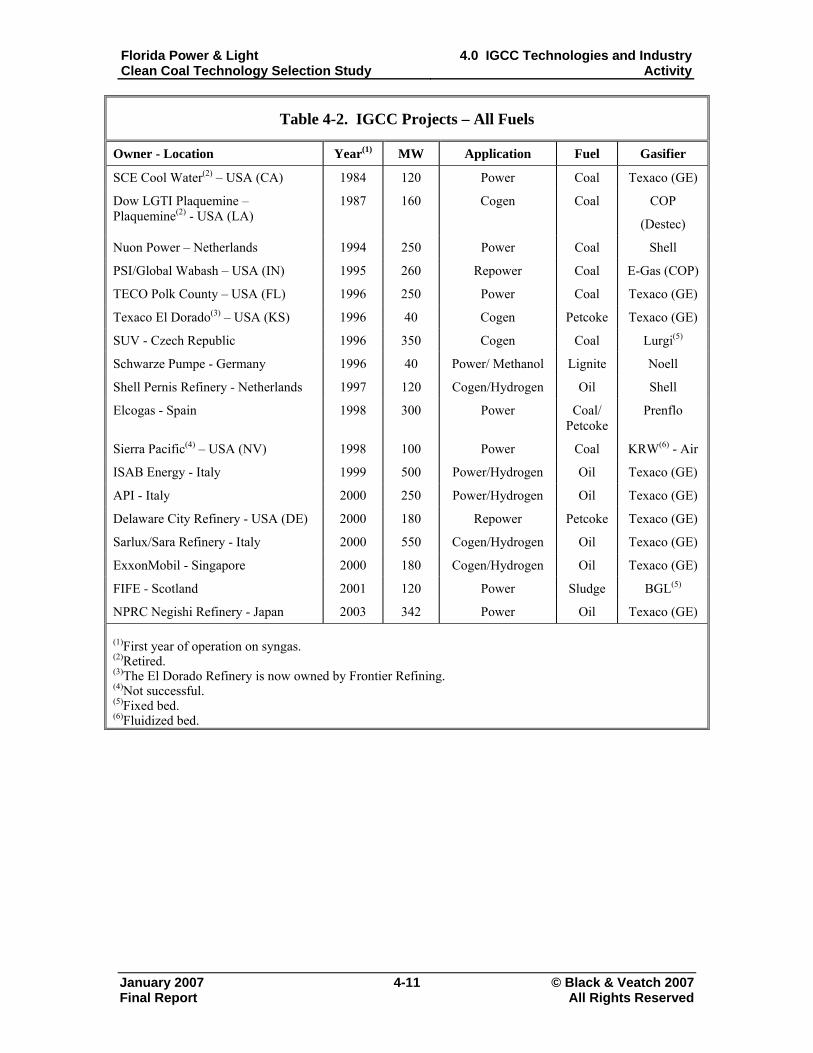
Florida Power & Light Clean Coal Technology Selection Study
4.0 IGCC Technologies and Industry Activity
January 2007 4-11 © Black & Veatch 2007 Final Report All Rights Reserved
Table 4-2. IGCC Projects – All Fuels
Owner - Location Year(1) MW Application Fuel Gasifier
SCE Cool Water(2) – USA (CA) 1984 120 Power Coal Texaco (GE)
Dow LGTI Plaquemine –Plaquemine(2) - USA (LA)
1987 160 Cogen Coal COP
(Destec)
Nuon Power – Netherlands 1994 250 Power Coal Shell
PSI/Global Wabash – USA (IN) 1995 260 Repower Coal E-Gas (COP)
TECO Polk County – USA (FL) 1996 250 Power Coal Texaco (GE)
Texaco El Dorado(3) – USA (KS) 1996 40 Cogen Petcoke Texaco (GE)
SUV - Czech Republic 1996 350 Cogen Coal Lurgi(5)
Schwarze Pumpe - Germany 1996 40 Power/ Methanol Lignite Noell
Shell Pernis Refinery - Netherlands 1997 120 Cogen/Hydrogen Oil Shell
Elcogas - Spain 1998 300 Power Coal/ Petcoke
Prenflo
Sierra Pacific(4) – USA (NV) 1998 100 Power Coal KRW(6) - Air
ISAB Energy - Italy 1999 500 Power/Hydrogen Oil Texaco (GE)
API - Italy 2000 250 Power/Hydrogen Oil Texaco (GE)
Delaware City Refinery - USA (DE) 2000 180 Repower Petcoke Texaco (GE)
Sarlux/Sara Refinery - Italy 2000 550 Cogen/Hydrogen Oil Texaco (GE)
ExxonMobil - Singapore 2000 180 Cogen/Hydrogen Oil Texaco (GE)
FIFE - Scotland 2001 120 Power Sludge BGL(5)
NPRC Negishi Refinery - Japan 2003 342 Power Oil Texaco (GE) (1)First year of operation on syngas. (2)Retired. (3)The El Dorado Refinery is now owned by Frontier Refining. (4)Not successful. (5)Fixed bed. (6)Fluidized bed.
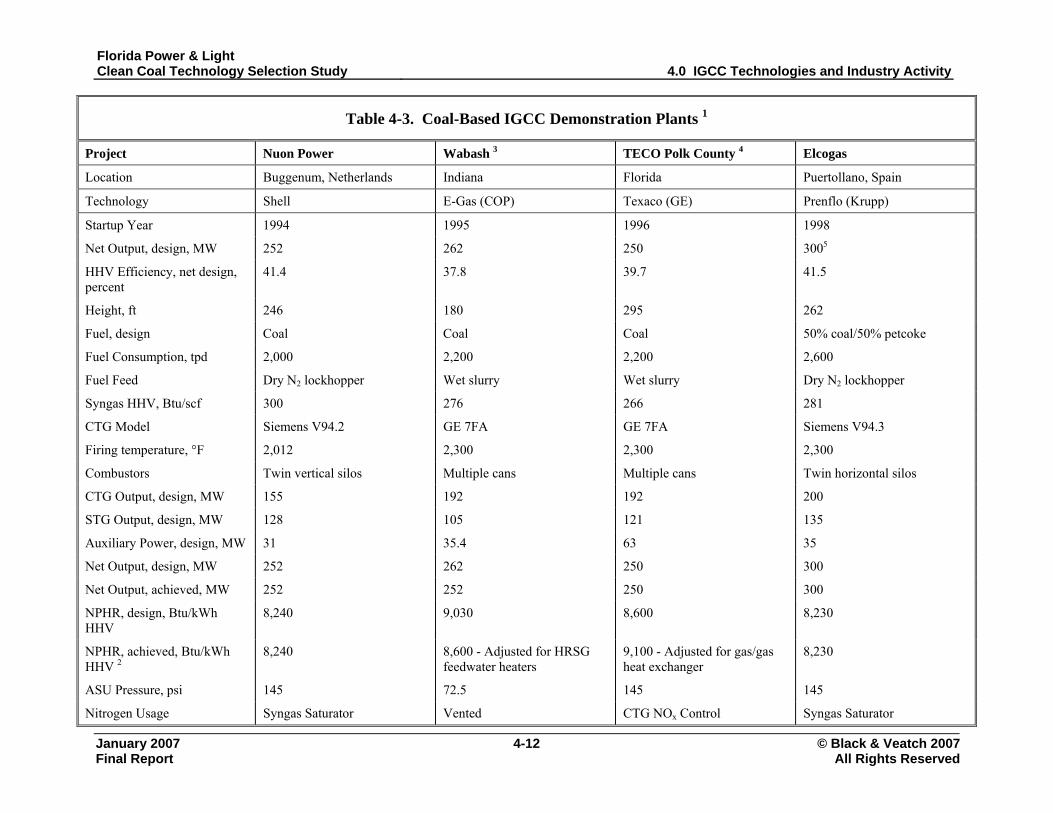
Florida Power & Light Clean Coal Technology Selection Study 4.0 IGCC Technologies and Industry Activity
January 2007 4-12 © Black & Veatch 2007
Table 4-3. Coal-Based IGCC Demonstration Plants 1
Project Nuon Power Wabash 3 TECO Polk County 4 Elcogas
Location Buggenum, Netherlands Indiana Florida Puertollano, Spain
Technology Shell E-Gas (COP) Texaco (GE) Prenflo (Krupp)
Startup Year 1994 1995 1996 1998
Net Output, design, MW 252 262 250 3005
HHV Efficiency, net design, percent
41.4 37.8 39.7 41.5
Height, ft 246 180 295 262
Fuel, design Coal Coal Coal 50% coal/50% petcoke
Fuel Consumption, tpd 2,000 2,200 2,200 2,600
Fuel Feed Dry N2 lockhopper Wet slurry Wet slurry Dry N2 lockhopper
Syngas HHV, Btu/scf 300 276 266 281
CTG Model Siemens V94.2 GE 7FA GE 7FA Siemens V94.3
Firing temperature, °F 2,012 2,300 2,300 2,300
Combustors Twin vertical silos Multiple cans Multiple cans Twin horizontal silos
CTG Output, design, MW 155 192 192 200
STG Output, design, MW 128 105 121 135
Auxiliary Power, design, MW 31 35.4 63 35
Net Output, design, MW 252 262 250 300
Net Output, achieved, MW 252 252 250 300
NPHR, design, Btu/kWh HHV
8,240 9,030 8,600 8,230
NPHR, achieved, Btu/kWh HHV 2
8,240 8,600 - Adjusted for HRSG feedwater heaters
9,100 - Adjusted for gas/gas heat exchanger
8,230
ASU Pressure, psi 145 72.5 145 145
Nitrogen Usage Syngas Saturator Vented CTG NOx Control Syngas Saturator
Final Report All Rights Reserved
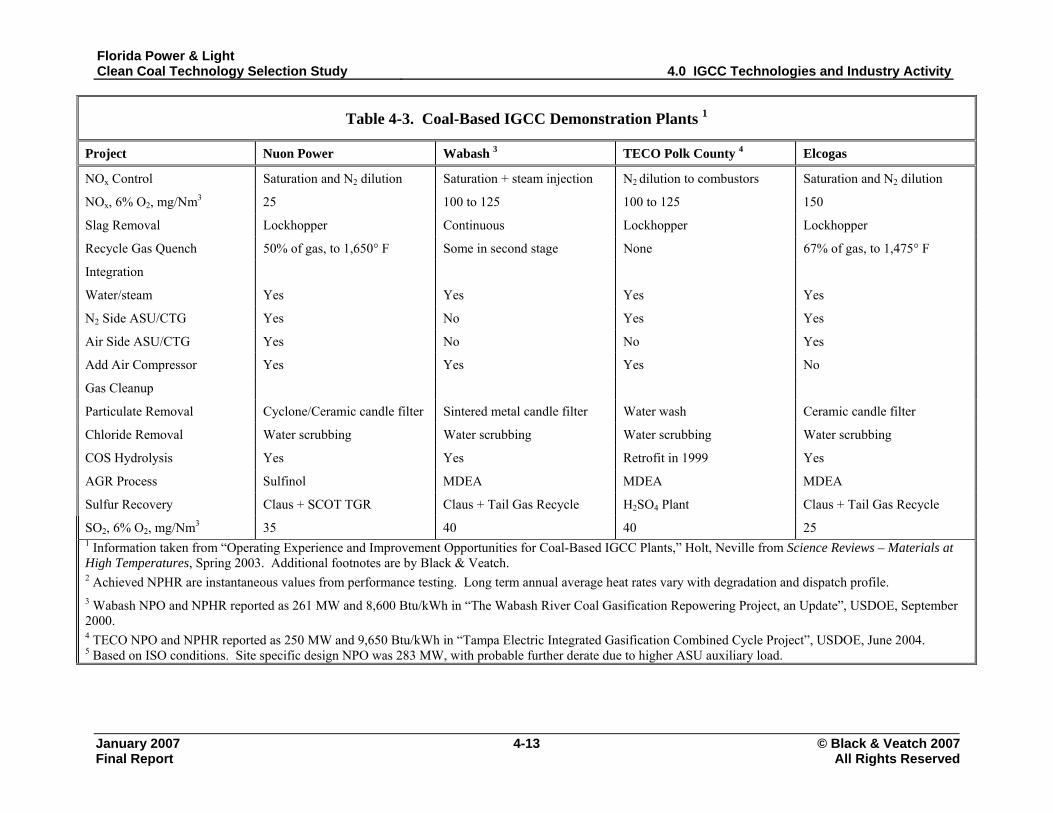
Florida Power & Light Clean Coal Technology Selection Study 4.0 IGCC Technologies and Industry Activity
January 2007 4-13 © Black & Veatch 2007 Final Report All Rights Reserved
Table 4-3. Coal-Based IGCC Demonstration Plants 1
Project Nuon Power Wabash 3 TECO Polk County 4 Elcogas
NOx Control Saturation and N2 dilution Saturation + steam injection N2 dilution to combustors Saturation and N2 dilution
NOx, 6% O2, mg/Nm3 25 100 to 125 100 to 125 150
Slag Removal Lockhopper Continuous Lockhopper Lockhopper
Recycle Gas Quench 50% of gas, to 1,650° F Some in second stage None 67% of gas, to 1,475° F
Integration
Water/steam Yes Yes Yes Yes
N2 Side ASU/CTG Yes No Yes Yes
Air Side ASU/CTG Yes No No Yes
Add Air Compressor Yes Yes Yes No
Gas Cleanup
Particulate Removal Cyclone/Ceramic candle filter Sintered metal candle filter Water wash Ceramic candle filter
Chloride Removal Water scrubbing Water scrubbing Water scrubbing Water scrubbing
COS Hydrolysis Yes Yes Retrofit in 1999 Yes
AGR Process Sulfinol MDEA MDEA MDEA
Sulfur Recovery Claus + SCOT TGR Claus + Tail Gas Recycle H2SO4 Plant Claus + Tail Gas Recycle
SO2, 6% O2, mg/Nm3 35 40 40 25 1 Information taken from “Operating Experience and Improvement Opportunities for Coal-Based IGCC Plants,” Holt, Neville from Science Reviews – Materials at High Temperatures, Spring 2003. Additional footnotes are by Black & Veatch. 2 Achieved NPHR are instantaneous values from performance testing. Long term annual average heat rates vary with degradation and dispatch profile. 3 Wabash NPO and NPHR reported as 261 MW and 8,600 Btu/kWh in “The Wabash River Coal Gasification Repowering Project, an Update”, USDOE, September 2000. 4 TECO NPO and NPHR reported as 250 MW and 9,650 Btu/kWh in “Tampa Electric Integrated Gasification Combined Cycle Project”, USDOE, June 2004. 5 Based on ISO conditions. Site specific design NPO was 283 MW, with probable further derate due to higher ASU auxiliary load.
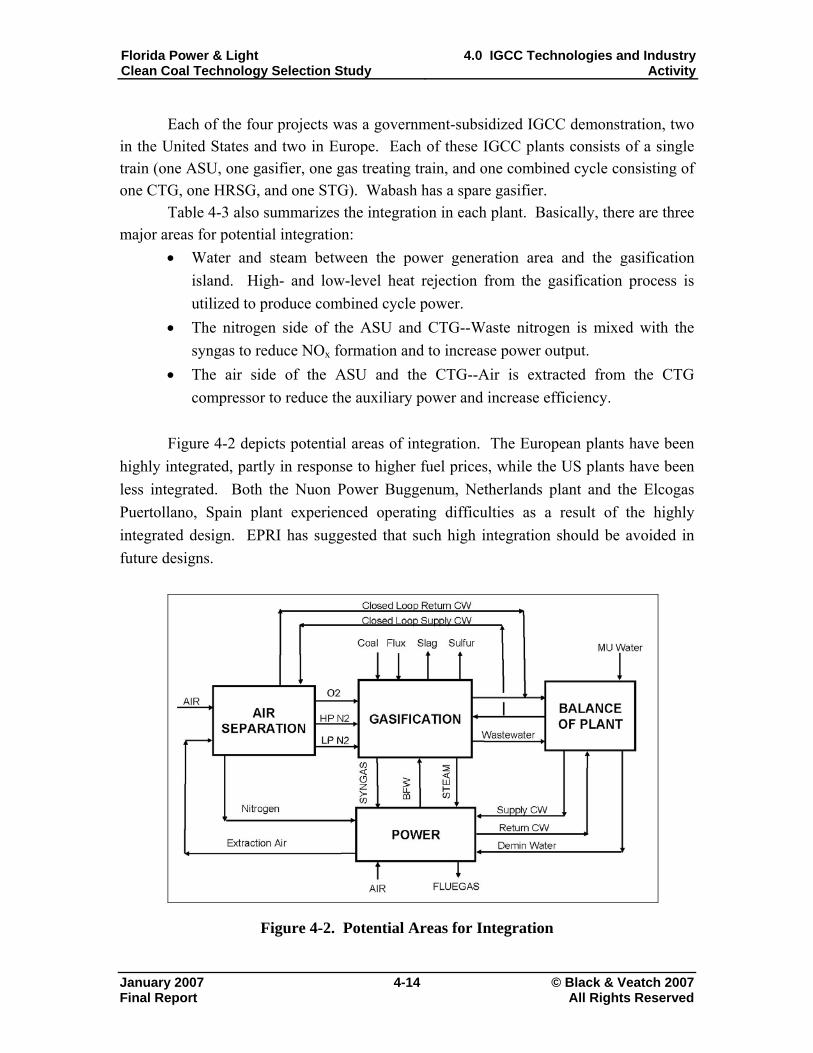
Florida Power & Light Clean Coal Technology Selection Study
4.0 IGCC Technologies and Industry Activity
Each of the four projects was a government-subsidized IGCC demonstration, two in the United States and two in Europe. Each of these IGCC plants consists of a single train (one ASU, one gasifier, one gas treating train, and one combined cycle consisting of one CTG, one HRSG, and one STG). Wabash has a spare gasifier.
Table 4-3 also summarizes the integration in each plant. Basically, there are three major areas for potential integration:
• Water and steam between the power generation area and the gasification island. High- and low-level heat rejection from the gasification process is utilized to produce combined cycle power.
• The nitrogen side of the ASU and CTG--Waste nitrogen is mixed with the syngas to reduce NOx formation and to increase power output.
• The air side of the ASU and the CTG--Air is extracted from the CTG compressor to reduce the auxiliary power and increase efficiency.
Figure 4-2 depicts potential areas of integration. The European plants have been
highly integrated, partly in response to higher fuel prices, while the US plants have been less integrated. Both the Nuon Power Buggenum, Netherlands plant and the Elcogas Puertollano, Spain plant experienced operating difficulties as a result of the highly integrated design. EPRI has suggested that such high integration should be avoided in future designs.
Figure 4-2. Potential Areas for Integration
January 2007 4-14 © Black & Veatch 2007 Final Report All Rights Reserved

Florida Power & Light Clean Coal Technology Selection Study
4.0 IGCC Technologies and Industry Activity
The operation of these four commercial coal-fueled IGCC plants has adequately demonstrated capacity, efficiency, and environmental performance, but uncertainty remains regarding availability, reliability, and cost. The complexity and the relative immaturity of the IGCC process increase opportunities for deficiencies in design, vendor-supplied equipment, construction, operation, and maintenance. The high risks of cost overruns and low availability have presented obstacles to the development of nonsubsidized coal-fueled IGCC projects. At present, there are several coal-based IGCC projects being developed in the United States that have or expect to receive subsidies. 4.6 Fuel Characteristics Impact on Gasifier Selection
There are three general coal feedstocks typically considered for IGCC projects: Appalachian, Illinois, and Powder River Basin (PRB). Petcoke is a fourth solid fuel feedstock that is frequently considered for IGCC applications. Petcoke may be a lower cost fuel, but it is not as readily obtainable as coal. Historically, anthracite and lignite coals have not been seriously evaluated for IGCC projects, nor have waste coals such as gob (coal mine waste) and culm (waste produced when anthracite is mined and prepared for market, primarily rock and some coal).
Coal-based operating experience has been focused almost exclusively on bituminous coals (e.g., Pittsburgh No. 8 and Illinois No. 6), and there is also extensive experience with petcoke. Subbituminous (i.e., PRB) coals have been tested only in a limited fashion, but because of the nature of the US coal market and the abundance of PRB coal, there is strong interest in using it for IGCC applications. Typical design values for the coals generally considered for IGCC are listed in Table 4-4.
Table 4-4. As-Received Coal Properties of Typical IGCC Coals
Fuel Pittsburgh No. 8 Illinois No. 6 PRB Heat Content, Btu/lb (HHV) 12,300 10,200 8,400 Moisture, percent 8.0 14.1 29.4 Ash, percent 12.0 15.7 6.0 Sulfur, percent 4.0 4.3 0.34
January 2007 4-15 © Black & Veatch 2007 Final Report All Rights Reserved
Florida Power & Light Clean Coal Technology Selection Study
4.0 IGCC Technologies and Industry Activity
In the GE gasification process, all of the inherent water in the coal and the liquid water in the slurry must be evaporated in the gasifier by combusting more CO to CO2, which results in a lower cold gas efficiency than the COP and Shell gasification processes. For low moisture fuels, such as the one in this study, the GE process can be very cost competitive. COP is able to attain a higher cold gas efficiency than GE through use of a full slurry quench
4.7 IGCC Performance and Emissions Considerations IGCC net power output decreases with increasing ambient temperature, but this reduction is less than that of a natural gas combined cycle (NGCC) plant. The IGCC plant auxiliary power consumption also increases slightly with the ambient temperature for ASU air compression and cooling tower fans, but this is offset by higher combustion turbine output. The CO and NOx emissions estimates were based on CTGs firing syngas with nitrogen dilution, but without an SCR or CO oxidation catalyst in the HRSG:
• 25 ppmvd CO in the CTG exhaust gas. • 15 ppmvd NOx (at 15 percent by volume O2) in the CTG exhaust gas.
The SO2 emissions estimate was based on a 25 ppm molar concentration of sulfur
as H2S and COS in the syngas. Sulfur removal efficiencies of greater than 99 percent are achievable for an IGCC plant processing high sulfur coal or petcoke, depending on the solvent selected. Flaring during startups, shutdowns, and upsets can result in significant SO2 emissions. Sour gas flaring during upsets cannot be eliminated, but can be minimized by appropriate process design and operating procedures. Syngas will flow through sulfur impregnated carbon, which is estimated to lower the syngas mercury concentration below 5 ppb by weight. Up to 40 percent of the mercury in the coal may be removed upstream of the sulfur impregnated carbon by scrubbing, which would reduce the mercury concentration at the inlet of the sulfur impregnated carbon to 30 to 42 ppb by weight. Eastman Chemical Company’s coal gasification plant has used sulfur impregnated carbon beds for mercury removal since its startup in 1993. Eastman reports 90 to 95 percent mercury removal with a bed life of 18 to 24 months. 4.8 Gasification Wastewater Treatment
There are two general categories of plant wastewater:
January 2007 4-16 © Black & Veatch 2007 Final Report All Rights Reserved

Florida Power & Light Clean Coal Technology Selection Study
4.0 IGCC Technologies and Industry Activity
• Streams that contain metals from the as-received coal, referred to as gasification wastewater streams.
• Streams that do not contain these metals, referred to as balance-of-plant wastewater streams.
The gasification wastewater streams will be combined and treated separately from
the balance-of-plant wastewater streams. Accurate specification of the process wastewater composition has been a problem on other operating gasification plants because of the wide variation in coal composition. The wastewater treatment design should accommodate variations in wastewater composition.
There are three basic options for treating gasification wastewater streams: 1. Open Discharge Concept, which consists of metals precipitation, followed
by biological treatment to produce an effluent suitable for discharge. 2. Zero Liquid Discharge (ZLD) Concept, which consists of lime softening,
followed by evaporation and crystallization to produce a solid salt for landfill disposal.
3. Discharge to a municipal sewage treatment facility or other receiving stream. This option is generally considered impractical, because the coal gasification wastewater exceeds typical pretreatment limitations.
Biological treatment of the gasification wastewater can be problematic, because
the diverse contaminants are believed to be sufficiently variable so that the operation would be unreliable, which could result in violations of expected permit requirements. The open discharge system would cost approximately the same as the ZLD option and is not a proven technology in this application. The operating costs are equivalent between ZLD and open discharge systems. However, ZLD requires additional LP steam, which could otherwise be used to generate an additional 2 to 5 MW of electricity. 4.9 Acid Gas Removal Technology
Sulfur in coal is converted to H2S and COS during gasification. The molar ratio of H2S to COS in the raw syngas from the gasifier varies according to the gasifier type, from approximately 13 to 1 for the Shell gasifier to approximately 26 to 1 for the COP and GE gasifiers. The resulting syngas is treated to meet combustion turbine fuel and air emissions permit requirements. The requirement is for total sulfur in the clean syngas to be less than 25 ppm by weight, which is equivalent to 15 ppm by mole of COS and H2S.
The two primary solvents considered for IGCC AGR are Selexol and methyl diethanol amine (MDEA). Selexol solvent is a mixture of dimethyl ethers of
January 2007 4-17 © Black & Veatch 2007 Final Report All Rights Reserved

Florida Power & Light Clean Coal Technology Selection Study
4.0 IGCC Technologies and Industry Activity
polyethylene glycol, CH3(CH2CH2O)(3 to 9)CH3. UOP licenses Selexol technology for treating syngas from gasification. Selexol is a physical solvent. Its capacity to absorb sulfur compounds (including H2S) and to absorb CO2 increases with increasing pressure and decreasing temperature.
MDEA, (HOC2H4)2NCH3, is a chemical solvent, specifically a selective amine used to remove H2S, while leaving most of the CO2 in the syngas. MDEA forms a chemical bond with H2S and CO2. MDEA’s performance is nearly independent of operating pressure. Typical absorber operating temperatures with amines are between 80 and 120° F. Lower absorber operating temperatures increase both H2S solubility and selectivity over CO2. The higher absorber operating pressures and higher syngas CO2 concentrations for the COP and GE gasification processes favor the use of Selexol, while MDEA is generally favored for the Shell gasification process. 4.10 Pre-combustion Carbon Capture
In the conventional IGCC case, the gasification process produces a synthetic gas (syngas) composed primarily of a homogeneous mixture of CO and hydrogen. This fuel is provided to a combined cycle power plant, and the combustion process produces comparably the same amount of CO2 as does a conventional coal plant.
However, by adding water-gas shift and CO2 absorption steps, the gasification process can yield a gaseous fuel stream that is nearly carbon-free, and a CO2-rich solvent from which CO2 can be removed for separate sequestration or other industrial uses. The fuel stream, composed mostly of hydrogen, would be used directly as a fuel in an appropriately designed combined cycle plant.8 The outcome is the generation of “low carbon” electric power from a low-cost fuel source.
An IGCC facility with carbon capture capability would consist of a gasification process that is closely integrated with a conventional combined cycle power plant. The base facility would consist of five major components:
• ASU • Gasification plant • Gas cleanup • Water shift process • Combined cycle power plant
8 Hydrogen fueled CTGs are not currently commercially available.
January 2007 4-18 © Black & Veatch 2007 Final Report All Rights Reserved
Florida Power & Light Clean Coal Technology Selection Study
4.0 IGCC Technologies and Industry Activity
After particulate and acid gas removal, clean syngas is water shifted prior to combustion in the power block. The result is a gas stream composed almost entirely of hydrogen and CO2. From that stream, up to 90 percent of the CO2 is then removed through a stripping process by passing the gas through an absorption tower using a physical CO2 solvent. Hydrogen can then be provided as a nearly carbon-free fuel to the CTGs. The CO2 removed by the solvent is recovered, cooled, compressed, dried, and transported to a sequestration location.
The addition of a carbon capture process would have a significant impact on the output and heat rate of an IGCC facility. Significantly higher auxiliary loads are required for compression loads in the capture process, and thermal energy in the form of process steam is required to separate the CO2 from the absorption solvent. Energy would also be required for captured CO2 compression. These energy requirements would have an impact on the net plant output and net plant heat rate of the facility. In order to maintain project required net plant output, additional generation capacity would need to be installed to compensate for the increased auxiliary loads of the carbon capture process. The increase in gross plant generation would meet the carbon capture process energy requirements.
Figure 4-3 shows a pre-combustion CO2 removal process for a typical IGCC plant.
The inclusion of carbon capture in IGCC has several significant advantages over other carbon capture options:
• The process takes place at relatively high pressures and prior to the dilution of CO2-containing gas. With CTGs, the combustion process occurs in a very large mass of compressed air, which adds excess oxygen and large amounts of nitrogen to the flue gas. In contrast, the volume of high-pressure pre-combustion syngas flow from which CO2 must be removed is less by two orders of magnitude than that required in the post-combustion treatment of CTG flue gas streams, significantly reducing equipment dimensions, capacities, and costs.
• CO2 capture takes place at temperatures and pressures in which a “physical” solvent can be used, instead of the chemical solvent required in most post-combustion processes. CO2 can be separated from physical solvents through a pressure reduction process that requires much less thermal energy than the post-combustion alternative.
• There are additional cycle efficiency benefits that may occur as more advanced CTGs are developed. At the present time, F Class technologies
January 2007 4-19 © Black & Veatch 2007 Final Report All Rights Reserved

Florida Power & Light Clean Coal Technology Selection Study
4.0 IGCC Technologies and Industry Activity
January 2007 4-20 © Black & Veatch 2007 Final Report All Rights Reserved
are expected to be the CTG technology developed for high hydrogen, carbon-free applications in the near term. G and H Class technologies, along with other alternative CTG cycles, offer opportunities for efficiency improvements. While none of these technologies is currently capable of burning high hydrogen fuels, industry requirements, driven by the need for carbon capture, may stimulate the required research and development to enable this application.
Pertinent technology considerations include the following: • While IGCC plants are in operation using F Class technologies, CO2
capture applications where the CTGs are burning virtually pure hydrogen do not exist. CTG combustion system development is required to burn hydrogen to fully support the IGCC-based carbon capture.
• There is currently a large-scale coal gasification plant with carbon capture in North Dakota in commercial operation. The Great Plains Synfuel Plant has been operating since 1983 and gasifies 16,000 tons per day of lignite to produce synthetic natural gas. CO2 is captured as a required precursor to methanation and used for EOR. While this scale is comparable to an electric power plant, the Great Plains plant is not directly comparable to a power plant because of the additional processes that are carried out at Great Plains. This example is the most relevant commercial operating experience for this carbon capture process.
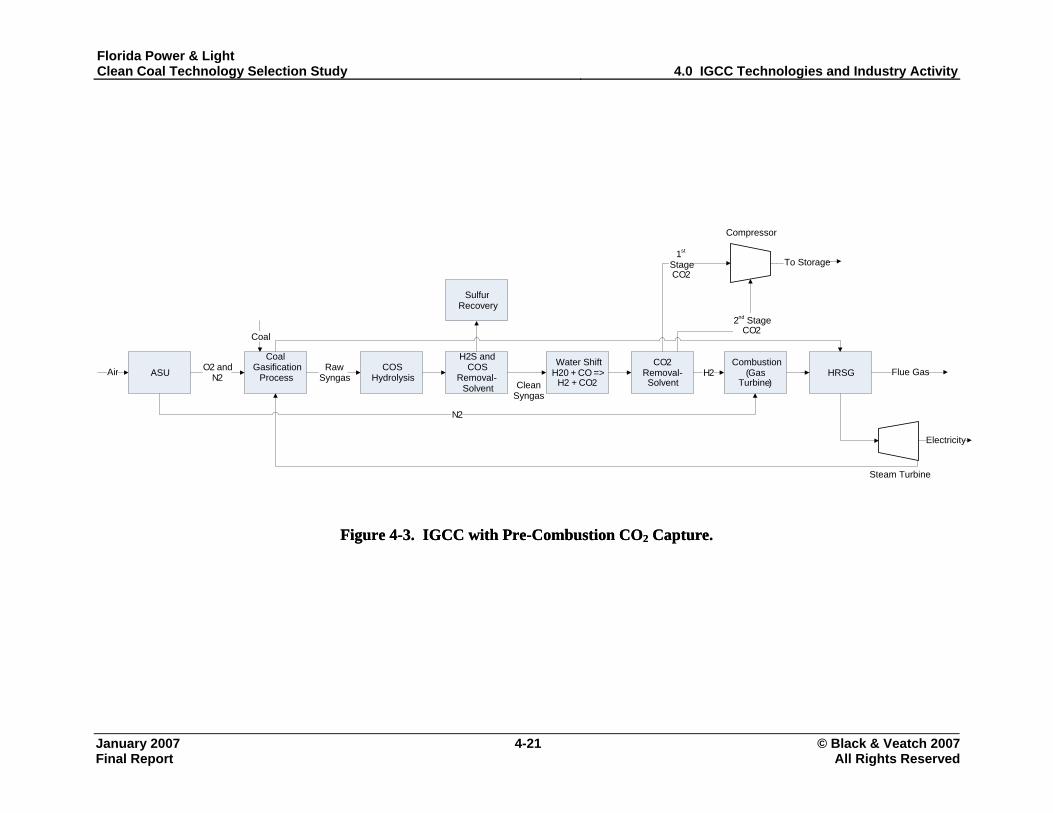
Florida Power & Light Clean Coal Technology Selection Study 4.0 IGCC Technologies and Industry Activity
January 2007 4-21 © Black & Veatch 2007 Final Report All Rights Reserved
ASU
Sulfur Recovery
Combustion (Gas
Turbine)
CO2 Removal -Solvent
Water Shift H20 + CO =>
H2 + CO2
H2S and COS
Removal -Solvent
COS Hydrolysis
Coal Gasification
Process
HRSG
Steam Turbine
Compressor
Air
N2
O2 and N 2
Raw Syngas
Clean Syngas
H2
1st
StageCO2
To Storage
Electricity
Flue Gas
Coal
2nd Stage CO2
Figure 4-3. IGCC with Pre-Combustion CO2 Capture. Figure 4-3. IGCC with Pre-Combustion CO2 Capture.

Florida Power & Light Clean Coal Technology Selection Study
4.0 IGCC Technologies and Industry Activity
January 2007 4-22 © Black & Veatch 2007
4.11 Equivalent Availability An IGCC plant is not expected to be as reliable as a PC or CFB plant with respect to producing electricity from coal. IGCC plants without spare gasifiers are expected to achieve long-term annual equivalent availabilities in the 80 to 85 percent range versus approximately 90 percent for PC and CFB plants. Based on past experience, IGCC availability during initial startup and the first several years of operation is expected to be significantly lower than the long-term targets. This can be mitigated by firing the CTGs with backup fuel (such as natural gas or low sulfur fuel oil) however, this would reduce the fuel diversity benefit of adding coal fired generation. The equivalent availability of the combined cycle portion of an IGCC plant is expected to be above 90 percent. The equivalent availability of an IGCC plant can be increased by providing a spare gasifier. Spare gasifier economics depend on the gasifier technology, cost of backup fuel, and plant dispatch economics. The next generation of coal-fueled IGCC plants may take advantage of the lessons learned from existing operating plants, but significant startup problems should be expected. 4.11.1 First Generation IGCC Plants Solids-related problems (erosion, pluggage, unstable flows, and syngas cooler tube leaks) caused significant gasification downtime for all four of the coal-based IGCC plants. Gasifier burner and refractory maintenance also resulted in significant downtime for the COP and GE gasifiers. For the Buggenum and Puertollano plants, CTG problems related to syngas combustion and startup air extraction were significant. Since the problems were identified, plant modifications and O&M improvements have greatly improved performance; these two plants now produce electricity at design rates and close to design efficiencies. Estimated annual equivalent availabilities for producing electricity from coal (syngas operation) are listed in Table 4-5 for all four of the coal-based IGCC plants discussed in Section 4.5. These equivalent availabilities are for electricity production from coal or petcoke; power generation from firing the CTG on backup fuel is excluded. Gasification process availability for each of these plants was poor during the first several years of operation and continues to be a problem. The complexity and relative technological immaturity of large-scale commercial gasification processes increase opportunities for deficiencies in design, vendor-supplied equipment, construction, operation, and maintenance. During the first several years of plant operation, a number of these deficiencies were corrected, and the plant staff has optimized the plant O&M as they “move up the gasification learning curve.” Design improvements are expected to be introduced on future IGCC plants, which should improve equivalent availability.
Final Report All Rights Reserved
Florida Power & Light Clean Coal Technology Selection Study
4.0 IGCC Technologies and Industry Activity
January 2007 4-23 © Black & Veatch 2007
4.11.2 Next (Second) Generation IGCC Plants
If the equivalent availability of the facility is critical to the project, the GE Quench technology with a spare gasifier is expected to provide high availability (from 85 to 90 percent), in the long term. However, as with all of the gasification technologies, in the first year, availability is expected to be around 50 percent. This would be expected to increase to the mature availability over four to five years.
Gasifiers with the water quench process have lower capital costs than gasifiers with HTHR. However, the GE Quench gasifiers have a lower efficiency power cycle because they produce LP steam instead of HP steam. Also, it is not practical to operate with a hot spare for gasifiers that use HTHR, because the HTHR requires a shutdown to switch gasifiers.
In the long-term IGCC unit forced outage rates are expected to range from 10 to 15 percent without a spare gasifier and from 5 to 10 percent with a hot spare gasifier. However, in the first year, the forced outage rate is expected to be around 45 percent. The CTG(s) can operate on backup fuel, if available, when syngas is not available. The combined cycle availability is expected to exceed 90 percent. Despite the comparatively low capital cost to add a spare Quench gasifier (roughly 60 percent of a HTHR gasifier), it appears that the prevailing sentiment in the gasification community is that the economics of a spare gasifier will be difficult to justify in most power generation applications, because of the reduced efficiency. For many utilities, there is reduced power demand in the spring and/or fall of the year that would allow for annual planned outages. Because there are three gasifier/CTG trains, these would not typically be full plant outages, but would reduce the available output from the plant by one third for an extended time. Full plant planned outages would be required approximately every 6 years for steam turbine maintenance, similar to that required for a PC or CFB plant. The annual planned outages are a contributing factor to the lower expected equivalent availability of an IGCC plant as compared to a PC or CFB plant. 4.12 Other Commercial Entrained Bed Gasification Experience GE Quench type gasifiers have been in commercial operation on coal or petcoke since 1983, producing syngas for chemical production. Two plants of note are the Eastman Chemical Plant in Kingsport, Tennessee, and the Ube Ammonia Plant in Japan. The syngas from these two plants is used to produce acetyl chemicals and ammonia, respectively. Kingsport has two gasifiers; one is normally operated and the other is a spare. Ube has four gasifiers; three are normally operated and one is a spare. Ube
Final Report All Rights Reserved
Florida Power & Light Clean Coal Technology Selection Study
4.0 IGCC Technologies and Industry Activity
January 2007 4-24 © Black & Veatch 2007
originally gasified crude oil, then switched to refinery residuals, then to coal, and has been gasifying a total of 1,650 tpd of petcoke since 1996. At Kingsport and Ube, an average syngas availability of 98 percent is achieved by rapid switchover to the spare gasifier, which is on hot standby, and the high level of resources (e.g., O&M) applied to the gasification process. The Eastman Kingsport plant has occasionally been referred to as an IGCC plant. This is incorrect because it produces no power; the Eastman plant produces syngas for chemical production, with no power generation. The economics of chemical production at the Eastman facility are different from the economics of the power market. As such, a fully redundant gasifier is warranted at the Eastman facility. Eastman has made gasification one of its focus areas, as evidenced by its formation of the Eastman Gasification Services Company.
Final Report All Rights Reserved

Florida Power & Light Clean Coal Technology Selection Study
4.0 IGCC Technologies and Industry Activity
January 2007 4-25 © Black & Veatch 2007
Table 4-5. Coal/Coke-Fueled IGCC Plant Equivalent Availabilities
IGCC Plant Nuon Global Energy TECO Elcogas
Location Buggenum Wabash Polk County Puertollano Netherlands Indiana Florida Spain
Gasifier Shell COP E-Gas GE HTHR Prenflo Net Output 252 MW 262 MW 250 MW 300 MW
Startup Year 1994 1995 1996 1998 Year after Startup IGCC Equivalent Availability (percent)
1 23 20 35 16 2 29 43 67 38 3 50 60 60 59 4 60 40 75 62 5 61 70 69 66 6 60 69 74 58 7 57 75 68 NA 8 67 78 81 9 73 -- 82 10 78 -- 11 NA
Note: 1. Data is based upon available information. Data reporting methodology varies somewhat
between the plants. 2. Wabash Years 5 to 8 IGCC equivalent availability estimated as 95 percent of reported syngas
availability. 3. Wabash availability excludes periods when the plant was shut down because of no product
demand (24 percent in Year 7 - 2002 and 16 percent in Year 8 – 2003, shutdown in Year 9 - 2004 and Year 10 - 2005).
4.13 Current Announced Electric Generation Industry Activity
Major industry participants, such as AEP and Duke Energy (formerly Cinergy), are considering implementing IGCC projects. In addition, numerous smaller companies are pursuing gasification projects using state and federal grants. The more advanced,
Final Report All Rights Reserved

Florida Power & Light Clean Coal Technology Selection Study
4.0 IGCC Technologies and Industry Activity
January 2007 4-26 © Black & Veatch 2007
publicly discussed IGCC projects of which Black & Veatch is aware are shown in the table below.9
Table 4-6. Announced IGCC Projects Currently In Development.
Owner Size, MW Fuel Technology Location AEP 600 Bituminous GE OH AEP 600 Bituminous GE WV Duke/Cinergy 600 Bituminous GE IN Excelsior 600 Bituminous/ PRB COP MN Southern & OUC 285 PRB KBR FL Global Energy 540 Petcoke COP IN Global Energy 600 Petcoke COP OH ERORA 557 Bituminous GE IL Energy Northwest 600 PRB/Petcoke NA WA NRG Northeast 630 PRB/Petcoke Shell CT NRG Northeast 630 PRB/Petcoke Shell NY TECO 789 Bituminous GE FL Mississippi Power CO
700 Lignite KBR MS
4.13.1 Summary of Proposed Projects
The development activities of the eight companies discussed in the previous subsections represent advances in the development of new IGCC plants within the United States.
Entrained flow gasification technology has been selected by six of the companies. Southern Company and OUC are moving forward with the commercial demonstration of a transport bed gasifier. Energy Northwest has not selected a vendor at this stage, but all indications are that it will be a COP, GE, or Shell entrained flow gasification technology.
All of the projects are in coastal or Midwestern locations, with elevations generally at 1,000 feet or less.
The AEP, Duke, and ERORA projects are all based upon bituminous coal. The Global Energy Lima project is based upon petcoke. Excelsior Energy and Energy Northwest anticipate a blend of fuels that would include PRB coal with petcoke. The Southern Company/OUC project is based upon 100 percent PRB coal, but is a
9 According to December 28, 2006, press release, AEP will delay its IGCC plant development to try to reduce the estimated capital cost to be within 20 percent of market pricing of “conventional coal fired power plant.”
Final Report All Rights Reserved
Florida Power & Light Clean Coal Technology Selection Study
4.0 IGCC Technologies and Industry Activity
January 2007 4-27 © Black & Veatch 2007
commercial demonstration project for a new gasification technology and the demonstration will not be complete until 2015. The fuel supply for the NRG sites is primarily coal, but could include up to 20 percent petcoke and 5 percent biomass.
4.13.2 Gasification Market Opportunities
The gasification market appears to have strong opportunities in non-electric power generation sectors. Primarily, these are production of synthetic natural gas (SNG) and coal-to liquids (CTL). Gasification is also used worldwide for ammonia production from coal.
High natural gas prices have spurred interest in SNG production. Several such projects are currently in advanced stages of development. SNG has been proven commercially by the Great Plains facility in North Dakota which has been gasifying lignite for SNG production since 1983.
For the past several years, the continuous cost increase of petroleum based transportations fuels has created a market for alternative transportation fuels. This recently emerged market, coupled with the vast coal reserves of the US, provides potential near term gasification opportunities with CTL technologies. The US Departments of Defense and Energy both have technology development initiatives that are helping drive technology deployment in the US. CTL technologies are commercially available and proven.
Final Report All Rights Reserved
Florida Power & Light Clean Coal Technology Selection Study
5.0 Performance and EmissionsEstimates
January 2007 5-1 © Black & Veatch 2007 Final Report All Rights Reserved
5.0 Performance and Emissions Estimates
Black & Veatch developed estimates of performance for four coal-fueled generation technology options. Both performance and emissions limits were developed for single units that would be installed at a multiple unit greenfield site. Project capacity has been specified as a nominal 2,000 MW net at the FGPP plant boundary. The project required net capacity would be met by installing blocks of power to obtain the nominal 2,000 MW.
The fuel used for the performance and cost estimates consisted of a blend of Central Appalachian coal, Colombian coal, and petcoke. The PC and CFB cases utilized a blend of 40 percent Central Appalachian coal, 40 percent Colombian coal, and 20 percent petcoke, referred to as the AQCS Blend.
Technical limitations exist that restrict the amount of petcoke that can be fired in PC units. These limitations are related to the fuel characteristics of petcoke. The low volatile matter of petcoke compared to its high fixed carbon content leads to flame instability in PC furnaces. In addition, the high sulfur content of petcoke, typically in the range of 3 to 8 percent, can lead to fireside corrosion of heat transfer equipment, flue gas path ductwork, and flue gas handling equipment. The high sulfur content also adds complications in meeting SO2 emission requirements. Because of this, petcoke is typically co-fired with coal in PC units.
The IGCC case utilized a blend of 25 percent Central Appalachian coal, 25 percent Colombian coal, and 50 percent petcoke, referred to as the IGCC Blend.
For the purposes of this evaluation, the technologies were evaluated on a consistent basis relative to one another. The technologies, plant sizes, and arrangements that were considered for this study are shown in Table 2-1.
5.1 Assumptions
Black & Veatch and FPL developed assumptions for each of the technologies. The assumptions are provided in the following subsections.
5.1.1 Overall Assumptions
For the basis of the performance estimates, the site conditions of the proposed greenfield FGPP in Glades County, Moore Haven, Florida were used. The site conditions were provided to Black & Veatch by FPL. Performance estimates were developed for both the hot day and the average day ambient conditions. Following are the overall assumptions, which were consistent among all of the technologies:
• Elevation--20 feet.
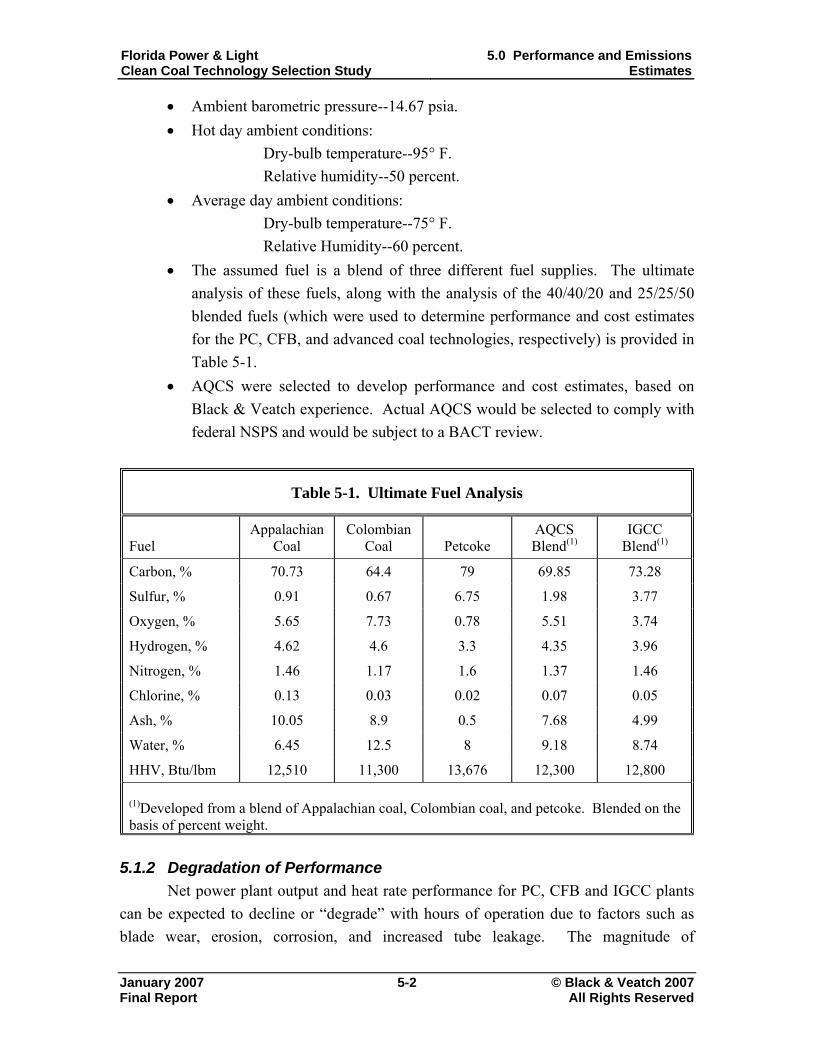
Florida Power & Light Clean Coal Technology Selection Study
5.0 Performance and EmissionsEstimates
January 2007 5-2 © Black & Veatch 2007 Final Report All Rights Reserved
• Ambient barometric pressure--14.67 psia. • Hot day ambient conditions:
Dry-bulb temperature--95° F. Relative humidity--50 percent.
• Average day ambient conditions: Dry-bulb temperature--75° F. Relative Humidity--60 percent.
• The assumed fuel is a blend of three different fuel supplies. The ultimate analysis of these fuels, along with the analysis of the 40/40/20 and 25/25/50 blended fuels (which were used to determine performance and cost estimates for the PC, CFB, and advanced coal technologies, respectively) is provided in Table 5-1.
• AQCS were selected to develop performance and cost estimates, based on Black & Veatch experience. Actual AQCS would be selected to comply with federal NSPS and would be subject to a BACT review.
Table 5-1. Ultimate Fuel Analysis
Fuel Appalachian
Coal Colombian
Coal Petcoke AQCS Blend(1)
IGCC Blend(1)
Carbon, % 70.73 64.4 79 69.85 73.28
Sulfur, % 0.91 0.67 6.75 1.98 3.77
Oxygen, % 5.65 7.73 0.78 5.51 3.74
Hydrogen, % 4.62 4.6 3.3 4.35 3.96
Nitrogen, % 1.46 1.17 1.6 1.37 1.46
Chlorine, % 0.13 0.03 0.02 0.07 0.05
Ash, % 10.05 8.9 0.5 7.68 4.99
Water, % 6.45 12.5 8 9.18 8.74
HHV, Btu/lbm 12,510 11,300 13,676 12,300 12,800 (1)Developed from a blend of Appalachian coal, Colombian coal, and petcoke. Blended on the basis of percent weight.
5.1.2 Degradation of Performance
Net power plant output and heat rate performance for PC, CFB and IGCC plants can be expected to decline or “degrade” with hours of operation due to factors such as blade wear, erosion, corrosion, and increased tube leakage. The magnitude of
Florida Power & Light Clean Coal Technology Selection Study
5.0 Performance and EmissionsEstimates
January 2007 5-3 © Black & Veatch 2007 Final Report All Rights Reserved
performance degradation is dependent upon the specific characteristics of each facility such as mode of operation, fuel characteristics, water washing and maintenance practices as well as site specific ambient conditions. A portion of this degradation is recoverable and a portion is non-recoverable.
Periodic maintenance and overhauls can recover much, but not all, of the degraded performance compared to the unit’s new and clean performance. The degradation which cannot be recovered is referred to as non-recoverable degradation. Performance that is recovered by scheduled maintenance is referred to as recoverable degradation. Performance degradation can also be reported as maximum degradation, which is the reduction in performance from clean and new equipment that is expected prior to a major overhaul.
Based on Black & Veatch experience, quantifying degradation in performance is difficult because actual data is not easily documented by the users and not easily obtained from the users or from the manufacturers. Many papers contain information regarding degradation in performance but the information is heavily qualified and vaguely presented thereby limiting analysis. For this study, a maximum degradation factor, a factor used to estimate the decline in a performance parameter, was assumed for each of the technologies. A maximum degradation of 1.0 percent for both the heat rate and net power output has been assumed for the PC and CFB cases. For the IGCC case, the maximum degradation was assumed to be 2.5 percent for both the heat rate and net power output.
5.1.3 PC and CFB Coal Cycle Arrangement Assumptions
The following assumptions were common to the SPC, USCPC, and CFB cases: • All cases would utilize a wet mechanical draft cooling tower. • A 40/40/20 fuel blend would be used for boiler efficiency in accordance with
Table 5-1. • Condenser performance was estimated on Black & Veatch experience. The
expected condenser back pressures were supplied for hot and average day ambient conditions.
• The facilities would be designed for a nominal 2,000 MW net at the FGPP plant boundary by installing multiple units. Performance estimates were developed for multiple units generating a nominal 2,000 MW net of power at the average day ambient conditions.
The following subsections provide the specific assumptions used for each of the PC and CFB cases.
Florida Power & Light Clean Coal Technology Selection Study
5.0 Performance and EmissionsEstimates
January 2007 5-4 © Black & Veatch 2007 Final Report All Rights Reserved
5.1.3.1 Subcritical PC. • Single unit capacity--500 MW net. • Subcritical STG and subcritical PC boiler. • Tandem-compound, four-flow, 33.5 inch last-stage blade (LSB) (TC4F-33.5)
STG. • Assumed capacity factor of 92.0 percent. • AQCS:
o LNB, overfire air (OFA), flue gas recirculation (FGR), and SCR for NOx control.
o Wet limestone FGD for SO2 control. o Activated Carbon Injection (ACI) for further Hg control o Pulse jet fabric filter (PJFF) for particulate control. o Wet electrostatic precipitator (ESP) for control of sulfuric acid mist
(SAM.) • Auxiliary power assumed to be 9.0 percent of gross plant output. • The auxiliary load estimate was based on using motor driven boiler feed
pumps (BFPs). This estimate would decrease by 2 to 3 percent if BFPs were turbine driven.
• Throttle conditions--2,415 psia, 1,050/1,050° F. • Seven feedwater heaters (FWHs)--Three HP, three LP, and one deaerator
(DA). • Condenser pressure for hot and average day ambient conditions assumed to be
2.9 and 2.2 in. HgA, respectively. 5.1.3.2 Ultrasupercritical PC.
• Single unit capacity--1,000 MW net. • Supercritical STG and supercritical PC boiler. • TC4F-40.0 STG. • Assumed capacity factor of 92.0 percent. • AQCS:
o LNB, OFA, FGR, and SCR for NOx control. o Wet limestone FGD for SO2 control. o ACI for further Hg control o PJFF for particulate control. o Wet ESP for control of SAM.
• Auxiliary power assumed to be 7.0 percent of gross plant output.

Florida Power & Light Clean Coal Technology Selection Study
5.0 Performance and EmissionsEstimates
January 2007 5-5 © Black & Veatch 2007 Final Report All Rights Reserved
• The auxiliary load estimate was based on using turbine driven BFPs. This estimate would increase by 2 to 3 percent if BFPs were motor driven.
• Throttle conditions--3,715 psia, 1,112/1,130° F. • Seven FWHs--Two HP, four LP, and one DA. • Dual condenser used. For average ambient conditions, the HP condenser
pressure was assumed to be 2.1 in. HgA; LP condenser pressure was assumed to be 1.7 in. HgA.
5.1.3.3 CFB. • Single unit capacity--2x250 MW net boilers and 1x500 MW STG. • Subcritical STG and subcritical CFB boiler. • TC4F-33.5 STG. • Assumed capacity factor of 88.0 percent. • AQCS:
o SNCR for NOx control. o Boiler limestone injection and wet limestone FGD for SO2 control.10 o ACI for further Hg control o PJFF for particulate control.
• Auxiliary power assumed to be 10.0 percent of gross plant output. • The auxiliary load estimate was based on using motor driven boiler feed
pumps (BFPs). This estimate would decrease by 2 to 3 percent if BFPs were turbine driven.
• Throttle conditions--2,415 psia, 1,050/1,050° F. • Seven FWHs--Two HP, four LP, and one DA. • Condenser pressure for hot and average day ambient conditions assumed to be
2.9 and 2.2 in. HgA, respectively.
5.1.4 IGCC Cycle Arrangement Assumptions IGCC application has different issues that need to be considered. Unlike PC and
CFB units, an IGCC cannot be sized to match a selected net plant output. The constraints are similar to that of a conventional natural gas fired simple or combined cycle unit. CTGs come in discrete sizes and are much more sensitive to changes in elevation and ambient temperature than thermal plants.
Currently, the most economic IGCC configurations are based upon state-of-the-art conventional “F” class CTGs modified to fire syngas. The GE 7FB and the Siemens SPG
10 Wet FGD was applied to the CFB case to attain a comparable SO2 emission to allow comparison with the PC options.

Florida Power & Light Clean Coal Technology Selection Study
5.0 Performance and EmissionsEstimates
January 2007 5-6 © Black & Veatch 2007 Final Report All Rights Reserved
SGT6-5000F CTGs are the most likely models to be incorporated in an IGCC plant. At International Organization for Standardization (ISO) conditions (sea level, 59° F, 60 percent relative humidity), these CTGS are rated at 232 MW when firing syngas. A single 7FB or SGT6-5000F in an IGCC configuration produces a nominal 300 MW net at ISO conditions. Therefore, a 3-on-1 IGCC configuration would produce a nominal 900 MW net at ISO conditions. The net output will vary somewhat depending upon the gasification technology employed, as well as the degree of integration.
The intent of the study was not to compare all of the gasification technologies against the PC and CFB options. To perform this study a gasifier technology choice needed to be made by Black & Veatch. Because of the fuel and location of the project, Black & Veatch selected GE Radiant as being representative of the commercial gasification technologies available. Based on experience, it was Black & Veatch’s opinion that there would be not sufficient difference in cost and performance of one technology over another that would cause IGCC to be positively or negatively affected in the overall technology comparison. Black & Veatch did not select the GE Quench technology because GE currently prefers the Radiant in IGCC applications.
The following were assumed: • Fuel supply used for gasifier feedstock in accordance with Table 5-1. • Capacity factor of 80.0 percent. • Six GE Radiant gasifiers. • Six GE 7321(FB) CTGs with syngas combustors. • TC2F-33.5 STG. • Three-pressure reheat HRSG with duct firing. • AQCS:
o Selexol AGR. o Nitrogen diluent and syngas saturation for NOx control. o Candle filter. o Sulfided carbon bed for Hg adsorption.
• 100 percent syngas fuel -- no backup fuel will be provided. • Inlet air evaporative cooling above 59° F. • Wet deaerating condenser. • Throttle conditions--1,565 psia/1,000° F/1,000° F. • For this evaluation, the STG was designed for normal pressure at average day
conditions during syngas operation.
Florida Power & Light Clean Coal Technology Selection Study
5.0 Performance and EmissionsEstimates
January 2007 5-7 © Black & Veatch 2007 Final Report All Rights Reserved
5.2 Performance Estimates Full-load performance estimates for each of the PC and CFB cases are
presented in Table 5-2. Full-load performance estimates for the IGCC cases are presented in Table 5-3. The IGCC case is presented in a separate table from the PC and CFB cases because IGCC has some unique performance parameters.
5.2.1 PC and CFB Cases
Full-load performance estimates were developed for each of the specific PC and CFB cases. A total of six performances cases were run (two for each technology), consisting of performance estimates for the hot day and average day ambient conditions. Each of the cases was evaluated on a consistent basis to show the effects of technology selection on project performance. The performance estimates were generated for single units that would be installed at a multiple unit greenfield site.
5.2.2 IGCC Cases
Full-load performance estimates were developed for the IGCC cases. A total of two performance cases were run, one at hot day and one at average day ambient conditions. The IGCC case was evaluated on a consistent basis with the PC and CFB cases with respect to site and ambient conditions to show the effects of technology selection on project performance.
5.3 Emissions Estimates
For the purpose of estimating capital and O&M costs for AQCS, probable full-load emission limits were provided to Black & Veatch by FPL. These limits will be subject to later BACT review and are not intended to define performance requirements. Emissions estimates for the PC, CFB, and IGCC cases are summarized in Table 5-4. The emissions rates in the tables are expressed in lb/MBtu of heat input from the fuel. Emissions estimates should only be used for the screening-level evaluation. Final permit levels may vary on a case-by-case basis. Estimates of CO2 emissions are shown in Table 5-5.
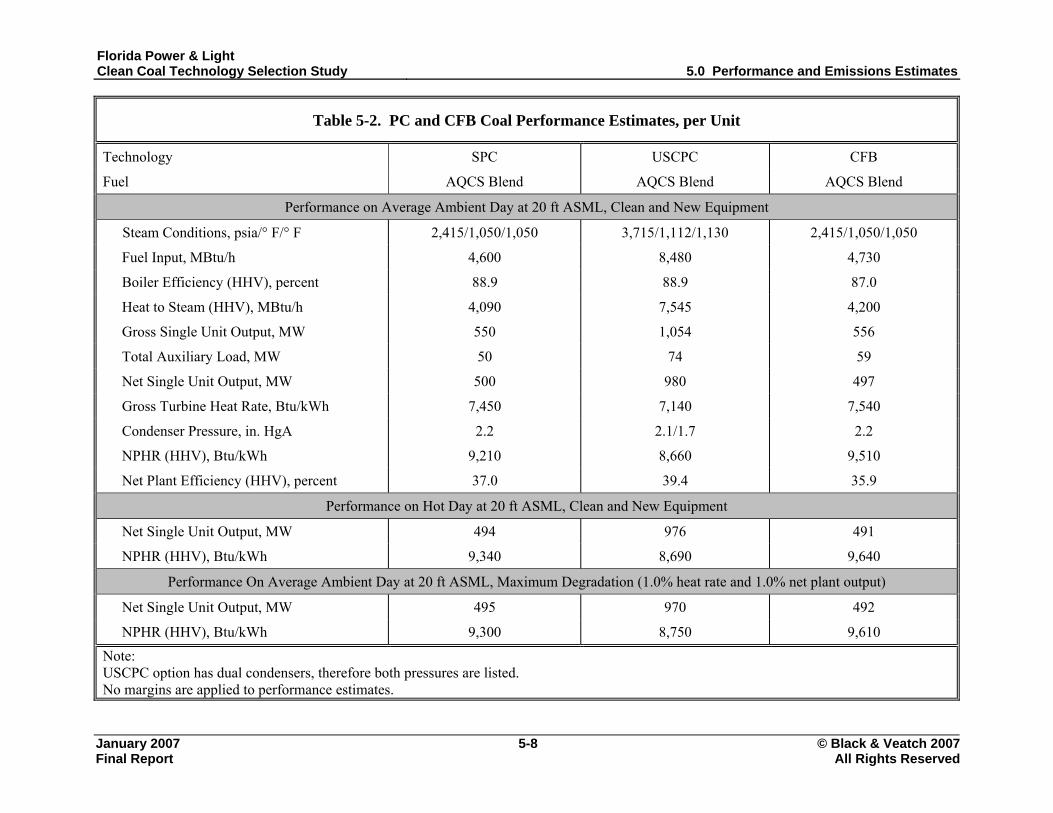
Florida Power & Light Clean Coal Technology Selection Study 5.0 Performance and Emissions Estimates
January 2007 5-8 © Black & Veatch 2007 Final Report All Rights Reserved
Table 5-2. PC and CFB Coal Performance Estimates, per Unit
Technology SPC USCPC CFB
Fuel AQCS Blend AQCS Blend AQCS Blend
Performance on Average Ambient Day at 20 ft ASML, Clean and New Equipment
Steam Conditions, psia/° F/° F 2,415/1,050/1,050 3,715/1,112/1,130 2,415/1,050/1,050
Fuel Input, MBtu/h 4,600 8,480 4,730
Boiler Efficiency (HHV), percent 88.9 88.9 87.0
Heat to Steam (HHV), MBtu/h 4,090 7,545 4,200
Gross Single Unit Output, MW 550 1,054 556
Total Auxiliary Load, MW 50 74 59
Net Single Unit Output, MW 500 980 497
Gross Turbine Heat Rate, Btu/kWh 7,450 7,140 7,540
Condenser Pressure, in. HgA 2.2 2.1/1.7 2.2
NPHR (HHV), Btu/kWh 9,210 8,660 9,510
Net Plant Efficiency (HHV), percent 37.0 39.4 35.9
Performance on Hot Day at 20 ft ASML, Clean and New Equipment
Net Single Unit Output, MW 494 976 491
NPHR (HHV), Btu/kWh 9,340 8,690 9,640
Performance On Average Ambient Day at 20 ft ASML, Maximum Degradation (1.0% heat rate and 1.0% net plant output)
Net Single Unit Output, MW 495 970 492
NPHR (HHV), Btu/kWh 9,300 8,750 9,610 Note: USCPC option has dual condensers, therefore both pressures are listed. No margins are applied to performance estimates.

Florida Power & Light Clean Coal Technology Selection Study
5.0 Performance and EmissionsEstimates
January 2007 5-9 © Black & Veatch 2007 Final Report All Rights Reserved
Table 5-3. GE Radiant IGCC Performance Estimates, per Unit
Fuel IGCC Blend
Combined Cycle Configuration 3 x 1 GE 7FB
Performance on Average Day at 20 ft ASML, Clean and New Equipment
Coal to Gasifiers, MBtu/h 8,400
Gasifier Cold Gas Efficiency (Clean Syngas HHV/Coal HHVx100) 74
CTG Heat Rate (LHV), Btu/kWh 8,370
CTG(s) Gross Power, MW 687
Steam Turbine Gross Power, MW 451
Syngas Expander Power, MW 5
Total Gross Power, MW 1,143
Aux. Power Consumption, MW 203
Net Power, MW 940
Net Plant Heat Rate (HHV), Btu/kWh 8,990
Net Plant Efficiency (HHV), Btu/kWh 38.0
Performance on Hot Day at 20 ft ASML, Clean and New Equipment
Net Power, MW 902
Net Plant Heat Rate (HHV), Btu/kWh 9,360
Performance on Average Day at 20 ft ASML, Maximum Degradation (2.5% heat rate and 2.5% net power output)
Net Power, MW 917
Net Plant Heat Rate (HHV), Btu/kWh 9,215 Notes: Based on publicly available data from technology vendor. No margins are applied to performance estimates.

Florida Power & Light Clean Coal Technology Selection Study
5.0 Performance and EmissionsEstimates
January 2007 5-10 © Black & Veatch 2007 Final Report All Rights Reserved
Table 5-4. Probable Air Emissions Limits
Emissions SPC USCPC CFB IGCC
SO2, lb/MBtu 0.04 0.04 0.04 0.015a
NOx, lb/MBtu 0.05 0.05 0.07 0.06
PM10, lb/MBtu, filterable 0.013 0.013 0.015 0.014
SAM, lb/MBtu 0.004 0.004 0.004 NAb
Hg, lb/MWh 9.9 x 10⁻⁶ 9.9 x 10⁻⁶ 10 x 10-6 20 x 10-6
Notes:
All emission limits are on a HHV basis. a Probable emission limit under continuous operation. Normalized annual emission rate considering four start-ups and shutdowns could reach 0.038 lb/MBtu.11
b If SO2 is properly controlled. H2SO4 emissions estimated at 5.6 lb/hr.
Table 5-5. Probable Air Emissions Limits
Emissions SPC USCPC CFB IGCC
CO2, lb/MBtu 208.1 208.1 208.1 209.8
CO2, lb/MWh 1,935 1,821 1,989 1,933
Notes:
All emission limits are on a HHV basis.
Values are calculated based on fuel composition.
11 Based on data presented in the Permit to Construct Application submitted on September 29, 2006, by AEP for the Mountaineer IGCC project.

Florida Power & Light Clean Coal Technology Selection Study 6.0 Cost Estimates
January 2007 6-1 © Black & Veatch 2007 Final Report All Rights Reserved
6.0 Cost Estimates
This section provides representative high-level cost estimates consisting of the following:
• Overnight capital cost estimates presented on an EPC basis exclusive of Owner’s costs.
• O&M costs as fixed O&M costs and variable nonfuel O&M costs. The cost estimates presented in this section were developed assuming that
multiple units would be constructed at a single greenfield site. Multiple units will be constructed to obtain 2,000 MW of net nominal capacity at a single facility. Therefore, the cost estimates will be reflective of the economies of scale savings that occur for multiple unit facilities.
6.1 Capital Costs
Market-based overnight capital cost estimates for the four coal technologies were estimated. The estimates are expressed in 2006 US dollars and were developed using the assumptions listed in Section 5.1. An EPC cost basis was utilized exclusive of Owner’s costs. Typically, the scope of work for EPC costs is the base plant, which is defined as being “within the fence” with distinct boundaries and terminal points. The values presented are believed to be reasonable for today’s market. More importantly, the EPC costs were developed in a consistent manner and are reasonable relative to one another.
The cost estimate includes estimated costs for equipment and materials, construction labor, engineering services, construction management, indirects, and other costs on an overnight basis. The estimates were based on Black & Veatch proprietary estimating templates and experience. These estimates are screening-level estimates prepared for the purposes of project screening, resource planning, comparison of alternative technologies, etc., and as such are expected to be in the range of ±25 percent. The cost estimates were made using consistent methodology between technologies, so while the absolute cost estimates are expected to vary within a band of accuracy, the relative accuracy between technologies is better. The information is consistent with recent experience and market conditions, but as demonstrated in the last few years, the market is dynamic and unpredictable. Power plant costs will be subject to continued volatility in the future, and the estimates in this report should be considered primarily for comparative purposes. The AQCS for each technology were selected to meet the proposed emissions levels for criteria pollutants including NOx, SO2, Hg, and PM10.
Given the level of uncertainty with developing screening-level capital costs, particularly for technologies with a limited database of actual installed costs, it is

Florida Power & Light Clean Coal Technology Selection Study 6.0 Cost Estimates
January 2007 6-2 © Black & Veatch 2007 Final Report All Rights Reserved
recommended that sensitivity evaluations be conducted to determine the competitiveness of a technology that appears cost-effective under base case assumptions.
6.2 Owner’s Costs
The sum of the EPC capital cost and the Owner’s cost equals the total project cost or the total capital requirement for the project. Typical Owner’s costs that may apply are listed in Table 6-1. These costs are not usually included in the EPC estimate and should be considered by the project developer to determine the total capital requirement for the project. Owner’s cost items include costs for “outside the fence” physical assets, project development, and financing costs. Interconnection costs can be major cost contributors to a project and should be evaluated in greater detail during the site selection. The order of magnitude of these costs is project-specific and can vary significantly, depending upon technology and project-unique requirements.
For a screening-level analysis, the Owner’s cost, exclusive of interest during construction (IDC), can be estimated as a percentage of the EPC cost. Typically, based on actual project financial data, Owner’s costs exclusive of IDC and escalation have been found to be in the range of 15 to 20 percent of the EPC cost for PC and CFB projects.
Additional considerations are merited for IGCC. Without a historical basis, Black & Veatch has added an allowance of 6 percent of the EPC cost. This contingency is in addition to the 15 to 20 percent Owner’s costs, exclusive of IDC, and would cover the unexpected repairs and modifications needed during the initial years of operation. To attain high availability, it is assumed that the Owner would have to aggressively correct deficiencies and implement enhancements as they were identified. Some of the costs for correcting deficiencies can be recovered from the EPC contractor, but the Owner should expect to have significant initial operating costs that will not be reimbursed by the EPC contractor. Depending on the contracting arrangement and guarantees obtained, some of this responsibility/liability might be accepted by the EPC contractor, but it can be assumed that it would result in an equivalent price increase by the EPC contractor to assume the additional risk.
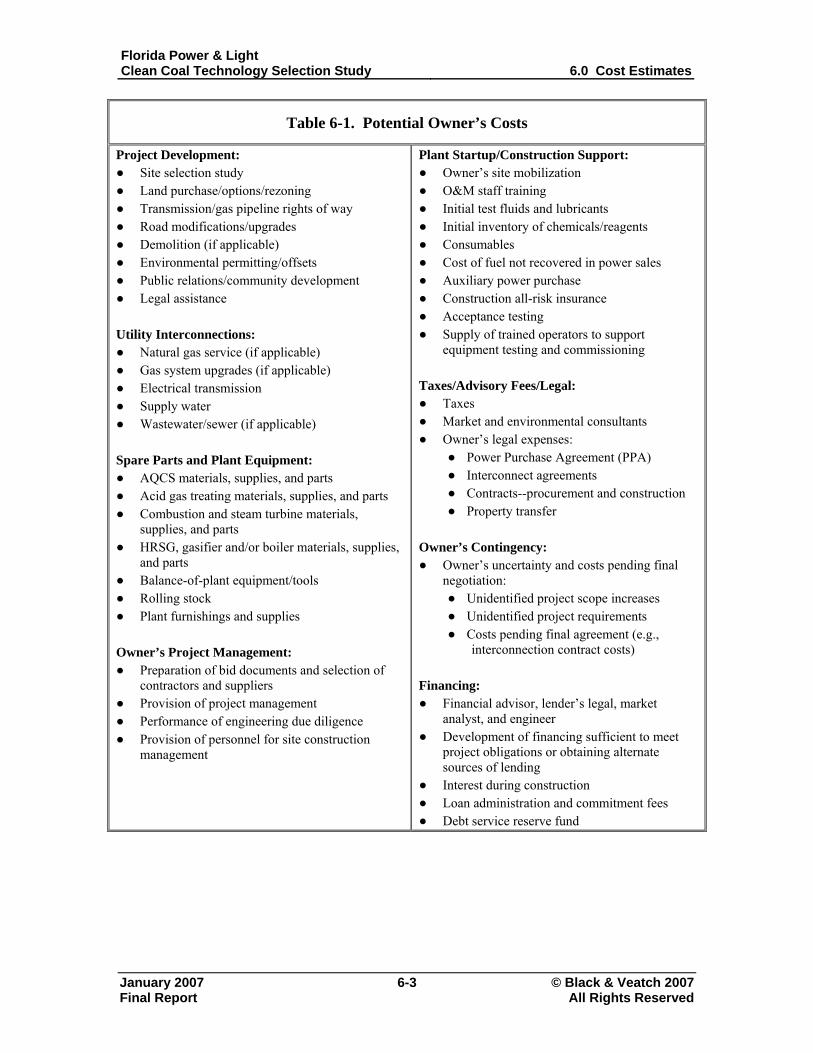
Florida Power & Light Clean Coal Technology Selection Study 6.0 Cost Estimates
January 2007 6-3 © Black & Veatch 2007 Final Report All Rights Reserved
Table 6-1. Potential Owner’s Costs
Project Development: ● ● ● ● ● ● ● ●
● ● ● ● ●
● ● ●
●
● ● ●
●
● ● ●
● ● ● ● ● ● ● ● ● ●
● ● ●
● ● ● ●
●
● ● ●
●
●
● ● ●
Site selection study Land purchase/options/rezoning Transmission/gas pipeline rights of way Road modifications/upgrades Demolition (if applicable) Environmental permitting/offsets Public relations/community development Legal assistance
Utility Interconnections:
Natural gas service (if applicable) Gas system upgrades (if applicable) Electrical transmission Supply water Wastewater/sewer (if applicable)
Spare Parts and Plant Equipment:
AQCS materials, supplies, and parts Acid gas treating materials, supplies, and parts Combustion and steam turbine materials, supplies, and parts HRSG, gasifier and/or boiler materials, supplies, and parts Balance-of-plant equipment/tools Rolling stock Plant furnishings and supplies
Owner’s Project Management:
Preparation of bid documents and selection of contractors and suppliers Provision of project management Performance of engineering due diligence Provision of personnel for site construction management
Plant Startup/Construction Support: Owner’s site mobilization O&M staff training Initial test fluids and lubricants Initial inventory of chemicals/reagents Consumables Cost of fuel not recovered in power sales Auxiliary power purchase Construction all-risk insurance Acceptance testing Supply of trained operators to support equipment testing and commissioning
Taxes/Advisory Fees/Legal:
Taxes Market and environmental consultants Owner’s legal expenses:
Power Purchase Agreement (PPA) Interconnect agreements Contracts--procurement and construction Property transfer
Owner’s Contingency:
Owner’s uncertainty and costs pending final negotiation:
Unidentified project scope increases Unidentified project requirements Costs pending final agreement (e.g., interconnection contract costs)
Financing:
Financial advisor, lender’s legal, market analyst, and engineer Development of financing sufficient to meet project obligations or obtaining alternate sources of lending Interest during construction Loan administration and commitment fees Debt service reserve fund
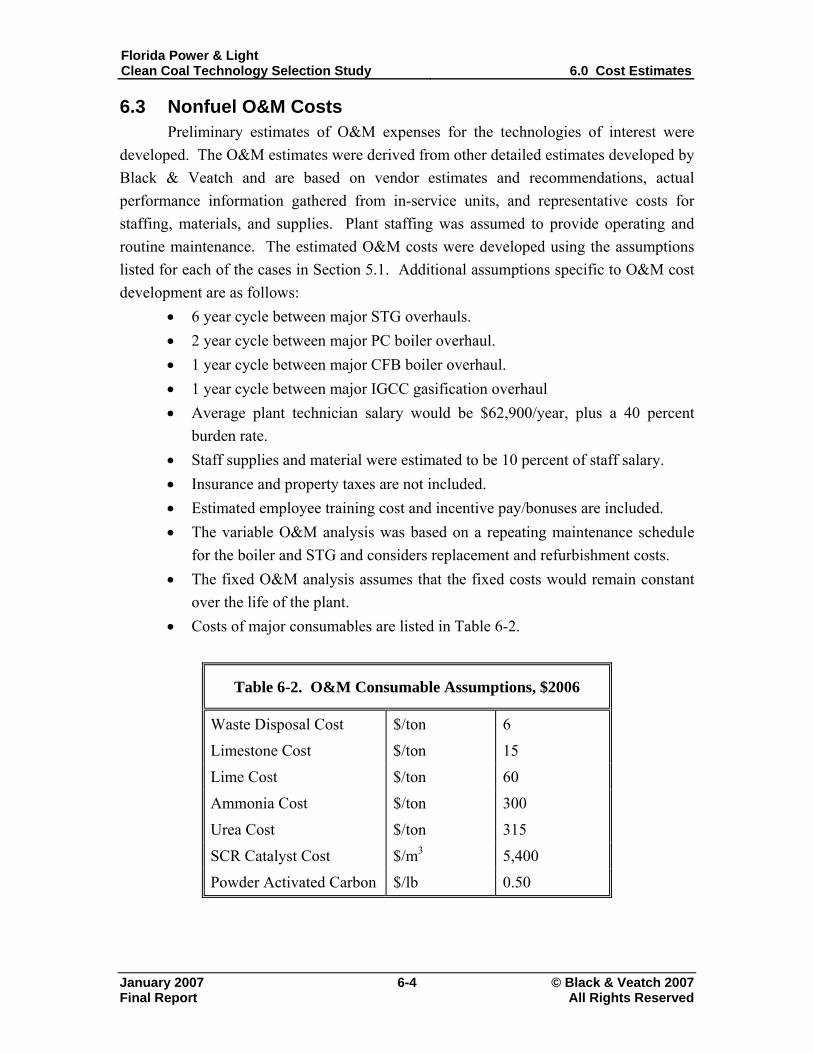
Florida Power & Light Clean Coal Technology Selection Study 6.0 Cost Estimates
January 2007 6-4 © Black & Veatch 2007 Final Report All Rights Reserved
6.3 Nonfuel O&M Costs Preliminary estimates of O&M expenses for the technologies of interest were
developed. The O&M estimates were derived from other detailed estimates developed by Black & Veatch and are based on vendor estimates and recommendations, actual performance information gathered from in-service units, and representative costs for staffing, materials, and supplies. Plant staffing was assumed to provide operating and routine maintenance. The estimated O&M costs were developed using the assumptions listed for each of the cases in Section 5.1. Additional assumptions specific to O&M cost development are as follows:
• 6 year cycle between major STG overhauls. • 2 year cycle between major PC boiler overhaul. • 1 year cycle between major CFB boiler overhaul. • 1 year cycle between major IGCC gasification overhaul • Average plant technician salary would be $62,900/year, plus a 40 percent
burden rate. • Staff supplies and material were estimated to be 10 percent of staff salary. • Insurance and property taxes are not included. • Estimated employee training cost and incentive pay/bonuses are included. • The variable O&M analysis was based on a repeating maintenance schedule
for the boiler and STG and considers replacement and refurbishment costs. • The fixed O&M analysis assumes that the fixed costs would remain constant
over the life of the plant. • Costs of major consumables are listed in Table 6-2.
Table 6-2. O&M Consumable Assumptions, $2006
Waste Disposal Cost $/ton 6
Limestone Cost $/ton 15
Lime Cost $/ton 60
Ammonia Cost $/ton 300
Urea Cost $/ton 315
SCR Catalyst Cost $/m3 5,400
Powder Activated Carbon $/lb 0.50
Florida Power & Light Clean Coal Technology Selection Study 6.0 Cost Estimates
January 2007 6-5 © Black & Veatch 2007 Final Report All Rights Reserved
6.4 Economies of Scale 6.4.1 Multiple Unit Sites
The benefit of economies of scale can be realized through facilities with high output and/or through multiple unit facilities. This assumes that the multiple units are duplicates of each other.
In most cases, a coal plant is initially designed for multiple units. Usually, the design calls for a minimum of two identical units, but can include three or four units. Capital intensive projects, such as PC units, realize substantial savings when the site includes multiple units. The savings will vary depending on the number of units installed at the site and the degree of interconnections and commonality of supporting systems.
The cost of the first unit on a two-unit site will be slightly higher than the cost for a single-unit site. This is because of the increased capacity of common systems or level of equipment redundancy and increased infrastructure. The increase in first-unit cost is expected to be in the range of 6 to 8 percent.
For a two-unit site, assuming identical units constructed within 1 to 2 years of each other, the second unit cost will be in the range of 75 to 80 percent of the first unit. A four-unit facility would typically be designed as two, two-unit plants. These economies of scale factors apply to EPC cost estimates that are exclusive of Owner’s costs. The initial design of the plant should consider the economies of scale based on multiple units and/or unit size. The use of multiple identical units constructed in reasonable sequence will result in the greatest savings.
6.4.2 Economies of Scale Based on Unit Size
The cost per unit of output ($/kW) decreases as the output of the unit increases. This is mainly because there are many items (of cost) that are independent (in varying degrees) of unit size. Some examples include engineering for project design and manufacturing, manufacturing and construction management, distributed control system (DCS), instrumentation, plant infrastructure, project development cost, etc. Other independent costs, such as the Owner’s costs (which were not estimated in this study), make the economies of scale based on unit size more significant.
6.5 Recent Experience
The estimated EPC costs were reviewed and adjusted according to recent conceptual-level cost estimates and Black & Veatch experience on actual projects. Black & Veatch has experienced substantial increases in costs over the past year. As an example, Black & Veatch had a experience with a boiler original equipment manufacturer (OEM) who increased a boiler quotation by about 20 percent. Additionally,

Florida Power & Light Clean Coal Technology Selection Study 6.0 Cost Estimates
January 2007 6-6 © Black & Veatch 2007 Final Report All Rights Reserved
it should be noted that AQCS prices have been increasing dramatically, and all AQCS OEMs are experiencing increased business. Costs continue to rise because of labor and material cost increases as well as market demand. For the present, the market has shifted to a seller’s market. These cost increases apply to all of the technologies considered in this report.
6.6 Preliminary Cost Estimates
Preliminary capital cost estimates for the PC, CFB, and IGCC cases are presented in Table 6-3. These cost estimates were developed on an EPC basis and do not include Owner’s costs. Nonfuel O&M cost estimates, including fixed costs and variable costs, are shown in Table 6-4. Both the capital and O&M costs estimates for the PC and CFB cases were developed on the basis of a multiple unit facility, so as to obtain nominal 2,000 MW of electrical power generation at a single facility.
Table 6-3. Capital Cost Estimates
Technology SPC USCPC CFB IGCC
Net Single Unit Output, MW
500 980 497 940
Net Multiple Unit Output, MW
2,000 1,960 1,988 1,880
EPC Cost, 2006$MM
3,078 2,646 3,240 3,541
Unit EPC Cost, 2006$/kW
1,540 1,350 1,630 1,880
Escalation to 2012$
490 421 516 564
Subtotal - EPC Cost 2012$
3,568 3,067 3,756 4,105
Owner’s Costs, 2012$
1,218 1,153 1,236 1,411
IDC, 2012$ 1,063 914 1,119 1,223
Project Cost, 2012$
5,849 5,134 6,111 6,739
Unit EPC Cost, 2012$/kW
2,925 2,619 3,074 3,585
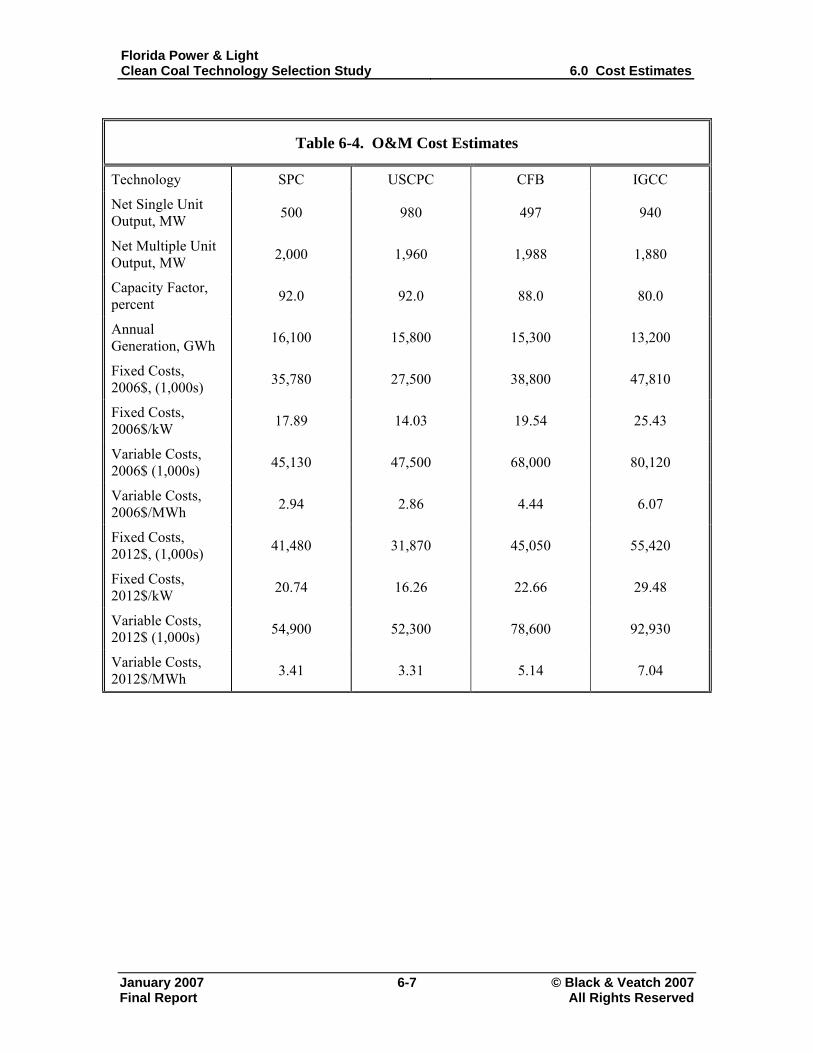
Florida Power & Light Clean Coal Technology Selection Study 6.0 Cost Estimates
January 2007 6-7 © Black & Veatch 2007 Final Report All Rights Reserved
Table 6-4. O&M Cost Estimates
Technology SPC USCPC CFB IGCC
Net Single Unit Output, MW 500 980 497 940
Net Multiple Unit Output, MW 2,000 1,960 1,988 1,880
Capacity Factor, percent 92.0 92.0 88.0 80.0
Annual Generation, GWh 16,100 15,800 15,300 13,200
Fixed Costs, 2006$, (1,000s) 35,780 27,500 38,800 47,810
Fixed Costs, 2006$/kW 17.89 14.03 19.54 25.43
Variable Costs, 2006$ (1,000s) 45,130 47,500 68,000 80,120
Variable Costs, 2006$/MWh 2.94 2.86 4.44 6.07
Fixed Costs, 2012$, (1,000s) 41,480 31,870 45,050 55,420
Fixed Costs, 2012$/kW 20.74 16.26 22.66 29.48
Variable Costs, 2012$ (1,000s) 54,900 52,300 78,600 92,930
Variable Costs, 2012$/MWh 3.41 3.31 5.14 7.04
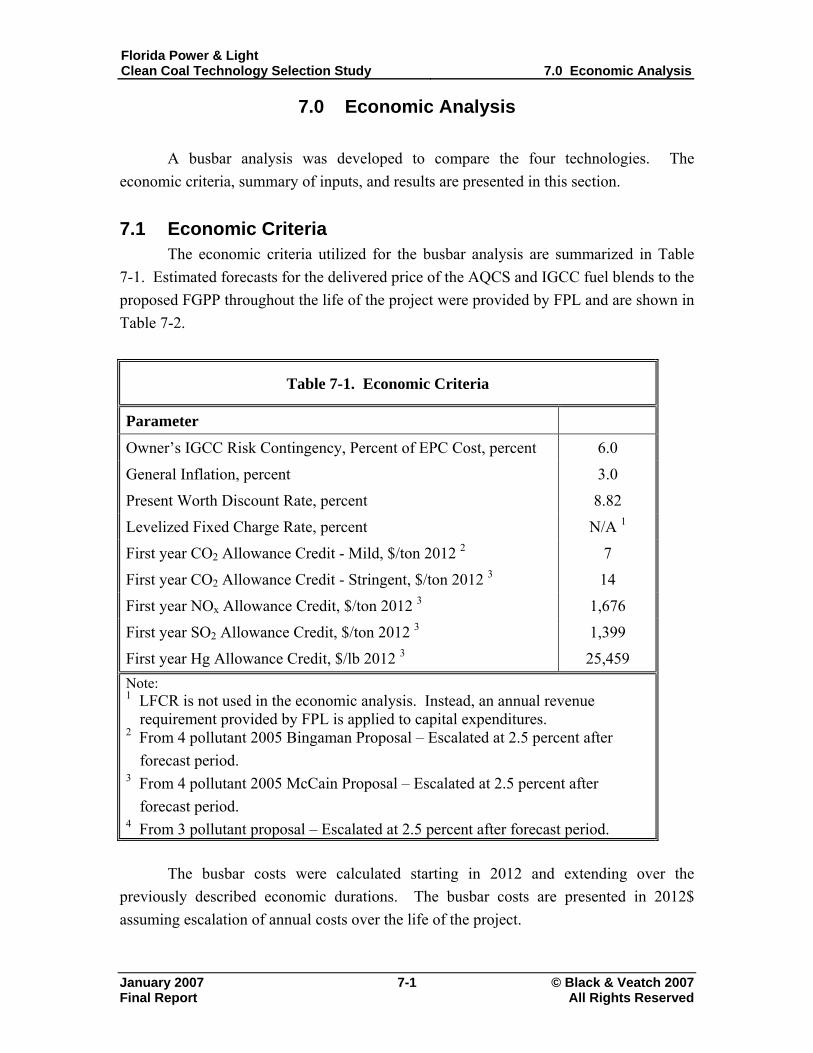
Florida Power & Light Clean Coal Technology Selection Study 7.0 Economic Analysis
January 2007 7-1 © Black & Veatch 2007
7.0 Economic Analysis
A busbar analysis was developed to compare the four technologies. The economic criteria, summary of inputs, and results are presented in this section.
7.1 Economic Criteria
The economic criteria utilized for the busbar analysis are summarized in Table 7-1. Estimated forecasts for the delivered price of the AQCS and IGCC fuel blends to the proposed FGPP throughout the life of the project were provided by FPL and are shown in Table 7-2.
Table 7-1. Economic Criteria
Parameter
Owner’s IGCC Risk Contingency, Percent of EPC Cost, percent 6.0
General Inflation, percent 3.0
Present Worth Discount Rate, percent 8.82
N/A 1Levelized Fixed Charge Rate, percent
First year CO2 Allowance Credit - Mild, $/ton 2012 2 7
First year CO2 Allowance Credit - Stringent, $/ton 2012 3 14
First year NOx Allowance Credit, $/ton 2012 3 1,676
First year SO2 Allowance Credit, $/ton 2012 3 1,399
First year Hg Allowance Credit, $/lb 2012 3 25,459 Note: 1 LFCR is not used in the economic analysis. Instead, an annual revenue
requirement provided by FPL is applied to capital expenditures. 2 From 4 pollutant 2005 Bingaman Proposal – Escalated at 2.5 percent after
forecast period. 3 From 4 pollutant 2005 McCain Proposal – Escalated at 2.5 percent after
forecast period. 4 From 3 pollutant proposal – Escalated at 2.5 percent after forecast period.
The busbar costs were calculated starting in 2012 and extending over the
previously described economic durations. The busbar costs are presented in 2012$ assuming escalation of annual costs over the life of the project.
Final Report All Rights Reserved
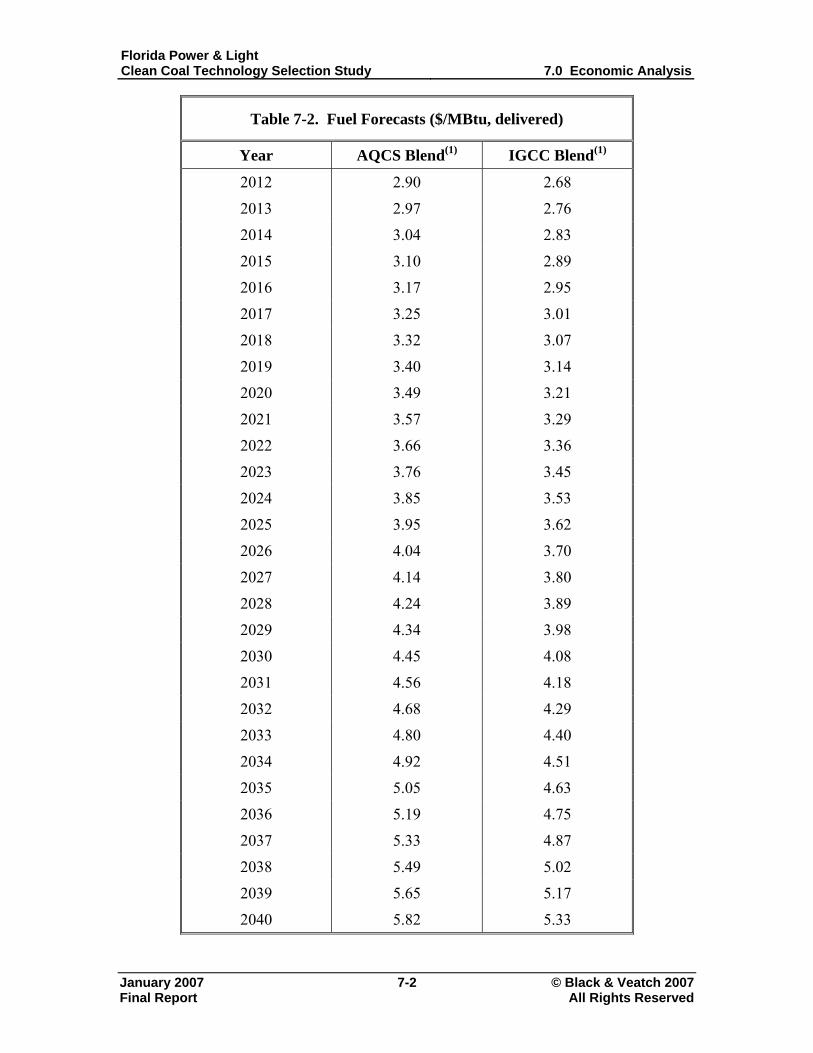
Florida Power & Light Clean Coal Technology Selection Study 7.0 Economic Analysis
January 2007 7-2 © Black & Veatch 2007
Table 7-2. Fuel Forecasts ($/MBtu, delivered)
Year AQCS Blend(1) IGCC Blend(1)
2012 2.90 2.68
2013 2.97 2.76
2014 3.04 2.83
2015 3.10 2.89
2016 3.17 2.95
2017 3.25 3.01
2018 3.32 3.07
2019 3.40 3.14
2020 3.49 3.21
2021 3.57 3.29
2022 3.66 3.36
2023 3.76 3.45
2024 3.85 3.53
2025 3.95 3.62
2026 4.04 3.70
2027 4.14 3.80
2028 4.24 3.89
2029 4.34 3.98
2030 4.45 4.08
2031 4.56 4.18
2032 4.68 4.29
2033 4.80 4.40
2034 4.92 4.51
2035 5.05 4.63
2036 5.19 4.75
2037 5.33 4.87
2038 5.49 5.02
2039 5.65 5.17
2040 5.82 5.33
Final Report All Rights Reserved
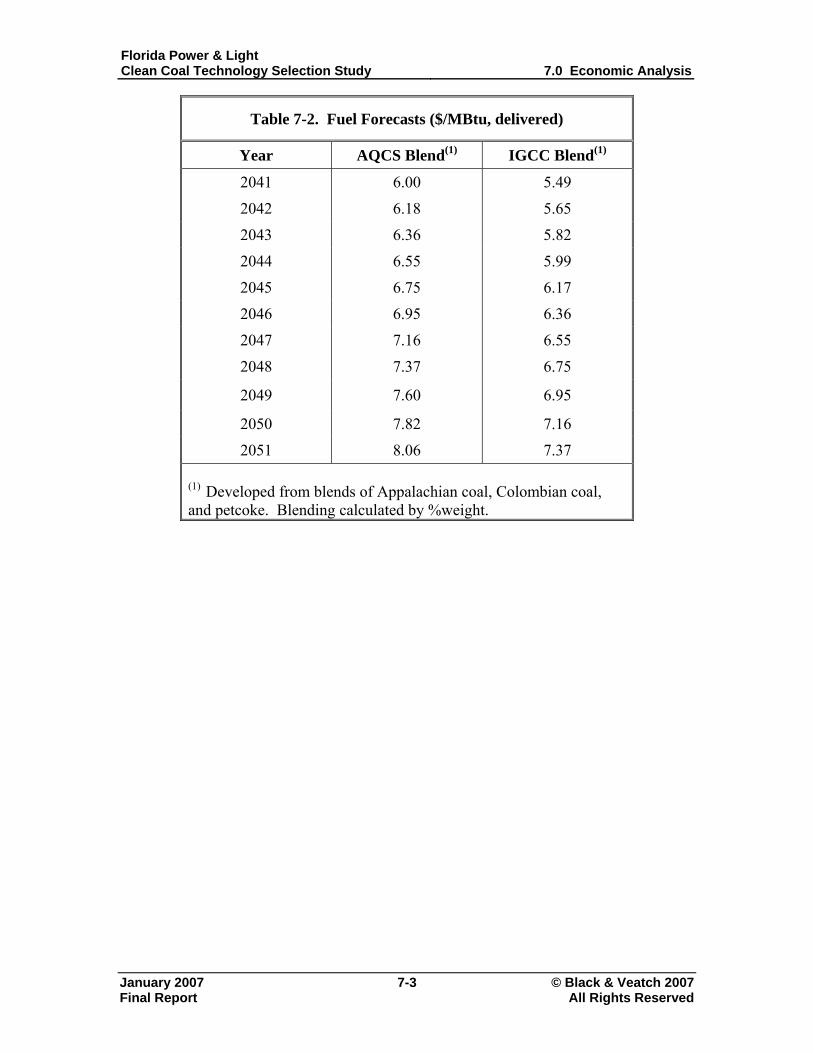
Florida Power & Light Clean Coal Technology Selection Study 7.0 Economic Analysis
January 2007 7-3 © Black & Veatch 2007
Table 7-2. Fuel Forecasts ($/MBtu, delivered)
Year AQCS Blend(1) IGCC Blend(1)
2041 6.00 5.49
2042 6.18 5.65
2043 6.36 5.82
2044 6.55 5.99
2045 6.75 6.17
2046 6.95 6.36
2047 7.16 6.55
2048 7.37 6.75
2049 7.60 6.95
2050 7.82 7.16
2051 8.06 7.37
(1) Developed from blends of Appalachian coal, Colombian coal, and petcoke. Blending calculated by %weight.
Final Report All Rights Reserved
Florida Power & Light Clean Coal Technology Selection Study 7.0 Economic Analysis
January 2007 7-4 © Black & Veatch 2007
7.2 Busbar Analysis A levelized busbar cost analysis was performed using several sets of data. These
include: • Economic criteria provided by FPL, shown in Table 7-1. • Fuel forecasts provided by FPL, shown in Table 7-2. • Performance estimates for the PC, CFB, and IGCC cases listed in Table 5-2
and Table 5-3. • EPC capital cost estimates listed in Table 6-3. • O&M cost estimates listed in Table 6-4. The PC and CFB cases were run with a 40 year book and 20 year tax life. The
IGCC case was run with a 25 year book and 20 year tax life. Performance was based on the annual average day conditions. The capacity
factors for the PC, CFB, and IGCC units were assumed to be 92, 88, and 80 percent, respectively.
The IGCC analysis has not supplemented the capacity factor by assuming operation on natural gas to bring the capacity factor up to the same levels as the PC and CFB units. IGCC availability will be lower in the earlier years of operation as the operators learn how to run the plant and design modifications are made. The first year availability is expected to be around 50 percent. The base analysis has not reflected the ramp up from 50 to 80 percent in IGCC equivalent availability that is expected over the first five years of operation, and instead assumes that IGCC equivalent availability is 80 percent from the outset. This assumption is favorable for IGCC by overestimating annual generation.
A summary of the inputs consisting of estimates of performance and capital and O&M costs for each of the technologies used in the busbar analysis is provided in Table 7-3. Several cases were run:
• Degraded performance at average ambient conditions with no emissions allowance cost included.
• New and clean performance at average ambient conditions with no emissions allowance cost included.
• Degraded performance at average ambient conditions with emissions allowance cost included for NOx, SO2, and Hg. Emission allowance costs were estimated by multiplying a forecasted allowance cost by the total annual emissions of each pollutant based on the assumed control limits minus annual emission allocations for FGPP.
• New and clean performance at average ambient conditions with emissions allowance costs included for NOx, SO2, and Hg.
Final Report All Rights Reserved
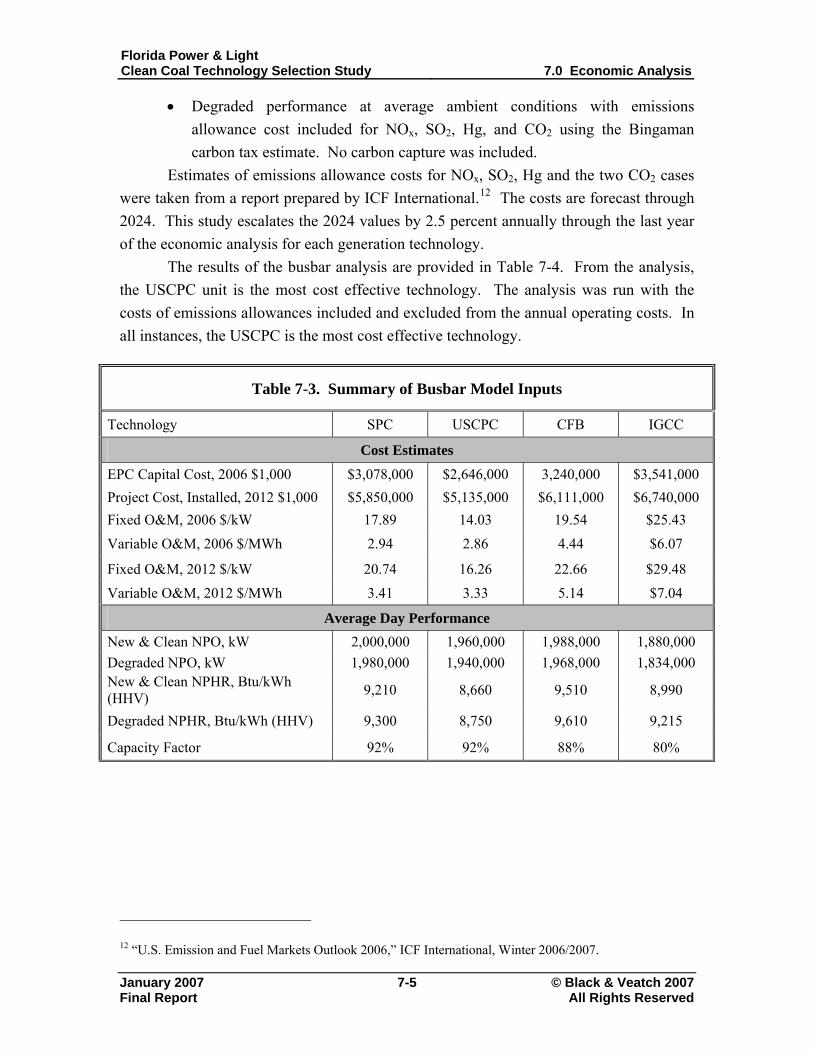
Florida Power & Light Clean Coal Technology Selection Study 7.0 Economic Analysis
January 2007 7-5 © Black & Veatch 2007
• Degraded performance at average ambient conditions with emissions allowance cost included for NOx, SO2, Hg, and CO2 using the Bingaman carbon tax estimate. No carbon capture was included.
Estimates of emissions allowance costs for NOx, SO2, Hg and the two CO2 cases were taken from a report prepared by ICF International.12 The costs are forecast through 2024. This study escalates the 2024 values by 2.5 percent annually through the last year of the economic analysis for each generation technology. The results of the busbar analysis are provided in Table 7-4. From the analysis, the USCPC unit is the most cost effective technology. The analysis was run with the costs of emissions allowances included and excluded from the annual operating costs. In all instances, the USCPC is the most cost effective technology.
Table 7-3. Summary of Busbar Model Inputs
Technology SPC USCPC CFB IGCC
Cost Estimates
EPC Capital Cost, 2006 $1,000 $3,078,000 $2,646,000 3,240,000 $3,541,000 Project Cost, Installed, 2012 $1,000 $5,850,000 $5,135,000 $6,111,000 $6,740,000 Fixed O&M, 2006 $/kW 17.89 14.03 19.54 $25.43 Variable O&M, 2006 $/MWh 2.94 2.86 4.44 $6.07
Fixed O&M, 2012 $/kW 20.74 16.26 22.66 $29.48 Variable O&M, 2012 $/MWh 3.41 3.33 5.14 $7.04
Average Day Performance New & Clean NPO, kW 2,000,000 1,960,000 1,988,000 1,880,000 Degraded NPO, kW 1,980,000 1,940,000 1,968,000 1,834,000 New & Clean NPHR, Btu/kWh (HHV) 9,210 8,660 9,510 8,990
Degraded NPHR, Btu/kWh (HHV) 9,300 8,750 9,610 9,215
Capacity Factor 92% 92% 88% 80%
12 “U.S. Emission and Fuel Markets Outlook 2006,” ICF International, Winter 2006/2007.
Final Report All Rights Reserved
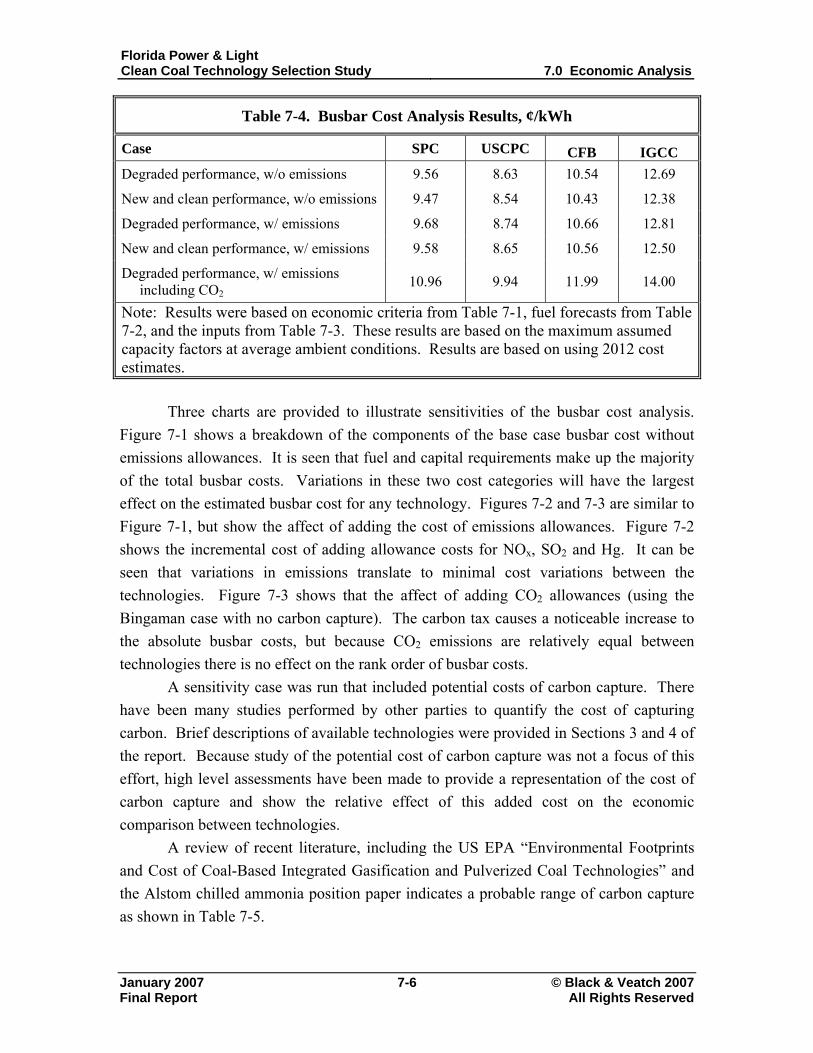
Florida Power & Light Clean Coal Technology Selection Study 7.0 Economic Analysis
January 2007 7-6 © Black & Veatch 2007
Table 7-4. Busbar Cost Analysis Results, ¢/kWh
Case SPC USCPC CFB IGCC Degraded performance, w/o emissions 9.56 8.63 10.54 12.69
New and clean performance, w/o emissions 9.47 8.54 10.43 12.38
Degraded performance, w/ emissions 9.68 8.74 10.66 12.81
New and clean performance, w/ emissions 9.58 8.65 10.56 12.50
Degraded performance, w/ emissions including CO2
10.96 9.94 11.99 14.00
Note: Results were based on economic criteria from Table 7-1, fuel forecasts from Table 7-2, and the inputs from Table 7-3. These results are based on the maximum assumed capacity factors at average ambient conditions. Results are based on using 2012 cost estimates.
Three charts are provided to illustrate sensitivities of the busbar cost analysis. Figure 7-1 shows a breakdown of the components of the base case busbar cost without emissions allowances. It is seen that fuel and capital requirements make up the majority of the total busbar costs. Variations in these two cost categories will have the largest effect on the estimated busbar cost for any technology. Figures 7-2 and 7-3 are similar to Figure 7-1, but show the affect of adding the cost of emissions allowances. Figure 7-2 shows the incremental cost of adding allowance costs for NOx, SO2 and Hg. It can be seen that variations in emissions translate to minimal cost variations between the technologies. Figure 7-3 shows that the affect of adding CO2 allowances (using the Bingaman case with no carbon capture). The carbon tax causes a noticeable increase to the absolute busbar costs, but because CO2 emissions are relatively equal between technologies there is no effect on the rank order of busbar costs.
A sensitivity case was run that included potential costs of carbon capture. There have been many studies performed by other parties to quantify the cost of capturing carbon. Brief descriptions of available technologies were provided in Sections 3 and 4 of the report. Because study of the potential cost of carbon capture was not a focus of this effort, high level assessments have been made to provide a representation of the cost of carbon capture and show the relative effect of this added cost on the economic comparison between technologies.
A review of recent literature, including the US EPA “Environmental Footprints and Cost of Coal-Based Integrated Gasification and Pulverized Coal Technologies” and the Alstom chilled ammonia position paper indicates a probable range of carbon capture as shown in Table 7-5.
Final Report All Rights Reserved
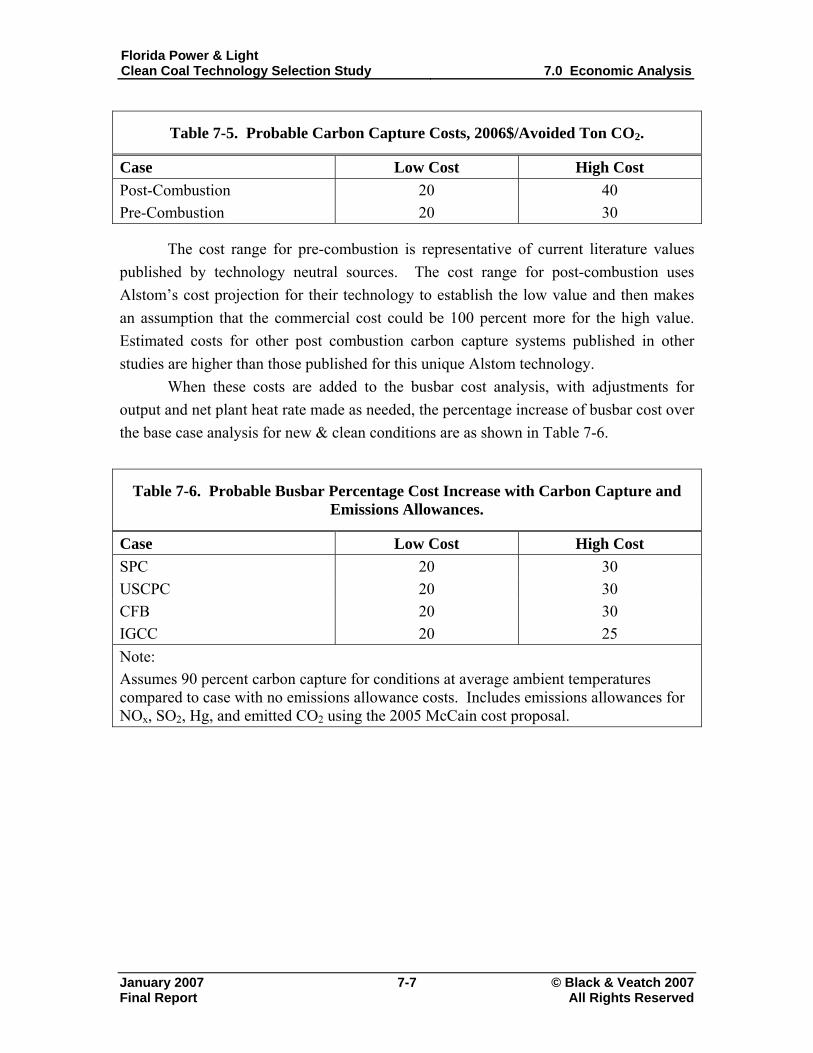
Florida Power & Light Clean Coal Technology Selection Study 7.0 Economic Analysis
January 2007 7-7 © Black & Veatch 2007
Table 7-5. Probable Carbon Capture Costs, 2006$/Avoided Ton CO2.
Case Low Cost High Cost Post-Combustion 20 40 Pre-Combustion 20 30
The cost range for pre-combustion is representative of current literature values published by technology neutral sources. The cost range for post-combustion uses Alstom’s cost projection for their technology to establish the low value and then makes an assumption that the commercial cost could be 100 percent more for the high value. Estimated costs for other post combustion carbon capture systems published in other studies are higher than those published for this unique Alstom technology.
When these costs are added to the busbar cost analysis, with adjustments for output and net plant heat rate made as needed, the percentage increase of busbar cost over the base case analysis for new & clean conditions are as shown in Table 7-6.
Table 7-6. Probable Busbar Percentage Cost Increase with Carbon Capture and Emissions Allowances.
Case Low Cost High Cost SPC 20 30 USCPC 20 30 CFB 20 30 IGCC 20 25 Note: Assumes 90 percent carbon capture for conditions at average ambient temperatures compared to case with no emissions allowance costs. Includes emissions allowances for NOx, SO2, Hg, and emitted CO2 using the 2005 McCain cost proposal.
Final Report All Rights Reserved
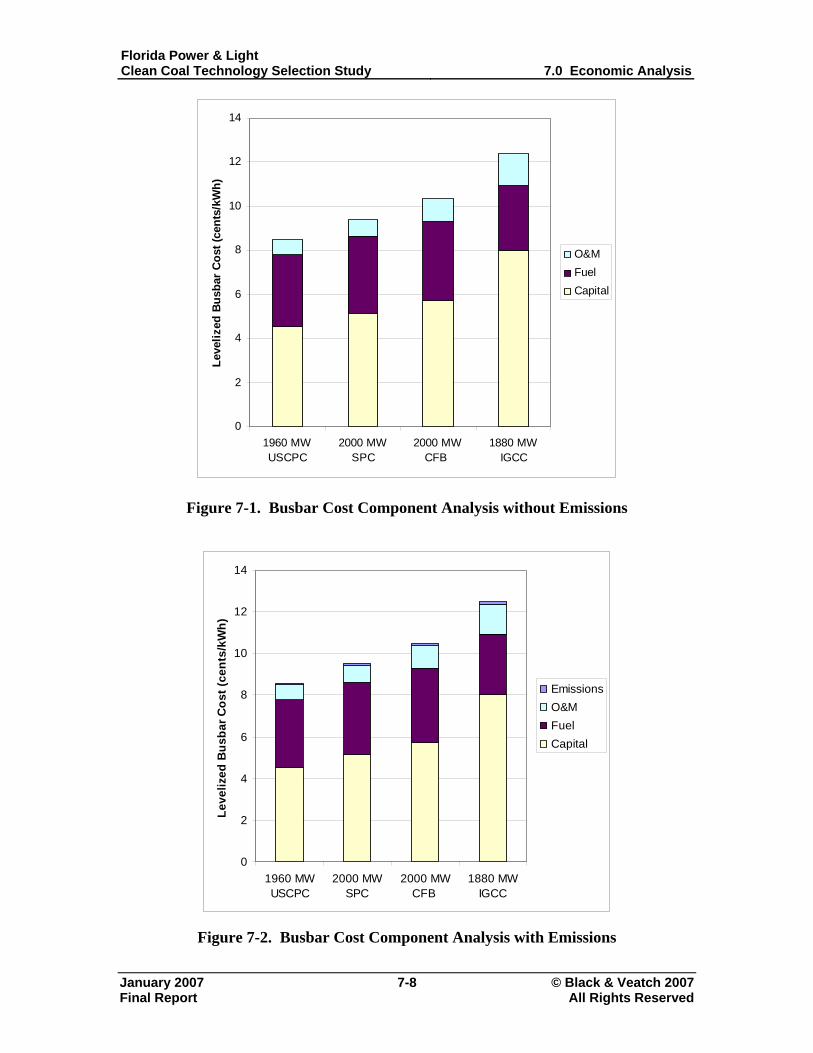
Florida Power & Light Clean Coal Technology Selection Study 7.0 Economic Analysis
January 2007 7-8 © Black & Veatch 2007
0
2
4
6
8
10
12
14
1960 MWUSCPC
2000 MWSPC
2000 MWCFB
1880 MWIGCC
Leve
lized
Bus
bar C
ost (
cent
s/kW
h)
O&MFuelCapital
Figure 7-1. Busbar Cost Component Analysis without Emissions
0
2
4
6
8
10
12
14
1960 MWUSCPC
2000 MWSPC
2000 MWCFB
1880 MWIGCC
Leve
lized
Bus
bar C
ost (
cent
s/kW
h)
EmissionsO&MFuelCapital
Figure 7-2. Busbar Cost Component Analysis with Emissions
Final Report All Rights Reserved
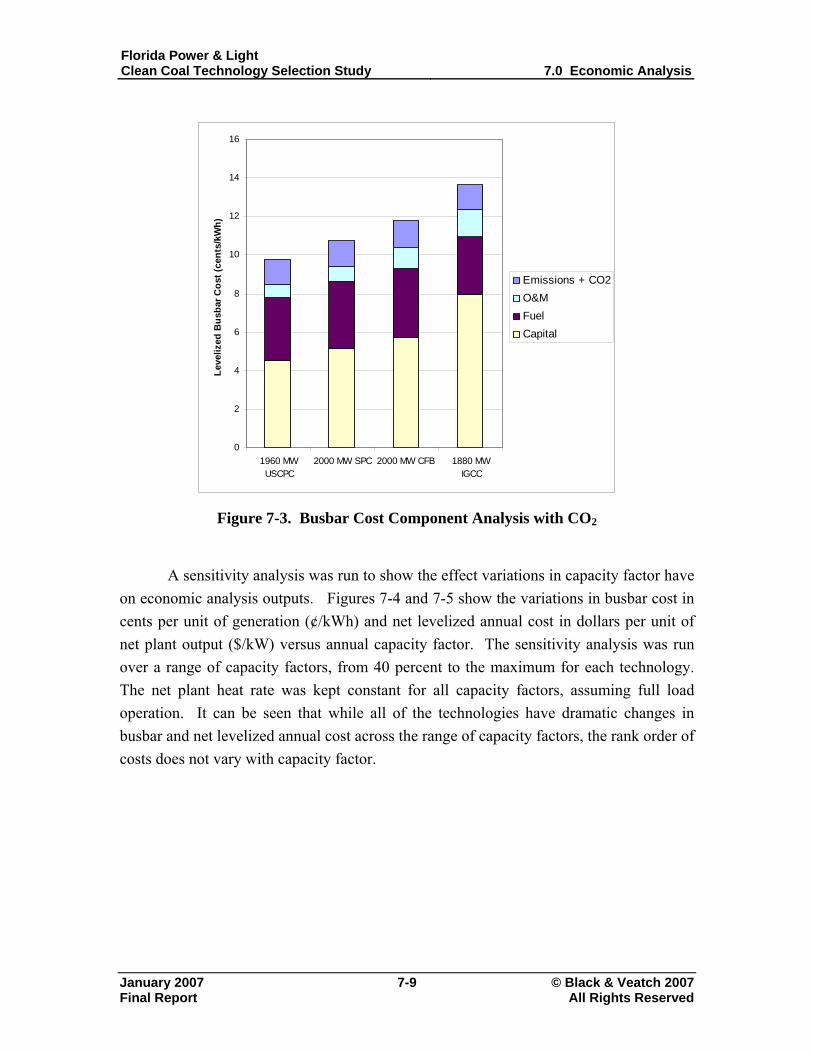
Florida Power & Light Clean Coal Technology Selection Study 7.0 Economic Analysis
January 2007 7-9 © Black & Veatch 2007 Final Report All Rights Reserved
A sensitivity analysis was run to show the effect variations in capacity factor have on economic analysis outputs. Figures 7-4 and 7-5 show the variations in busbar cost in cents per unit of generation (¢/kWh) and net levelized annual cost in dollars per unit of net plant output ($/kW) versus annual capacity factor. The sensitivity analysis was run over a range of capacity factors, from 40 percent to the maximum for each technology. The net plant heat rate was kept constant for all capacity factors, assuming full load operation. It can be seen that while all of the technologies have dramatic changes in busbar and net levelized annual cost across the range of capacity factors, the rank order of costs does not vary with capacity factor.
01960 MWUSCPC
2000 MW SPC 2000 MW CFB 1880 MWIGCC
2
4
6
8
10
12
14
16
Leve
lized
Bus
bar C
ost (
cent
s/kW
h)
Emissions + CO2O&MFuelCapital
Figure 7-3. Busbar Cost Component Analysis with CO2

Florida Power & Light Clean Coal Technology Selection Study 7.0 Economic Analysis
8
10
12
14
16
18
20
22
24
40 50 60 70 80 90 100
Capacity Factor, percent
Leve
lized
Bus
bar C
ost,
cent
s/kW
h
USCPCSPCCFBIGCC
Figure 7-4. Busbar Cost Variation with Capacity Factor
January 2007 7-10 © Black & Veatch 2007 Final Report All Rights Reserved

Florida Power & Light Clean Coal Technology Selection Study 7.0 Economic Analysis
January 2007 7-11 © Black & Veatch 2007 Final Report All Rights Reserved
400
450
500
550
600
650
700
750
800
850
900
40 50 60 70 80 90 100
Capacity Factor, percent
Net
Lev
eliz
ed A
nnua
l Cos
t, $/
kW
USCPCSPCCFBIGCC
Figure 7-5. Net Levelized Annual Cost Variation with Capacity Factor
Florida Power & Light Clean Coal Technology Selection Study 8.0 Conclusions
January 2007 8-1 © Black & Veatch 2007
8.0 Conclusions
This study made a comparison of performance and cost of four commercially available coal-fired power generation technologies. These were USPC, subcritical PC, CFB and IGCC. The estimates for performance were made using publicly available data and engineering data that has been collected by Black & Veatch and FPL. The results of the study are not intended to be absolute for any given technology but rather are intended to be accurate relative from one technology to another.
This study addresses technology risks known or assumed for each type of plant. Clearly PC plants are commercial and have been a dependable generation technology for years. The advancement of operation at ultrasupercritical steam conditions is somewhat new, but has been commercially demonstrated and proven around the world. CFB is also proven its dependability over the past two decades and is considered a mature technology. IGCC has been demonstrated on a commercial scale for over ten years. A second round of commercial scale IGCC plants is being planned currently. Many utilities will reserve decisions on making future IGCC installations until they have observed the installation and operation of these new plants.
Capital cost estimates for all power generation technologies are exhibiting considerable upward trends. Market pricing of technology components, coupled with commodity and labor demand worldwide, is rapidly escalating capital costs. These costs increases are not confined to any particular generation technology; they apply across the industry. The +/-25 percent accuracy range reflects the market volatility and the screening level nature of the estimate methodology.
Based on the assumptions, conditions, and engineering estimates made in this study, the USCPC option is the preferred technology selection for addition of a nominal 2,000 MW net output at the Glades site. The busbar cost of the USCPC case is nearly 10 percent less than SPC, which is the second lowest busbar cost case. USCPC will have good environmental performance because of its high efficiency. Emissions of NOx and PM will be very similar across all technologies. Sulfur emissions would be slightly lower for IGCC than the PC and CFB options, although start-up and shutdown flaring will reduce the potential benefit of IGCC. The lower expected reliability of IGCC, particularly in the first years of operation, could compromise FPL’s ability to meet the baseload generation requirement and require FPL to run existing units at higher capacity factors.
For the 2012-2014 planning time period, USCPC will be the best technical and economic choice for the installation of 2,000 MW of capacity at the Glades site.
Final Report All Rights Reserved
Florida Power & Light Clean Coal Technology Selection Study 9.0 Contributors
January 2007 9-1 © Black & Veatch 2007
9.0 Contributors
This report was prepared collaboratively by Black & Veatch and FPL, as co-authors. Project team leads were David Hicks, Senior Director of Project Development, FPL, and Samuel Scupham, Technology Consultant, Black & Veatch Corporation. Messers Hicks and Scupham were supported in the preparation of this report by technical staff of their respective companies, to who they express their appreciation.
Final Report All Rights Reserved