climate change: an update recent developments in global warming philip allan publishers © 2015
TRANSCRIPT

Philip Allan Publishers © 2015
Climate change: an update
Recent developments in global warming

Philip Allan Publishers © 2015
Carbon dioxide levels rise
• In 2015 carbon dioxide concentrations passed the 400 parts per million level.
• Atmospheric carbon dioxide levels are 43% higher than the pre-industrial level of 280ppm.
• Notice on the graph that the rate of rise is increasing.
• Many scientists consider 450 ppm to be ‘dangerous’ in terms of future global warming.
• On current trends, this level is likely to be reached in the year 2039.
Carbon dioxide levels have been directly and continuously recorded on
Hawaii since 1958

IPCC Assessment Report 5
• Latest IPCC report published 2013/14
• ‘Incontrovertible evidence’ and ‘virtually certain’ human activity is the main driver of climate change
• 99% sure vs 90% sure in Assessment Report 4 (AR4)
• The most likely rise by 2100 is 2–3C• The range of projections has narrowed (as
scientific understanding improves and models get better)
• Sea-level rise projections by 2100 are higher in AR5 than in AR4:
• 18–59 cm in AR4
• 29–82 cm in AR5 in 2013
IPCC assessment report projections
AR1 1990 +3C by 2100
AR2 1995 +2C by 2100
AR3 2001 +1.4 to 5.8°C by 2100
AR4 2007 +1.1 to 6.4°C by 2100
AR5 2013 +0.5 to 4.9°C by 2100
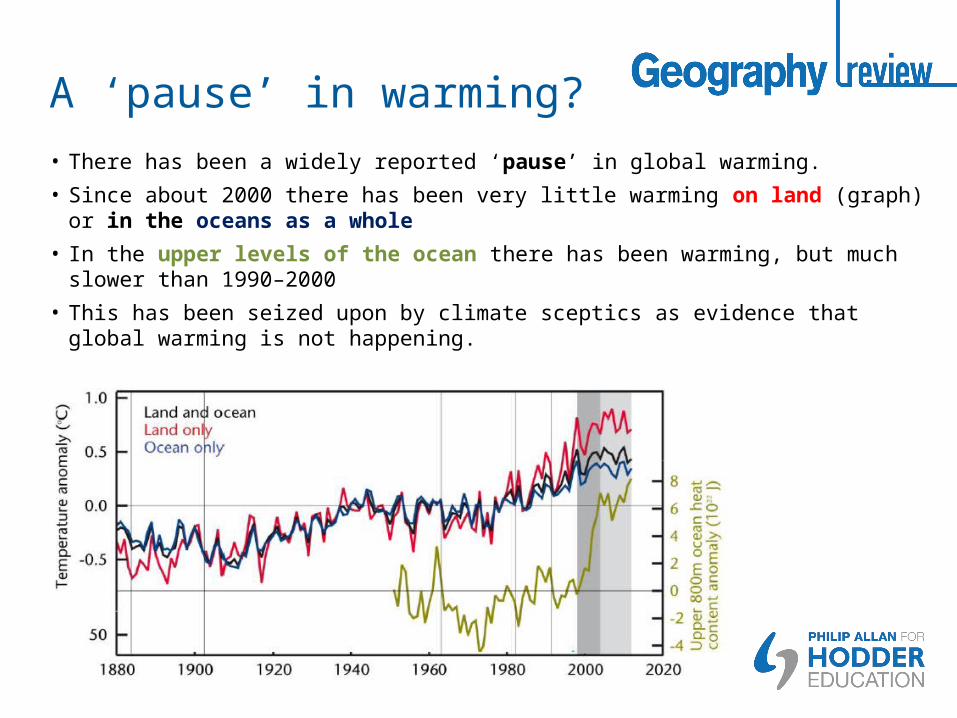
A ‘pause’ in warming?
• There has been a widely reported ‘pause’ in global warming.
• Since about 2000 there has been very little warming on land (graph) or in the oceans as a whole
• In the upper levels of the ocean there has been warming, but much slower than 1990–2000
• This has been seized upon by climate sceptics as evidence that global warming is not happening.
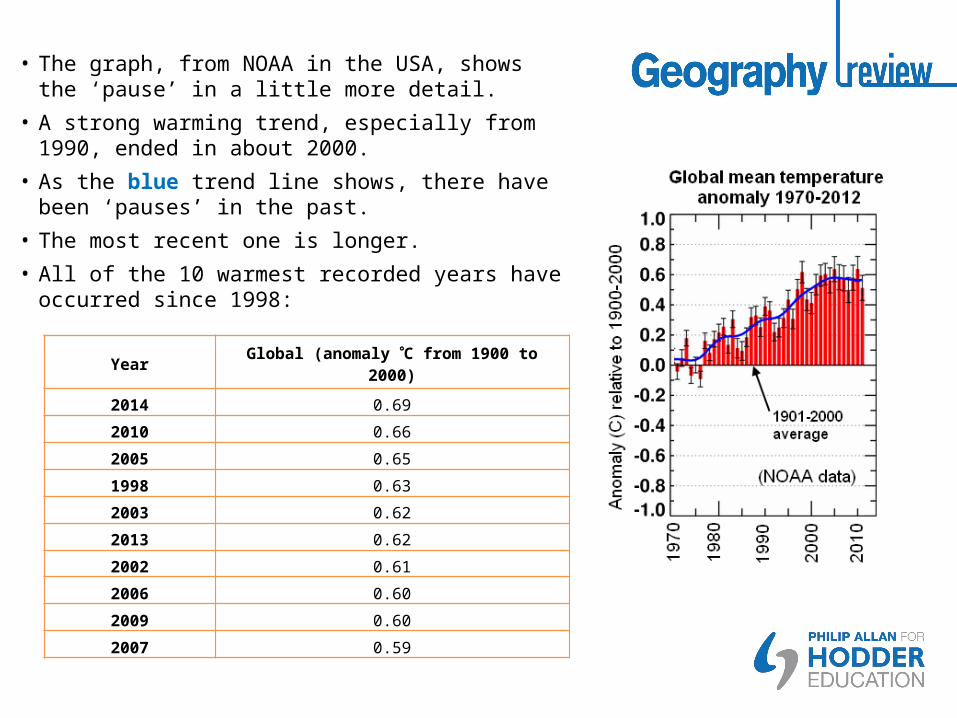
• The graph, from NOAA in the USA, shows the ‘pause’ in a little more detail.
• A strong warming trend, especially from 1990, ended in about 2000.
• As the blue trend line shows, there have been ‘pauses’ in the past.
• The most recent one is longer.
• All of the 10 warmest recorded years have occurred since 1998:
Year Global (anomaly C from 1900 to 2000)
2014 0.69
2010 0.66
2005 0.65
1998 0.63
2003 0.62
2013 0.62
2002 0.61
2006 0.60
2009 0.60
2007 0.59

The cause of the pause?• Lots of potential explanations
• All involve either a decrease in incoming solar radiation or a redistribution of ‘heat’ away from the surface
• The Met Office has estimated that sun-spot cycle changes could account for up to a third of the ‘pause’.
• They cannot account for all of it.
• The most likely candidate is cyclical changes in ocean currents which are removing some heat from the atmosphere into the ocean depths.
• These include El Niño/La Niña in the Pacific, but also the AMO (Atlantic Multi-decadal Oscillation) in the North Atlantic and the Pacific Decadal Oscillation (PDO).
• These long-term changes to ocean circulation are poorly understood.
Cause Evidence
Increase in volcanic activity since 2000?
No evidence of this since 2000
Increase in sulphur dioxide/soot pollution?
Some evidence, but also that this peaked around 2005 so the effect is likely small
Reduction in solar output?
Strong evidence of a ‘weaker’ than normal sun i.e. weaker sun spot cycles since 2000
Although the process is difficult to understand, ocean currents do affect global
temperatures.
1998, the third warmest year on record, was a powerful El Niño year, as was 2010.
2008 and 2011, both quite ‘cool’, were La Niña years.

Arctic sea ice • The Arctic sea-ice minimum occurs in
September each year.
• 2014 was the 6th lowest extent recorded.
• On average Arctic sea extent is 2–3 million km2 less than in the late 1970s.
• Only land-based ice melt affects sea level.
• Ice extent on land and sea affects surface albedo – which in turns leads to feedback warming.
• Some evidence of a pattern, i.e. a major melt year, followed by a partial recovery, then another downward step

Greenland ice sheet
• The Greenland ice sheet continues to melt in the summer months above long-term average rates.
• The map shows that in 2014, some areas experienced surface melting of 100+ days.
• On some days in 2014, close to 40% of the Greenland ice surface was melting (graph)
• Significant melting is happening early, and lasting later in the year compared to the 1980–2010 average.

Philip Allan Publishers © 2015
2015: a critical year
•Passing 400 ppm of carbon dioxide in the atmosphere in 2015 will be a significant milestone
•In Nov–Dec 2015 the latest United Nations Climate Change Conference will take place in Paris.
•The conference aims to reduce emissions to limit the global temperature increase to 2°C above pre-industrial levels.
•The conference objective is to achieve a legally binding and universal agreement on climate, from all the nations of the world.
•This agreement would go beyond the 1997 Kyoto Protocol and involve all countries, not only developed ones.

Philip Allan Publishers © 2015
This resource is part of GEOGRAPHY REVIEW, a magazine written for A-level students by subject experts. To subscribe to the full magazine go to: http://www.hoddereducation.co.uk/geographyreview